On leave from: ]Aix Marseille Univ, Centrale Marseille, Marseille, France
Transient-absorption phases with strong probe and pump pulses
Abstract
The quantum dynamics of a system of Rb atoms, modeled by a -type three-level system interacting with intense probe and pump pulses, are studied. The time-delay-dependent transient-absorption spectrum of an intense probe pulse is thus predicted, when this is preceded or followed by a strong pump pulse. Numerical results are interpreted in terms of an analytical model, which allows us to quantify the oscillating features of the resulting transient-absorption spectra in terms of the atomic populations and phases generated by the intense pulses. Strong-field-induced phases and their influence on the resulting transient-absorption spectra are thereby investigated for different values of pump and probe intensities and frequencies, focusing on the atomic properties which are encoded in the absorption line shapes for positive and negative time delays.
pacs:
32.80.Qk, 32.80.Wr, 42.65.ReI Introduction
Phases represent the essential feature of any wave-like phenomena, lying at the heart of coherence and interference effects in classical and quantum physics. In atoms and molecules, phases define the shape of a wave packet in a superposition of quantum states and hence determine its subsequent time evolution. Manipulating atomic and molecular dynamics with external electromagnetic fields Brif et al. (2010); Tannor (2007); Silberberg (2009); Ohmori (2009), e.g., by using strong femto- or attosecond pulses Dudovich et al. (2001, 2005); Clow et al. (2008); Bayer et al. (2009); Bruner et al. (2010), requires full control of the generated quantum phases. However, traditional spectroscopy methods usually do not provide access to the phase information: for instance, for nonautoionizing bound states, absorption spectra typically consist of Lorentzian lines, with spectral intensities quantifying the atomic populations.
The manipulation of absorption line shapes in transient-absorption-spectroscopy experiments Mathies et al. (1988); Pollard and Mathies (1992); Loh et al. (2007); Goulielmakis et al. (2010); Holler et al. (2011) has been recently identified as a key mechanism to gain access to atomic and molecular phase dynamics. Absorption lines originate from the interference between a probe pulse transmitting through the medium and the field emitted by the system Fano and Cooper (1968). The dipole response of the system and, consequently, the resulting absorption spectrum can be modified by applying an intense pump pulse, preceding or following the probe pulse at variable time delays Wu et al. (2016); Wang et al. (2010); Chen et al. (2012); Chini et al. (2013); Ott et al. (2013); Beck et al. (2014); Kaldun et al. (2014); Meyer et al. (2015); Cheng et al. (2016); Stooß et al. (2017). Thereby, symmetric Lorentzian absorption lines are converted into Fano-like lines, with time-delay-dependent features quantifying the population and phase modification induced by the interaction with the strong pump pulse.
When interpreting spectral line-shape changes in terms of the underlying atomic dynamics, the action of the weak probe pulse is usually assumed as a small, well understood perturbation. The attention is thus focused on the characterization of the action of the pump pulse as a function of its parameters such as, e.g., intensity and laser frequency, and the main line-shape modifications are exclusively attributed to its nonlinear interaction with the system. Recent investigations of transient-absorption spectra in Rb atoms were based on this assumption Liu et al. (2015, 2017).
Here, in contrast, we fully account for the effect of a potentially intense probe pulse, investigating how the population and phase changes induced by both pulses are encoded in its absorption spectrum. On the one hand, this allows us to fully interpret transient-absorption spectra in terms of the pump and probe parameters of interest, without a priori assumptions, which may not correspond to the conditions featured in an experiment and, hence, could lead to an inappropriate or incomplete reconstruction of the strong-field dynamics of the system. On the other hand, by considering cases in which pump and probe pulses exhibit the same intensities, we can highlight the essential differences between spectra where the probe, i.e., measured, pulse either precedes or follows the pump pulse. A proper interpretation of transient-absorption spectra is crucial for the extraction of strong-field dynamical information from these spectra, and the implementation of recently suggested deterministic strong-field quantum-control methods Cavaletto et al. (2017).
We use a -type three-level scheme to model an ensemble of Rb atoms, with the () and () transitions excited by femtosecond pump and probe pulses of variable intensities and time delays. In Sec. II, we present the theoretical model used to describe the evolution of the system and to predict the associated transient-absorption spectra. The numerical results are presented in Sec. III. In particular, time-delay-dependent transient-absorption spectra are shown in Subsec. III.1 for different pump- and probe-pulse intensities. An analytical model based on recently introduced interaction operators Cavaletto et al. (2017) is used in Subsec. III.2 to interpret the numerical results, focusing on the atomic-phase information which can be extracted from the spectra for different intensities and laser frequencies of the pump and probe pulses. Section IV summarizes the results obtained. Atomic units are used throughout unless otherwise stated.
II Theoretical model
II.1 Three-level model and equations of motion
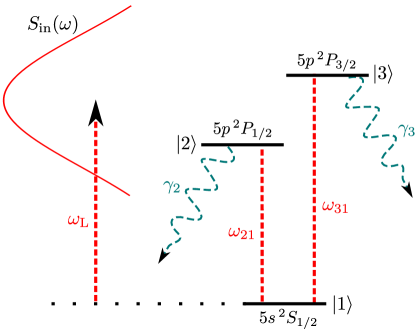
We consider the -type three-level system depicted in Fig. 1, modeling fine-structure-split and transitions in Rb atoms Theodosiou (1984); Netz et al. (2002); Safronova et al. (2004). In particular, we introduce the state
| (1) |
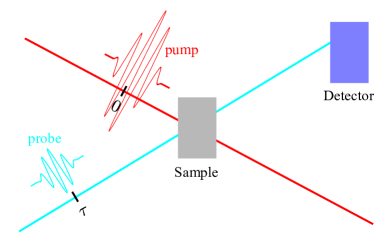
written in terms of the ground state and the excited states and , with associated quantum amplitudes and energies , . The system interacts with a pump pulse, centered on and modeled by the classical field
| (2) |
and a delayed probe pulse, centered on time delay and similarly described as
| (3) |
as shown in Fig. 2. Both pulses are aligned along the polarization vector , have the same frequency , vanishing carrier-envelope phases, and intensities related to the peak field strengths via the fine-structure constant . We model their envelope functions as
| (4) |
with and , defined as the full width at half maximum (FWHM) of Diels and Rudolph (2006). Positive time delays correspond to a typical pump-probe setup, in which the system is first excited by the pump pulse and the resulting dynamics are measured by a probe pulse. In contrast, negative time delays describe experiments in which the dipole response generated by the first arriving probe pulse is subsequently modified by the pump pulse, resulting in an intensity- and time-delay-dependent modulation of the line shape of the absorption spectrum of the transmitted probe pulse.
The linearly polarized pulses excite electric-dipole-(-)allowed transitions , , with equal magnetic quantum number, , and dipole-moment matrix elements . The formulas are written for general complex values of , although these are real and positive for our atomic implementation with Rb atoms, with and Netz et al. (2002). For the intensities considered here, we neglect the presence of higher excited states, to which states and could also be coupled. The total Hamiltonian of the system
| (5) |
then consists of the unperturbed atomic Hamiltonian
| (6) |
and the light-matter interaction Hamiltonian in the rotating-wave approximation Scully and Zubairy (1997); Kiffner et al. (2010); Foot (2005)
| (7) |
In Eq. (6), the complex eigenvalues of are given by the energies and the decay rates , included in order to effectively account for broadening effects in the experiment and defining an effective time scale for the dipole decay Ott et al. (2013); Wu et al. (2016). Transition energies are equal to and Theodosiou (1984); Netz et al. (2002); Safronova et al. (2004), whereas we set and . In Eq. (7), the time- and time-delay-dependent Rabi frequencies have been introduced Scully and Zubairy (1997):
| (8) |
The equations of motion (EOMs) satisfied by the vector
| (9) |
of components given by the amplitudes of the state vector , are determined by the Schrödinger equation
| (10) |
which leads to
| (11) |
The system is assumed to be initially in its ground state , i.e., .
II.2 Transient-absorption spectrum
We solve the EOMs in Eq. (11) in order to simulate experimental optical-density (OD) absorption spectra
| (12) |
where is the spectral intensity of the incoming probe pulse, whereas is that of the transmitted probe pulse, explicitly dependent upon the time delay between pump and probe pulses. For low densities and small medium lengths, where propagation effects can be neglected, the time-delay-dependent absorption spectrum can be calculated in terms of the single-particle dipole response of the system Fano and Cooper (1968)
| (13) | ||||
where
| (14) |
is the negative-frequency complex electric field Diels and Rudolph (2006) and here represents the dipole response of the th transition. In the following calculations, the denominator in Eq. (16) is approximated by
| (15) | ||||
which is valid for an incoming probe pulse much broader than the transition energy between the two excited states, such that its spectral intensity can be approximately considered constant in the frequency range of interest. Spectra associated with different probe-pulse intensities, therefore, need to be properly normalized via the multiplication factor for comparison. Equation (16) can then be rewritten as
| (16) | ||||
with the Fourier transform in the numerator centered around the arrival time of the probe pulse.
For the noncollinear geometry depicted in Fig. 2, fast oscillations of the measured transient-absorption spectrum as a function of time delay cannot be distinguished and are averaged out Liu et al. (2015, 2017). Here, this is taken into account by convolving with a normalized Gaussian function of width , which leads to
| (17) |
II.3 Analytical model in terms of interaction operators
In order to interpret numerical results from the simulation of , we employ the recently introduced strong-field interaction operators to model the effect of a pulse of intensity on the atomic system Cavaletto et al. (2017).
The time evolution of the system from an initial time , given by the solution of the EOMs (11), can be written in terms of the evolution operator ,
| (18) |
In the absence of external fields, this reduces to the free-evolution operator
| (19) |
which describes the dynamics of the unperturbed atomic system. The evolution of the system in the presence of a single pulse of intensity , peak field strength , centered around and with the same envelope and pulse duration we introduced in Sec. II.1, is then associated with the evolution operator , solution of
| (20) | ||||
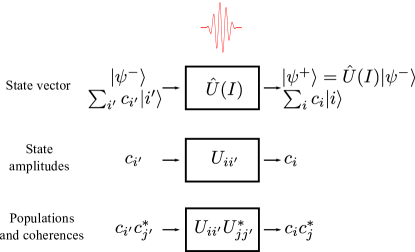
with initial conditions and the identity matrix . In Eq. (20), the single-pulse Rabi frequencies are used. For the scheme discussed in this paper, where pump and probe pulses of equal femtosecond duration are employed, the time information related to the continuous evolution of the system in the presence of the pulse can be difficultly extracted. For our purposes, it is therefore beneficial to focus on the total action of the pulse, i.e., on the state reached by the system at the conclusion of the interaction with a pulse. Equation (20) can be used to calculate and thus connect the initial state with the final state at the end of the pulse:
| (21) |
However, one can also introduce effective initial () and final () states
| (22) |
and thus define the unique, intensity-dependent interaction operators
| (23) |
connecting them,
| (24) |
thus capturing the essential features of the action of the pulse in terms of an effectively instantaneous interaction, as schematically represented in Fig. 3. An analytical model can then be derived to describe the associated , which enables one to quantify how pulse-induced changes in the population and phase of the atomic states are encoded in observable time-delay-dependent spectra.
For a weak and ultrashort pulse of peak field strength and envelope , we can introduce approximated Rabi frequencies
| (25) |
with the Dirac and the pulse areas
| (26) |
The solution of Eq. (20) and the use of the definition (23) allow one to calculate the associated interaction operator which, up to second order, reads
| (27) |
In the following, we interpret intensity-dependent transient-absorption spectra in terms of the matrix elements of pump- and probe-pulse interaction operators for a probe-pump and pump-probe setup. In contrast to previous results Liu et al. (2015); Cavaletto et al. (2017), population and phase changes due to the interaction with intense probe and pump pulses are both explicitly addressed. Since we are interested in atomic phases, and in particular in their connection with the phase of the time-delay-dependent oscillations displayed by transient-absorption spectra for positive and negative time delays, we do not focus on the case of overlapping pulses. We are therefore allowed to develop an analytical model in which the dynamics of the system are described in terms of well defined sequences of free evolution and interaction with a pump or a probe pulse of given intensity.
II.3.1 Probe-pump setup
In a probe-pump setup (), for nonoverlapping pulses and neglecting the details of the continuous atomic dynamics in the presence of a pulse, the time evolution of the system can be written in terms of the state
| (28) | ||||
with and where we have introduced the pump- and probe-pulse interaction operators, and , dependent upon the respective pulse intensities. This can be included into Eq. (16) in order to model the probe-pump spectrum , , in terms of interaction-operator matrix elements. This results in a sum of terms, each of which oscillates as a function of at a given frequency. Thereby, one can recognize, for the frequencies in which we are interested, those terms responsible for fast oscillations of as a function of time delay which would not be exhibited by a spectrum measured in a noncollinear geometry. After neglecting these fast oscillating terms, the time-delay-average probe-pump spectrum reads
| (29) |
II.3.2 Pump-probe setup
When a pump-probe setup is utilized (), for nonoverlapping pulses and neglecting the details of the continuous atomic dynamics in the presence of a pulse, the atomic state can be modeled as
| (30) | ||||
with . By neglecting fast oscillating terms appearing in the resulting single-particle absorption spectrum (16) at frequencies , the time-delay-average pump-probe spectrum can be written in terms of the matrix elements of the interaction operators and as
| (31) |
III Results and discussion
III.1 Transient-absorption spectra for intense probe and pump pulses
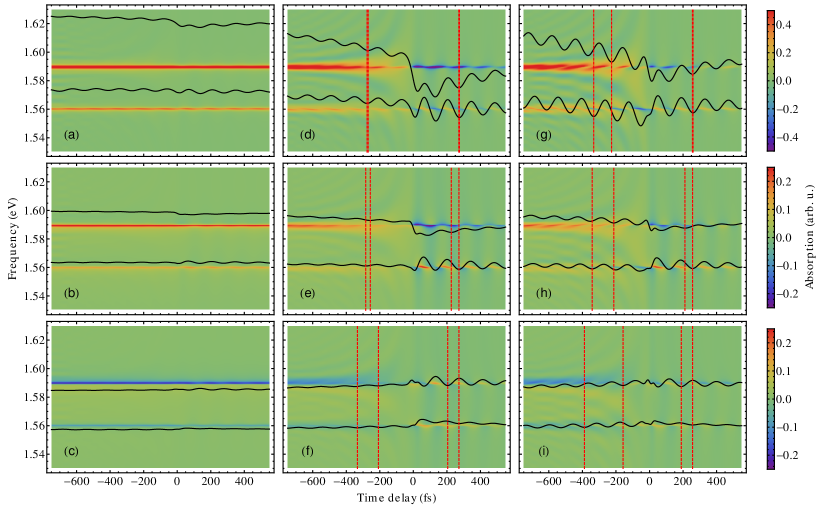
Here, we apply our three-level model to study Rb atoms excited by intense femtosecond probe and pump pulses. Simulated time-delay dependent transient-absorption spectra, obtained by numerically solving Eq. (11) and then using this solution in Eqs. (16) and (17), are displayed in Fig. 4 for representative values of pump- and probe-pulse intensities and for a laser frequency of . For all sets of intensities investigated, two absorption lines can be distinguished, respectively centered on the transition energies and . The shape and amplitude of these lines is modulated as a function of time delay, featuring oscillations whose period of is given by the beating frequency . This is stressed by the black lines, showing the spectra evaluated at the two transition energies and as a function of .
Figures 4(a), 4(b), and 4(c) show transient-absorption spectra for a weak pump intensity of and three different values of probe intensity. Firstly, we notice that the amplitude of the time-delay-dependent oscillations displayed by the spectra is very small for these weak values of the pump intensity. The shape and amplitude of the absorption lines remain almost completely unchanged throughout the range of displayed, with no significant features distinguishing between positive and negative time delays. By modifying the probe intensity, we notice a variation in the strength of the lines, going from absorption for a weak intensity of to emission at higher values of intensity.
When higher values of pump-pulse intensity are employed, clear time-delay-dependent features can be distinguished. The amplitude and the phase of these oscillations in varies differently, for positive and negative time delays, as a function of pump and probe intensities. Figures 4(a), 4(d), and 4(g) show spectra evaluated for a weak probe intensity of and increasing values of . For intermediate values of the pump-pulse intensity () and for both positive and negative time delays, the phase of the exhibited time-delay-dependent spectra is the same for the two transition energies, as evinced by the red dashed lines which highlight the position of the minima of and . However, as already discussed in Ref. Liu et al. (2015), a shift can be recognized for a higher pump intensity of : while the spectra evaluated at and shift in opposite directions for as a clear and distinguishable signature of the onset of strong-field effects, a common shift in the same direction takes place at when the pump-pulse intensity is increased.
Recognizing these strong-field-induced features and understanding them in terms of intensity-dependent atomic phases becomes more complex when a probe pulse is used which is not sufficiently weak. This appears clearly when one compares Figs. 4(d), 4(e), and 4(f), where results are shown for an intermediately strong pump pulse and different values of the probe intensity. Both at positive and negative time delays, absorption lines evaluated at and feature a shift in opposite directions, which becomes larger at high probe intensities. Similarly, spectra displayed in Figs. 4(g), 4(h), and 4(i) for a pump intensity of show that a probe-pulse-induced shift of the spectra evaluated at and arises for growing values of : at negative time delays, this enlarges the already existent shift due to the strong pump pulse; for positive time delays, where the increase in causes an aligned, common shift of and , the presence of an intense probe pulse is reflected in additional shifts, analogous to those already recognized for .
It should be noticed that the spectra in Figs. 4(a), 4(e), and 4(i) are calculated for equal pump- and probe-pulse intensities. The dynamics of the system are, therefore, perfectly symmetric with respect to , and the system features the same time evolution when equally delayed pump and probe pulses are used, independent of their arriving order. Nevertheless, the spectra exhibited in the above listed figures are clearly not symmetric with respect to , and different amplitudes and phases of the time-delay-dependent features of can be recognized at or , in spite of identical underlying dynamics. This can be understood by noticing that the spectrum arises from the interference between the electric dipole response of the atomic system with the probe pulse: even when the quantum dynamics are identical, the spectrum still reveals how these influence the first-(second-)arriving probe pulse for (). This is also evident from the definition of the absorption spectrum (16), where the Fourier transform is always centered on the central time of the probe pulse, and then from the analytic models in Eqs. (29) and (31), respectively describing time-delay-averaged probe-pump and pump-probe spectra from a noncollinear geometry. Even when identical pump and probe pulses are used (), the spectra evaluated at positive and negative time delays are determined by different interaction-operator matrix elements and hence differ.
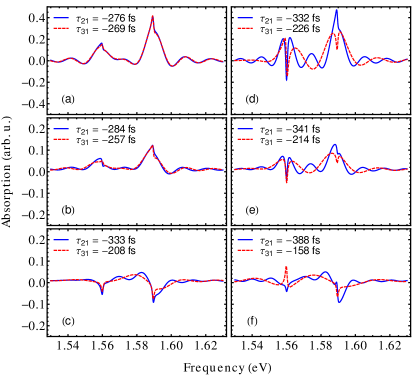
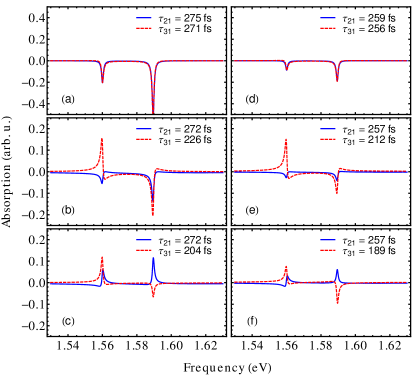
In the previous discussion we have focused on the time-delay-dependent properties of the spectra , evaluated at the transition energies . However, the identification of and may not be straightforward experimentally, affecting the properties of the observed time-delay-dependent features and the quantification of the associated phases. In order to better discuss this point and describe the line-shape changes ensuing from the presence of intense pump and probe pulses, in Figs. 5 and 6, for a probe-pump and pump-probe setup, respectively, we present transient-absorption spectra , , evaluated as a function of frequency for fixed values of the time delay, and . Here, the time delay () is the one for which [] has a local minimum, as identified in Fig. 4 by the red, dashed lines. The pictures show that the identified local-minimum points are not necessarily associated with emission peaks pointing downwards. Furthermore, for negative time delays, where additional frequency modulations appear as shown in Figs. 4 and 5, one has to disentangle the behavior of the peaks centered on from the remaining modulations appearing as a function of frequency. Nevertheless, all panels confirm that it is possible to isolate the time-delay-dependent behavior of this central peak and, thereby, identify the particular time delay at which this is minimal.
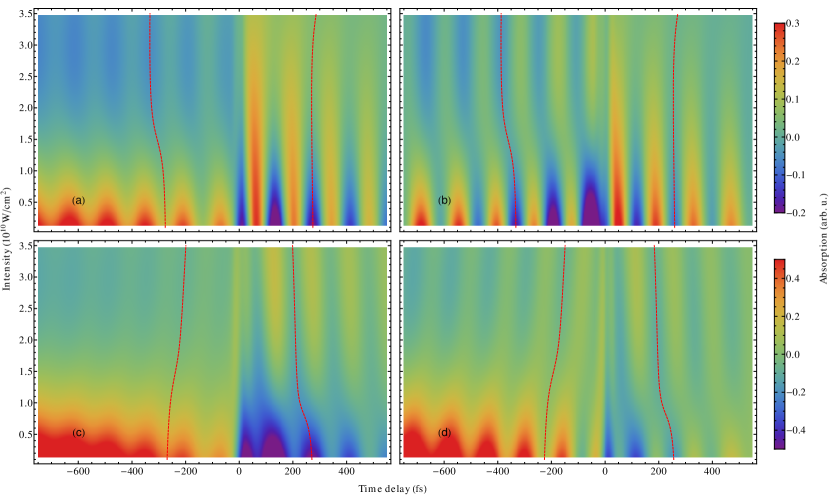
Encouraged by the results displayed in Figs. 5 and 6, in the following we focus on and the corresponding time-delay-dependent oscillations in order to draw conclusions about strong-field-induced atomic phases. Figure 7 shows the amplitude of the numerically calculated spectra and as a function of probe-pulse intensity for two different values of . The shifts in the phase of the time-delay-dependent spectra is here clearly apparent. For or , the effect of the intense pump and probe pulses appears in the spectrum as independent pump- and probe-induced phase shifts. In the following, in order to investigate this point further and identify how atomic phase changes are encoded in transient-absorption spectra, we interpret our results in terms of the interaction operators introduced in Subsec. II.3.
III.2 Interpretation of pump- and probe-pulse-induced phases in terms of interaction-operator matrix elements
Here, we use Eqs. (29) and (31) in order to interpret the numerically calculated transient-absorption spectra presented in Subsec. III.1 in terms of interaction-operator matrix elements. In particular, we focus on the phase of the time-delay-dependent oscillations exhibited by and [Fig. 7], and show how these can be understood via the strong-field-induced atomic phases quantified in and . For both a probe-pump and a pump-probe setup, we develop analytical interpretation models, calculate and with Eqs. (20) and (23), and then use these interpretation models to understand the phase features displayed by the transient-absorption spectra in Figs. 4 and 7. Finally, we further investigate the dependence of the phases extractable from transient-absorption spectra upon the laser frequency of the pump and probe pulses.
III.2.1 Probe-pump setup
Firstly, we focus on the probe-pump interpretation model given by Eq. (29), aiming at better understanding the properties of the spectrum evaluated at . For interpretation purposes, since , we are allowed to neglect in first approximation the term proportional to , with , , , thus obtaining
| (32) |
The only term which displays oscillations as a function of is given by
| (33) |
with
| (34) | ||||
and where we have used explicitly the fact that, for our atomic implementation with Rb atoms, the projections of the dipole-moment matrix elements along the pulse polarization axis are real. We can more explicitly write
| (35) |
and
| (36) |
With
| (37) | ||||
and the phases
| (38) | ||||
this reduces to
| (39) |
and
| (40) |
The intensity-dependent position of the minima of for , shown in Fig. 7 by the red dashed lines at negative time delays, can hence be quantified via Eqs. (39) and (40) in terms of and . The sine functions appearing therein have local minima, respectively centered around
| (41) | |||||
with the additive offset . For real, positive dipole-moment matrix elements , and hence real positive pulse areas , the intensity-dependent variables and can be explicitly written in the case of weak pulses via Eq. (27) as
| (42) | ||||
along with the associated phases
| (43) | ||||
For low intensities, the effect of the probe pulse is linearly proportional to the pulse areas and, therefore, of first order in the amplitude of the electric field, whereas the action of the pump pulse depends on the product of and is hence of second order. This explains the small, almost vanishing amplitude of the time-delay-dependent oscillations displayed for by the transient-absorption spectra in Figs. 4(a), 4(b), and 4(c), for a small pump-pulse intensity of .
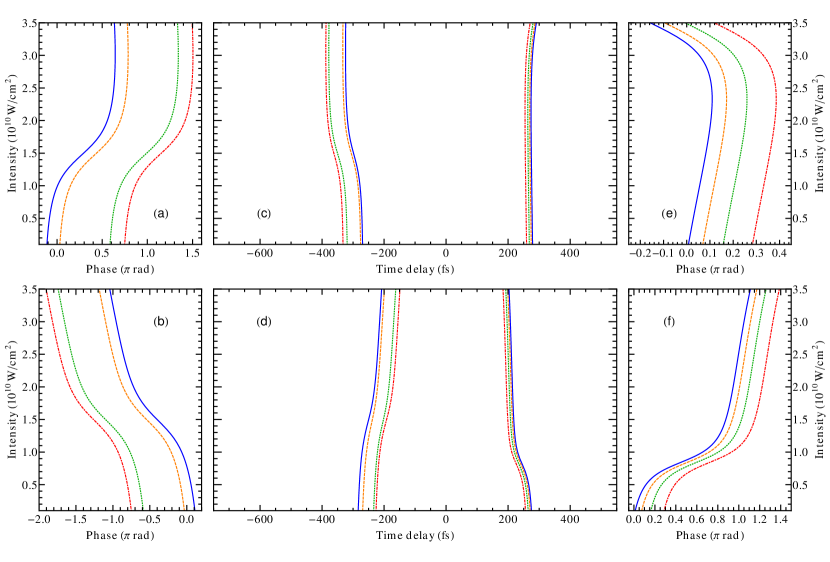
In Figs. 8(a) and 8(b), the total phases and [Eqs. (38) and (43) after numerical calculation of and via Eqs. (20) and (23)] are exhibited, as a function of and for a discrete set of values of . The very good agreement between the intensity dependence of these phases and the shift displayed by the time-delay-dependent features of and [Fig. 7 and Figs. 8(c) and 8(d) at negative time delays] confirms the validity of our analytical interpretation model and in particular of Eq. (41). The shift in the phases [Figs. 8(a) and 8(b)] is reflected by an oppositely directed shift in the local-minimum points [Figs. 8(c) and 8(d)] as a function of and , as expected from the minus sign in Eq. (41).
In order to understand the physics underlying the phase shifts appearing in the spectrum, we can use the schematic illustration of in Fig. 3 to clarify the meaning of the terms appearing in Eqs. (37) and (38). The associated terms , , are the coherences (in amplitude and phase) generated by the first-arriving probe pulse acting on the ground state. The shift displayed by is therefore related to the phase of these strong-field-induced coherences. The different sign appearing in the definition of and also explains why the time-delay-dependent oscillations of and shift in opposite directions for increasing probe-pulse intensities [Fig. 8(c) and 8(d)].
The second-arriving intense pump pulse nonlinearly modifies an already existent superposition of excited states. The shifts and in the oscillating features of and , respectively, quantify the changes in the atomic phases induced by the pump pulse. This can be recognized via inspection of the associated interaction-operator matrix elements, , [Eqs. (37) and (38)], which describe how the pump pulse transforms an initial coherence between ground state and excited state into a final coherence between ground state and excited state (see also the schematic illustration in Fig. 3). The ensuing phase change determines the shift appearing in the oscillating features of the transient-absorption spectrum. Also in this case, the shift in opposite directions displayed by and for rising values of [Fig. 8(c) and 8(d)] is a consequence of the opposite sign with which and are related to the interaction-operator matrix elements [Eq. (38)].
III.2.2 Pump-probe setup
Here, we focus on the positive-time-delay part of the spectrum, and use the associated interpretation model given by Eq. (31) in order to better understand the properties of the spectra evaluated at . For this purpose, as already performed in the previous part, we can neglect terms given by in Eq. (31), and thus identify those contributions which are responsible for the oscillations exhibited by the spectrum as a function of :
| (44) |
Also in this case, we have used explicitly the fact that the dipole-moment matrix elements are real. By introducing the intensity-dependent pump and probe variables
| (45) | ||||
we can write Eq. (44) as
| (46) |
and observe that the pump pulse equally acts on both terms of the above sums, resulting in a phase shift
| (47) |
Furthermore, since , we have that , and hence
| (48) |
By further introducing the phases
| (49) |
the spectrum can be written as
| (50) |
This implies that the intensity-dependent positions of the minima of , shown in Fig. 7 by the red dashed lines at positive time delays, can be quantified via Eq. (50) in terms of and . The sine functions appearing therein have local minima respectively centered around
| for , , | (51) | ||||
| for , , |
with the additive offset . For real, positive dipole-moment matrix elements , and hence real positive pulse areas , the intensity-dependent variables and can be explicitly written in the case of weak pulses via Eq. (27) as
| (52) | ||||
along with the associated phases
| (53) | ||||
Also in a pump-probe setup, the effect of a weak probe pulse is linearly proportional to the pulse areas and, therefore, of first order in the amplitude of the electric field. The action of a weak pump pulse depends on the product of and is hence of second order. Also in this case, this explains the small, almost vanishing amplitude of the time-delay-dependent oscillations displayed for by the transient-absorption spectra in Figs. 4(a), 4(b), and 4(c), for a small pump-pulse intensity of .
Figures 8(e) and 8(f) display the total phases and [Eqs. (47), (49), and (53), after numerical calculation of and via Eqs. (20) and (23)] as a function of and for different values of the pump-pulse intensity . The dependence of these phases on pulse intensities matches that exhibited by the time-delay-dependent features of and in Fig. 7 and in Figs. 8(c) and 8(d) at positive time delays, confirming the validity of Eq. (51) for the interpretation of the phase of the oscillating features displayed by transient-absorption spectra. Also in this case, the minus sign in Eq. (51) results in a shift in the local-minimum points in Figs. 8(c) and 8(d) in a direction which is opposite to the change in phase exhibited by Figs. 8(e) and 8(f).
In contrast to the previously discussed probe-pump case, here, the first arriving pump pulse equally influences the shift in the spectra evaluated at and . This could already be observed in Figs. 4 and 7, and is now confirmed by Eq. (51). The same phase equally affects both spectra, with a common shift which quantifies the phase difference between excited states generated by the first-arriving pump pulse. This is apparent by the definition of [Eq. (47)] and of the associated term [Eq. (45)], which represents the coherence between excited states and resulting from the interaction with the pump pulse, as schematically illustrated in Fig. 3.
Quantifying the shift in the spectra induced by the second-arriving probe pulse is more complex. In a pump-probe setup, the probe pulse modifies the state excited by the first-arriving pump pulse, inducing atomic phase changes which are encoded in the spectrum. However, in this case, the phases [Eq. (49)] of the time-delay-dependent oscillations of are due to a sum of terms [ from Eq. (45)]. As a result, the phases , and hence the corresponding phase shifts featured by the spectra, are not only determined by the phases of the corresponding interaction-operator matrix elements ( and ), but also by their amplitudes. The definition of the interaction operator allows one to see that and describe how the probe pulse transforms an initial coherence between the excited states and into a coherence between ground state and excited state (see also the schematic illustration in Fig. 3). Amplitude and phase of these interaction-operator matrix elements both enter the definition of and are hence encoded in intensity- and time-delay-dependent transient-absorption spectra.
III.2.3 Dependence on laser frequency
Since we confirmed in the previous subsections the validity of Eqs. (41) and (51) for the interpretation of transient-absorption spectra in terms of pump- and probe-pulse-generated phases, here we focus on the previously introduced phases , , , and , and investigate their dependence upon the frequency of the laser. Also in this case, this is achieved by using Eqs. (38), (43), (47), (49), and (53), after having numerically calculated and via Eqs. (20) and (23). However, while we assumed in the previous sections that both pump and probe pulses were characterized by a laser frequency , we display here intensity-dependent results for 5 discrete values of laser frequency, equally spaced between and .
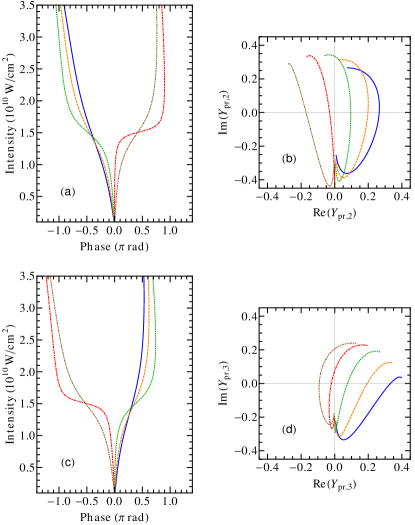
In Figs. 9 and 10, we focus on a probe-pump setup and display the phases induced by the probe and pump pulses, respectively, as a function of their intensity and for different laser frequencies. Figure 9(a) shows the phase which determines the probe-intensity-dependent shift featured by the absorption spectra evaluated at . These phases are related to the argument of [Fig. 9(b) and Eq. (37)], which represents the coherence between states and generated by the first-arriving probe pulse. At low intensities, all curves are characterized by negative, purely imaginary values of , in agreement with Eq. (42). The laser frequency influences the path followed by at increasing intensities, and whether this will move towards regions characterized by positive or negative real parts. This influences the behavior of the phases in Fig. 9(a) as well, deciding whether the shift is towards values of larger or smaller than the weak-limit value. Similarly, the behavior of displayed in Fig. 9(d) determines the intensity-dependent shift featured by the absorption spectra evaluated at . Here, is the coherence between states and generated by the first-arriving probe pulse. Also in this case, weak intensities correspond to negative, purely imaginary values of , agreeing with Eq. (37). A different dependence of on probe-pulse intensities is featured for different values of the laser frequency, analogously influencing the intensity-dependent shift exhibited by Fig. 9(c).
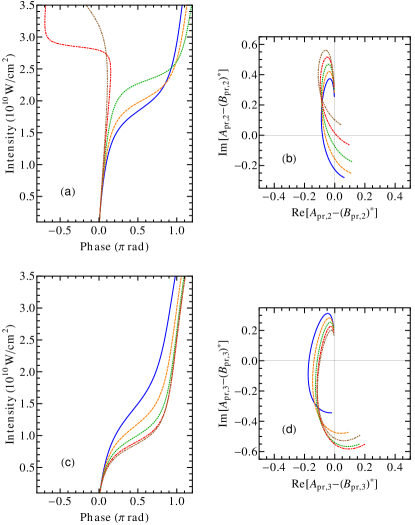
Figure 10 shows the additional phase shift owing to a strong pump pulse as a function of its intensity. The (amplitude and phase) changes resulting from the interaction with the pump pulse are encoded in the complex numbers and , whose dependence on intensity and laser frequency is shown in Figs. 10(b) and 10(d), respectively. As noticed in Eq. (42), are of second order in the pulse area for weak values of the pulse intensity. As a result, for small pulse intensities, and tend to vanishing values for all considered laser frequencies. The associated atomic-phase change results in the phase shifts displayed in Figs. 10(a) and 10(c). For all considered laser frequencies, and evolve in opposite directions for increasing values of the pump-pulse intensity.
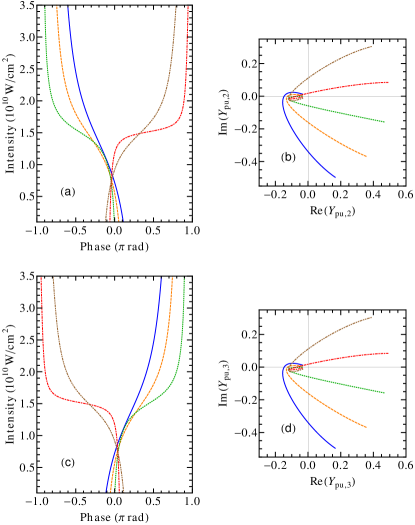
In Figs. 11 and 12 we consider a pump-probe setup and focus on the phases induced by probe and pump pulses, respectively, as a function of their intensity and for different laser frequencies. The phase , defining the intensity-dependent shift of , is shown in Fig. 11(a). Also in this case, the displayed dependence upon intensity and laser frequency can be better understood by referring to the complex numbers [Eq. (45)], displayed in Fig. 11(b). As discussed previously, these complex numbers are related to the transformation induced by the second arriving-probe pulse, quantifying how an initial coherence between states and is transformed into coherence between and . At low intensities, all curves tend to positive, purely imaginary values of , in agreement with Eq. (52). The path followed by at increasing intensities depends on the laser frequency, and reveals interesting features about the intensity dependence of shown in Fig. 11(a). For example, one can notice how relatively similar values of , such as those displayed by the green, red, and brown curves in Fig. 11(b), can lead to a very different behavior of the corresponding phases [Fig. 11(a)]. This is due to the fact that the amplitude of is very close to vanish for all three considered curves. A small change in the actually followed path can therefore lead to a completely oppositely directed shift in the corresponding phase. The phases shown in Fig. 11(c), determining the intensity-dependent shift of , display a more regular dependence upon intensity and laser frequency. This is essentially related to the fact that the corresponding complex numbers do not approach vanishing values for the range of intensities and laser frequencies considered, as exhibited by Fig. 11(d). The complex numbers [Eq. (45)] quantify how an initial coherence between states and is transformed into coherence between and and, at low intensities, tend to positive, purely imaginary values [Fig. 11(d)], in agreement with Eq. (52).
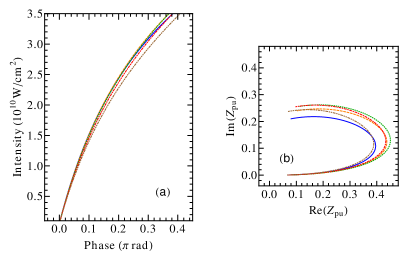
Finally, Fig. 12 shows the pump-pulse-induced phase shift which equally affects the oscillations of and , as described in Eq. (51) for positive time delays. The associated complex numbers , quantifying the coherence between excited states generated by the first-arriving pump pulse, are exhibited in Fig. 12(b), displaying a small dependence on the laser frequency . This is reflected in the associated phases, shown in Fig. 12(a). We notice that tends to 0 for small intensities, being of second order in the pulse area as predicted by Eq. (52). For increasing values of the intensity, however, we can see that is characterized by values very close to the real axis, in agreement with the prediction of a vanishing weak-limit phase [Eq. (53)].
IV Conclusion
In conclusion, we have investigated the interaction of a sample of Rb atoms, modeled as a -type three-level system, with intense probe and pump pulses separated by a positive or negative time delay in a transient-absorption-spectroscopy setup. The three-level model was used to describe the evolution of the atomic system and, thereby, to numerically simulate experimental time-delay- and pulse-intensity-dependent spectra. We developed an analytical interpretation model, which we used to connect the time-delay-dependent oscillations featured by the spectra with the pump- and probe-pulse-induced quantum phases of the atomic system. Thereby, we showed which strong-field information on atomic phases can be extracted from transient-absorption spectra, when intense probe and pump pulses are employed. We also studied the dependence of strong-field-generated atomic phases on the frequency of the utilized laser pulses.
Further studies could include a more thorough analytical and theoretical description of the frequency dependence of the phases, as well as an atomic-system description going beyond the three-level model employed here. For high densities or long media, it could be important to further investigate how propagation effects can be included in our interpretation models.
Acknowledgements.
The authors acknowledge valuable discussions with Zoltán Harman, Christoph H. Keitel, and Thomas Pfeifer. The work of V. B. has been carried out thanks to the support of the A*MIDEX grant (No. ANR-11-IDEX-0001-02) funded by the French Government <<Investissements d’Avenir>> program.References
- Brif et al. (2010) C. Brif, R. Chakrabarti, and H. Rabitz, “Control of quantum phenomena: past, present and future,” New J. Phys. 12, 075008 (2010).
- Tannor (2007) D. J. Tannor, Introduction to Quantum Mechanics: A Time-dependent Perspective (University Science Books, Sausalito, California, 2007).
- Silberberg (2009) Y. Silberberg, “Quantum coherent control for nonlinear spectroscopy and microscopy,” Annu. Rev. Phys. Chem. 60, 277–292 (2009).
- Ohmori (2009) K. Ohmori, “Wave-packet and coherent control dynamics,” Annu. Rev. Phys. Chem. 60, 487–511 (2009).
- Dudovich et al. (2001) N. Dudovich, B. Dayan, S. M. Gallagher Faeder, and Y. Silberberg, “Transform-limited pulses are not optimal for resonant multiphoton transitions,” Phys. Rev. Lett. 86, 47–50 (2001).
- Dudovich et al. (2005) N. Dudovich, T. Polack, A. Pe’er, and Y. Silberberg, “Simple route to strong-field coherent control,” Phys. Rev. Lett. 94, 083002 (2005).
- Clow et al. (2008) S. D. Clow, C. Trallero-Herrero, T. Bergeman, and T. Weinacht, “Strong field multiphoton inversion of a three-level system using shaped ultrafast laser pulses,” Phys. Rev. Lett. 100, 233603 (2008).
- Bayer et al. (2009) T. Bayer, M. Wollenhaupt, C. Sarpe-Tudoran, and T. Baumert, “Robust photon locking,” Phys. Rev. Lett. 102, 023004 (2009).
- Bruner et al. (2010) B. D. Bruner, H. Suchowski, N. V. Vitanov, and Y. Silberberg, “Strong-field spatiotemporal ultrafast coherent control in three-level atoms,” Phys. Rev. A 81, 063410 (2010).
- Mathies et al. (1988) R. A. Mathies, C. H. Brito Cruz, W. T. Pollard, and C. V. Shank, “Direct observation of the femtosecond excited-state cis-trans isomerization in bacteriorhodopsin,” Science 240, 777–779 (1988).
- Pollard and Mathies (1992) W. T. Pollard and R. A. Mathies, “Analysis of femtosecond dynamic absorption spectra of nonstationary states,” Annu. Rev. Phys. Chem. 43, 497–523 (1992).
- Loh et al. (2007) Z.-H. Loh, M. Khalil, R. E. Correa, R. Santra, C. Buth, and S. R. Leone, “Quantum state-resolved probing of strong-field-ionized xenon atoms using femtosecond high-order harmonic transient absorption spectroscopy,” Phys. Rev. Lett. 98, 143601 (2007).
- Goulielmakis et al. (2010) E. Goulielmakis, Z.-H. Loh, A. Wirth, R. Santra, N. Rohringer, V. S. Yakovlev, S. Zherebtsov, T. Pfeifer, A. M. Azzeer, M. F. Kling, S. R. Leone, and F. Krausz, “Real-time observation of valence electron motion,” Nature (London) 466, 739–743 (2010).
- Holler et al. (2011) M. Holler, F. Schapper, L. Gallmann, and U. Keller, “Attosecond electron wave-packet interference observed by transient absorption,” Phys. Rev. Lett. 106, 123601 (2011).
- Fano and Cooper (1968) U. Fano and J. W. Cooper, “Spectral distribution of atomic oscillator strengths,” Rev. Mod. Phys. 40, 441–507 (1968).
- Wu et al. (2016) M. Wu, S. Chen, S. Camp, K. J. Schafer, and M. B. Gaarde, “Theory of strong-field attosecond transient absorption,” J. Phys. B 49, 062003 (2016).
- Wang et al. (2010) H. Wang, M. Chini, S. Chen, C.-H. Zhang, F. He, Y. Cheng, Y. Wu, U. Thumm, and Z. Chang, “Attosecond time-resolved autoionization of argon,” Phys. Rev. Lett. 105, 143002 (2010).
- Chen et al. (2012) S. Chen, M. J. Bell, A. R. Beck, H. Mashiko, M. Wu, A. N. Pfeiffer, M. B. Gaarde, D. M. Neumark, S. R. Leone, and K. J. Schafer, “Light-induced states in attosecond transient absorption spectra of laser-dressed helium,” Phys. Rev. A 86, 063408 (2012).
- Chini et al. (2013) M. Chini, X. Wang, Y. Cheng, Y. Wu, D. Zhao, D. A. Telnov, S.-I. Chu, and Z. Chang, “Sub-cycle oscillations in virtual states brought to light,” Sci. Rep. 3, 1105– (2013).
- Ott et al. (2013) C. Ott, A. Kaldun, P. Raith, K. Meyer, M. Laux, J. Evers, C. H. Keitel, C. H. Greene, and T. Pfeifer, “Lorentz meets Fano in spectral line shapes: A universal phase and its laser control,” Science 340, 716–720 (2013).
- Beck et al. (2014) A. R. Beck, B. Bernhardt, E. R. Warrick, M. Wu, S. Chen, M. B. Gaarde, K. J. Schafer, D. M. Neumark, and S. R. Leone, “Attosecond transient absorption probing of electronic superpositions of bound states in neon: detection of quantum beats,” New J. Phys. 16, 113016 (2014).
- Kaldun et al. (2014) A. Kaldun, C. Ott, A. Blättermann, M. Laux, K. Meyer, T. Ding, A. Fischer, and T. Pfeifer, “Extracting phase and amplitude modifications of laser-coupled Fano resonances,” Phys. Rev. Lett. 112, 103001 (2014).
- Meyer et al. (2015) K. Meyer, Z. Liu, N. Müller, J.-M. Mewes, A. Dreuw, T. Buckup, M. Motzkus, and T. Pfeifer, “Signatures and control of strong-field dynamics in a complex system,” Proc. Natl. Acad. Sci. U.S.A. 112, 15613–15618 (2015).
- Cheng et al. (2016) Y. Cheng, M. Chini, X. Wang, A. González-Castrillo, A. Palacios, L. Argenti, F. Martín, and Z. Chang, “Reconstruction of an excited-state molecular wave packet with attosecond transient absorption spectroscopy,” Phys. Rev. A 94, 023403 (2016).
- Stooß et al. (2017) V. Stooß, S. M. Cavaletto, A. Blättermann, P. Birk, C. H. Keitel, C. Ott, and T. Pfeifer, manuscript in preparation (2017).
- Liu et al. (2015) Z. Liu, S. M. Cavaletto, C. Ott, K. Meyer, Y. Mi, Z. Harman, C. H. Keitel, and T. Pfeifer, “Phase reconstruction of strong-field excited systems by transient-absorption spectroscopy,” Phys. Rev. Lett. 115, 033003 (2015).
- Liu et al. (2017) Z. Liu, Q. Wang, J. Ding, S. M. Cavaletto, T. Pfeifer, and B. Hu, “Observation and quantification of the quantum dynamics of a strong-field excited multi-level system,” Sci. Rep. 7, 39993– (2017).
- Cavaletto et al. (2017) S. M. Cavaletto, Z. Harman, T. Pfeifer, and C. H. Keitel, “Deterministic strong-field quantum control,” Phys. Rev. A, accepted for publication (2017), arXiv preprint arXiv:1607.04570.
- Theodosiou (1984) C. E. Theodosiou, “Lifetimes of alkali-metal—atom Rydberg states,” Phys. Rev. A 30, 2881–2909 (1984).
- Netz et al. (2002) R. Netz, T. Feurer, G. Roberts, and R. Sauerbrey, “Coherent population dynamics of a three-level atom in spacetime,” Phys. Rev. A 65, 043406 (2002).
- Safronova et al. (2004) M. S. Safronova, C. J. Williams, and C. W. Clark, “Relativistic many-body calculations of electric-dipole matrix elements, lifetimes, and polarizabilities in rubidium,” Phys. Rev. A 69, 022509 (2004).
- Diels and Rudolph (2006) J. C. Diels and W. Rudolph, Ultrashort laser pulse phenomena: fundamentals, techniques, and applications on a femtosecond time scale (Academic Press, Burlington, MA, 2006).
- Scully and Zubairy (1997) M. O. Scully and M. S. Zubairy, Quantum Optics (Cambridge University Press, Cambridge, 1997).
- Kiffner et al. (2010) M. Kiffner, M. Macovei, J. Evers, and C. H. Keitel, “Vacuum-induced processes in multilevel atoms,” in Prog. Opt., Vol. 55, edited by E. Wolf (Elsevier, Amsterdam, 2010) Chap. 3, p. 85.
- Foot (2005) C. J. Foot, Atomic Physics (Oxford University Press, Oxford, 2005).