EMCD with an electron vortex filter: Limitations and possibilities
Abstract
We discuss the feasibility of detecting spin polarized electronic transitions with a vortex filter. This approach does not rely on the principal condition of the standard energy loss magnetic chiral dichroism (EMCD) technique, the precise alignment of the crystal, and thus paves the way for the application of EMCD to new classes of materials and problems. The dichroic signal strength in the L2,3-edge of ferromagnetic cobalt is estimated on theoretical grounds. It is shown that magnetic dichroism can, in principle, be detected. However, as an experimental test shows, count rates are currently too low under standard conditions.
1 Introduction
The discovery in 2006 that magnetic chiral dichroism can be observed in the transmission electron microscope (TEM) [1] provided an unexpected alternative to X-ray circular dichroism (XMCD) in the synchrotron. Energy-loss magnetic chiral dichroism (EMCD)111Sometimes also called electron magnetic chiral dichroism. Properly speaking, this is incorrect because it is not the electron but the energy loss signal that shows dichroism. has seen tremendous progress since then [2, 3, 4], achieving nanometre resolution [5], and even sub-lattice resolution [6, 7].
The discovery of electron vortex beams (EVBs) [8, 9] has spurred efforts to use them for EMCD because of their intrinsic chirality. In spite of much progress in the production and application of vortex beams [10, 11, 6, 12, 13, 14, 15], it soon became clear that atom-sized vortices incident on the specimen are needed for EMCD experiments [16, 17, 18]. Attempts to produce such beams and to use them for EMCD measurements did not show an effect so far [19]. Nevertheless, faint atomic resolution EMCD signals have been shown without the need for atom-sized EVBs using intelligent shaping of the incident wavefront with a Cs corrector instead [20, 21].
The fact that orbital angular momentum (OAM) can be transfered to the probing electron when it excites electronic transitions to spin polarized final states in the sample manifests itself in a vortical structure of the inelastically scattered probe electron. The latter could be detected by a holographic mask after the specimen. Using a fork mask as chiral filter is already established in optics. [22, 23, 24]. This ansatz opens up the possibility to measure magnetic properties of amorphous materials (or multiphase materials including both crystalline and amorphous magnetic phases [25]), since the specimen no longer needs to act as a crystal beam splitter itself. Also crystalline specimens could benefit from using the vortex filter setup and its inherent breaking of the Bragg limitation, when, for example, substrate reflections overlap with the two EMCD measurement positions which would diminish the EMCD signal strength.
2 Principle
Dealing with transition metals, dichroism measurements typically involve 2p-core to d-valence excitations at the L2,3 ionization edges. The L2,3-edges are used, due to their strong spin-orbit interaction in the initial state. Besides their dichroic signal is an order of magnitude higher compared to using K-edges, which were originally used in X-ray magnetic circular dichroism measurements to show the dichroic effect [26, 9, 27]. The most dominant contribution to the ionisation edges are electric dipole-allowed transitions. Higher multi-pole transitions show low transition amplitudes contributing less than at scattering angles of relevant in electron energy loss spectrometry (EELS) [28, 29, 30].
In case of an L-edge dipole-allowed transition which changes the magnetic quantum number of an atom by , an incident plane wave electron transforms into an outgoing wave [31]
| (1) |
where is the azimuthal angle, and
| (2) |
with the matrix element of the spherical Bessel function between the initial and final radial atomic wave functions, and . Here, is the transverse scattering vector that relates to the experimental scattering angle as , and is the scalar difference of linear momenta of the probe electron before and after the inelastic interaction, also known as the characteristic momentum transfer in EELS [32]. The characteristic scattering angle is given by , with being the threshold energy of the dipole-allowed L-edge and the primary beam energy.

The dichroic signal in the diffraction plane (DP) can readily be calculated via Fourier transforming Eq. 1. According to a theorem for the Fourier-Bessel transform of a function of azimuthal variation [33], one has
| (3) |
The outgoing electron in the DP still carries topological charge , showing that the wave function is topologically protected. The radial intensity profiles for the possible transitions with and their sum , which represents the Lorentz profile for non-magnetic isotropic transitions, for the Co L3-edge are shown in Fig. 1. Note that in Fig. 1, as well as in all the following simulation results, the parameters used have been adopted to the proof-of-principle experiment given in Sec. 3.
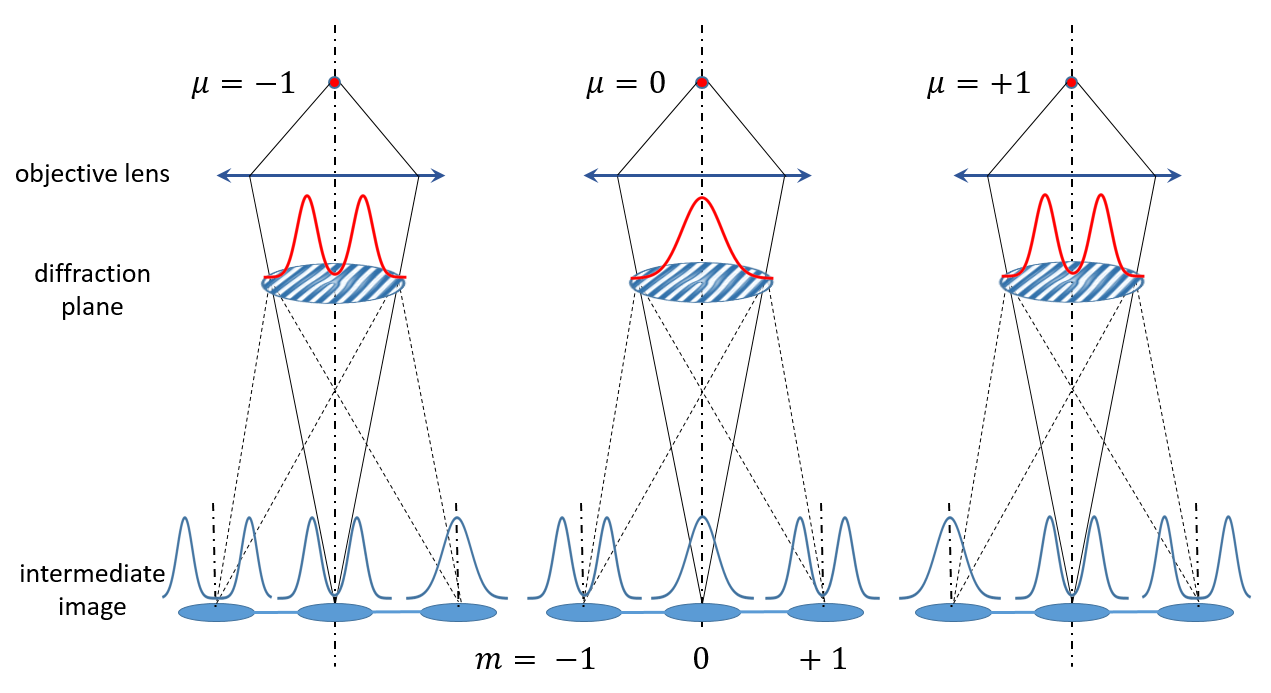
A fork mask in the DP adds topological charges to the incident beam of topological charge . Due to the grating nature of the fork mask, the m-dependent deflections are separated by , where is the electrons’ wavelength and is the fork mask periodicity. Thus, such a mask creates a line of vortices of topological charge in the image plane, see Fig. 2. The radial profiles in the image plane are given by the back-transform of Eq. 3 with the respective vortex order added by the mask:
| (4) |
where is given by the mask aperture limiting the maximum momentum transfer. The respective intensities are azimuthally symmetric with distinct radial profiles. Fig. 2 shows schematically the central three vortices for the three dipole-allowed transition channels. Note that the central vortex () does not show a difference for up and down spin polarization. This is the reason why such transitions cannot be distinguished with standard EELS. Fig. 2 only describes the situation where one transition channel is present.
For several transition channels at the same energy, the outgoing probe electron is in a mixed state, described by the reduced density matrix [34, 35] and the path of rays cannot be visualized in such an easy way. Note that the total intensity is the trace of the matrix, i.e. the sum over all intensities in the respective channels. For fully spin-polarized systems
| (5) |
where the are derived from the Clebsch-Gordan coefficients [6, 36] and given in Tab. 1.
| -1 | 0 | +1 | |||||||
|---|---|---|---|---|---|---|---|---|---|
| -1 | 0 | +1 | -1 | 0 | +1 | -1 | 0 | +1 | |
| -2 | -1 | 0 | -1 | 0 | +1 | 0 | +1 | +2 | |
| 0.278 | 0.222 | 0.167 | 0.278 | 0.222 | 0.167 | 0.278 | 0.222 | 0.167 | |
In Fig. 3, the resulting radial intensity profiles are drawn for the coherent case with no inelastic source broadening added (which will be discussed in more detail at the end of this section). The radial extension of the intensity profile in Fig. 3 is considerably broader than it is directly at the scattering centre, due to the limited extent of the vortex filtering mask shown in Fig. 2.
In this geometry, we define the EMCD signal as the relative difference of the intensities, from vortices with
| (6) |
The EMCD signal is a function of the radius which has been omitted for clarity here. It depends on the topological charge of the spin polarized transition . It is the difference of radial profiles for vortex orders and .

In practice, there are two technical problems with the setup shown in Fig. 2. On the one hand, placing the vortex filtering fork mask in the DP is not straightforward, because, due to the limited space in the pole piece gap, strip apertures are used which cannot be loaded with conventional ⌀ frame apertures. Even though there are proposals to use spiral-phase-plates in the DP, e.g. to determine chiral crystal symmetries and the local OAM content of an electron wave [37, 38], to date no successful implementation of a vortex mask in the DP of a TEM has been shown. On the other hand, the final image in the selected area aperture (SAA) plane (intermediate image plane) of the atom sized vortices would be too small to be resolvable at all. Both facts make this direct approach problematic. The second obstacle can be removed by defocussing the lens, observing broader vortices. The first one can be overcome by positioning the fork mask in a relatively easily accessible position, which is the SAA holder.
These ideas lead to a scattering geometry that can be easily set up in conventional TEMs, see Fig. 4a and Fig. 5c. Here, the fork mask is positioned in the SAA holder, creating a demagnified virtual image in the eucentric plane with small lattice constant. Additionally, the specimen is lifted in height by and the C2 condenser lens is adjusted such that a focused probe is incident on the specimen.
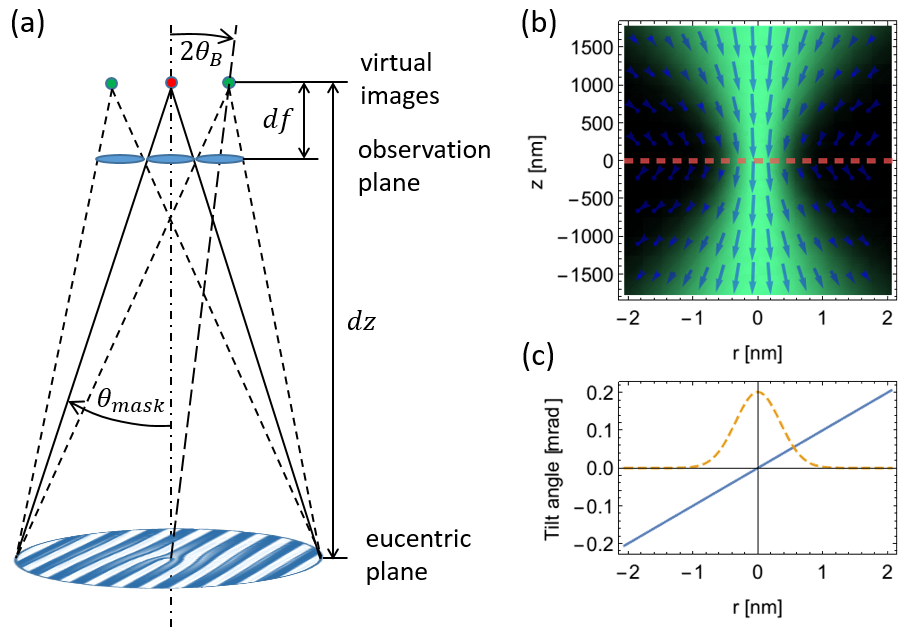
Note that focusing the beam onto the specimen guarantees that the probability density current is mostly aligned parallel to the optical axis all over the illuminated area such that the scattering ”light cones” all point in the same direction towards the vortex filter mask. This is due to the fact that the Rayleigh range of the incident beam222Note that the Rayleigh range was determined using the diffraction limited spot size of the C2 aperture, the final probe diameter is much larger due to incoherent source broadening. is of the order of (convergence semi-angle ) which is much larger than the sample thickness, in our case , and thus the incident wavefronts are almost flat everywhere inside the specimen, see Fig. 4b. How much they actually deviate from that assumption is estimated in Fig. 4c. It can be seen that the tilt angle at a radial position of in the entrance plane amounts to which can be considered negligible compared to the characteristic scattering angle of Co. Furthermore only a small fraction of atoms in the illuminated specimen area actually sees such ”high” tilt angles of the incident wavefront, most of the illuminated atoms do see a much less tilted wavefront333Neglecting the crystal field and channelling effects..
Lifting the specimen ensures that the (virtual) fork mask is now in the far field of the excited atom and creates a series of images of the ionization process as depicted in Fig. 4a. Practically, this setup is comparable to a standard STEM geometry but with the specimen lifted far off the eucentric plane. For better understanding the scattering setup, Fig. 5 compares the standard TEM setup in diffraction, Fig. 5a, and the standard STEM setup, Fig. 5b, to the setup proposed here, Fig. 5c.
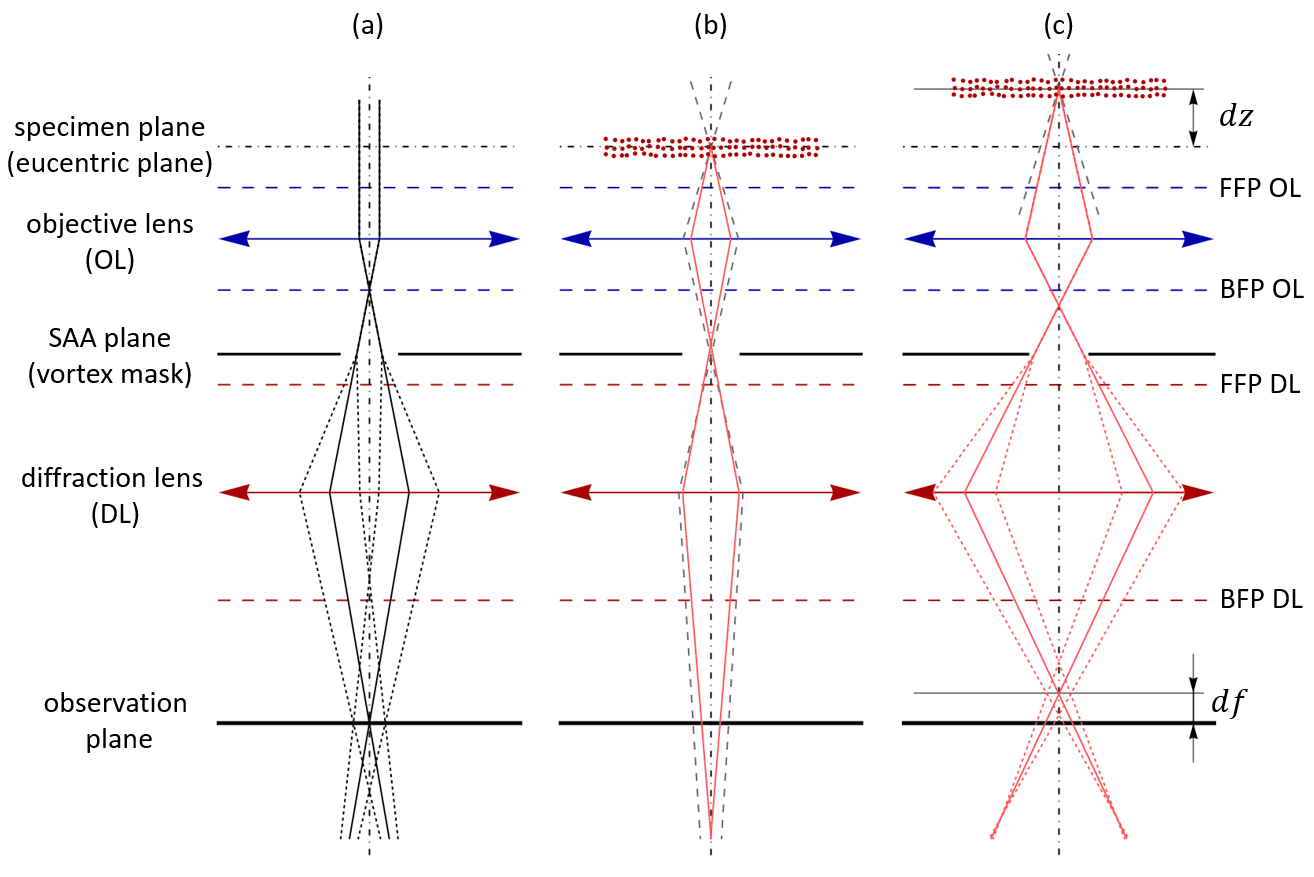
Note that there are slight changes in the focal position of elastic- to inelastically scattered electrons in Fig. 5b. It can be seen that when the vortex filter mask is placed in the SAA holder diffracted beams (small dashing) emerge from the vortex mask in Fig. 5a,c but not in Fig. 5b because there the image of the inelastically scattered electrons in the SAA plane is much smaller than the grating periodicity such that the vortex mask is not illuminated. Lifting the specimen by in Fig. 5c ensures that the vortex filter mask is properly illuminated. Moreover, due to electron optical reasons this lifting is essentially reducing the size of the first image of the focused probe on the (lifted) specimen, comparable to the reduction of the effective source size in the condenser system of a TEM by adjusting the C1 lens excitation.
The dichroic signal is strong in the centre of the vortices but difficult to observe because of their extension of only about 1 nm, as seen in Fig. 3. Therefore, the observation plane is set at a defocus (here ) from the specimen (preferably with the diffraction lens setting) to enhance the visibility of the dichroic signal. This can be understood from Fig. 4a and Fig. 5c. Virtual images (green) of the object intensities are observed at a defocus , making the distribution broader, such that the maximum of the vortices’ radial intensity distribution, where no dichroic signal is expected to occur, moves towards higher radii. The orders , with an angular separation of are shown in Fig. 4a.

The observed vortices are calculated with Eq. 4, but now including the defocus and the spherical aberration :
| (7) |
When a homogeneous specimen is illuminated all atoms within the beam will contribute incoherently with their respective signals. This incoherent broadening effect according to the finite illuminated area of the specimen is taken into account by a convolution with a Gaussian as described in [39]. Thus, the final simulated radial intensity distribution is given by
| (8) |
where represents the modified Bessel function of first kind of order zero and the amount of incoherent broadening. The resulting illuminated area (FWHM) at the specimen is . This incoherent broadening effect will reduce the EMCD signal as shown in Fig. 6. But still, the defocused case is preferable because the tiny differences in width for the focused case are hardly observable, see Fig. 6. In Eq. 8, there are two free parameters, defocus and broadening width, which are used to obtain best fits to the experimental data shown in the next section.
3 Experimental
The fundamental method and scattering geometry elaborated above have been realized in a proof-of-principle experiment on a FEI TECNAI F20 TEM equipped with a GATAN GIF Tridiem spectrometer (GIF) and a high-brightness XFEG. The acceleration voltage was set to , whereas the condenser system was set up in a way to achieve a high beam current at a sufficiently small spot size, i.e. providing a beam current of incident on the sample in a probe (FWHM) with a convergence semi-angle of .
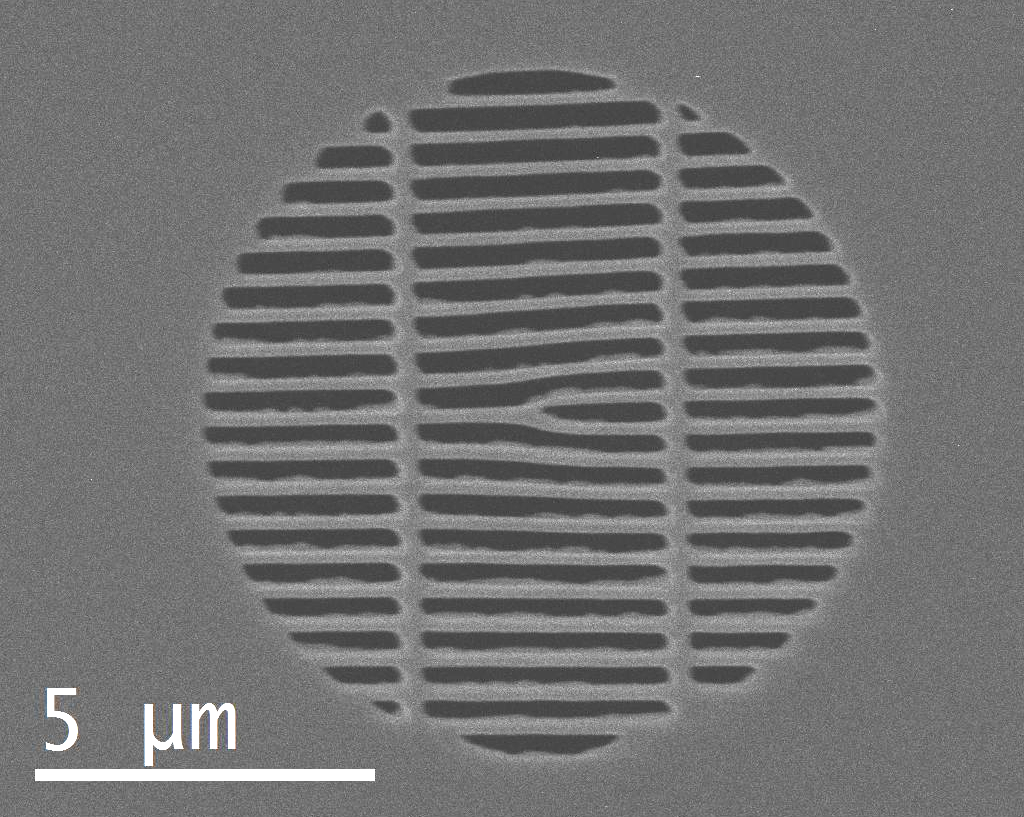
Fig. 7 shows the vortex filtering holographic fork mask that was placed in the SAA holder. It was produced by FIB milling into a Pt layer deposited on a membrane. With a diameter of and a grating periodicity of (back-projected: ), it exhibits a Bragg angle of separating the central spot from the first vortex orders in the eucentric plane by 444The separation distance was calculated using , with a camera-length of and the back-projected grating periodicity .. As a result the vortex orders are still well separated from the central peak for defocus values of and higher, see Fig. 8.
For the preparation of the Co sample, a 70 nm thin Co layer is deposited onto a NaCl crystal. The thin Co foil is then extracted by dissolving the NaCl in water. Afterwards, the Co foil is netted with a commercially available Cu grid, resulting in a free standing nano-crystalline Co film of thickness, with randomly oriented crystallites. In the following section, the experimental setup of the vortex filter experiment on the Co film is described in detail.
In imaging mode, the objective lens is set to the eucentric focus value with the sample in the eucentric height. From that position, the Co sample is then lifted by . The beam is focused onto the lifted specimen using C2 excitation and observing the ronchigram in the eucentric plane.
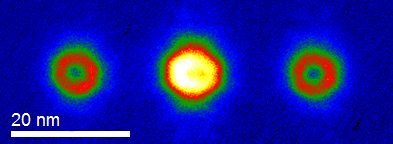
The microscope is set to the diffraction mode with a camera length of (including the GIF magnification), which is necessary to resolve the separated EVBs. Focusing is solely done with the diffraction lens. Then, all three vortex orders are imaged at the GIF camera in the energy filtered TEM mode555In fact we are working in the energy filtered selected area diffraction (EFSAD) mode [29] because the microscope is set to diffraction mode and the SAA (vortex filter mask) is used., operated at the edge threshold energy of the -edge of Co of using a slit width of , see Fig. 8. In order to keep the illumination conditions constant, the drift tube was used to adjust the spectrometer to the desired Co -edge energy of instead of the high tension.
Fig. 8 shows the experimental energy filtered image of the vortex aperture from electrons which have transferred to the Co sample. Due to the extremely low count rates, Fig. 8 is acquired taking four frames with an acquisition time of 100 s per frame with four fold binning. Subsequently, the frames are stacked and aligned using Image J [40]. To extract the radial intensity profiles given in Fig. 9, Digital Micrograph scripts are used to determine the exact vortex orders’ centres, cropping them and doing the rotational (azimuthal) average.
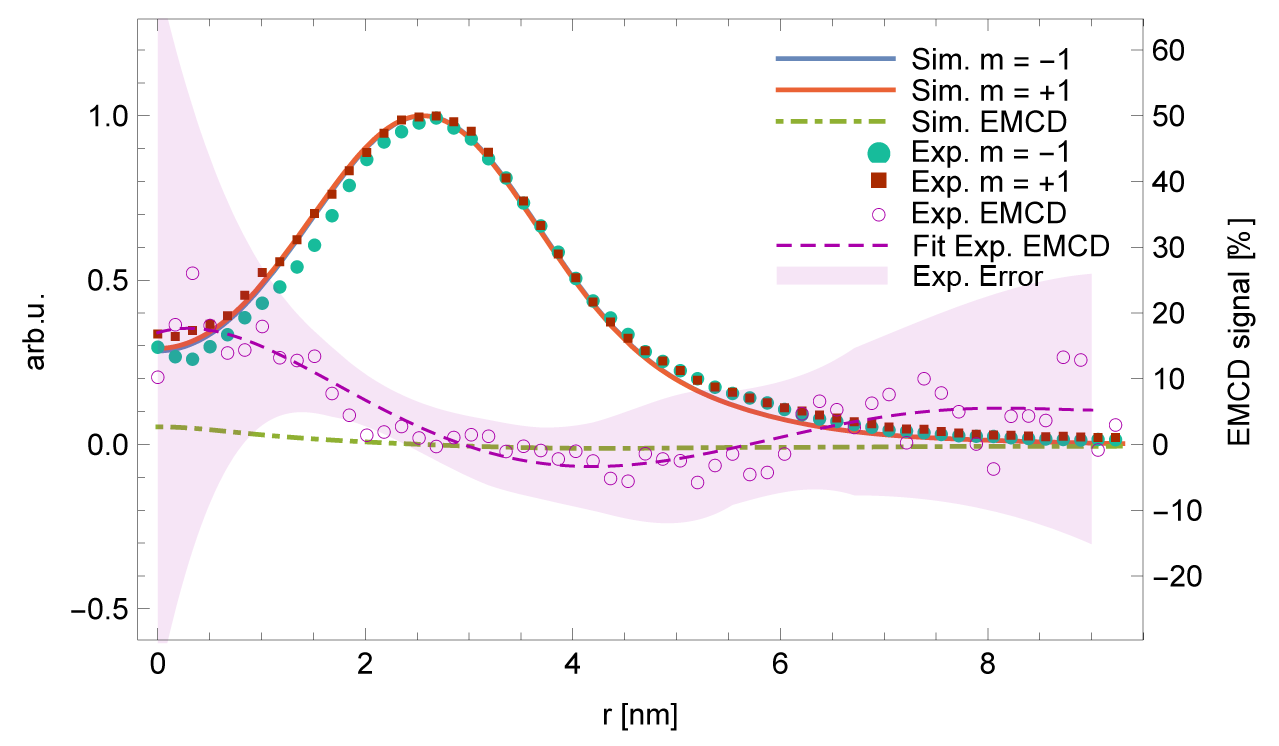
Fig. 9 shows that the simulation666For the sake of simplicity, elastic scattering inside the nano-crystalline structure of the specimen was not taken into account in the single atom approach given here. with the chosen parameters is in very good agreement with the experimental data. Curiously, the experimental radial profiles show a strong difference in the central region () which is similar to classical EMCD measurements [41] and previous vortex filter EMCD experiments [9]. However, the simulation predicts a much smaller EMCD signal (). This discrepancy is possibly due to (i) skew optic axes which gives rise to slight differences in apparent defocus for the positive and negative vortex orders, (ii) artefacts from the mask production [42] and (iii) OAM impurities stemming from the SAA vortex mask [43].
Fig. 9 also clearly shows that the EMCD signal is much smaller than the relative root-mean-square (RMS) value of the experimental EMCD signal (, magenta shaded region) and thus cannot be detected reliably under present experimental conditions. Since the profiles are azimuthally averaged, the absolute signal-to-noise ratio (SNR) per radial position is best for the largest radius where an average over 512 pixels was taken, and lowest for the second point (9 pixel average). This was taken into account numerically for the results shown in Fig. 9. The magenta shaded region in Fig. 9 is calculated using Gaussian error propagation, thus showing the relative RMS value in the azimuthal direction of the EMCD signal defined by Eq. 6.
Furthermore, the error in Fig. 9 (magenta shaded region) only represents the statistical error; systematic errors such as beam-drift, beam damage, artefacts due to non-isotropic vortex rings etc. have not been included. In practice, the sample’s spin polarization may be less than 100 %, and the vorticity may change during the propagation of the outgoing vortex beams through the specimen [12], thereby decreasing the expected EMCD signal as well.
In view of these results and considerations, further investigations and improvement of the experimental conditions are necessary to proof the applicability and reliability of the EMCD vortex filter method.
4 Conclusions
In this work we investigated the feasibility of detecting an EMCD signal when incorporating a fork mask as a vortex filter in the SAA plane in a standard two-condenser lens field emission TEM. By lifting the sample far above the eucentric position, a vortex filter mask in the SAA plane can be properly illuminated. Thus, it produces well separated vortex orders which should, in principle, carry the EMCD information in the asymmetry of their respective central intensities. This method could become a promising method for studying magnetic properties of amorphous or nanocrystalline materials, which is impossible in the classical EMCD setup. So far the experimental tests show that the SNR is still too low and that for a successful experimental realization substantial progress in the experimental conditions is compulsory. For example, to improve the SNR future experiments should incorporate larger SAA fork masks, e.g. at least to in diameter. As the collected signal scales with the mask area, the acquisition times could then be lowered by an order of magnitude. Also, incorporating a HM in the contrast aperture holder located in the DP would simplify the experimental setup as well as increase the collection efficiency. Finally, using state-of-the-art aberration corrected microscopes it is possible to increase the lateral coherence of the probe beam while at the same time keeping the beam current high. This would enhance the EMCD signal strength by an order of magnitude. Thus, in the light of above considerations and the proof-of-principle experiment, detection of EMCD signals using HM as a vorticity filter seems to be feasible but needs thorough control of experimental parameters like spot size, vortex masks fidelity, sample- and system stability.
5 Acknowledgements
T.S. acknowledges financial support by the Austrian Science Fund (FWF), project I543-N20 and by the European research council, project ERC-StG-306447, P.S. acknowledges financial support by the FWF, project I543-N20 and S.L. acknowledges financial support by the FWF, project J3732-N27.
References
- Schattschneider et al. [2006] P. Schattschneider, S. Rubino, C. Hébert, J. Rusz, J. Kuneš, P. Novák, E. Carlino, M. Fabrizioli, G. Panaccione, and G. Rossi, Nature 441, 486 (2006).
- Verbeeck et al. [2008] J. Verbeeck, C. Heébert, S. Rubino, P. Novǎk, J. Rusz, F. Houdellier, C. Gatel, and P. Schattschneider, Ultramicroscopy 108, 865 (2008).
- Warot-Fonrose et al. [2010] B. Warot-Fonrose, C. Gatel, L. Calmels, V. Serin, E. Snoeck, and S. Cherifi, Journal of Applied Physics 107, 09D301 (2010).
- Wang et al. [2013] Z. Wang, X. Zhong, R. Yu, Z. Cheng, and Z. J., Nature Communications (2013).
- Schattschneider et al. [2008] P. Schattschneider, M. Stöger-Pollach, S. Rubino, M. Sperl, C. Hurm, J. Zweck, and J. Rusz, Physical Review B - Condensed Matter and Materials Physics 78, 104413 (2008).
- Schattschneider et al. [2012a] P. Schattschneider, B. Schaffer, I. Ennen, and J. Verbeeck, Physical Review B 85, 134422 (2012a).
- Ennen et al. [2012] I. Ennen, S. Löffler, C. Kübel, D. Wang, A. Auge, A. Hütten, and P. Schattschneider, Journal of Magnetism and Magnetic Materials 324, 2723 (2012).
- Uchida and Tonomura [2010] M. Uchida and A. Tonomura, Nature 464, 737 (2010).
- Verbeeck et al. [2010] J. Verbeeck, H. Tian, and P. Schattschneider, Nature 467, 301 (2010).
- McMorran et al. [2011] B. McMorran, A. Agrawal, I. Anderson, A. Herzing, H. Lezec, J. McClelland, and J. Unguris, Science 331, 192 (2011).
- Bliokh et al. [2012] K. Y. Bliokh, P. Schattschneider, J. Verbeeck, and F. Nori, Physical Review X 2, 041011 (2012).
- Löffler and Schattschneider [2012a] S. Löffler and P. Schattschneider, Acta Crystallographica Section A A68, 443 (2012a).
- Verbeeck et al. [2013] J. Verbeeck, H. Tian, and G. Van Tendeloo, Advanced Materials 25, 1114 (2013).
- Guzzinati et al. [2013] G. Guzzinati, P. Schattschneider, K. Bliokh, F. Nori, and J. Verbeeck, Physical Review Letters 110 (2013).
- Lubk et al. [2013] A. Lubk, L. Clark, G. Guzzinati, and J. Verbeeck, Phys. Rev. A 87, 033834 (2013).
- Schattschneider et al. [2014] P. Schattschneider, S. Löffler, M. Stöger-Pollach, and Verbeeck, Ultramicroscopy 136, 81 (2014).
- Rusz and Bhowmick [2013] J. Rusz and S. Bhowmick, Phys. Rev. Lett. 111, 105504 (2013).
- Rusz et al. [2014a] J. Rusz, S. Bhowmick, M. Eriksson, and N. Karlsson, Phys. Rev. B 89, 134428 (2014a).
- Pohl et al. [2015] D. Pohl, S. Schneider, J. Rusz, and B. Rellinghaus, Ultramicroscopy 150, 16 (2015).
- Rusz et al. [2014b] J. Rusz, J. C. Idrobo, and S. Bhowmick, Physical Review Letters 113 (2014b).
- Idrobo et al. [2015] J. Idrobo, J. Rusz, M. A. McGuire, C. T. Symons, R. R. Vatsavai, and A. R. Lupini, in APS Meeting Abstracts (2015).
- Fickler et al. [2012] R. Fickler, R. Lapkiewicz, W. N. Plick, M. Krenn, C. Schaeff, S. Ramelow, and A. Zeilinger, Science 338, 640 (2012).
- Bazhenov et al. [1990] V. Bazhenov, M. Vasnetsov, and M. Soskin, Jetp Letters 52, 429 (1990).
- Steiger et al. [2013] R. Steiger, S. Bernet, and M. Ritsch-Marte, Optics Express (2013).
- Herzer [2013] G. Herzer, Acta Materialia 61, 718–734 (2013).
- Wu et al. [1992] Y. Wu, J. Stöhr, B. D. Hermsmejer, M. G. Samant, and D. Keller, Physical Review Letters 69, 2307 (1992).
- Schütz et al. [1987] G. Schütz, W. Wagner, W. Wilhelm, P. Kienle, R. Zeller, R. Frahm, and G. Materlik, Physical Review Letters 58, 737 (1987).
- Manson [1972] S. T. Manson, Physical Review A 6, 1013 (1972).
- Löffler et al. [2011] S. Löffler, I. Ennen, F. Tian, P. Schattschneider, and N. Jaouen, Ultramicroscopy 111, 1163 (2011).
- Auerhammer and Rez [1989] J. M. Auerhammer and P. Rez, Phys. Rev. B 40, 2024 (1989).
- Schattschneider et al. [2010] P. Schattschneider, J. Verbeeck, V. Mauchamp, M. Jaouen, and A. Hamon, Physical Review B - Condensed Matter and Materials Physics 82 (2010).
- Egerton [2009] R. F. Egerton, Reports on Progress in Physics 72, 016502 (25pp) (2009).
- Abramowitz and Stegun [1965] M. Abramowitz and I. Stegun, Handbook of Mathematical Functions (Dover Publications, 1965).
- Schattschneider et al. [1999] P. Schattschneider, M. Nelhiebel, and B. Jouffrey, Phys. Rev. B 59, 10959 (1999).
- Löffler and Schattschneider [2012b] S. Löffler and P. Schattschneider, Micron (Oxford, England : 1993) 43, 971 (2012b).
- Löffler et al. [2013] S. Löffler, V. Motsch, and P. Schattschneider, Ultramicroscopy 131, 39 (2013).
- Juchtmans and Verbeeck [2015] R. Juchtmans and J. Verbeeck, Phys. Rev. B 92, 134108 (2015).
- Juchtmans and Verbeeck [2016] R. Juchtmans and J. Verbeeck, Phys. Rev. A 93, 023811 (2016).
- Schattschneider et al. [2012b] P. Schattschneider, M. Stöger-Pollach, S. Löffler, A. Steiger-Thirsfeld, J. Hell, and J. Verbeeck, Ultramicroscopy 115, 21 (2012b).
- Schneider et al. [2012] C. Schneider, W. Rasband, and K. Eliceiri, Nature Methods 9, 671 (2012).
- Schattschneider [2012] P. Schattschneider, Linear and Chiral Dichroism in the Electron Microscope (Pan Stanford Publishing Pte. Ltd., 2012).
- Barwick et al. [2006] B. Barwick, G. Gronniger, L. Yuan, S.-H. Liou, and H. Batelaan, Journal of Applied Physics 100, 074322 (2006), http://dx.doi.org/10.1063/1.2357000.
- Clark et al. [2014] L. Clark, A. Béché, G. Guzzinati, and J. Verbeeck, Phys. Rev. A 89, 053818 (2014).