Photometric evolution of seven recent novae and the double component characterizing the lightcurve of those emitting in -rays
Abstract
The lightcurves of seven recent novae have been extensively mapped with daily robotic observations from Atacama (Chile). They are V1534 Sco, V1535 Sco, V2949 Oph, V3661 Oph, MASTER OT J010603.18-744715.8, TCP J1734475-240942 and ASASSN-16ma. Five belong to the Bulge, one to SMC and another is a Galactic disk object. The two program novae detected in -rays by Fermi-LAT (TCP J1734475-240942 and ASASSN-16ma) are Bulge objects with unevolved companions. They distinguish themselves in showing a double-component optical lightcurve. The first component to develop is the fireball from freely-expanding, ballistic-launched ejecta with the time of passage through maximum which is strongly dependent on wavelength (1 day delay between and bands). The second component, emerging simultaneously with the nova detection in -rays and for this reason termed gamma, evolves at a slower pace, its optical brightness being proportional to the -ray flux, and its passage through maximum not dependent on wavelength. The fact that -rays are detected from novae at the distance of the Bulge and at peak flux levels differing by 4 seems to contradict some common belief like: only normal novae close to the Sun are detected by Fermi-LAT, most normal novae emit -rays, and they emit -rays in similar amounts. The advantages offered by high-quality photometric observations collected with only one telescope (as opposed to data provided by a number of different instruments) are discussed in connection to the actual local realization of the standard filter bandpasses and the spectrum of novae dominated by emission lines. It is shown how, for the program novae, such high-quality and single-telescope optical photometry is able to disentangle effects like: the wavelength dependence of a fireball expansion, the recombination in the flashed wind of a giant companion, the subtle presence of hiccups and plateaus, tracing the super-soft X-ray phase, and determining the time of its switch-off. The non-detection by 2MASS of the progenitor excludes a giant or a sub-giant being present in four of the program novae (V2949 Oph, V3661 Oph, TCP J18102829-2729590, and ASASSN-16ma). For the remaining three objects, by modelling the optical-IR spectral energy in quiescence it is shown that V1534 Sco contains an M3III giant, V1535 Sco a K-type giant, and MASTER OT J010603.18-744715.8 a sub-giant.
keywords:
novae, cataclysmic variables1 Introduction
The outburst of a nova originates from thermonuclear (TNR) runaway on the surface of a white dwarf when material accreted from a companion reaches critical conditions for ignition. The accreted envelope is electron degenerate, a fact that leads to violent mass ejection into surrounding emptiness (if the donor is a dwarf) or into thick circumstellar material (if the WD orbits within the wind of a cool giant companion). The variety of nova phenomena is further enriched by the dependence on WD mass (as the velocity and amount of ejected material), the diffusion and mixing of underlying WD material into the accreted envelope (outburst strength and chemistry), the common-envelope interaction with the companion star (such as 3D morphology of the ejecta and duration of the post-TNR stable nuclear burning), and the viewing angle (especially for highly structured ejecta composed of bipolar flows, equatorial tori, diffuse prolate components and winds or bow-shocks). Bode & Evans (2012) and Woudt & Ribeiro (2014) has provided extensive, recent reviews about classical novae.
Given the range of observable phenomena, a comprehensive description of a nova would obviously benefits from the widest wavelength and epoch coverage, including the pre-outburst properties of the progenitor. While rampant fields like X-ray imaging/spectra (eg. Ness 2012), GeV -rays detection (Ackermann et al. 2014) and radio high angular-resolution maps (Chomiuk et al. 2014) are changing our understanding of novae, good multi-band lightcurves are still an essential contribution. Especially during the initial optically thick phase, but also during the following optically thin advanced decline, the ejecta and pre-existing circumstellar matter reprocess at longer wavelengths (optical/IR) the energetic input of phenomena developing primarily at much higher energies. An accurate and multi-band lightcurve of a nova can thus track and reveal a lot about the powering engine and the physical conditions in the intervening and reprocessing medium. To be of the highest diagnostic value, a multi-band lightcurve should be () densely mapped (daily), () start immediately after nova discovery and extend well into the advanced decline, stopped only by Solar conjunction or limited by telescope diameter, () pursue the highest external photometric accuracy, i.e. the combination of the highest recorded flux with the most accurate transformation from the instantaneous local photometric system to the standard one, and () the entire (or the bulk of the) lightcurve being obtained with a single instrument and not be the result of the combination of sparse data from a variety of different telescopes. This last point is discussed in more detail in sect.3 below.
The aim of the present paper is to present extensive lightcurves of seven recent novae, all appearing at deep southern declinations, well below those accessible with the Asiago telescopes that we regularly use to follow spectroscopically novae appearing north of 25∘. The photometric observations presented in this paper have been obtained with a robotic telescope we operate in Atacama (Chile). The program novae are listed in Table 1, together with their equatorial and Galactic coordinates, spectral class (FeII or He/N) and date when their discovery was announced. All of them, except MASTER OT J010603.18-744715.8 appearing toward SMC, erupted within a few degrees of the Galactic center.
![[Uncaptioned image]](/html/1703.09017/assets/x1.png)
![[Uncaptioned image]](/html/1703.09017/assets/x2.png)
Most of the program novae have been targeted and detected in the radio, X-rays and/or -rays. Nothing comprehensive has been yet published on these exciting observations other than preliminary announcements on ATels, and for only the two oldest program novae (V1534 Sco and V1535 Sco), a comprehensive study of their near-IR spectra has been accomplished (Joshi et al. 2015, Srivastava et al. 2015). For none of the program novae a detailed report on their optical properties and multi-band lightcurve has been published so far, and thus the aim of this paper is to fill-in this gap by providing and discussing high accuracy, daily-mapped lightcurves for all of them. In addition to allow by themselves some physical discussion on the properties of the program novae, our lightcurves are meant to provide useful support information to future studies based on other wavelength domains. Our photometric mapping started within one day of nova announcement and extended until Solar conjunction set in or the nova completed its evolution.
All times given in the paper are UT unless otherwise noted. Our photometry is strictly tied to the Landolt (2009) system of equatorial standards, thus the band should be properly written as (Cousins’ system). For simplicity we will drop the ”C” suffix in the rest of the paper, and write the adopted photometric bands as .
2 Observations
optical photometry of the program novae was obtained with ANS Collaboration robotic telescope 210, located in San Pedro de Atacama, Chile. All novae were observed daily for as long as Solar conjunction allowed after their discovery. Telescope 210 is a 40cm f/6.8 Optimized Dall-Kirkham (ODK). It mounts a FLI cooled CCD camera equipped with a 4k4k Kodak 16803 sensor of 9 m pixel size. The photometric filters are of the multi-layer dielectric type and are manufactured by Astrodon.
Technical details and operational procedures of the ANS Collaboration network of telescopes are presented by Munari et al. (2012). Detailed analysis of the photometric performances and multi-epoch measurements of the actual transmission profiles for all the photometric filter sets in use at all ANS telescopes is presented by Munari & Moretti (2012). Data collected on the program novae with ANS telescope 210 were ftp-transferred daily to the central ANS server were data reduction was carried out in real time to check on nova progress and instrument performance. Data reduction involved all usual corrections for bias/dark/flat/pixel map, with fresh new calibration frames obtained regularly in spite of the highly stable conditions of the instrumentation at the remote desert site. Transformation from the instantaneous local photometric system to the standard one is carried out on all individual observations by color equations which coefficients are calibrated against a local photometric sequence imaged together with the nova.
The local photometric sequence is extracted from the APASS survey (Henden et al. 2012, Henden & Munari 2014) using the transformation equation calibrated in Munari et al. (2014a,b). The APASS survey is strictly linked to the Landolt (2009) and Smith et al. (2002) systems of equatorial standards. The local photometric sequences around the program novae are selected to fully cover the whole range of colors spanned by each individual nova and are kept fixed during the whole observing campaign, so to ensure the highest (internal) consistency. Re-observing the local photometric sequences along with the respecting novae has allowed us to refine their magnitudes to extreme precision (well beyond the original APASS), including pruning from the hidden presence of subtle variable stars. These pruned and refined local photometric sequences are freely available (e-mail the first author) to anyone interested in using them to calibrate further optical photometry of the novae considered in this paper.
All measurements were carried out with aperture photometry, with the aperture radius and inner/outer radii for the sky annulus -optimized on each image so to minimize dispersion of the stars of the local photometric sequences around the transformation equations from the local instantaneous to the standard system. On average, the aperture radius was 1.0FWHM of the seeing profile, and the inner and outer radii for the sky annulus were 3 and 4FWHM, respectively. Finally, colors and magnitudes are obtained separately during the reduction process, and are not derived one from the other. Our measurement for the program novae are listed in Table 2, available in full only electronically. The quoted uncertainties are total error budgets, adding quadratically the Poissonian contribution on the nova to the uncertainty (measured on the stars of the local photometric sequence) in the transformation from the instantaneous local photometric system to the standard one.
3 Single-telescope vs multi-telescope lightcurves
The advantages offered by building the lightcurve of a nova from data provided by a single telescope (and thus not the result of the combination of sparse data from a variety of different telescopes) are relevant, even if frequently overlooked or not fully appreciated. We do not refer - although very relevant themselves - to differences in the quality of data acquisition/reduction/calibration carried out at each telescope, nor to the effect of difference in focal length and PSF purity in the crowded fields where novae usually appear. We restrict to consider here the ideal case in which all aspects of data acquisition and reduction have been carried out state-of-the-art and crowding is not an issue.
The spectral energy distribution of a nova is dominated by strong emission lines, the more so as the nova declines. While standard color-equations (either for the all-sky and the local photometric sequence approaches) can essentially null the differences (for normal stars and standard filter sets) between the standard photometric system and its local instantaneous realization (with the time- and -dependent atmospheric transmission as a key component of the optical train), this is hardly so for objects whose spectra are dominated by emission lines.
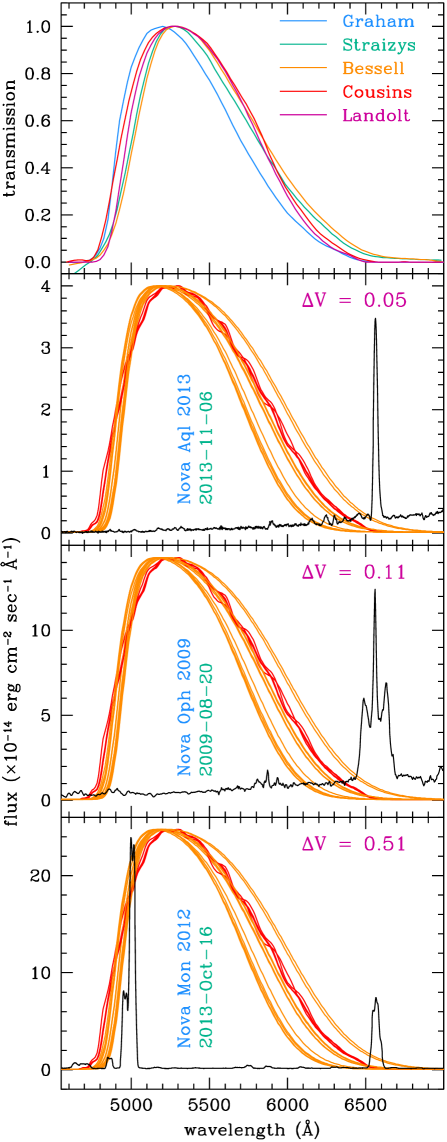
Let’s consider the Landolt band for example, with similar reasoning applicable to other bands or other photometric systems. As discussed in detail in Munari et al. (2013a), much of the flux through the band during the optically thin phase of FeII-novae comes from the [OIII] nebular doublet. The doublet is located on the steeply rising long-pass edge of the band profile, where small differences in the transmission of the photometric filters cause large deviations in the flux collected from the nova. Similarly, during the optically thick phase of heavily reddened novae of both the FeII and He/N types, a non-negligible fraction of the flux through the band comes from the H emission line. H is located at the red wing of the band, were the transmission of an actual filter can go from null up to several % of the peak value.
In the top panel of Figure 1 we have plot the transmission profile of the band as locally realized by some of the most popular attempts to match and standardize the original Johnson & Morgan (1953) photometric system (Cousins 1980, Graham 1982, Bessell 1990, Straizys 1992, Landolt 1992). The differences along the whole band profile are quite obvious. Yet, proper handling of the color-equations can essentially null such differences when dealing with the smooth, continuum-dominated and black-body like spectral energy distribution of normal stars.
The lower three panels of Figure 1 overplot to the spectra of three novae the transmission profiles of the set of filters measured in the laboratory by Munari & Moretti (2012) with a spectrometer over the 2000 Å to 1.1 m range (so to check for either blue or red leaks). These filters come from the main manufacturers in the field and, prior to measurement, have been subject to at least one year of continuous operation at the telescope (thus exposed to large and continuous changes in barometric pressure, temperature and humidity). The filters are of two types. Those following the Bessell (1990) recipe for sandwich of Schott colored glasses (2mm of GG495 + 3mm of BG39) are plotted in orange, the others are of the multi-layer dielectric type and are plotted in red. The nova spectra are examples taken from our long term monitoring of all novae accessible with the Asiago telescopes. Nova Aql 2013 and Nova Oph 2009 are two heavily reddened novae, of respectively the FeII and He/N types, as observed during the early decline from maximum. Nova Mon 2012 is a low reddening FeII nova as observed during the optically thin phase, at a time when the super-soft phase was over.
To accurately simulate actual observations of these novae with the different filters plotted in the lower panels of Figure 1 we proceeded the following way. The nights when these spectra of the three novae were observed were clear and all-sky photometric. Several blue and red spectrophotometric standard stars were observed at different airmass during each night. On the fully-extracted, but not flux-calibrated spectra of the standards, we computed the instrumental magnitude in the filters which transmission profile is fully covered by our 3200-7700 Å spectra. These instrumental magnitudes (plus reference tabular values) were used with normal photometric data-reduction techniques to solve the color-equations to transform from the local to the standard photometric system. While the and band profiles were kept fixed to those tabulated by Landolt (1992), for the band profile we in turn adopted each one of those plotted in bottom panels of Figure 1.
The all-sky inter-calibration of the standard stars provided stable results at 0.01 mag level in all bands whatever the choice for the profile was. The magnitude derived in the same way for the novae changed instead from one filter to another. The range of the computed magnitudes is (cf Figure 1) 0.05 mag for Nova Aql 2013, 0.11 mag for Nova Oph 2009, and 0.51 mag for Nova Mon 2012. For the heavily reddened Nova Aql 2013 and Nova Oph 2009, the bluer wavelengths going through the passband contribute essentially nothing to the recorded flux. In such conditions, the fact that the transmission profile of a given filter is null or is it still transmitting something at H wavelength is the reason for the different magnitude derived for the nova. Obviously, the wider the equivalent width of H, the larger is , as the comparison of Nova Aql 2013 (e.w.(H)=330 Å) and Nova Oph 2009 (e.w.(H)=770 Å) clearly illustrates. For the nebular spectrum of Nova Mon 2012 (lowest panel of Figure 1), the line responsible for much of the filter-to-filter differences is [OIII], which dominates (with its e.w.(H)=8800 Å) the flux going through the band. The [OIII] doublet is located right on the steeply ascending branch of the band transmission profile, where filter-to-filter differences are the largest.
The conclusion seems straightforward. If state-of-the-art photometry is collected with only one telescope (always the same filters, detector, comparison sequence, data reduction procedures), any glitch present in a densely mapped lightcurve will probably be true, something connected to a real change in the physical conditions experienced by the nova. On the contrary, if the lightcurve of a nova is built from data obtained independently at different telescopes observing at different epochs, there is a serious risk that any feature is an artefact caused by the mixed data sources and it is not intrinsic to the nova. In addition to those recorded by ANS Collaboration, an excellent example of single-telescope lightcurves of novae are those obtained by the SMARTS project (Walter et al. 2012).
Application of medium- and narrow-band filters to the photometry of novae would overcome the problems caused by the mixed presence of both continuum and emission lines within the transmission profile of broad photometric bands, segregating the contribution of pure continuum from that of emission lines. The evolution of Nova Del 2013 during the first 500 days of its eruption has been monitored by Munari et al. (2015) simultaneously in Landolt broad-band and , Stromgren medium-band and , and line narrow-band H and OIII filters. This study highlights the great diagnostic potential of such a combined approach in carrying out the photometry of nova outbursts.
4 The program novae
![[Uncaptioned image]](/html/1703.09017/assets/x4.png)
4.1 Decline rates, reddening and distances
For all the program novae, the collected photometric data allows to derive decline rates, reddening and distances with the popular methods summarized in this section. The results are listed in Table 3 and in the sections below aiming to individual objects..
The characteristic rates and are the time (in days) that a nova takes to decline in band by, respectively, 2 and 3 magnitudes below maximum brightness. This quantity is obviously wavelength-dependent, considering the significant color evolution presented by a nova around maximum. Duerbeck (2008) proposed a mean relation =1.75. For our program novae we obtain =1.54 (=0.22).
Photometric reddening is computed by comparison with the intrinsic colors given by van den Bergh and Younger (1987). From a sample of well studied novae, they derived as mean intrinsic values =0.23(0.06) at the time of -band maximum, and =0.02(0.04) at . The reddening we computed for the program novae at these two epochs are in good mutual agreement. Because of the peculiar spectral energy distribution of novae, the intrinsic values given by van den Bergh and Younger cannot be ported to other color combinations using transformations calibrated on normal stars, as discussed in Munari (2014).
The distance to a nova is usually estimated via calibrated relations (called MMRD) between absolute magnitude at maximum and rate of decline , either in the form
or the stretched S-shaped curve
first introduced by Capaccioli et al. (1989). In computing the distances to the program novae, we have adopted the latest available calibration by Downes & Duerbeck (2000) for MMRD as function of and , as well as the S-shaped curve. These three values for the absolute magnitude are in good mutual agreement (mean deviation from mean value is 0.15 mag), with perhaps a slight tendency to be fainter for values computed from . The distance given in Table 3 is computed from the mean value of the absolute magnitude as provided by the three , and S-curve methods.
Buscombe & de Vaucouleurs (1955) noted how the absolute magnitude 15 days after optical maximum is similar for novae of all speed classes. We adopt for this the value =6.05 calibrated by Downes & Duerbeck (2000). On average the distance computed in Table 3 from the brightness at 15 days is similar to that provided by , and S-curve methods.
In estimating the distances, the correction for extinction is computed from the derived reddening and the standard =3.1 law by Fitzpatrick (1999), following the expression
| (1) |
computed by Fiorucci and Munari (2003) for the energy distribution of a nova at the time of maximum brightness. Compared to the total extinction along the line of sight provided by the 3D maps of Schlegel, Finkbeiner & Davis (1998, hereafter SFD98) and Schlafly & Finkbeiner (2011, SF11), the extinction computed from Eq.(1) is nearly identical for four program novae, and a fraction of it for other two. The remaining program nova (V2949 Oph) has no -band photometry useful to the computation of .
4.2 V1534 Sco
V1534 Sco (= Nova Sco 2014 = TCP J17154683-3128303) was discovered at (unfiltered) 10.1 mag on 2014 Mar 26.85 by K. Nishiyama and F. Kabashima (CBET 3841). Spectroscopic classification as an He/N nova was obtained on Mar 27.8 by Ayani & Maeno (2014), reporting FWHM=7000 km/s for H (see also Jelinek et al. 2014).
Joschi et al. (2015) discuss the result from near-IR spectroscopy covering the first 19 days of the outburst, following on the preliminary report by Joschi et al. (2014). The near-IR spectra confirm the He/N classification, and show emission lines characterized by a rectangular shape with FWZI9500 km/s and a narrow component on the top. The positional coincidence with a bright 2MASS cool source (J=11.255, H=10.049, Ks=9.578) and the presence of first overtone absorption bands of CO at 2.29 microns (as seen in M giants) led Joschi et al. (2014) to suggest that V1534 Sco is a nova originating from a symbiotic binary system, similar to V407 Cyg, RS Oph and V745 Sco.
X-ray emission from the nova was observed by the Swift satellite within a few hours of optical discovery (Kuulkers et al. 2014), corresponding to an absorbed optically thin emission of kT = 6.4 +3.8/-2.1 keV and NH = 5.8 (+1.2/-1.0) 1022 cm-2 (with most of the absorption intrinsic to the source). X-ray emission was also recorded on the following days (Page, Osborne and Kuulkers 2014), with the softer counts increasing as result of decreasing absorption column, a behavior consistent with that expected for a shock emerging from the wind of the secondary star, as expected in a nova erupting within a symbiotic system.
The presence of a cool giant in nova V1534 Sco has however to face some inconsistencies: () Joschi et al. (2015) sequence of near-IR spectra show emission lines of constant width, not the rapid shrinking associated with the deceleration of the ejecta expanding through the pre-existing wind of the cool giant companion, as observed in the template V407 Cyg case (Munari et al. 2011); () the narrow peak observed by Joschi et al. (2015) to sit on top of the broad emission lines, and taken to represent the flash-ionized wind of the cool giant, does not quickly disappear as consequence of rapid recombination driven by the high electronic density, as instead observed in other novae erupting within symbiotic binaries; and () by analogy with V407 Cyg and V745 Sco, -ray emission would have been expected to arise from high velocity ejecta slamming onto the wind of the cool companion (Ackermann et al. 2014), but no -ray detection of V1534 Sco has been reported to date.
4.2.1 The lightcurve
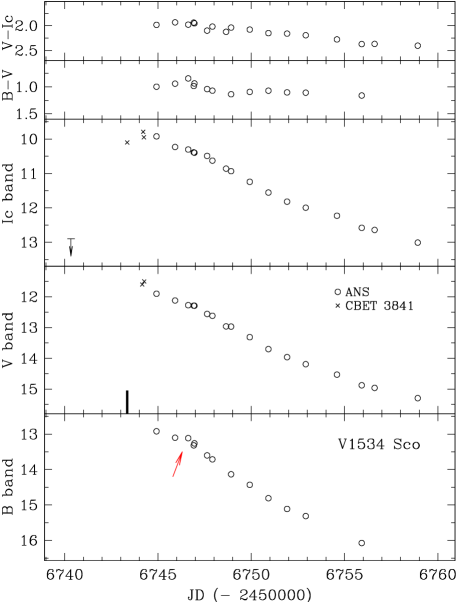
The lightcurve of V1534 Sco is presented in Figure 2 and the basic parameters extract from it are listed in Table 3. Our photometric monitoring commenced within one day of the announcement of its discovery. Our observations continued indeed for a longer period than shown in the figure, but we refrain from plotting or tabulating such noisy late data, which are best described as a rapid flattening of the lightcurve toward the asymptotic values 19.6, 18.3, and 14.3. This flattening is artificial and can be ascribed to (1) the stable contribution from the 2MASS cool source which dominates in the band, and (2) the unresolved contribution in and bands by several unrelated field stars which lie within 4 arcsec of the nova. The crowding is so severe in the immediate surrounding of the nova that attempts to disentangle it via PSF-fitting proved unconverging on our images.
The time and brightness of maximum in band is well constrained in Figure 2, and by similarity we assume the earliest two points plotted in Figure 2 to mark the actual maximum in the band. Lacking -band data for the maximum, the reddening can be estimated only from color at , providing =3.66 from Eq.(1). From this and the extremely fast decline times listed in Table 3, the distance to this nova would turn unconfortably large, 30 kpc, placing it far beyond the Galactic Bulge against which it is seen projected, at a hight of 2 kpc above the Galactic plane. This is clearly an unlikely location.

The color measured for this nova at seems strongly influenced by the presence of the cool giant, the severe crowding and the contribution by recombining flash-ionized wind of the companion, to the point of fooling the comparison with van den Bergh and Younger (1987) intrinsic colors. For similar reasons the brightness at 15 days (=16.35 mag) appears useless in estimating the distance. If for the extinction we adopt instead the values given by SFD98 and SF11 and reported in Table 3, the distance to the nova results in 5.4 and 9.4 kpc, respectively. In Table 3 we list the average 7.4 kpc value, well compatible with a partnership to the Galactic Bulge.
It is worth noting that the lightcurve of V1534 Sco displays a distinctive hiccup marked by the red arrow in Figure 2. Its strength is wavelength-dependent, descreasing from to band. For sake of discussion, we have fitted the -band lightcurve of V1534 Sco with the combination of two sources: the flash-ionized wind of the cool giant and the expanding nova ejecta. The latter is obtained as the difference (computed in the flux space) between the observed lightcurve and the exponential decline from the flash-ionized wind. In Figure 3 we present the results for a recombination -folding time of 3 days, corresponding to an electron density of 1.5107 cm-3 at the peak of the ionization and assuming an electron temperature of 10 000 K. The fit looks excellent, but this is hardly a proof of its uniqueness. Given the fact that the near-IR observations by Joschi et al. (2015) did not detected a decelleration of the ejecta, it makes sense to treat the lightcurve derived in Figure 3 for the expanding ejecta as that of the nova proper. In this case the band maximum was reached on JD=2456747.0 at magnitude 13.8, with a decline rate 13 days. Adopting the larger extinction from SFD98, the distance (10 kpc) would still be compatible with a partnership to the Bulge (the fainter apparent magnitude is compensated for by a similarly fainter absolute value implied by the slower decline rate).
4.3 V1535 Sco

V1535 Sco (= Nova Sco 2015 = PNV J17032620-3504140) was discovered by T. Kojina on 2015 Feb 11.837 (CBET 4078) and soon confirmed spectroscopically by Walter (2015) as an He/N nova. Nelson et al. (2015) performed X-ray and radio observations within a few days of discovery, and found the initial presence of hard, absorbed X-rays and synchrotron radio emission that suggested the nova erupted in a symbiotic binary, with collision between the ejecta and the cool giant wind shock-heating plasma and accelerating particles. The suggestion about the presence of a cool giant companion was made also by Walter (2015). The synchrotron radio component rapidly declined during the following days while more conventional thermal free-free emission emerged (Lindford et al. 2015). Near-IR spectral monitoring by Srivastava et al. (2015a,b) revealed a progressive narrowing of the never-too-broad emission lines from FWHM2000 down to 500 km/s, indicating a decelerating shock as the nova ejecta collide with and are slowed down by the wind of the giant companion. The extra brightness of the progenitor in quiescence H Super-COSMOS images was taken by Srivastava et al. (2015b) as a further evidence of a symbiotic nature. Linear polarization measurements in BVRI bands at seven consecutive dates in February were reported by Muneer, Anupama and Raveendran (2015) who concluded that, even if not corrected for interstellar polarization, the data support intrinsic polarization.
4.3.1 The lightcurve
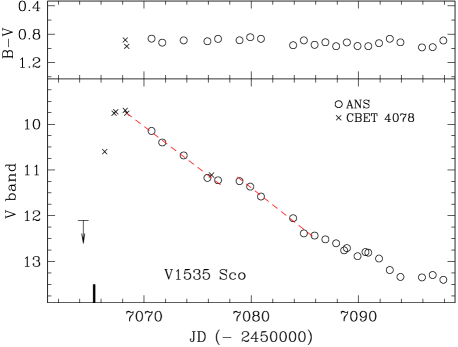
The lightcurve resulting from our year-long monitoring of V1535 Sco is presented in Figure 4, and the basic nova parameters are summarized in Table 3.
The overall lightcurve of V1535 Sco looks pretty standard, with a faster decline during the initially optically thick conditions followed by a slower descent during the later optically thin phase. The transition from optically thick to thin ejecta occoured 27 days past and mag=3.60 below the -band maximum. Such a well behaving transition is usually seen in FeII novae (eg. McLaughlin 1960), but much less frequently in He/N novae. The latter usually expel less material at larger velocity and higher ionization compared to FeII counterparts, and their ejecta reach optically thin conditions much closer to maximum brightness.
A noteworthy feature of the lightcurve is the temporary dip that the nova went through around April 8 (JD=2457121), which developed at constant colors during the optically thin phase, as if for some time the ejecta were exposed to a lower flux of ionizing photons from the central source. A second, wider, and stronger dip which occoured in mid-September (around JD=2457280), was instead strongly color-dependent. Their interpretation would require access to a detailed spectroscopic monitoring that we lack. Overall, the lightcurve of V1535 Sco during the optically thin phase has been ”bumpy”, well beyond the measurement errors.
Figure 5 zooms on the early portion of the -band lightcurve, to highlight the plateau lasting a couple of days around Feb 24, or ten days past and 1.5 mag below optical maximum. Two possible interpretations come to mind, but both have their shares of problems.
First, the plateau could represent the same type of transition discussed in Figure 3 above for V1534 Sco, namely the emission from expanding ejecta overtaking that of flash-ionized wind of the cool companion. This contrasts with the long delay past maximum, requiring a rising time to maximum for the ejecta (10 days) which is more typical of FeII events than He/N for which it is generally an order of magnitude faster. This could be counter-argumented by noting that () the initial He/N spectral classification for V1534 Sco could have been fooled by the dominating emission from the flash-ionized wind, and () the narrowness of the emission lines, their Gaussian-like shapes and the presence of P-Cyg absorptions observed in the near-IR by Srivastava et al. (2015b) are more typical of FeII novae, while He/H tend to show much broader and rectangular emission lines with no P-Cyg absorption components (Banerjee & Ashok 2012). It will be interesting to carefully inspect, when they will be eventually published, optical spectra taken over a protracted interval of time to ponder the spectral classification of the expanding nova ejecta separately from that of the flash-ionized wind.

Secondly, a similar plateau has been sometimes observed in novae during the super-soft phase, when optically thin ejecta are exposed to the hard radiation field of the central white dwarf still burning nuclearly at its surface. The consequent input of ionizing photons spreading through the ejecta counter-balances the recombination of ions. The plateau is usually terminated by either rapid dilution in fast expanding and low mass ejecta (as observed during the 2016 outburst of the recurrent nova LMC 1968, Munari et al. 2016a), or by switching off the nuclear burning on the WD (as in U Sco, Osborne et al. 2010). The problem in this case is that the plateau occoured two weeks before the ejecta turned optically thin on day 27 past optical maximum. A way out could be a highly structured, non-spherical shape of the ejecta, with optical thickness strongly dependent on angular coordinates. Hints in favor of such an arrangement are the fact that the nova erupted within the pre-existing wind of the giant companion, and optical (Walter 2015) as well as near-IR (Srivastava et al. 2015b) spectra which present weak emission components separated from the corresponding main ones.
The reddening estimated from nova colors and the total extinction along the line of sight deduced from SFD98 and SF11 maps are in excellent agreement (Table 3), and the derived distance places V1535 Sco at the distance of the Galactic Bulge against which it is seen projected.
4.4 V2949 Oph
V2949 Oph (= TCP J17344775-2409042 = Nova Oph 2015 N.2) was discovered on 2015 Oct 11.41 by K. Nishiyama and F. Kabashima (CBET 4150), and confirmed spectroscopically on Oct 12.42 by Ayani (2015). Low expansion velocity, heavy reddening and a Fe-II spectral class was reported by Campbell et al. (2015) from Oct 11 spectroscopic observations, while Littlefield and Garnavich (2015) from Oct 11.99 observations estimated in 900 km/s the FWHM of H emission and 800 km/s the velocity of its P-Cyg absorption component.
4.4.1 The lightcurve
Our lightcurve for V2949 Oph in presented in Figure 6. We begun the observations as night settled on Oct 12.98, soon after spectroscopic confirmation was circulated, and continued them until Nov 9, when Solar conjunction prevented further data to be collected. This is the only program nova that was not observed also in band.
The lightcurve shows the nova fluctuating by 2 mag around maximum brightness. Similar peak brightness was reached on Oct 12.38 at =11.41 and on Nov 7.99 at =11.76. The first has been taken - somewhat arbitrary - as the true maximum, so that the brightness 15 days past it can be used to estimate a distance of 8.4 kpc (cf. Table 3), which places the nova right at the distance of the Galactic center. The reddening resulting from color around maximum (cf. Figure 6) indicates an extinction 4.9, uncomfortably in excess of the total value along the line of sight 3.39 from SFD98 and 2.88 from SF11 maps. Because the very few magnitudes used in this exercise are not ours and come instead from VSNET observers (who did not provide details on their data reduction procedures and adopted comparison sequence), we will make no further use of these -band data.
4.5 V3661 Oph

V3661 Oph (= PNV J17355050-2934240 = Nova Oph 2016) was discovered in outburst by H. Yamaoka on Mar 11.81 (CBET 4265). A preliminary spectroscopic classification as a nova was derived by Munari et al. (2016b) from a very low S/N spectrum, with later IR and optical spectra by Srivastava et al. (2016) and Frank et al. (2016) fixing the spectral class to FeII. All three spectral sources concur on a highly reddened continuum, FWHM1000/1400 km/s for Balmer emission lines and a velocity separation of 950 km/s between the emission and absorption components of the P-Cyg profile affecting most of the lines. A pre-discovery OGLE-IV observation at =12.15 on March 8.31 was reported by Mroz & Udalski (2016a) who noted the absence of the progenitor in OGLE deep template images, meaning it was fainter than 22 mag in band. A pre-discovery observation by ASAS-SN of the nova on March 10.85 has been noted by Chomiuk et al. (2016). Finally, Muneer & Anupama (2016) reported significant linear polarization in photometric observations of V3661 Oph obtained from March 13 to 19, that they interpret as arising primarily in the interstellar medium given the high reddening suffered by the nova.

4.5.1 The lightcurve
Our lightcurve for V3661 Oph is presented in Figure 7, and the basic nova parameters are summarized in Table 3 as for the other program objects.
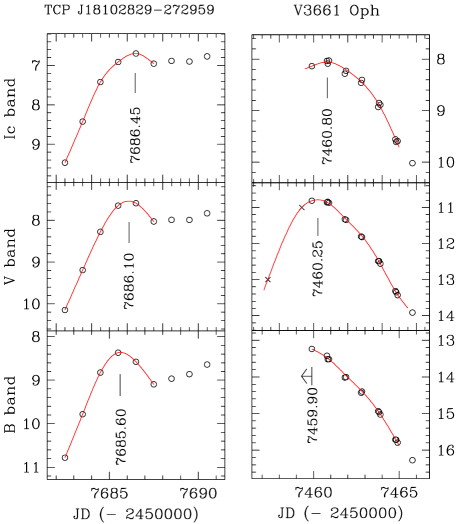
The lightcurve looks particularly well behaving, almost a textbook example for a FeII nova. The clear dependence on wavelength of the time of maximum brightness will be discussed in sect. 5 below, in parallel with the similar case for TCP J18102829-2729590. The transition from optically thick to thin ejecta occoured 6.0 days past and mag=3.35 below -band maximum.
With =3.9 and =5.7 days, V3661 Oph is probably the fastest known nova of the FeII type, and a very fast one even compared with He/N recurrent novae like U Sco. It is by far the nova with the reddest colors and therefore the highest extinction among the program ones, with a mean observed color 6.25, as averaged along the whole lightcurve. SFD98 and SF11 maps also suggest an extremely large total extinction along the line of sight to V3661 Oph. Finally, the short distance derived for this nova places it much closer than the Bulge and within the Galactic disk.
4.6 MASTER OT J010603.18-744715.8
MASTER OT J010603.18-744715.8 was discovered (at unfiltered 10.9 mag) on 2016 Oct 14.19 by the MASTER-OAFA autodetection system and announced by Shumkov et al (2016) on Oct 14.34. ANS Collaboration monitoring begun on Oct. 14.51. Detection of the progenitor at mean =20.84 and ()=+0.16 on archive OGLE-IV observations was reported by Mroz and Udalski (2016b), with hints of semi-regular variability of a timescale of 20-30 days.
Lipunov et al. (2016) found pre-discovery MASTER images that show how the nova was already declining from maximum when first noticed. An image for Oct 9.81 recorded the nova at (unfiltered) 8.5 mag, declining to 8.9 mag on Oct 11.07 and 9.3 mag on Oct 12.16. Robotic DSLR-camera monitoring of the SMC was inspected by Jablonski & Oliveira (2016) to obtain the (unfiltered) brightness profile of the rise toward maximum of the nova during Oct 9. The nova was fainter than 13.2 mag on Oct 9.197, first detected at 12.9 mag on Oct 9.210, and last measured at 9.90 mag on Oct 9.325.
Spectroscopic confirmation was obtained by Williams & Darnley (2016a) on Oct 14.70. They measured FWHM3700 km/s for Balmer lines and classified the nova type as He/N. Following their description of the observed emission lines, the signatures in favor of a He/N class appears however weaker than typical for this type, with some room left for a FeII classification. Darnley & Williams (2016b) reported on their continued spectroscopic monitoring of the nova till Oct 29, noting the disappearance of P-Cyg absorptions and the emergence of HeI 5876, 7065 and of OIII 4959/5007, from which they infer the nova had entered the nebular phase. It should be noted that the presence of HeI emission lines at the time OIII emerges is standard for FeII novae, and that presence of P-Cyg absorption and OIII nebular lines are more typical of FeII than He/N novae (Williams 1992). In addition, the FWHM3700 km/s observed for Balmer lines is close to the low limit for typical He/N novae while still well suited for FeII ones.
Nova MASTER OT J010603.18-744715.8 has been intensively monitored in X-rays. Early Swift observations on Oct 15 failed to detect X-ray emission (Kuin et al. 2016). Rapidly brightening soft X-ray emission was detected by Swift starting with Nov 7 (Page et al. 2016). Chandra observations for Nov 17-18 (Orio et al. 2016a) confirmed the super-soft bright emission, which continued well into the Chandra observation for 2017 Jan 4 (Orio et al. 2016b), when a preliminary fit to the spectra supports an increase from 650,000 to 750,000 K for the temperature of the white dwarf.
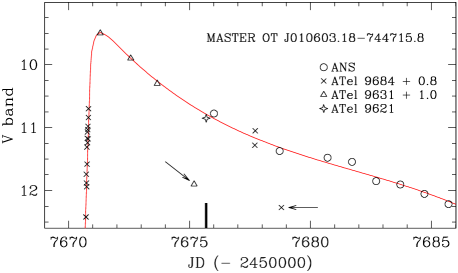
4.6.1 The lightcurve
The lightcurve of MASTER OT J010603.18-744715.8 is particoularly simple and smooth, and it is presented in Figure 8, with the basic parameters extracted from it summarized in Table 3. Figure 9 zooms on the phase of maximum, which was very brief with an extremely fast rise toward it, as pre-discovery observations by Lipunov et al. (2016) and Jablonski & Oliveira (2016) help to constrain. These unfiltered observations (i.e. white light, and therefore strongly skewed toward red wavelengths where CCD sensitivity peaks) require a large color correction to be properly plotted on the -band plane, because of the remarkably blue colors for the nova resulting from the very low reddening toward SMC. The color corrections are given in Figure 9, and have been derived by continuity in comparison with our properly calibrated photometry. The latest observation listed by both Lipunov et al. (2016) and Jablonski & Oliveira (2016) are clearly off the otherwise well behaving lightcurve of the nova (the two arrows in Figure 9 point at them), and are ignored as erroneous data.
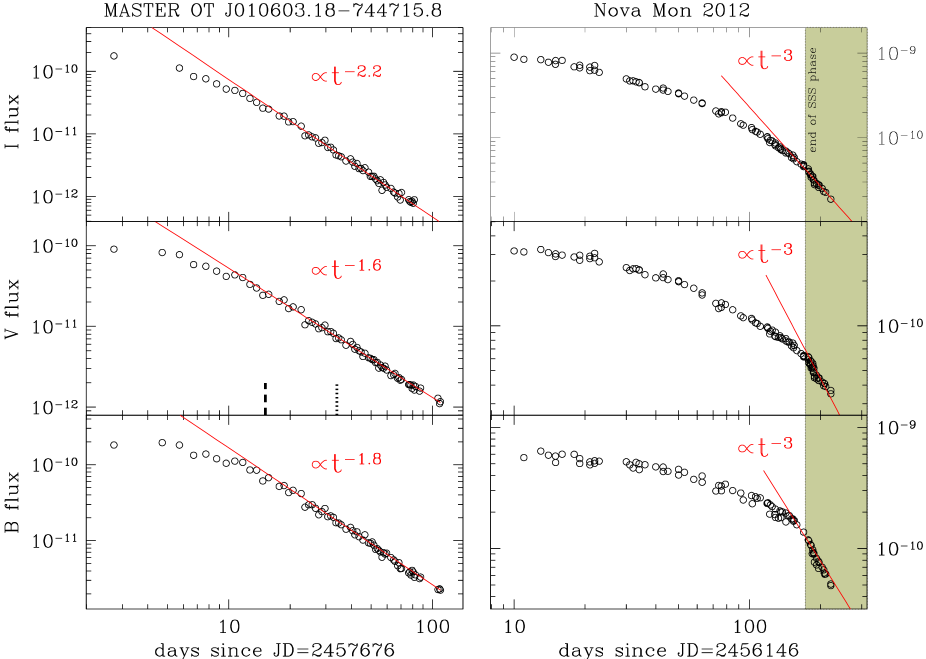
4.6.2 Super-soft X-rays and rate of decline
Our data are transformed into absolute fluxes (erg cm-2 s-1) and log-log plotted against time on the left panel of Figure 10. For a comparison, the same is done on the right panel for Nova Mon 2012 (data from Munari et al. 2013a). The shaded area in the figure marks the time after the super-soft X-ray emission had ceased (Nelson et al. 2012, Page et al. 2013). The phase of super-soft X-ray emission corresponds to optically thin ejecta permeated by the hard radiation from the central white dwarf undergoing stable nuclear burning at its surface (Krautter 2008, Schwarz et al. 2011). Such ionizing radiation partially counter-balance the recombination in the expanding ejecta, keeping high their emissivity and flattening the decline rates. When, with the end of the super-soft phase this hard radiation input ends, the emissivity of the ejecta rapidly settles onto the pure recombination rate , which is precisely what Nova Mon 2012 duly did. For MASTER OT J010603.18-744715.8, as soon as it entered the nebular phase and super-soft X-ray emission emerged (Williams and Darnley 2016b, Page et al. 2016), the decline in flux rapidly settled on a rate kept stable for all the period covered by our observations: , and , for , and respectively. The rates are slightly different from band to band, depending on the fractional contribution of continuum and emission lines, which decline at different speed as the degree of ionization and electron density change through the ejecta. The fact that these rates are much flatter than is interpreted as an evidence that nuclear burning was still up and running on the surface of the central WD at the time of our last observations. When the nuclear burning will eventually end, it is expected that the decline in brightness of MASTER OT J010603.18-744715.8 will accellerate to , as seen in Nova Mon 2012.
4.7 TCP J18102829-2729590
TCP J18102829-2729590 was discovered on 2016 October 20.383 at 10.7 mag by K. Itagaki (cf. CBET 4332). Mroz et al. (206) derived astrometric coordinates from OGLE-IV -band images as RA=18:10:28.29 and DEC=27:29:59.3, and noted that the progenitor is undetected in pre-outburst OGLE deep template images, meaning 22 mag. Spectroscopic classification as a FeII-class nova was obtained by Lukas (2016). -ray emission from this nova has been detected by Fermi-LAT (Li & Chomiuk 2016).
4.7.1 The lightcurve
Our daily-mapped lightcurve of TCP J18102829-2729590 is shown in Figure 11. It extends over a whole month and fully covers the phase of maximum brightness and decline well past . It is real smooth and characterized by a rapid initial rise and two distinct maxima. Our monitoring was stopped by Solar conjunction when the nova was still bright. As for the other novae, the parameters extracted from the lightcurve are listed in Table 3. The distances derived from , are are dependent from which of the two maxima is taken as reference. The average of the values listed in Table 3 is 8.1 kpc, right that of the Bulge against which the nova is seen projected. The partnership to the Bulge is confirmed by the photometric reddening of the nova that equals the total extinction along the line of sight from the 3D maps of SFD98 and SF11.
There is a striking difference between the two maxima displayed by TCP J18102829-2729590: the first one is markedly wavelength dependent, the other is not.
The wavelength dependence of the first maximum manifests in a time-delay of 1 day between peak brightness in and bands, as noted above for V3661 Oph. As discussed in sect. 5 below, this is a characteristic of the initial fireball expansion of the ejecta, with maximum representing the time of largest angular extension for the pseudo-photosphere that is optically thick at the given wavelength. The independence from wavelength of the second maximum suggests it is of a different physical nature, which will be discussed in sect. 6 below.

4.8 ASASSN-16ma
ASASSN-16ma was discovered at 13.7 in ASASSN-CTIO images obtained on 2016 Oct 25.02, brightened to 11.6 a day later and was undetected (17.3) on Oct 20.04 (Stanek et al. 2016). Its coordinates were originally given as RA=18:20:52.12 and DEC=28:22:13.52, which Saito et al. (2016) adopted to identify the likely progenitor in the VVV Survey, as a source possibly consisting of two unresolved components of combined brightness = 18.8, = 18.5, = 18.1, = 17.8, and = 17.6 mag. Mroz et al. (2016) remeasured the position of the nova on OGLE-IV -band images and derived a different astrometric position RA=18:20:52.25 and DEC=28:22:12.1, which is 2.4 arcsec away from the initial ASASSN-CTIO one. The progenitor is not visible in pre-outburst OGLE-IV survey images, meaning that is was fainter than 22 mag and, therefore, the star proposed by Saito et al. is an unrelated field star.
A low resolution spectrum obtained on Oct 27.5 by Luckas (2016) showed the object to be a FeII-class nova. A month later, on Nov 23.1, Rudy et al. (2016) obtained an optical/near-IR spectrum of ASASSN-16ma that confirmed the FeII classification and was characterized by prevailing low-expansion velocity and low-excitation conditions. -ray emission from ASASSN-16ma was discovered by Li, Chomiuk & Strader (2016) while they were monitoring with Fermi-LAT the nearby nova TCP J18102829-2729590, described in the section above. ASASSN-16ma remained undetected by Fermi-LAT until Nov 8 (JD=2457701) when it suddenly turned into a strong -ray source, remaining active (although declining) for the following 9 days (Li et al. 2016).


4.8.1 The lightcurve
Our daily-mapped lightcurve of ASASSN-16ma is shown in Fig. 12. It extends over a whole month and covers the initial rise, the phase of maximum and decline well past . Our monitoring was stopped by Solar conjunction when the nova was still bright. A zoomed view of the initial rise in brightness is given in Figure 13, where our -band observations are combined with literature data.
The lightcurve of ASASSN-16ma started as a simple one. The two observations for November 4.0 and 5.0 (JD=2457696.5 and 97.5) are highlighted with filled dots in Figure 12. They are characterized by the same dependence on wavelength as for the maximum brightness of V3661 Oph (Figure 7) and the first maximum of TCP J18102829-2729590 (Figure 11), namely a time delay of 1 day between the maximum in and bands. We believe these filled dots trace the normal fireball maximum ASASSN-16ma initially went through. In support of this interpretation it is worth noticing that for the two -ray program novae, both belonging to the Bulge and affected by a similarly low reddening, the first maximum occurred at a similar brightness: =8.1 for ASASSN-16ma and =7.6 for TCP J18102829-2729590.
Soon after the passage through the fireball maximum, ASASSN-16ma raised to a second and brighter maximum, composed by two peaks. As for TCP J18102829-2729590, the distance to ASASSN-16ma derived from , and depends from which of these two peaks is taken as reference. Choosing the first one (at JD=2457700.5) returns a distance shorter than that of the Bulge, and a larger one selecting the second (at JD=2457707.5). The average is 8.3 kpc, placing also ASASSN-16ma at the distance of the Bulge against which the nova is seen projected. Similarly to TCP J18102829-2729590, the partnership to the Bulge is confirmed by the photometric reddening of ASASSN-16ma that equals the total extinction along the line of sight from the 3D maps of SFD98 and SF11. As for TCP J18102829-2729590, the second maximum displayed by ASASSN-16ma is discussed in section 6 below.
5 The fireball expansion
The initial photometric evolution of a nova is characterized by the rise toward maximum, the maximum itself, and the settling onto decline. The rise toward maximum is rarely mapped at optical wavelengths (Seitter 1990), because it is usually very fast (a matter of few days or even hours) and the discovery of the nova has a higher chance to occur when the object is at peak brightness (especially so in crowded fields).
Nonetheless, sometimes the conditions are just right to cover the transit of a nova through optical maximum. For the seven program novae, this is the case for TCP J18102829-2729590 and V3661 Oph, and marginally so for others. Figure 14 presents a zoom on their lightcurves around optical maximum. The obvious feature is how the maximum brightness occurs at later times with increasing wavelength.
The flux density emitted by the ejecta of the nova expanding as an homogeneous, ionized plasma is:
| (2) |
where is the Planck function, is the linear dimension of the ejecta that scales as , is the distance to the nova and is the free-free optical depth from bremsstrahlung of electrons. Following Altenhoff et al. (1960) and Mezger & Henderson (1967), goes as
| (3) |
where and are the electron density (cm-3) and temperature (K), is the frequency in units of 109 Hz, and the emission measure is in pc cm-6. The time delay between maximum brightness reached in different photometric bands can be then expressed as
| (4) | |||||
with
| (5) |
where is the ejected mass and the ejection velocity. This time delay is the same reason responsible for the maximum thermal radio emission to be reached years past optical maximum (Hjellming 1974). The timings given in Figure 14 correspond to =0.85 and 0.90 for TCP J18102829-2729590 and V3661 Oph, respectively. This is close to what expected from Eq.(4) for typical values of , and adopted in computing .
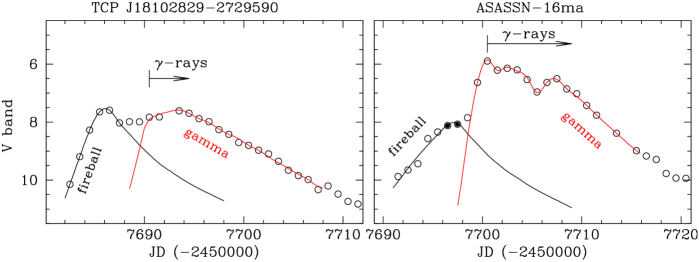
6 A second lightcurve component paralleling the emission in -rays
The lightcurve of the two -ray program novae, TCP J18102829-2729590 and ASASSN-16ma, is characterized by the distinct presence of two components, which are highlighted in Figure 15. The initial or fireball component produces a passage through maximum that is dependent on wavelength as described in the previous section. The second component appears at a later time and peaks simultaneously with the detection of the nova in -rays (for which reason we term it gamma) and gives origin to a second maximum which is not wavelength dependent.
The gamma component of the optical lightcurve behaves synchronously with the emission observed in -rays. The preliminary analysis by Li et al. (2016) of the daily averaged -ray behavior of ASASSN-16ma, shows a sudden detection coincident with peak flux on November 8 (JD=2457700.5) followed by a general decline along the following nine days, with a significant 1-day -ray flux dip observed on November 13 (JD=2457705.5). The gamma component of the optical lightcurve in Figure 15 presents exactly the same behavior: a maximum on November 8 and a general decline for the following nine days with a 1-day brightness dip centered on November 13. Not only the shapes but also the flux ratios behaved in parallel. In fact, during the nine days of general decline, the -ray flux changed by a factor of 3, from 9.7 (1.3) to 3.4 (2.1) 10-7 ph cm-2 s-1 (Li et al. 2016), and over the same period of time the flux through the -band also declined by a factor of 3, from =5.89 to =7.02. Once the daily -ray behavior of TCP J18102829-2729590 will become available, it will be interesting to explore if a similar degree of parallelism with the gamma component of its optical lightcurve was followed too.
As a further evidence of the link between the -ray emission and the gamma component of the lightcurve, it is worth noticing that the reported mean -ray flux of ASASSN-16ma (Li and Chomiuk 2016) is 2.5 higher than for TCP J18102829-2729590 (Li et al. 2016). Well, the reddening corrected mean flux of the gamma component of the two novae in Figure 15 is exactly in the same 2.5 ratio, or =5.19 and =6.15 for ASASSN-16ma and TCP J18102829-2729590, respectively.
A difference of 2.5 in the mean -ray flux for the two program novae, both belonging to the Bulge, seems to disprove the common belief (eg. Ackermann et al. 2014), that () the intrinsic -ray brightness is similar among normal novae, () they can be detected by Fermi-LAT over only limited distances from the Sun, and therefore () -ray emission is a widespread (if not general) property of novae. Judging from ASASSN-16ma and TCP J18102829-2729590, it appears instead that novae can be firmly detected by Fermi-LAT up to and beyond the Galactic Bulge, and their intrinsic brightness in -rays can differ greatly. Combining this with the relatively low number of normal novae detected to date by Fermi-LAT (6 novae in total have been detected in -rays, in contrast to the 69 discovered optically in the same period, cf Morris et al. 2017), it is tempting to conclude that -ray emission is not a wide-spread property for them.
The two-component lightcurve here described for the program -ray novae brings to mind the two-component ejecta adopted to model the radio-interferometric observations of some recent novae (Chomiuk et al. 2014, Weston et al. 2016), a faster polar wind collides with a slower (and pre-existing ?) equatorial density enhancement. This scenario applies however to radio observations extending for months past the initial eruption. The second or gamma component of the optical lightcurve of program -ray novae develops instead within a few days of the initial fireball component, and could therefore trace something different in the kinematical and geometric arrangment of the ejecta. We postpone to a future paper a quantitative modeling of our two-component lightcurve for -ray novae to include similar data for additional objects and therefore reinforce the statistics.
7 Progenitors
At the position of the four program novae V2949 Oph, V3661 Oph, TCP J18102829-2729590, and ASASSN-16ma no progenitor is visible in deep OGLE -band images or DSS plates, which set the minimal outburst amplitudes listed in Table 3. For all of them, a progenitor containing a giant or a sub-giant companion, would have been brighter in band than the completeness limit of 2MASS survey in the respective areas, suggesting their donor star is a dwarf. For the remaining three program novae (V1534 Sco, V1535 Sco and MASTER OT J010603.18-744715.8) a progenitor has been proposed based on positional coincidence with pre-outburst surveys. We consider in turn these three novae.


7.1 V1534 Sco
Joschi et al. (2014) proposed 2MASS 17154687-3128303 as the progenitor of nova V1534 Sco. At =11.255(0.042), =10.049(0.039), and =9.578(0.035), it lies at 0.6 arcsec from the position of the nova reported by SIMBAD. By fitting with a black-body only its 2MASS and WISE infrared energy distribution, Joschi et al. (2014) classified the star as an M5III giant, reddened by =0.9.
In Figure 16 we present the observed spectral energy distribution (SED) of the progenitor of V1534 Sco. To the 2MASS and WISE infrared data considered by Joschi et al. (2014), we add =14.22 mag from DENIS and =17.20 mag from SuperCOSMOS catalogues. We have not been able to find quiescence and data. As noted above in sect. 4.2.1, at latest stages the lightcurve of V1534 Sco became completely flat, with asymptotic values 19.6, 18.3, and 14.3. The latter is practically identical to the pre-outburst DENIS =14.22 mag value, suggesting that these asymptotic values could be viable proxies for the brightness in quiescence. We therefore added the asymptotic and values to the SED of Figure 16. There we over-plot to the nova the SEDs of G3III-M6III giants, compiling their optical/IR intrinsic colors from Koornneef (1983), Bessell (1990), and Fluks et al. (1994). The SEDs of giants are reddened according to the total extinction along the line of sight to V1534 Sco (cf. Table 3) as derived from 3D maps of SFD98 and SF11. We have already seen in sect. 4.2.1 how these values for the extinction lead to a correct distance to the nova. They have been transformed into the corresponding and following the relations calibrated by Fiorucci & Munari (2003) for M-type giants.
The best fit to data in Figure 16 is obtained with an M3III for =1.63 and an M1III for =1.95. Overall, the fit with the M3III is somewhat better. This is minimally dependent on bands, while are far more relevant. The fit with the M3III provides a distance of 8.2 kpc, while that with the M1III drops down to 5.0. Considering the partnership of the nova with the Bulge, we conclude that the progenitor of Nova V1534 Sco is well represented by an M3III cool giant reddened by =1.63.
The and points lie above both fit attempts in Figure 16. There are at least three suitable explanations for this: (1) the asymptotic and values are still influenced by emission from the nova ejecta, (2) the severe crowding which fooled the derivation in sect. 4.2 of from nova photometry is affecting the and brightness of the progenitor too, and (3) ionization of the cool giant wind by the WD produces extra-flux at and wavelengths. It is in fact well known how the UBV colors of symbiotic stars are much bluer than those of the M giants they harbour (cf. the UBVRI-JHKL photometric surveys of known symbiotic stars by Munari et al. 1992 and Henden & Munari 2008), because of the contribution at shorter wavelengths by the emission from circumstellar ionized gas.
7.2 V1535 Sco
Srivastava et al. (2015) proposed 2MASS 17032617-3504178 (=13.40, =12.53, and =12.22) as the progenitor. This star is positionally concident to better than 0.1 arcsec with the nova, with a Gaia Data Release 1 source of =14.392 mag, and a DENIS counterpart with =15.24 mag.
In Figure 17 we plot the observed SED for the progenitor of V1535 Sco, combining 2MASS and WISE infrared data, to which we have added =15.24 mag from DENIS, =17.05 mag from the YB6 Catalog (USNO, unpublished; accessed via Vizier at CDS) and =16.33 from SuperCOSMOS. We have considered the fit with the same family of energy distributions of G3III-M6III giants already used in Figure 16 for V1534 Sco, this time reddened by the same =1.03 derived and discussed above for the nova. The fit is clearly unsatisfactory at optical wavelengths, implying quite blue intrinsic colors for the progenitor. At the distance given in Table 3 for the nova, the absolute magnitude of the progenitor would be M(K)=2.9, which is that expected for a K3-4III giant. Such a classification was one of the alternatives (the other being an M4-5III) considered by Srivastava et al. (2015).
Although rare, the symbiotic stars with K giants account for 10% of the total in the catalog by Belczyński et al. (2000). The optical colors of some of them (cf Munari et al. 1992, Henden & Munari 2008) are strongly affected by the blue emission of the K giant wind ionized by the radiation from the WD companion, and this could easily be a viable interpretation for the progenitor of V1535 Sco.
7.3 MASTER OT J010603.18-744715.8
Mroz et al. (2016) reported the progenitor was clearly visible in OGLE-IV survey images at equatorial coordinates R.A.=01:06:03.27, Decl. =74:47:15.8 (J2000.0), =20.84 mean magnitude and =+0.16 color. They add that it showed semi-regular variability on a timescale of 20-30 days. The blue color reflects into the non-detections by 2MASS and WISE infrared surveys.
At a distance of 1.03 arcsec from the OGLE position there is a GALEX source of magnitudes FUV=20.529(0.331) and NUV=20.573(0.205), the second closest GALEX source being 30 arcsec away. The astrometric proximity and compatible magnitudes and colors, suggest that the OGLE and GALEX sources are the same star, of blue colors consistent with those of a disk-dominated source.
Adopting the =0.08 reddening and 61 kpc distance to SMC listed by Mateo (1998), the absolute magnitude of the progenitor is =1.8, which suggests a sub-giant as the donor star. A giant of the T CrB type would shine at 0.5 (Sowell et al. 2007), while the mean magnitude for novae with dwarf companions is 4.5 (Warner 1995). The presence of a sub-giant is consistent with the non-detection of the progenitor during the 2MASS survey.
8 Acknowledgements
We would like to thank S. Dallaporta, F. Castellani, G. Alsini and R. Belligoli for some check observations carried out on the program targets.
References
- Ackermann et al. (2014) Ackermann M., et al., 2014, Sci, 345, 554
- Altenhoff et al. (1960) Altenhoff W., Mezger P. G., Strassl H., Wendker H., Westerhout G., 1960, Veroff Sternwarte Bonn 59, 48
- Ayani (2015) Ayani K., 2015, IAUC, 9279, 3
- Ayani & Maeno (2014) Ayani, K., Maeno, S., 2014, CBET, 3841, 1
- banerjee (2012) Banerjee D.P.K., Ashok, N.M., 2012, BASI, 40, 243
- Bessell (1990) Bessell M. S., 1990, PASP, 102, 1181
- Belczyński et al. (2000) Belczyński K., Mikołajewska J., Munari U., Ivison R. J., Friedjung M., 2000, A&AS, 146, 407
- Bode & Evans (2012) Bode M. F., Evans A., 2012, eds., Classical Novae, Cambridge University Press
- Buscombe & de Vaucouleurs (1955) Buscombe W., de Vaucouleurs G., 1955, Obs, 75, 170
- Campbell et al. (2015) Campbell H., et al., 2015, ATel, 8155,
- Capaccioli et al. (1989) Capaccioli M., della Valle M., Rosino L., D’Onofrio M., 1989, AJ, 97, 1622
- Chomiuk et al. (2014) Chomiuk L., et al., 2014, Nature, 514, 339
- Chomiuk et al. (2016) Chomiuk L., Strader J., Stanek K. Z., Kochanek C. S., Holoien T. W.-S., Shappee B. J., Prieto J. L., Dong S., 2016, ATel, 8841,
- Cousins (1980) Cousins A. W. J., 1980, SAAOC, 1, 166
- Downes & Duerbeck (2000) Downes R. A., Duerbeck H. W., 2000, AJ, 120, 2007
- Duerbeck (2008) Duerbeck H. W., 2008, in Classical Novae, M.-F. Bode and Evans eds., Cambridge University Press, pag. 1
- Fiorucci & Munari (2003) Fiorucci M., Munari U., 2003, A&A, 401, 781
- Fitzpatrick (1999) Fitzpatrick E. L., 1999, PASP, 111, 63
- Fluks et al. (1994) Fluks M. A., Plez B., The P. S., de Winter D., Westerlund B. E., Steenman H. C., 1994, A&AS, 105, 311
- Frank et al. (2016) Frank S., Wagner R. M., Starrfield S., Woodward C. E., Neric M., 2016, ATel, 8817,
- Graham (1982) Graham J. A., 1982, PASP, 94, 244
- Henden et al. (2012) Henden A. A., Levine S. E., Terrell D., Smith T. C., Welch D., 2012, JAVSO, 40, 430
- Henden & Munari (2008) Henden A., Munari U., 2008, BaltA, 17, 293
- Henden & Munari (2014) Henden A., Munari U., 2014, in Observing Techniques, Instrumentation and Science for Meter-Class Telescopes, T. Pribulla ed., CoSka, 43, 518
- Hjellming (1974) Hjellming R. M., 1974, in Galactic and Extra-Galactic Radio Astronomy, G.L. Verschuur and K.I. Kellermann eds., Springer-Verlag New York, pag. 159
- Jablonski & Oliveira (2016) Jablonski F., Oliveira A., 2016, ATel, 9684,
- Jelinek et al. (2014) Jelinek M., Cunniffe R., Castro-Tirado A. J., Rabaza O., Hudec R., 2014, ATel, 6025,
- Johnson & Morgan (1953) Johnson H. L., Morgan W. W., 1953, ApJ, 117, 313
- Joshi et al. (2014) Joshi V., Banerjee D. P. K., Venkataraman V., Ashok N. M., 2014, ATel, 6032,
- Joshi et al. (2015) Joshi V., Banerjee D. P. K., Ashok N. M., Venkataraman V., Walter F. M., 2015, MNRAS, 452, 3696
- Koornneef (1983) Koornneef J., 1983, A&A, 128, 84
- Krautter (2008) Krautter J., 2008, ASPC, 401, 139
- Kuin et al. (2016) Kuin N. P. M., Page K. L., Williams S. C., Darnley M. J., Shore S. N., Walter F. M., 2016, ATel, 9635,
- Kuulkers et al. (2014) Kuulkers E., Page K. L., Saxton R. D., Ness J.-U., Kuin N. P., Osborne J. P., 2014, ATel, 6015,
- Landolt (1992) Landolt A. U., 1992, AJ, 104, 340
- Landolt (2009) Landolt A. U., 2009, AJ, 137, 4186
- Li & Chomiuk (2016) Li K.-L., Chomiuk L., 2016, ATel, 9699,
- Li, Chomiuk, & Strader (2016) Li K.-L., Chomiuk L., Strader J., 2016, ATel, 9736,
- Li et al. (2016) Li K.-L., Chomiuk L., Strader J., Cheung C. C., Jean P., Shore S. N., Fermi Large Area Telescope Collaboration, 2016, ATel, 9771,
- Linford et al. (2015) Linford J., et al., 2015, ATel, 7194,
- Lipunov et al. (2016) Lipunov V., et al., 2016, ATel, 9631,
- Littlefield & Garnavich (2015) Littlefield C., Garnavich P., 2015, ATel, 8156,
- Luckas (2016) Luckas P., 2016, ATel, 9678,
- Lukas (2016) Lukas P., 2016, ATel, 9658,
- McLaughlin (1960) McLaughlin D. B., 1960, in Stellar Atmospheres. J. L. Greenstein ed., University of Chicago Press, 585
- Mateo (1998) Mateo M. L., 1998, ARA&A, 36, 435
- Mezger & Henderson (1967) Mezger P. G., Henderson A. P., 1967, ApJ, 147, 471
- Morris et al. (2017) Morris P. J., Cotter G., Brown A. M., Chadwick P. M., 2017, MNRAS, 465, 1218
- Mroz & Udalski (2016a) Mroz P., Udalski A., 2016a, ATel, 8811,
- Mroz & Udalski (2016b) Mroz P., Udalski A., 2016b, ATel, 9622,
- Mroz et al. (2016) Mroz P., Udalski A., Pietrukowicz P., 2016, ATel, 9683,
- Munari et al. (1992) Munari U., Yudin B. F., Taranova O. G., Massone G., Marang F., Roberts G., Winkler H., Whitelock P. A., 1992, A&AS, 93, 383
- Munari et al. (2011) Munari U., et al., 2011, MNRAS, 410, L52
- Munari et al. (2012) Munari U., et al., 2012, BaltA, 21, 13
- Munari & Moretti (2012) Munari U., Moretti S., 2012, BaltA, 21, 22
- Munari et al. (2013a) Munari U., Dallaporta S., Castellani F., Valisa P., Frigo A., Chomiuk L., Ribeiro V. A. R. M., 2013a, MNRAS, 435, 771
- Munari (2014) Munari U., 2014, in Stella Novae: Past and Future Decades, P. A. Woudt and V. A. R. M. Ribeiro eds., ASP Conf. Ser. 490, 183
- Munari et al. (2014a) Munari U., Henden A., Frigo A., Dallaporta S., 2014a, JAD, 20,
- Munari et al. (2014b) Munari U., et al., 2014b, AJ, 148, 81
- Munari et al. (2015) Munari U., Maitan A., Moretti S., Tomaselli S., 2015, NewA, 40, 28
- Munari et al. (2016a) Munari U., Walter F. M., Hambsch F.-J., Frigo A., 2016a, IBVS, 6162, 1
- Munari et al. (2016b) Munari U., Sollecchia U., Hambsch F.-J., Frigo A., 2016b, IAUC, 9280,
- Muneer & Anupama (2016) Muneer S., Anupama G. C., 2016, ATel, 8853,
- Muneer, Anupama, & Raveendran (2015) Muneer S., Anupama G. C., Raveendran A. V., 2015, ATel, 7161,
- Nelson et al. (2012) Nelson T., Mukai K., Sokoloski J., Chomiuk L., Rupen M., Mioduszewski A., Page K., Osborne J., 2012, ATel, 4590,
- Nelson et al. (2015) Nelson T., et al., 2015, ATel, 7085,
- Ness (2012) Ness J. U., 2012, BASI, 40, 353
- Orio et al. (2016a) Orio M., Behar E., Rauch T., Zemk P., 2016a, ATel, 9810,
- Orio et al. (2016b) Orio M., Rauch T., Zemko P., Behar E., 2016b, ATel, 9970,
- Osborne et al. (2010) Osborne J. P., et al., 2010, ATel, 2442
- Page et al. (2013) Page K. L., et al., 2013, ATel, 4845,
- Page et al. (2016) Page K., Osborne J., Kuin P., Shore S., Williams S., Darnley M. J., 2016, ATel, 9733,
- Page, Osborne, & Kuulkers (2014) Page K. L., Osborne J. P., Kuulkers E., 2014, ATel, 6035,
- Rudy, Crawford, & Russell (2016) Rudy R. J., Crawford K. B., Russell R. W., 2016, ATel, 9849,
- Saito et al. (2016) Saito R. K., Minniti D., Catelan M., Angeloni R., 2016, ATel, 9680,
- Schlafly & Finkbeiner (2011) Schlafly E. F., Finkbeiner D. P., 2011, ApJ, 737, 103 (SF11)
- Schlegel, Finkbeiner, & Davis (1998) Schlegel D. J., Finkbeiner D. P., Davis M., 1998, ApJ, 500, 525 (SFD98)
- Schwarz et al. (2011) Schwarz G. J., et al., 2011, ApJS, 197, 31
- Seitter (1990) Seitter W. C., 1990, in Physics of Classical Novae, A. Cassatella and R. Viotti eds., Springer-Verlag, Berlin, pag. 79
- Shumkov et al. (2016) Shumkov V., et al., 2016, ATel, 9621,
- Smith et al. (2002) Smith J. A., et al., 2002, AJ, 123, 2121
- Soker & Livio (1989) Soker N., Livio M., 1989, ApJ, 339, 268
- Sowell et al. (2007) Sowell J. R., Trippe M., Caballero-Nieves S. M., Houk N., 2007, AJ, 134, 1089
- Srivastava et al. (2015a) Srivastava M., Ashok N. M., Banerjee D. P. K., Venkataraman V., 2015a, ATel, 7236,
- Srivastava et al. (2015b) Srivastava M. K., Ashok N. M., Banerjee D. P. K., Sand D., 2015b, MNRAS, 454, 1297
- Srivastava et al. (2016) Srivastava M., Joshi V., Banerjee D. P. K., Ashok N. M., 2016, ATel, 8809,
- Stanek et al. (2016) Stanek K. Z., et al., 2016, ATel, 9669,
- Straižys (1992) Straižys V., 1992, Multicolor Stellar Photometry, Pachart Publishing House (Tucson)
- van den Bergh & Younger (1987) van den Bergh S., Younger P. F., 1987, A&AS, 70, 125
- Walter et al. (2012) Walter F. M., Battisti A., Towers S. E., Bond H. E., Stringfellow G. S., 2012, PASP, 124, 1057
- Walter (2015) Walter F., 2015, ATel, 7060,
- Warner (1995) Warner B., 1995, Cataclysmic Variable Stars, Cambridge Univ. Press
- Weston et al. (2016) Weston J. H. S., et al., 2016, MNRAS, 457, 887
- Williams (1992) Williams R.E., 1992, AJ, 104, 725
- Williams & Darnley (2016a) Williams S. C., Darnley M. J., 2016a, ATel, 9628,
- Williams & Darnley (2016b) Williams S. C., Darnley M. J., 2016b, ATel, 9688,
- Woudt & Ribeiro (2014) Woudt P. A., Ribeiro V. A. R. M., 2014, eds., Stella Novae: Past and Future Decades, ASP Conf. Ser. 490