Radiative-transfer models for explosions from rotating and non-rotating single WC stars
Using 1-D non-Local-Thermodynamic-Equilibrium time-dependent radiative-transfer simulations, we study the ejecta properties required to match the early and late-time photometric and spectroscopic properties of supernovae (SNe) associated with long-duration -ray bursts (LGRBs). To match the short rise time, narrow light curve peak, and extremely broad spectral lines of SN 1998bw requires a model with 3 M⊙ ejecta but a high explosion energy of a few 1052 erg and 0.5 M⊙ of . However the relatively high luminosity, the presence of narrow spectral lines of intermediate mass elements, and the low ionisation at the nebular stage are matched with a more standard C-rich Wolf-Rayet (WR) star explosion, with an ejecta of 10 M⊙, an explosion energy 1051 erg, and only 0.1 M⊙ of . As the two models are mutually exclusive, the breaking of spherical symmetry is essential to match the early/late photometric/spectroscopic properties of SN 1998bw. This conclusion confirms the notion that the ejecta of SN 1998bw is aspherical on large scales. More generally, with asphericity, the energetics and i mass of LGRB/SNe are reduced and their ejecta mass is increased, favoring a massive fast-rotating Wolf-Rayet star progenitor. Contrary to persisting claims in favor of the proto-magnetar model for LGRB/SNe, such progenitor/ejecta properties are compatible with collapsar formation. Ejecta properties of LGRB/SNe inferred from 1D radiative-transfer modeling are fundamentally flawed.
Key Words.:
radiative transfer – radiation hydrodynamics – supernovae: general –1 Introduction
Although some uncertainty remains on the properties of Type Ibc supernovae (SNe) and their progenitors, the general consensus is that they arise from H-deficient stars with Wolf-Rayet (WR) like abundances, and with a final mass at core collapse of 5 M⊙. Their ejecta have a kinetic energy of 1051 erg, quite typical of what is inferred for H-rich core-collapse SNe (Ensman & Woosley, 1988; Drout et al., 2011; Taddia et al., 2015; Prentice et al., 2016). Due to their low mass most of them are thought to arise in binary systems in which one, or both stars, have undergone mass transfer (Podsiadlowski et al., 1992; Eldridge et al., 2008). The fate of single WR stars, which have a large final mass at collapse (Crowther, 2007), is however unclear (Dessart, 2015). Type Ib and Ic SNe are distinguished by the presence/absence of He i lines in optical spectra, perhaps because Type Ic progenitors have a smaller mass of He and a larger CO core (see, for example, Georgy et al. 2009, Dessart et al. 2011, Liu et al. 2015).
The broad-line (BL) Type Ic SNe (hereafter SNe Ic-BL) are observationally distinct from normal Type Ibc SNe. Their spectral lines are so broad at early times that line identifications are compromised, and the velocity at maximum absorption is uncertain. Nonetheless, their optical spectra exhibit 3 to 4 smooth ripples that imply a large expansion rate with a photospheric velocity that may approach 30,000 km s-1 prior to maximum (for a recent discussion, see Modjaz et al. 2015). Their large expansion rate, their association in some cases with long-duration -ray bursts (LGRB),111All LGRB/SNe are broad lined Type Ic SNe but not all SNe Ic-BL are associated with an LGRB. and their large luminosities, suggest that a subset of core-collapse SNe produce much larger explosion energies and a much greater mass of i (see, e.g., Iwamoto et al. 1998; Woosley et al. 1999).
One notorious example presenting these extraordinary properties is SN 1998bw, which is an LGRB/SN (Galama et al., 1998). Using 1-D radiation hydrodynamics simulations and OPAL opacities, Woosley et al. (1999) find that a 4.77 M⊙ CO-rich ejecta with 0.49 M⊙ of and a kinetic energy of 2.8 1052 erg yields a satisfactory match to the light curve of SN 1998bw prior to 100 d. This model corresponds to a 6.55 M⊙ C-rich WR progenitor star leaving behind a 1.78 M⊙ neutron star remnant. They find that higher mass models yield a too long rise time. Using a more simplified light curve model with a prescribed opacity, Iwamoto et al. (1998) argue for a 10 M⊙ ejecta with 2–5 1052 erg. This is more than twice the ejecta mass of Woosley et al. (1999). An alternative scenario invokes an asymmetric explosion that produces ejecta with an energy of 21051 erg, a total mass of 2 M⊙, and a i mass of 0.2 M⊙ (Höflich et al., 1999). However, all these models underestimate the luminosity at late times because the ejecta density is too low to sufficiently trap -rays from o decay (Sollerman et al., 2000; Patat et al., 2001). A similar discrepancy was found for SN 1997ef, which led Mazzali et al. (2000) to propose that the explosion may have been asymmetric.
Maeda et al. (2003) emphasise the inherent problem of spherically-symmetric models to explain simultaneously the early-time and late-time light curve of SN 1998bw and other LGRB/SNe. They propose a two component model with i both located in the outer fast-moving ejecta and in the inner denser and slower ejecta. With this additional freedom, the model can explain the huge brightness at early times and the sustained brightness at late times. A strong ejecta asphericity is also inferred by Maeda et al. (2006, 2008) from nebular phase spectra of SN 1998bw and other LGRB/SNe.
| Model | Age | |||||||||||||
|---|---|---|---|---|---|---|---|---|---|---|---|---|---|---|
| [Myr] | [kK] | [L⊙] | [R⊙] | [M⊙] | [M⊙] | [M⊙] | ||||||||
| r0 | 0.0162 | 0 | 5.06 | 166 | 3.39(5) | 0.70 | 11.4 | 1.59 | 1.57 | 1.88(-1) | 5.14(-1) | 0.0 | 2.79(-1) | 5.03(-4) |
| r4 | 0.0162 | 0.4 | 5.44 | 200 | 3.28(5) | 0.48 | 10.0 | 2.01 | 1.82 | 1.75(-1) | 5.20(-1) | 0.0 | 2.86(-1) | 5.03(-4) |
| r6 | 0.0162 | 0.6 | 6.25 | 146 | 1.79(5) | 0.67 | 6.6 | 1.67 | 1.55 | 2.91(-1) | 5.38(-1) | 0.0 | 1.52(-1) | 5.02(-4) |
| r6z | 0.002 | 0.6 | 7.37 | 145 | 2.88(5) | 0.86 | 9.7 | 2.15 | 1.87 | 9.98(-1) | 8.57(-5) | 1.55(-3) | 2.41(-5) | 3.76(-5) |
| Model | He | C | O | Si | Ca | i | ||||
|---|---|---|---|---|---|---|---|---|---|---|
| [M⊙] | [M⊙] | [1051 erg] | [km s-1] | [M⊙] | [M⊙] | [M⊙] | [M⊙] | [M⊙] | [M⊙] | |
| r0e2 | 1.71 | 9.69 | 4.12 | 6530 | 0.181 | 1.326 | 5.471 | 0.112 | 0.0061 | 0.122 |
| r0e4 | 1.54 | 9.86 | 12.31 | 11210 | 0.205 | 1.298 | 5.590 | 0.181 | 0.0098 | 0.172 |
| r4e4 | 1.88 | 8.12 | 13.44 | 12900 | 0.286 | 1.302 | 3.852 | 0.458 | 0.0410 | 0.583 |
| r6e4 | 1.62 | 4.97 | 12.41 | 15840 | 0.324 | 1.051 | 2.072 | 0.315 | 0.022 | 0.300 |
| r6ze4 | 1.99 | 7.70 | 13.70 | 13370 | 1.453 | 0.822 | 3.017 | 0.429 | 0.0386 | 0.696 |
| r6e4BH | 4.04 | 2.55 | 11.63 | 21420 | 0.456 | 0.910 | 0.515 | 0.051 | 0.0036 | 0.435 |
Fast rotation is thought to be central for the production of LGRB/SNe, both in the context of the collapsar model (Woosley, 1993) and the proto-magnetar model (Wheeler et al., 2000; Bucciantini et al., 2008; Metzger et al., 2011). To preserve its original angular momentum, an initially fast rotating single star must lose little mass. Furthermore, because of its redistribution within the star, angular momentum may be retained if the star does not evolve through a giant phase, which occurs if it evolves chemically homogeneously (this holds even in the absence of mass loss; Yoon & Langer 2005; Woosley & Heger 2006; Yoon et al. 2006). With the current understanding of hot star winds, this situation requires an evolution at low metallicity. An important corollary is that then the final mass is close to the initial mass. As discussed above, because the inferred ejecta mass of LGRB/SNe may be only a few M⊙, this poses serious concerns about the whole theory.
With the goal of reaching a final mass at collapse of about 10 M⊙ and keeping a lot of angular momentum, Woosley & Heger (2006) evolved 12-16 M⊙ stars at very low metallicity. These stars die with lots of angular momentum but their final mass is low and their propensity for black-hole (BH) formation is questionable. Indeed, Dessart et al. (2012) argue that nearly all of these models are unlikely to form a BH, primarily because their core structure (or compactness) is analogous to that of standard 15 M⊙ red-supergiant (RSG) stars that are expected to produce SNe II-P. In the study of Woosley & Heger (2006), only the more massive models (models 35OB-35OC), with a progenitor mass of 35 M⊙ have a huge compactness and may produce a BH (if they do not explode through a magneto-rotational explosion first; Dessart et al. 2008). However, models 35OB-35OC die with a final mass of 20-30 M⊙, which is incompatible with the inferences of Woosley et al. (1999) or Iwamoto et al. (1998) for SN 1998bw. The model of Woosley et al. (1999) leaves behind a neutron star, or probably a magnetar, but not a BH. Yoon et al. (2006) studied the properties of low-metallicity fast rotating massive stars. These stellar models evolve chemically homogeneously, retain a large amount of angular momentum, but produce WR stars at death with a mass of 10–30 M⊙.
This issue with the final WR mass is major. It is a fundamental characteristic of the progenitor; it controls the ejecta properties and is likely determinant for the nature of the compact remnant. If one could invoke a large final WR mass for LGRB/SN progenitors, numerous concerns would immediately disappear for the production of a collapsar (Woosley, 1993; MacFadyen & Woosley, 1999). First, such models are more likely to form BHs. As they no longer need to lose much mass they may retain a lot of angular momentum, although a low metallicity would still be needed to limit the wind mass-loss rate and to ensure a chemically-homogeneous evolution (to prevent a giant phase). Massive WRs are naturally encountered in the high-luminosity compact regions, which are the site of LGRB/SNe (see, e.g., Le Floc’h et al. 2003, Fruchter et al. 2006, Modjaz et al. 2008).
Because of the complexity of LGRB/SNe, it is important to perform independent studies of their light curve and spectra with different tools and techniques. Even today, the bulk of the analyses of LGRB/SNe and standard SNe Ic is based on a simplistic 1D modelling of the LC and/or no modelling of the spectra (for recent studies, see, e.g., Drout et al. 2011; D’Elia et al. 2015; Toy et al. 2016; Prentice et al. 2016; Volnova et al. 2016). There is a persisting controversy with the origin of LGRB/SNe. Some recent studies argue for the proto-magnetar model (Mazzali et al., 2014; Wang et al., 2016) and it is therefore necessary to independently assess LGRB/SN ejecta properties and address the pros and cons of the collapsar and the proto-magnetar models.
Here, we present 1-D time-dependent radiative transfer models based on the explosion of a set of carbon-rich WR stars, which result from the evolution of a rotating or non-rotating 40M⊙ star on the zero-age-main-sequence (ZAMS). Unlike previous studies, our approach computes the evolution of the full ejecta from early to late times, and generates the frequency-dependent emergent flux, from which both multi-band light curves and UV/optical/near-IR spectra can be simultaneously extracted — the same physics is used to compute both photometric and spectroscopic observables (Hillier & Dessart, 2012). This is the first time such simulations are presented.
The paper is organised as follows. In the next section, we present the numerical approach, including the simulation of the pre-SN evolution, the explosion dynamics, and the radiative transfer. These simulations are similar to the CO core explosion models of Woosley et al. (1999) — with the exception of our BH-forming SN model — but the observables are computed with greater physical consistency. In Section 3, we discuss the key photometric and spectroscopic properties of these models and confront them to the observations of SN 1998bw. We confirm that the early-time LC requires a large ejecta energy-to-mass ratio and a large i mass, and that such a model fails to match the late time LC. Further, our models that match the early-time spectra fail to match even approximately the late-time spectra, and vice-versa. In support of previous studies, we find numerous lines of evidence that the SN 1998bw may be axisymmetric, both from the spectra and the light curve, and both from early times and late times. In Section 4, we present our conclusion. This study is a stepping stone for forthcoming radiative transfer simulations in 2-D.
2 Numerical Setup
The simulations we present in this study are all based on a 40 M⊙ progenitor star evolved from the ZAMS until the onset of core collapse with the code mesa (Paxton et al., 2011, 2013, 2015), version 5696. The metallicity is set to for the solar metallicity models, and 0.002 for the low metallicity model. We consider models with and without rotation on the ZAMS. The effects of rotation on stellar structure, chemical mixing, angular momentum transport, and mass loss are accounted for according to the methods available in mesa (Paxton et al., 2015). All models correspond to single stars, so that any mass loss takes the form of a radiation-driven wind. The wind mass loss rate is determined by the ‘Dutch’ recipe in mesa, combining the values from Glebbeek et al. (2009), Nieuwenhuijzen & de Jager (1990), Nugis & Lamers (2000), and Vink et al. (2001), with a coefficient . Convection is followed according to the Ledoux criterion, with a mixing length parameter 3, a semi-convection efficiency parameter 0.1 (Paxton et al., 2015, Eq. 12), and an exponential overshoot with parameter 0.008 (Paxton et al., 2011, Eq. 2).
Since all models derive from a 40 M⊙ star on the ZAMS, our nomenclature distinguishes models according to the initial rotation rate and the metallicity. We use r0 to refer to a model without rotation, and r4 (r6) for a model spinning initially at 40% (60%) of the critical angular velocity at the surface. We also include one fast-rotating model at a tenth of the solar metallicity (model r6z). By the time of core collapse, all models are H free, but they retain a small amount of He within the CO core. They would correspond to C-rich (or O-rich) WR stars (Maeder & Meynet, 1994; Langer et al., 1994; Groh et al., 2013). Some model properties at the onset of core collapse are given in Table 1.
Using v1d (Livne, 1993; Dessart et al., 2010b, a), the explosion is triggered by means of a piston to produce an ejecta kinetic energy of about 4 and 12 1051 erg (models are identified by suffixes e2 and e4 in order of explosion energy). The code treats nuclear burning but the explosive nucleosynthesis yields a i mass that depends sensitively on the piston location (in mass space) and on the piston trajectory/velocity. Consequently, our simulations produce a sizeable scatter in i mass (not necessarily strongly correlated with explosion energy), with values in the range 0.085–0.696 M⊙. In all models except r6e4BH, the piston mass cut is located at the edge of the Fe core, somewhere between 1.5–2.0 M⊙ (producing a neutron star remnant). In model r6e4BH, we place it at 4 M⊙ to produce a BH and explore the effect of a much lower ejecta mass (i.e., 2.55 M⊙, compared to 5-10 M⊙ for the rest of the sample) on the SN radiation. This could occur in a progenitor star whose innermost stable circular orbit is located at 4 M⊙. The sensitivity of our results to BH mass and for a set of fast-rotating carbon-rich WR progenitors will be presented in a forthcoming paper.
In models forming a neutron star, the piston is given a fixed outward velocity of 15000-30000 km s-1 until the total energy of the stellar envelope equals the desired asymptotic kinetic energy (the piston is set to rest thereafter). In model r6e4BH, we instead adopt the same piston trajectory as in kepler (Woosley & Weaver, 1995). Placing the piston at 4 M⊙, we first drive the piston inwards for 30 s to simulate the envelope collapse into the gravitational potential well. When the piston reaches down to 500 km, we drive the piston outwards at an initial speed of 40000 km s-1. The piston trajectory follows , where (see Woosley & Weaver 1995 for discussion). The collapse phase brings the inner envelope to small radii, compressing the material to large densities. When the piston moves outwards, the large post-shock temperatures necessary for the synthesis of a large mass of i are easily produced.
The full set of models includes r0e2, r0e4, r4e4, r6e4, r6ze4, and r6e4BH. Once the explosive nucleosynthesis is over, we mix , and only i – we do not mix other species (we do, however, adjust the O mass fraction to keep the sum of mass fractions equal to unity).222In practice, starting at the base of the ejecta, we reset the i mass fraction in each shell of mass to , where . In all models, we use M⊙, except for models r6e4 and r6e4BH for which we use 0.3 M⊙. If the sum of mass fractions in mass shell is greater than unity, we scale all mass fractions so that the sum is unity. If it is less, we increase the local O mass fraction so that the sum is unity. In practice, this adjustment is minor. Mixing i captures the influence of decay heating on the light curve. By not altering other species, we avoid artificially introducing a microscopic mixing that probably does not occur in real SN explosions (see, e.g., Jerkstrand et al. 2011; Wongwathanarat et al. 2015). When mixing is applied to all species, we find little difference in the SN radiation, probably because these progenitors are quasi-homogeneous CO cores (this is stark contrast from simulations of SNe II-P; Lisakov et al. 2017.
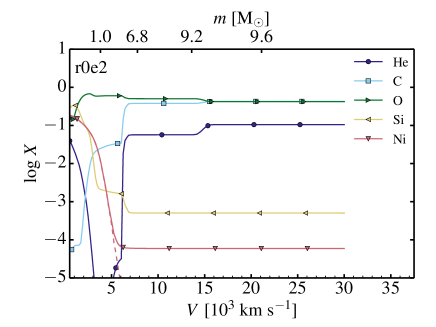
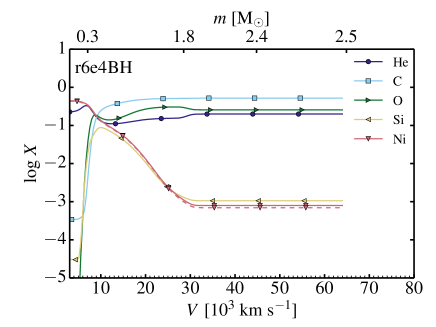
The explosion models computed with v1d are then remapped into cmfgen (Hillier & Dessart, 2012) at 1–4 d after explosion. The numerical procedure is the same as used recently in Dessart et al. (2015, 2016). Because of the large abundance of intermediate-mass elements (IMEs) and Fe-group elements (IGEs) in these ejecta, we use the same model atoms for metals as used in Dessart et al. (2014b), particularly important to test for the presence of Co iii lines (Dessart et al., 2014a) — this line may be seen and could be an important diagnostic because SNe Ic-BL are believed to synthesize a mass of comparable to that of standard SNe Ia (Scalzo et al., 2014). We show the ejecta composition (for a selection of important species) for models r0e2 and r6e4BH in Fig. 1. Additional ejecta properties are summarised in Table 2.
Our set of simulations was not done to match a specific SN Ic, SN Ic-BL, or LGRB/SN. Rather, we cover a range of progenitor/ejecta properties and study their impact on observables. We then confront these results to the photometric and spectroscopic evolution of SN 1998bw, using data of Galama et al. (1998), McKenzie & Schaefer (1999), and Patat et al. (2001). We use an extinction 0.2 mag, a redshift of 0.00867, and a distance modulus of 32.89 mag (Patat et al., 2001). We set the explosion time to the time of the LGRB detection (MJD 50929.4; Galama et al. 1998).
3 Results
3.1 Photometry
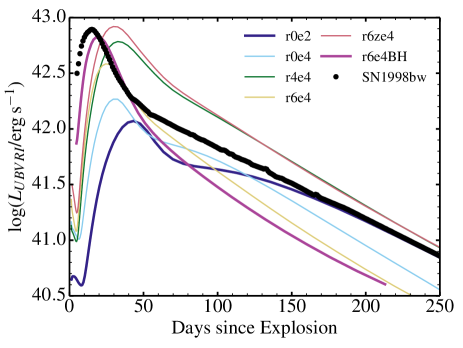
Using the photometry for both the observations of SN 1998bw and for our set of models, we convert these magnitudes to fluxes and integrate to yield a luminosity . Repeating the process from early to late times, we build optical light curves (Fig. 2).
Our set of six models may be split in two separate groups. The first group contains models r0e2 and r0e4, which correspond to a massive ejecta with modest amounts of i (0.12 and 0.17 M⊙), and kinetic energies of 4.1 and 12.3 1051 erg. Both models are too faint to match the peak luminosity of SN 1998bw. These models also have a very long rise time to maximum, from 43 d (r0e2) down to 31 d (r0e4). Such massive ejecta, typical of what galactic WR stars may produce (see Crowther 2007 for a review), yield SN radiation properties that are incompatible with the inferred rise times and light curve widths of SNe Ic (see, e.g., Drout et al. 2011), unless they have an explosion energy well in excess of 1052 erg. The exceptional conditions required to produce such extreme energies are unlikely to be realised with the frequency at which standard SNe Ic occur. Super-solar metallicity may be needed to produce the low/moderate-mass WR progenitors required to match the observed SN Ic properties (Georgy et al., 2009; Yoon, 2015).
The second set contains models with lower ejecta masses (3–8 M⊙), large explosion energies ( 12 1051 erg), and large i masses (0.3–0.7 M⊙). The higher the i mass, the greater the bolometric luminosity at maximum (compare model r6ze4 to model r6e4). The larger the , the longer the rise time to maximum and the broader the light curve (compare model r6ze4 to r6e4BH). The greater the , the faster the decline rate at late times. These trends are the same as those obtained in a previous grid of models of SNe IIb/Ib/Ic (Dessart et al., 2015, 2016).
The model that best matches the light curve of SN 1998bw at early times is the BH forming model. The model peaks at 20 d, only 5 d later than observed, but it is also a little too faint. The model light curve width is comparable to that of SN 1998bw. However, the low ejecta mass (which allows the very fast rise to maximum) causes an enhanced -ray escape at late times, producing a low SN luminosity. Models r4e4 and r6ze4 are less discrepant at late times but they overestimate the rise time to maximum and the light curve width. Model r6e4 is too faint at most times — it contains too little i initially.
In contrast, model r0e2 fits poorly the epochs around maximum but it follows closely the optical luminosity of SN 1998bw at nebular times, despite its modest ejecta energetics and i mass of only 0.122 M⊙. The lower decay power yields a much higher luminosity than in model r6e4BH because of the near complete trapping of -rays.
Hence, we corroborate the results of Woosley et al. (1999). To come close to matching the early-time light curve, a spherically-symmetric model needs a huge ejecta kinetic energy well in excess of 1052 erg, 0.5 M⊙ of , and a low/moderate ejecta mass. But, as emphasized by Maeda et al. (2003), these highly energetic ejecta tend to yield a luminosity at late times that is too faint or decreases over time with the wrong rate.
3.2 Spectroscopy
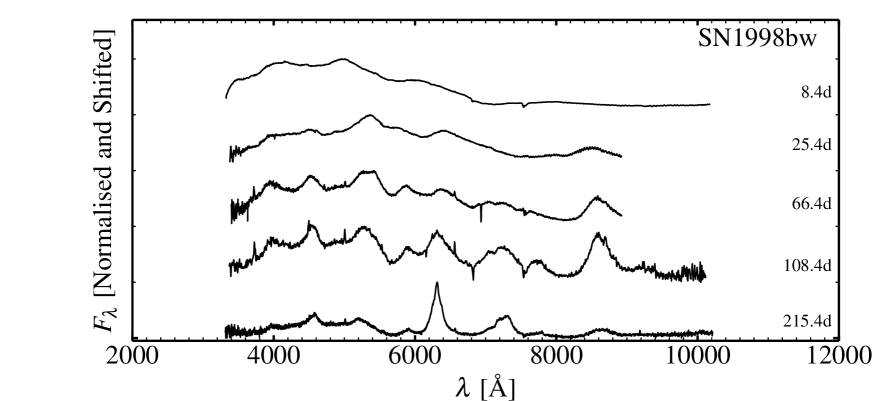
We now discuss the spectral evolution of our set of models from pre-maximum to the nebular phase, and compare to the observations of SN 1998bw. Contrary to all previous studies that focused on snapshots (see, e.g., Nakamura et al. 2001), this work presents the first spectral model sequences based on non-LTE time-dependent radiative transfer simulations for SNe Ic-BL.
3.2.1 Early times
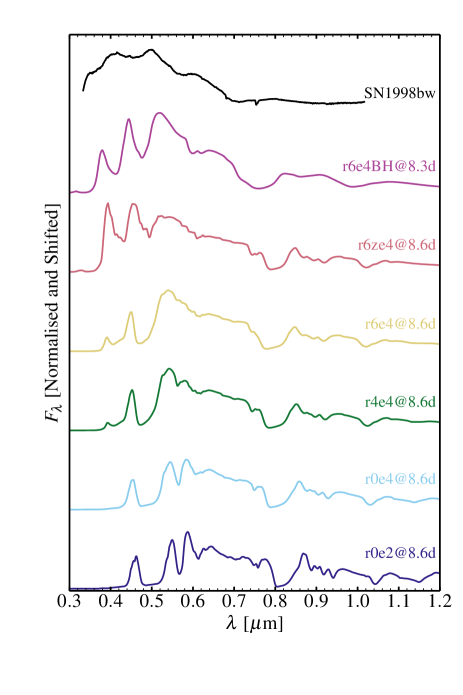
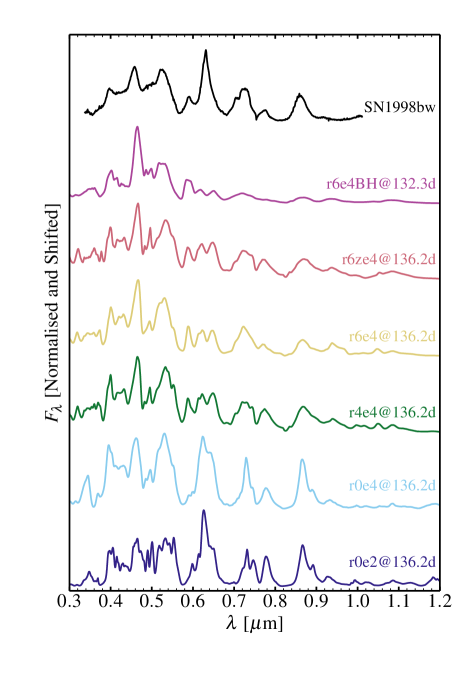
Figure 3 compares the optical spectra for our model set at 8 d and 135 d after explosion with the contemporaneous observations of SN 1998bw. At early times, all models fail to reproduce the width of the observed absorption features, despite their large ratio, even for model r6e4BH. The model spectra have both narrower line features and stronger absorption troughs than SN 1998bw. Hence, this suggests an even larger energy per unit mass is needed to match the observations.
Our models are also too red, except for the low-metallicity model r6ze4, which comes close to matching the optical colours of SN 1998bw at 8 d. There is a complicated combination of effects since model r6ze4 has a low primordial metallicity but this model is also very metal rich owing to the secular and explosive nucleosynthesis that took place. At 8 d, Ni/Co do not greatly pollute the outer ejecta and they have not yet decayed to raise sizeably the Fe abundance. Hence, the Fe mass fraction is down by a factor of ten compared to solar in the outer ejecta. At early times, a lower primordial metallicity can therefore produce a bluer SN.
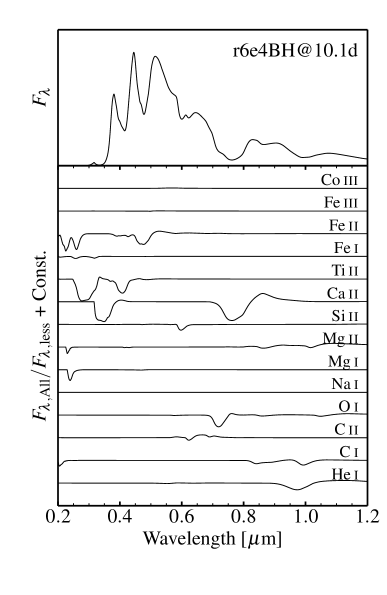
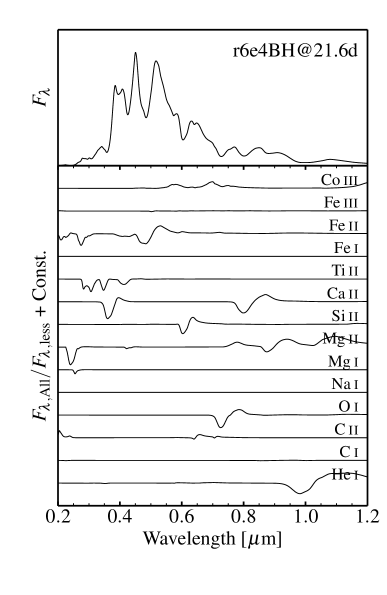
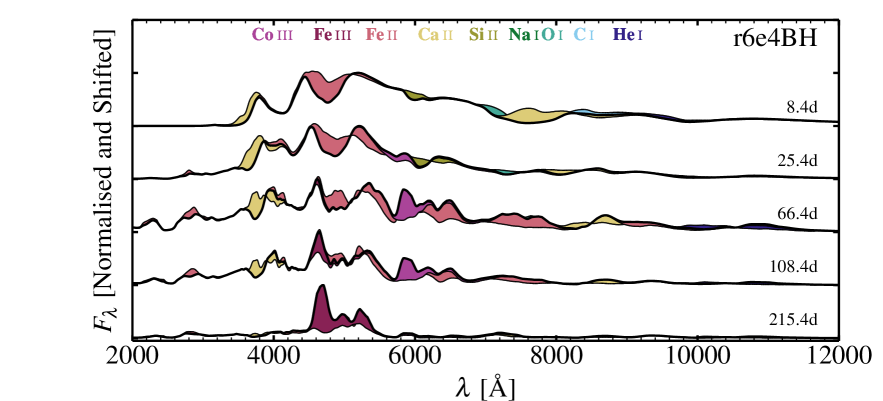
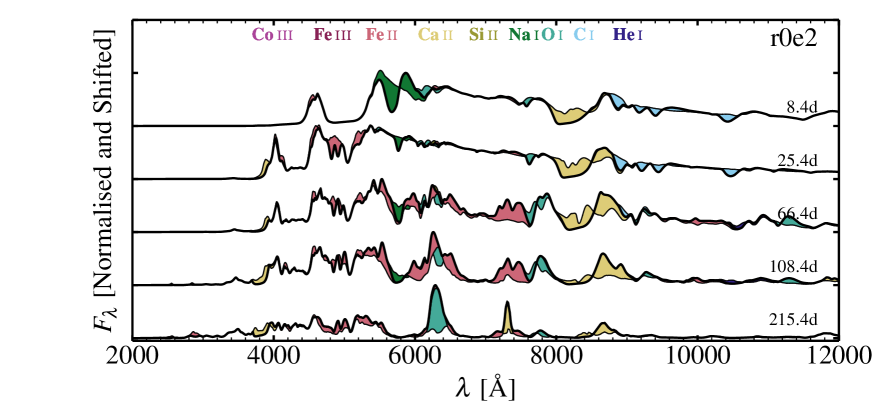
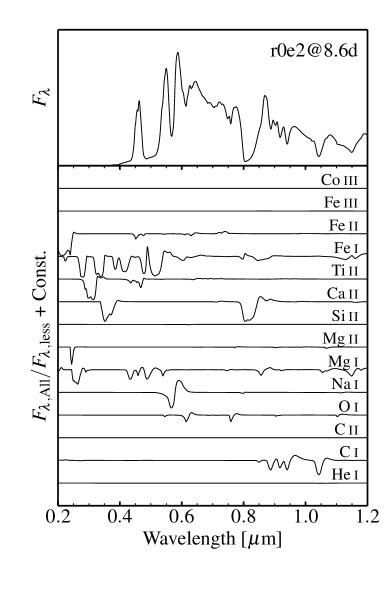
As illustrated for models r0e2 and r6e4BH in the appendix (Figs. 6–9), the early-time optical spectra show neutral or once ionized lines of IMEs. The larger the ratio (i)/, the larger the ionisation in the spectrum formation region. In model r0e2, the spectra show the presence of lines from C i (red part of the optical), O i, Na i D, Mg i Ca ii, together with strong blanketing from Fe i shortward of 5500 Å. There is no sizeable contribution from Si ii 6355 Å. In model r6e4BH, the ionisation is much higher and the expansion rate in the spectrum formation is larger. We therefore see broad lines of C i, O i, Si ii, Ca ii, and Fe ii.
While all the features seen in model r6e4BH are compatible with those observed in the spectrum of SN 1998bw at 8.4 d, they are too narrow. If we were to scale this model to the 10 M⊙ ejecta required by Iwamoto et al. (1998), this would correspond to a 4.6 erg, and the lines would still be too narrow. Furthermore, this energy approaches the theoretical upper limit of 1053 erg, which is the gravitational binding energy of a typical neutron star.
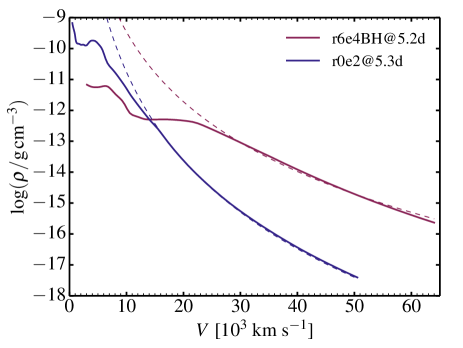
Nakamura et al. (2001) modelled the early time spectra of SN 1998bw and found similar properties for the spectrum formation at early times, including very fast expansion (with absorption extending out to 60,000 km s-1 in some lines, a composition dominated by intermediate mass elements). Their line identifications are identical to ours around the epoch of maximum. They note that the line absorptions are better fitted when invoking a flatter density distribution at large velocity (they argue for a power law with a density exponent of , while we have a value of in model r6e4BH; Fig. 4).
None of our models shows the strong optical He i lines characteristic of SNe Ib – all our models produce SNe Ic (or SNe Ic-BL), although they all contain some He. The total He mass is in the range 0.18–1.4 M⊙, with a surface He mass fraction of 20% (model r0, r4, r6) and 98% (model r6z). However, model r6e4BH shows the presence of He i 10830 Å, although the line is quite weak at this early time. Hence, He deficiency is not mandatory for producing a SN Ic or a SN Ic-BL (the same result is obtained for the SN Ic ejecta models 5p11Ax1/5p11Ax2 in Dessart et al. 2015).
3.2.2 Late times
In contrast to early times, our model set produces a larger diversity in spectral appearance at late times (Fig. 3, right panel). This results from the differences in ionisation (greater in ejecta with a larger (i)/ ratio) and composition.
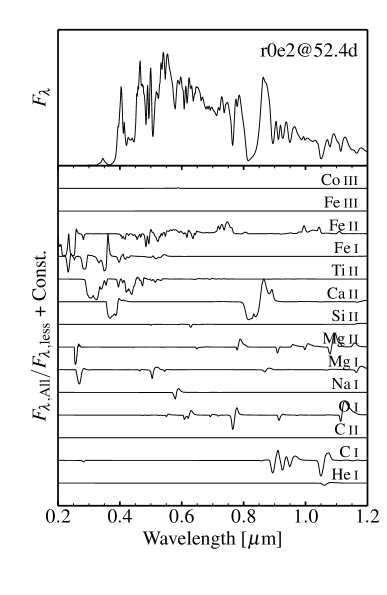
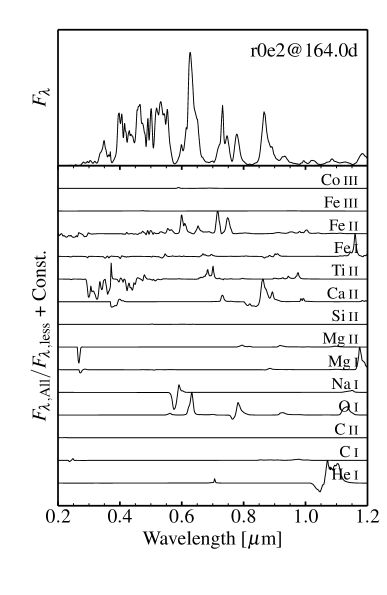
Models with a low (i)/ ratio (r0e2 and r0e4) show a spectrum dominated by O i lines at 6300–6363 Å (forbidden doublet) and 7774 Å, Na i D, the Ca ii 7300 Å doublet and the Ca ii near-IR triplet around 8500 Å, and lines of Fe ii. In the blue part of the optical, we see the overlapping contributions of forests of lines from Ti ii, Fe ii, as well as strong absorptions, for example from Ca ii H&K.
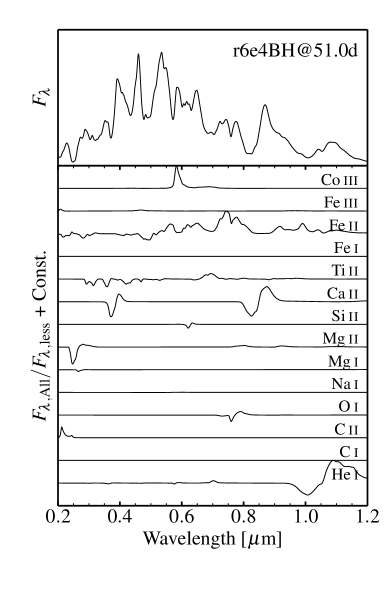
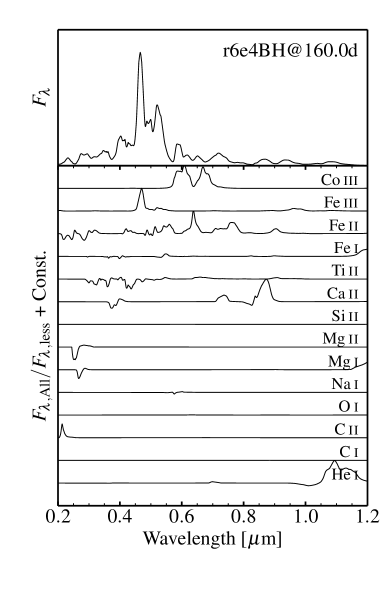
In contrast, model r6e4BH shows a dominance of IGEs, with the strong Fe ii, Fe iii, and Co iii lines (Fig. 3), and a spectral energy distribution that peaks in the blue part of the optical. There is no emission associated with O i 6300–6364 Å, but we see a sizeable emission in [Co iii] 5888 Å, as also observed in SNe Ia (Dessart et al., 2014a). Overall, this model spectrum resembles a Type Ia spectrum at late times, which is not surprising given the model properties ( 2.55 M⊙, (i) 0.435 M⊙).
Model r6e4BH, despite its suitability for the early time properties of SN 1998bw, is strongly discrepant at late times. In contrast, model r0e2 matches quite closely the spectral properties of SN 1998bw, even though it corresponds to the explosion of a massive progenitor yielding a low/moderate energy and a low i mass ( 9.69 M⊙, 4.12 1051 erg, (i) 0.122 M⊙).
From the above discussion we see that while our models reproduce some of the features of the optical light curve and spectra of SN 1998bw at specific epochs, all models also show significant discrepancies when compared to observations at all epochs.
4 Discussion and conclusions
We have presented physically-consistent explosion models for rotating/non-rotating C/O-rich WR stars. Starting at 1–4 d after explosion, we follow each model with the 1-D time-dependent radiative-transfer code cmfgen, allowing for thermal-heating and non-thermal processes associated with the radioactive decay of i and o. Our approach allows, for the first time, the simultaneous computation of bolometric, multi-band light curves and spectra for models of SNe Ic-BL. While our modelling confirms some results from previous work, it also conflicts with numerous recent studies of LGRB/SNe.
We find that a high energy explosion yielding a high can approximately reproduce the light curve properties around maximum (rise time, peak brightness, light curve width) as well as the very broad optical lines (associated with Fe ii, Si ii, or Ca ii) observed in SN 1998bw. But this model fails at late times because it underestimates the luminosity, and yields spectra dominated by metal lines without the presence of, e.g., O i 6300–6364 Å. Conversely, we find that a lower energy explosion yielding a lower , which fails at early times, produces a satisfactory match to both the observed luminosity and optical spectra at nebular times.
Maeda et al. (2003) suggested that the observed light curve of SN 1998bw can be reconciled by invoking a highly energetic ejecta with a distribution of in two concentric shells at low and high velocity, and a high-density inner ejecta. In our work, and as illustrated in Fig. 4, we cannot reproduce this configuration because a high energy explosion model (e.g., r6e4BH) has little or no material at low velocity, while a low energy explosion, has little or no material at high velocity (e.g., r0e2) — the ejecta structure with two-concentric and spherical shells proposed by Maeda et al. (2003) is not hydrodynamically feasible. In other words, a spherically-symmetric explosion model cannot have simultaneously a large density at low and high velocity. A simple way out of this conundrum is to argue that the explosion at the origin of SN 1998bw is asymmetric, yielding, for example, a prolate (oblate) density distribution along the pole (equator). Such a morphology has been proposed by Maeda et al. (2006, 2008) based on modelling of nebular phase spectra. We demonstrate here that evidence for asymmetry is in fact visible at all times, both in the photometry and in the spectra.
Instead of a model with two concentric shells of i located at low and high velocities, the ejecta may be axisymmetric with fast material (high energy-per-unit-mass with high relative abundance of with respect to other species) limited to a small/moderate solid angle around our line of sight (and possibly 180 deg away from our line of sight), and slower material (lower energy-per-unit-mass with a lower relative abundance of with respect to other species) lying along lower latitudes. This hybrid scenario is qualitatively similar to the axisymmetric explosions of MacFadyen & Woosley (1999) or Maeda et al. (2002).
For the fast material along the pole, the ejecta properties could correspond to model r6e4BH, but limited to a small solid angle. At early times, the ejecta is optically thick and we are mostly sensitive to material along our line of sight. Consequently, the total mass of the very fast material and of its content are reduced (perhaps to a tenth of the masses in the spherical ejecta model r6e4BH, if this region occupies a tenth of the volume of this spherical model). The radiation from this material is not beamed by a relativistic effect, but it is non-isotropic and biased in the radial direction along which the photon mean free path is the greatest. Thus at early times, the spectra would form primarily in the optically-thick column of fast-moving material along our line of sight, resembling the properties of our (1-D) model r6e4BH. At late times, the at large velocity contributes negligibly to the light curve (because of -ray escape) and also because the corresponding mass is lower than the 0.5 M⊙ value of the corresponding spherical model (how much lower will depend on the opening angle for the fast material and may vary from case to case).
This model reproduces roughly the salient features seen in the early-time spectra of SN 1998bw, with very broad Fe ii and Si ii lines, a broad feature in the red from the blended absorption of O i-Ca ii. The key here is that the huge energy and huge inferred to match SN 1998bw arise when spherical symmetry is assumed. The early-time light curve and spectra may instead be reproduced by an asymmetric ejecta, with a much lower energy and mass for the fast moving material because it is limited to a small solid angle.
The bulk of the mass located at lower velocities could correspond to an ejecta mass of 10 M⊙ with an energy of a few 1051 erg and 0.1 M⊙ of . Our model r0e2 might be a rough representation of this inner ejecta in SN 1998bw. Only 0.1 M⊙ of i may be needed to reproduce the luminosity of SN 1998bw at late times (Fig. 2) because the denser, slower, and more massive ejecta leads to the more efficient trapping of -rays. The large O mass and the low ionisation conditions lead to the production of a strong O i 6300–6364 Å line, as observed. In contrast, model r6e4BH shows only lines of IGEs at late times, and no O i line emission. With both models combined, we can explain the simultaneous presence of Fe iii, Co iii, and O i lines at nebular times. Figure 5 illustrates how an asymmetric model may reproduce the spectral observations of SN 1998bw, resembling model r6e4BH at 70 d and model r0e2 later on.
Allowing for asymmetry, it is possible for LGRB/SN progenitors to be massive WR stars. Unlike in the 1-D 5 M⊙ ejecta model of Woosley et al. (1999), only a small fraction of the ejecta mass is rich in , contributing around bolometric maximum, while the longer-time light curve is powered by a modest mass of but tied to a more massive ejecta. In this context, the mass-loss/angular-momentum-loss problem that plagues LGRB/SN progenitors no longer holds. Furthermore, if we argue for the formation of a massive BH, massive WR stars (as massive as models 35OB-35OC in Woosley & Heger 2006) are suitable for producing a LGRB/SN. This model still requires fast-rotating progenitors evolved at low metallicity (Hirschi et al., 2004; Yoon & Langer, 2005; Georgy et al., 2009), but there is no longer the need to reach down to final WR star masses as low as 5 M⊙. The possibility of a fast-rotating massive WR progenitor for LGRB/SNe means that the proto-magnetar model is not the only viable model. Mazzali et al. (2014) promote the proto-magnetar model of LGRB/SNe because their energetics is comparable to the initial energy of a millisecond-period magnetar. This may be fortuitous. For example, standard core-collapse and thermonuclear SNe have a similar explosion energy but their explosion mechanism is entirely different and their progenitors come from distinct stellar populations. Wang et al. (2016) claim that the early peak and late-time slow decline in the light curves support the proto-magnetar model because no other model can match this feature. However, our model shows this is clearly not the case. The early peak and late-time slow decline in the light curves are indicative of ejecta asymmetry, and our models of spectra at the photospheric and nebular phases confirm this.
Spherically symmetric models of LGRB/SN light curves and spectra are characterized by energies up to half the binding energy of a neutron star. By invoking asymmetry, LGRB/SNe may have ejecta energies 1052 erg, thus more compatible with expectations of what can be produced in fast-rotating progenitors. At cosmological redshifts, we tend to detect events in which the bulk of the energy is injected along our direction (as high-energy radiation), and then infer a large “isotropic” luminosity, while we fail to detect those in which the energy is deposited away from our line of sight, even though they may have the same energetics. LGRB/SNe are extremely rare events relative to the ensemble of core-collapse SNe (see, e.g., Podsiadlowski et al. 2004), so the reduced i mass brought in by considering asphericity would have little impact on the chemical enrichment of the Universe (the higher mass ejecta would however favor a greater release of O from lower latitudes).
Even today, the majority of analyses on LGRB/SNe and standard SNe Ic are based on simplistic arguments for the LC (Drout et al., 2011; D’Elia et al., 2015; Prentice et al., 2016). Volnova et al. (2016) performed detailed radiation-hydrodynamics simulations of LGRB/SN 2013dx, but their modeling is 1-D and they focus on the early-time radiation only. When applied to the asymmetric ejecta of LGRB/SNe, such studies can lead to systematic errors in the determination of ejecta parameters.
The large mass budget inferred for SN 1998bw makes it possible to argue for BH formation. As discussed in Dessart et al. (2012), the final density structure of the 12-16 M⊙ models of Woosley & Heger (2006) proposed as LGRB/SN progenitors is similar to that of standard non-rotating 15 M⊙ RSG stars. The latter are expected to produce garden-variety SNe II-P, so it is unlikely that the former could produce the extreme properties necessary to make LGRB/SNe, which are also very rare events. On the other hand, the massive WR models 35OB/35OC of Woosley & Heger (2006), with their massive Fe cores and high compactness, now appear suitable to form a collapsar and an LGRB/SN like SN 1998bw.
Acknowledgements.
LD acknowledge financial support from the European Community through an International Re-integration Grant, under grant number PIRG04-GA-2008-239184, and from “Agence Nationale de la Recherche” grant ANR-2011-Blanc-SIMI-5-6-007-01. DJH acknowledges support from NASA theory grant NNX10AC80G, and SCY acknowledges support from the Korea Astronomy and Space Science Institute under the R&D program (Project No. 3348-20160002) supervised by the Ministry of Science, ICT and Future Planning. This work utilized computing resources of the mesocentre SIGAMM, hosted by the Observatoire de la Côte d’Azur, Nice, France.References
- Bucciantini et al. (2008) Bucciantini, N., Quataert, E., Arons, J., Metzger, B. D., & Thompson, T. A. 2008, MNRAS, 383, L25
- Crowther (2007) Crowther, P. A. 2007, ARA&A, 45, 177
- D’Elia et al. (2015) D’Elia, V., Pian, E., Melandri, A., et al. 2015, A&A, 577, A116
- Dessart (2015) Dessart, L. 2015, in Wolf-Rayet Stars: Proceedings of an International Workshop held in Potsdam, Germany, 1-5 June 2015. Edited by Wolf-Rainer Hamann, Andreas Sander, Helge Todt. Universitätsverlag Potsdam, 2015., p.245-250, ed. W.-R. Hamann, A. Sander, & H. Todt, 245–250
- Dessart et al. (2008) Dessart, L., Burrows, A., Livne, E., & Ott, C. D. 2008, ApJL, 673, L43
- Dessart et al. (2014a) Dessart, L., Hillier, D. J., Blondin, S., & Khokhlov, A. 2014a, MNRAS, 439, 3114
- Dessart et al. (2014b) Dessart, L., Hillier, D. J., Blondin, S., & Khokhlov, A. 2014b, MNRAS, 441, 3249
- Dessart et al. (2011) Dessart, L., Hillier, D. J., Livne, E., et al. 2011, MNRAS, 414, 2985
- Dessart et al. (2015) Dessart, L., Hillier, D. J., Woosley, S., et al. 2015, MNRAS, 453, 2189
- Dessart et al. (2016) Dessart, L., Hillier, D. J., Woosley, S., et al. 2016, MNRAS, 458, 1618
- Dessart et al. (2010a) Dessart, L., Livne, E., & Waldman, R. 2010a, MNRAS, 408, 827
- Dessart et al. (2010b) Dessart, L., Livne, E., & Waldman, R. 2010b, MNRAS, 405, 2113
- Dessart et al. (2012) Dessart, L., O’Connor, E., & Ott, C. D. 2012, ApJ, 754, 76
- Drout et al. (2011) Drout, M. R., Soderberg, A. M., Gal-Yam, A., et al. 2011, ApJ, 741, 97
- Eldridge et al. (2008) Eldridge, J. J., Izzard, R. G., & Tout, C. A. 2008, MNRAS, 384, 1109
- Ensman & Woosley (1988) Ensman, L. M. & Woosley, S. E. 1988, ApJ, 333, 754
- Fruchter et al. (2006) Fruchter, A. S., Levan, A. J., Strolger, L., et al. 2006, Nature, 441, 463
- Galama et al. (1998) Galama, T. J., Vreeswijk, P. M., van Paradijs, J., et al. 1998, Nature, 395, 670
- Georgy et al. (2009) Georgy, C., Meynet, G., Walder, R., Folini, D., & Maeder, A. 2009, A&A, 502, 611
- Glebbeek et al. (2009) Glebbeek, E., Gaburov, E., de Mink, S. E., Pols, O. R., & Portegies Zwart, S. F. 2009, A&A, 497, 255
- Groh et al. (2013) Groh, J. H., Meynet, G., Georgy, C., & Ekström, S. 2013, A&A, 558, A131
- Hillier & Dessart (2012) Hillier, D. J. & Dessart, L. 2012, MNRAS, 424, 252
- Hirschi et al. (2004) Hirschi, R., Meynet, G., & Maeder, A. 2004, A&A, 425, 649
- Höflich et al. (1999) Höflich, P., Wheeler, J. C., & Wang, L. 1999, ApJ, 521, 179
- Iwamoto et al. (1998) Iwamoto, K., Mazzali, P. A., Nomoto, K., et al. 1998, Nature, 395, 672
- Jerkstrand et al. (2011) Jerkstrand, A., Fransson, C., & Kozma, C. 2011, A&A, 530, A45
- Langer et al. (1994) Langer, N., Hamann, W.-R., Lennon, M., et al. 1994, A&A, 290
- Le Floc’h et al. (2003) Le Floc’h, E., Duc, P.-A., Mirabel, I. F., et al. 2003, A&A, 400, 499
- Lisakov et al. (2017) Lisakov, S. M., Dessart, L., Hillier, D. J., Waldman, R., & Livne, E. 2017, MNRAS, 466, 34
- Liu et al. (2015) Liu, Y.-Q., Modjaz, M., Bianco, F. B., & Graur, O. 2015, ArXiv:1510.08049 [arXiv:1510.08049]
- Livne (1993) Livne, E. 1993, ApJ, 412, 634
- MacFadyen & Woosley (1999) MacFadyen, A. I. & Woosley, S. E. 1999, ApJ, 524, 262
- Maeda et al. (2008) Maeda, K., Kawabata, K., Mazzali, P. A., et al. 2008, Science, 319, 1220
- Maeda et al. (2003) Maeda, K., Mazzali, P. A., Deng, J., et al. 2003, ApJ, 593, 931
- Maeda et al. (2002) Maeda, K., Nakamura, T., Nomoto, K., et al. 2002, ApJ, 565, 405
- Maeda et al. (2006) Maeda, K., Nomoto, K., Mazzali, P. A., & Deng, J. 2006, ApJ, 640, 854
- Maeder & Meynet (1994) Maeder, A. & Meynet, G. 1994, A&A, 287
- Mazzali et al. (2000) Mazzali, P. A., Iwamoto, K., & Nomoto, K. 2000, ApJ, 545, 407
- Mazzali et al. (2014) Mazzali, P. A., McFadyen, A. I., Woosley, S. E., Pian, E., & Tanaka, M. 2014, MNRAS, 443, 67
- McKenzie & Schaefer (1999) McKenzie, E. H. & Schaefer, B. E. 1999, PASP, 111, 964
- Metzger et al. (2011) Metzger, B. D., Giannios, D., Thompson, T. A., Bucciantini, N., & Quataert, E. 2011, MNRAS, 413, 2031
- Modjaz et al. (2008) Modjaz, M., Kewley, L., Kirshner, R. P., et al. 2008, AJ, 135, 1136
- Modjaz et al. (2015) Modjaz, M., Liu, Y. Q., Bianco, F. B., & Graur, O. 2015, ArXiv: 1509.07124 [arXiv:1509.07124]
- Nakamura et al. (2001) Nakamura, T., Mazzali, P. A., Nomoto, K., & Iwamoto, K. 2001, ApJ, 550, 991
- Nieuwenhuijzen & de Jager (1990) Nieuwenhuijzen, H. & de Jager, C. 1990, A&A, 231, 134
- Nugis & Lamers (2000) Nugis, T. & Lamers, H. J. G. L. M. 2000, A&A, 360, 227
- Patat et al. (2001) Patat, F., Cappellaro, E., Danziger, J., et al. 2001, ApJ, 555, 900
- Paxton et al. (2011) Paxton, B., Bildsten, L., Dotter, A., et al. 2011, ApJS, 192, 3
- Paxton et al. (2013) Paxton, B., Cantiello, M., Arras, P., et al. 2013, ApJS, 208, 4
- Paxton et al. (2015) Paxton, B., Marchant, P., Schwab, J., et al. 2015, ApJS, 220, 15
- Podsiadlowski et al. (1992) Podsiadlowski, P., Joss, P. C., & Hsu, J. J. L. 1992, ApJ, 391, 246
- Podsiadlowski et al. (2004) Podsiadlowski, P., Mazzali, P. A., Nomoto, K., Lazzati, D., & Cappellaro, E. 2004, ApJL, 607, L17
- Prentice et al. (2016) Prentice, S. J., Mazzali, P. A., Pian, E., et al. 2016, MNRAS, 458, 2973
- Scalzo et al. (2014) Scalzo, R., Aldering, G., Antilogus, P., et al. 2014, MNRAS, 440, 1498
- Sollerman et al. (2000) Sollerman, J., Kozma, C., Fransson, C., et al. 2000, ApJL, 537, L127
- Taddia et al. (2015) Taddia, F., Sollerman, J., Leloudas, G., et al. 2015, A&A, 574, A60
- Toy et al. (2016) Toy, V. L., Cenko, S. B., Silverman, J. M., et al. 2016, ApJ, 818, 79
- Vink et al. (2001) Vink, J. S., de Koter, A., & Lamers, H. J. G. L. M. 2001, A&A, 369, 574
- Volnova et al. (2016) Volnova, A. A., Pruzhinskaya, M. V., Pozanenko, A. S., et al. 2016, ArXiv e-prints [arXiv:1612.07626]
- Wang et al. (2016) Wang, L. J., Yu, H., Liu, L. D., et al. 2016, ArXiv e-prints [arXiv:1610.09061]
- Wheeler et al. (2000) Wheeler, J. C., Yi, I., Höflich, P., & Wang, L. 2000, ApJ, 537, 810
- Wongwathanarat et al. (2015) Wongwathanarat, A., Mueller, E., & Janka, H.-T. 2015, A&A, 577, A48
- Woosley (1993) Woosley, S. E. 1993, ApJ, 405, 273
- Woosley et al. (1999) Woosley, S. E., Eastman, R. G., & Schmidt, B. P. 1999, ApJ, 516, 788
- Woosley & Heger (2006) Woosley, S. E. & Heger, A. 2006, ApJ, 637, 914
- Woosley & Weaver (1995) Woosley, S. E. & Weaver, T. A. 1995, ApJS, 101, 181
- Yoon (2015) Yoon, S.-C. 2015, PASA, 32, 15
- Yoon & Langer (2005) Yoon, S.-C. & Langer, N. 2005, A&A, 443, 643
- Yoon et al. (2006) Yoon, S.-C., Langer, N., & Norman, C. 2006, A&A, 460, 199
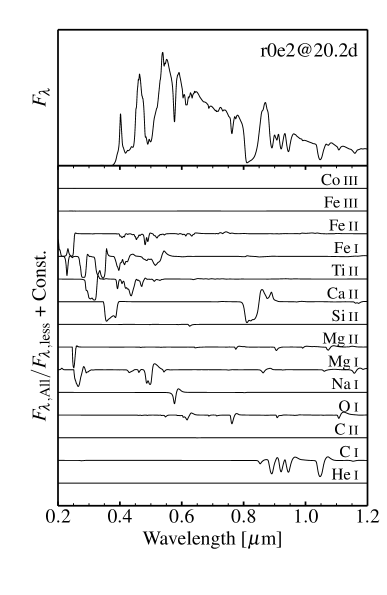
Appendix A Line identifications in model r0e2 at multiple epochs
In this section, we present a montage of spectra for model r0e2 that illustrates the bound-bound contributions from selected ions at four consecutive epochs.
Appendix B Line identifications in model r6e4BH at multiple epochs
In this section, we present a montage of spectra for model r6e4BH that illustrates the bound-bound contributions from selected ions at four consecutive epochs.