Cosmic-ray induced destruction of CO in star-forming galaxies
Abstract
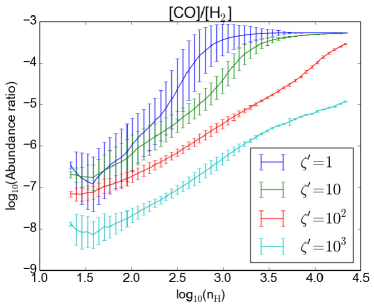
We explore the effects of the expected higher cosmic ray (CR) ionization rates on the abundances of carbon monoxide (CO), atomic carbon (C), and ionized carbon (C+) in the H2 clouds of star-forming galaxies. The study of Bisbas et al. (2015) is expanded by: a) using realistic inhomogeneous Giant Molecular Cloud (GMC) structures, b) a detailed chemical analysis behind the CR-induced destruction of CO, and c) exploring the thermal state of CR-irradiated molecular gas. CRs permeating the interstellar medium with (Galactic) are found to significantly reduce the [CO]/[H2] abundance ratios throughout the mass of a GMC. CO rotational line imaging will then show much clumpier structures than the actual ones. For (Galactic) this bias becomes severe, limiting the utility of CO lines for recovering structural and dynamical characteristics of H2-rich galaxies throughout the Universe, including many of the so-called Main Sequence (MS) galaxies where the bulk of cosmic star formation occurs. Both C+ and C abundances increase with rising , with C remaining the most abundant of the two throughout H2 clouds, when (Galactic). C+ starts to dominate for (Galactic). The thermal state of the gas in the inner and denser regions of GMCs is invariant with for (Galactic). For (Galactic) this is no longer the case and are reached. Finally we identify OH as the key species whose sensitive abundance could mitigate the destruction of CO at high temperatures.
Subject headings:
ISM: abundances, (ISM:) cosmic rays, galaxies: ISM, methods: numerical, astrochemistryI. Introduction
Molecular hydrogen (H2) gas and its mass distribution in galaxies is of fundamental importance in determining their structural and dynamical characteristics, as well as the process of star formation in them. It does not have a permanent dipole moment, and at its lowest energy level (), the S(2-0) quadrupole transition in the far-IR wavelength cannot trace the bulk of the H2 molecules which predominantly lie in the cold () phase. The astronomical community has therefore implemented other lines to infer this mass indirectly typically using CO, the next most abundant molecule after H2 itself with its bright rotational transitions in the millimeter/sub-millimeter wavelength regime ([CO]/[H2] in Milky Way, e.g. Lacy et al., 1994, where [] denotes the abundance compared to H-nuclei number density). Unlike H2, CO has a permanent dipole moment and rotational transitions with are allowed, e.g. CO at is the most commonly used as an H2 gas tracer, with higher- transitions becoming accessible at high redshifts in the age of Atacama Large Millimeter/submillimeter Array (ALMA) at the high altitude of Llano de Chajnantor plateau in Chile. The goal of this work is to explore to what extent CO remains a good tracer of the molecular gas mass and dynamics in regions with elevated CRs, such as expected in actively star-forming galaxies typical for the early Universe.
Once the CO () line emission is detected, a scaling factor is used to convert its velocity-integrated brightness temperature (or the line luminosity) to H2 column density on scales of molecular clouds or larger. This method is statistically robust for M(H2)10 (for an investigation on the physical condition dependencies and the underlying physics of the CO-to-H2 conversion factor, see e.g. Bolatto et al., 2013; Szűcs et al., 2016). This CO-to-H2 method, calibrated in Galactic conditions (Dickman et al., 1986; Solomon et al., 1987), is widely used in extragalactic observations (e.g. Solomon et al., 1997; Gratier et al., 2016; Chen et al., 2015; Genzel et al., 2015). If multi- CO (or other molecules like HCN) line observations reveal average gas densities, temperatures and/or dynamic states of molecular clouds that differ from those in the Milky Way there exists a theoretical framework to use appropriately modified CO-to-H2 conversion factors (e.g. Bryant & Scoville, 1996; Papadopoulos et al., 2012a). All these techniques work as long as CO and other molecules used to study its average conditions (e.g. HCN) remain sufficiently abundant in GMCs, typically not much less abundant as in the Galactic GMCs where these techniques have been calibrated. Low-metallicity (Z) molecular gas, especially when irradiated by strong FUV radiation, was the first H2 gas phase for which early studies showed that the standard techniques actually fail (Pak et al., 1998; Bolatto et al., 1999). This means that low-Z gas in the outer parts of even ordinary spiral galaxies, like the Milky Way, may then be in a very CO-poor phase and thus impossible to trace using CO lines (Papadopoulos et al., 2002; Wolfire et al., 2010).
Atomic carbon (C) line emission is another alternative for deducing the molecular gas distribution in galaxies and one that can be as reliable as low- CO lines. This is because of its widespread emission in H2 clouds despite of what is expected from the classical theory of Photodissociation Regions (PDRs) (Gerin & Phillips, 2000; Israel & Baas, 2001; Papadopoulos et al., 2004; Bell et al., 2007; Offner et al., 2014; Glover et al., 2015). There are a number of reasons contributing towards C line emission being fully associated with CO line emission and having larger emergent flux densities per H2 column density than those of the low-CO rotational lines used as global H2 gas tracers. This led to an early proposal for using the two C lines, 3P1-3P0 () at 492 GHz and 3P2-3P1 () at 809 GHz, and especially the lower frequency line, as routine H2 gas tracers in galaxies for when the lines shift into the millimeter band (Papadopoulos et al., 2004; Papadopoulos & Greve, 2004b). Such a method can now be extended in the local Universe as imaging at high frequencies can be performed by ALMA (Krips et al., 2016). In our Galaxy, the Vela Molecular Ridge cloud C shows that atomic carbon can trace accurately the H2 gas mass (Lo et al., 2014). For extragalactic studies, Zhang et al. (2014) find that in the centre of the Seyfert galaxy Circinus, the C-traced H2 mass is consistent with that derived from sub-millimeter dust continuum and multiple- CO excitation analysis, while C observations have recently been used to trace the H2 gas mass in distant starbursts at z4 (Bothwell et al., 2017).
The ongoing discussion regarding the widespread C line emission in molecular clouds, and thus their ability to trace H2 independently of 12CO and 13CO lines, took another turn after the recent discovery that cosmic rays (CRs) can very effectively destroy CO throughout H2 clouds, leaving C (but not much C+) in their wake (Bisbas et al., 2015, hereafter ‘B15’, see also Bialy & Sternberg (2015)). Unlike FUV photons that only do so at the surface of H2 clouds and produce C+ rather than C, CRs destroy CO volumetrically and can render H2 clouds partly or wholly CO-invisible even in ISM environments with modestly boosted CR ionization rates of Galactic, where is the cosmic-ray ionization rate () (Strong et al., 2004a, b). The latter values are expected in typical star-forming (SF) galaxies in the Universe (Hopkins & Beacom, 2006; Daddi et al., 2010), currently studied only using CO (e.g. Genzel et al., 2012). For example, Mashian et al. (2013) inferred a cosmic-ray ionization rate of in their analysis of CO/C+ emissions in the high redshift HDF 850.1. B15 found that besides the ability of C lines in tracing the CO-rich parts of an H2 cloud, they also probe the CO-poor regions. This is of particular interest especially if its lines are to be a viable H2-tracing alternative to CO lines. In the current work we re-examine these CR-induced effects discussed by B15 in the much more realistic setting of inhomogeneous H2 clouds, that could affect their ‘visibility’ in CO, C, and C+ line emission. Furthermore, we discuss in more detail the chemistry behind the CR-control of the [CO]/[H2] abundance ratio and its dependence on the gas temperature which itself is affected by cosmic rays. The latter proves to be a very important factor that should be taken into account in turbulent-dynamic cloud simulations that explore similar issues.
Models of CO-destruction in cosmic-ray dominated regions (CRDRs), predict that low- CO/C line flux ratios are general low, . Recent ALMA observations of the Spiderweb galaxy by Gullberg et al. (2016) find that / which can be potentially explained from the presence of high CR energy densities. Another interesting recent example is the observation of the / ratio in the starburst galaxy NGC253 (Krips et al., 2016) which, in association with early observations indicating warm H2 gas (Bradford et al., 2003), could be due to high values. High CR energy densities are expected to maintain higher gas temperatures even in far-UV-shielded environments. B15 estimate a gas temperature of when the CR ionization rate, , is boosted up to times the mean Galactic value.
In this paper we perform astrochemical simulations of the effects of larger than Galactic CR energy densities on inhomogeneous molecular clouds, using the 3d-pdr code (Bisbas et al., 2012) to infer the distributions of the CO, C, C+ abundances and of the gas temperature. This is a continuation of the B15 work using much more realistic molecular cloud structures rather than those of uniform-density or radially varying densities explored previously. Moreover, we now also analyze the chemistry involved in the CR-induced destruction of CO, and its conversion to C, in greater detail. In all of our simulations we assume that the bulk of the H2 gas interacts with CRs throughout the cloud volume (i.e. the H2 gas ‘sees’ CRs, with the same spectrum, throughout the volume of the cloud). While this is not true for some regions deep inside clouds (Rimmer et al., 2012), and can depend on the specifics of magnetic fields (Padovani et al., 2013), it remains a very good approximation for the bulk of H2 clouds in SF-galaxies (Papadopoulos et al., 2011).
The paper is organized as follows. In Section II we present the setup of our simulations. In Section III we present the results of our calculations and in particular how the probability density functions and the abundance distribution of the above key species, as well as the corresponding heating and cooling functions vary under the different conditions explored. In Section IV we discuss how OH enhances the [CO]/[H2] abundance ratio at higher temperatures when increases and in Section V we refer to the impact of our findings in observations. We conclude in Section VI.
II. Description of simulations
We consider a three-dimensional density distribution of a non-uniform giant molecular cloud (GMC) and use the 3d-pdr (Bisbas et al., 2012) code to perform chemistry and full thermal balance calculations and estimate the abundance distribution of chemical species and the gas temperature distribution.
II.1. Density distribution
The inhomogeneous spherical GMC in our models is rendered by a fractal structure with a fractal dimension of constructed using the method described in Walch et al. (2015). It has a radius of and mass of . This corresponds to an average H-nucleus number density of , typical for Milky Way GMCs. The central part of the cloud contains a dense region with peak density . The fractal dimension is in accordance to the clumpiness factor observed in evolved Galactic Hii regions (e.g. Sánchez et al., 2010; Walch et al., 2015). On the contrary, for diffuse clouds the fractal dimension is higher () meaning that they are more uniform (Walch et al., 2015). The chosen dimension of corresponds to a GMC containing non-homogeneously distributed high density clumps typical of those that eventually undergo star formation. They are therefore expected to be H2-rich and for the particular Milky Way conditions, also CO-rich. We do not evolve the cloud hydrodynamicaly and in order to resolve its densest parts, we use a Smoothed Particle Hydrodynamics setup of the cloud and represent it with particles111The density of each particle is calculated using the SPH code seren (Hubber et al., 2011)..
. H Mg+ H2 C+ He O S
II.2. 3d-pdr initial conditions
We use the 3d-pdr code (Bisbas et al., 2012) in order to calculate the abundances of chemical species in the above fractal cloud. 3d-pdr obtains the gas temperature and the abundance distribution of any arbitrary three-dimensional density distribution by balancing various heating and cooling functions (see §III.2). For the simulations of this work we use the same chemical network and initial abundances of species as used in the B15 paper. In particular we use a subset of the UMIST 2012 network (McElroy et al., 2013) consisting of 6 elements (H, He, C, O, Mg, S), 58 species and more than 600 reactions. Table 1 shows the initial abundances used which correspond to undepleted Solar abundances with hydrogen mostly in molecular form (Asplund et al., 2009). We chemically evolve the cloud for at which point the system has reached chemical equilibrium. Chemical equilibrium is typically obtained after for a cloud in which H2 has already formed, (e.g., Bell et al., 2006), which is comparable to turbulent diffusion timescales for GMCs in ULIRG environments (Xie et al., 1995; Papadopoulos et al., 2004, see also §5.1 of B15). For our modelled GMC, we find that the sound crossing time is . On the other hand the H2 formation time is , where . We therefore do not expect turbulence to strongly affect our results, although hydrodynamical simulations exploring this effect are needed towards this direction (e.g., Glover & Clark, 2016). We include H2 formation on dust grains but we do not model CO freeze-out. The effects of different networks and different elemental abundances are presented in Appendix A, which shows that our trends are robust.
In all simulations we consider an isotropic FUV radiation field strength of , normalized to the Draine (1978) spectral shape and width is equivalent to integrated over the wavelength range (Habing, 1968). At the surface of the cloud, the field strength is therefore approximately equal to (Sternberg et al., 2014). We perform a suite of four simulations by varying the cosmic-ray ionization rate, from to , the upper limit of which corresponds to values suggested for the Central Molecular Zone (e.g. Le Petit et al., 2016). For convenience we normalize as
| (1) |
where is the typically adopted ionization rate of the Milky Way. This latter value is times that observed in the diffuse ISM (e.g. McCall et al., 2003; Dalgarno, 2006; Neufeld et al., 2010; Indriolo & McCall, 2012; Indriolo et al., 2015) but close to the Heliospheric value () as measured by the Voyager 1 spacecraft (Cummings et al., 2015). Our baseline choice of a value lower than that observed is made under the assumption that cosmic rays in our model do not attenuate as a function of column density; instead the corresponding ionization rate remains constant everywhere in the cloud. We therefore adopt a baseline value that corresponds to an already attenuated within denser H2 gas222A similar approximation has also been made by Narayanan & Krumholz (2016).
II.3. Cosmic-ray ionization rate and UV
High cosmic ray ionization rates, on the order of , are expected in starburst environments such as the (ultra-) luminous infrared galaxies (U/LIRGs, i.e. Sanders et al., 2003). In these systems the star formation rate (SFR) density, (where SFR is in and is the corresponding volume), is enhanced by a factor up to compared with the Milky Way. This drives a higher cosmic ray energy density as (Papadopoulos, 2010). Enhanced FUV fields are also expected in such environments, although dust attenuation in these metal-rich objects will keep the boost of the average FUV field incident on the H2 clouds lower than proportional to (Papadopoulos et al., 2014).
In this paper we do not vary the isotropic FUV radiation field in our simulations, wanting to isolate the effects of CRs. We note, however, that chemo-hydrodynamical simulations performed by Glover & Clark (2016) suggest that if both and are increased by two orders of magnitude, clouds with mass might be dispersed by the thermal pressure which would dominate over the gravitational collapse. The attenuation of the FUV radiation is calculated using the method described in Bisbas et al. (2012) which accounts for the attenuation due to dust, H2 self-shielding CO self-shielfing, CO shielding by H2 lines and CO shielding by dust.
III. Results
III.1. Dependency of column density and volumetric mass of species on
Our description begins with analysing the abundance distribution of species in all four different 3d-pdr simulations. Lada & Blitz (1988), van Dishoeck & Black (1988) and van Dishoeck (1992) were the first to divide the gas in ‘CO-poor’ and ‘CO-rich’ populations based on the abundance ratio of [CO]/[H2]. In this work, we adopt the B15 definition for which ‘CO-deficient’ refers to gas that fullfills the conditions
| (2) | |||||
| (3) |
In this case, the abundance of CO averaged over the cloud is lower than the average value of typically found in molecular clouds while the gas remains H2-rich333In B15 the gas fulfilling conditions (2) and (3) was defined as ‘CO-dark’.. We define the gas ‘CO-rich’ when the gas is H2-rich and [CO]/[H2]. For comparison with observations, it is column density ratios rather than just local abundance ratios that are most relevant, since column densities ultimately control the strength of the velocity-integrated line emission.
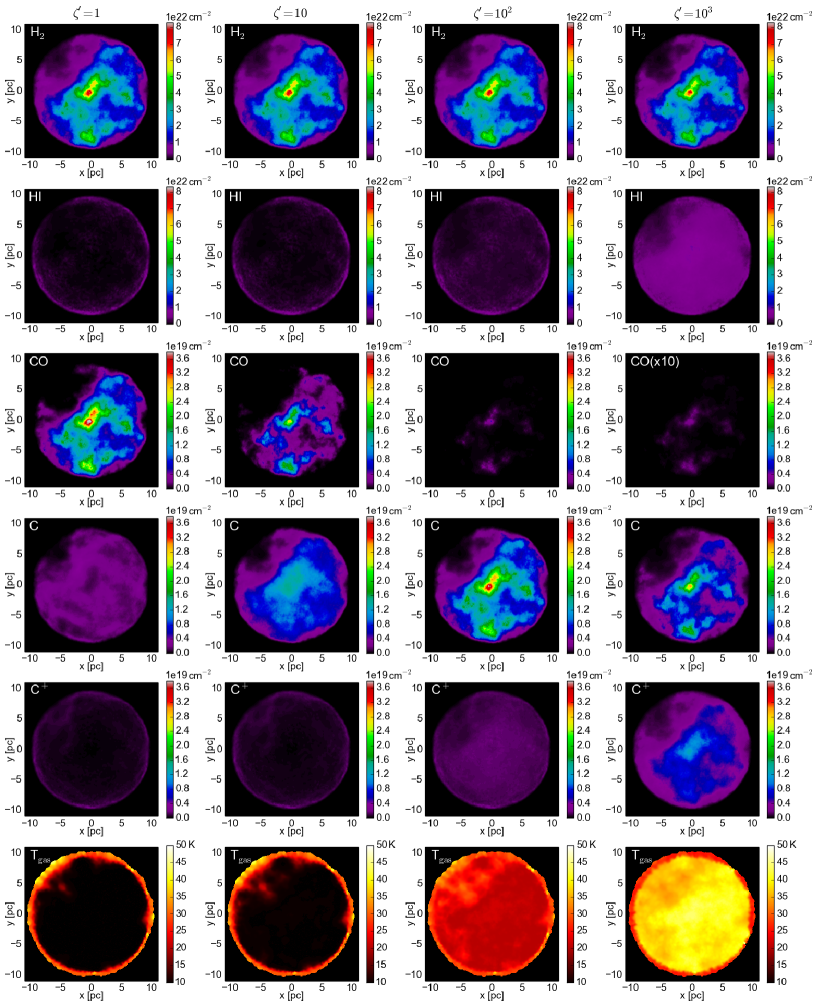
Figure 1 shows column density plots of H2, Hi, CO, C, and C+ species as well as cross-section plots of the gas temperature () at the plane, all as a function of . We map the SPH particle distribution on a grid using the method described in Appendix B. The recovery of for the H2 gas inside the cloud with and obtained using our thermal balance calculations is in agreement with the typical temperatures of FUV-shielded H2 observed in our Galaxy (e.g. Polychroni et al., 2012; Nishimura et al., 2015) and found in other simulations (e.g. Glover & Clark, 2012). On the high end of the average CR energy densities and similar gas densities we recover similar values as in the calculations for CR-dominated regions (CRDRs) performed in the past (Papadopoulos et al., 2011, their Figure 1).
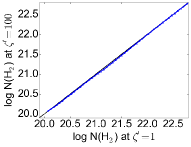
We find that as increases, the column density of molecular hydrogen, (H2) remains remarkably unaffected for up to . We note, however, that if we were to evolve the cloud hydrodynamically (e.g. Glover & Clark, 2016) the higher gas temperature of the cloud would act to reduce the number of high density clumps, thus affecting the underlying total column density distribution and the chemistry itself. (Hi) remains low and nearly constant with up to = when H2 starts being significantly destroyed towards Hi. These trends further reflect the findings of Bialy & Sternberg (2015) who use the ratio to determine whether the ISM gas is predominantly atomic or molecular. The thin Hi shell seen in Fig. 1 results from photodissociation by the FUV radiation, and the column density is in agreement with Sternberg et al. (2014) and Bialy & Sternberg (2016).
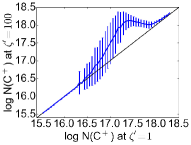
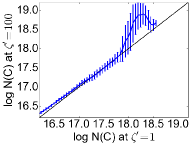
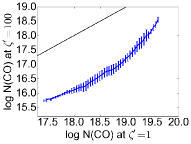
The most interesting interplay is between CO, C and C+. As can be seen from Fig. 1, (CO) starts already decreasing from . For it is everywhere approximately one order of magnitude lower than at . Note that for (CO) at and the upper limit of the colour bar is already one order of magnitude less than for and 10. While (H2) remains high even at , the large decrease of (CO) points to a CO-to-H2 conversion factor well above its Galactic value, and one that may well become uncalibratable (see §V). At the same time, as CR particles interact with He, they create He+ ions which then react with CO forming C+. The latter further recombines with free electrons to form neutral carbon. On the other hand (C) increases already from , peaking at . As shown in Fig. 2 for the particular comparison between and , it is remarkable to find that
| (4) | |||||
| (5) | |||||
| (6) | |||||
| (7) |
suggesting that nearly all CO that has been destroyed by CRs is converted to C+ and C. It is evident from Fig. 1 that while at CO traces the H2 structure very well, it only traces regions of higher column densities at , whereas at it is almost vanished. It is then replaced primarily by C showing a much better resemblance with the molecular structure.
An insidious aspect of a CR-controlled [CO]/[H2] abundance ratio inside CR-irradiated clouds revealed by Fig. 1 is that if one were to perform typical CO line observations meant to find the H2 mass and also characterize average gas density and temperature via CO and 13CO line ratios, their analysis would consistently indicate dense and warm gas, located in those cloud regions where CO manages to survive in a high-CR environment. Yet these routine observations would be totally oblivious to the CO-poor H2 gas mass (and its conditions) that surrounds these CO-rich warm and dense gas ‘peaks’. For that would be most of the H2 gas (see Fig. 1), an effect that may have wide-ranging implications for galaxies where most of the SF in the Universe occurs. Apart from dust continuum emission, only C and C+ line imaging could reveal that extra gas mass. Of these two, only C line imaging offers a practical method using ground-based telescopes, since the very high frequency of the C+ line makes it inaccessible for imaging over much of redshift space where star-forming galaxies evolve.
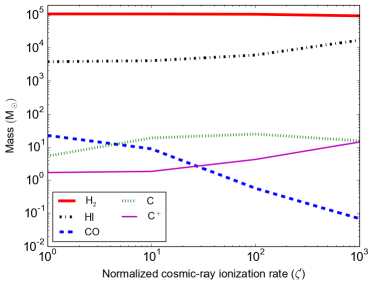
Figure 3 shows the total mass of the above species in the simulated GMC as a function of . The total mass of H2 in the GMC remains nearly unchanged for up to . It is expected that for the GMC will be Hi dominated with only trace amounts of H2 even at the most dense regions. The particular mass of atomic carbon appears to have a local maximum at , at which point the mass of CO is two orders of magnitude less than the corresponding value for . On the other hand the mass of C+ increases monotonically at all times while for we find that (C+)(C).
It is interesting to see that the masses of Hi and C+ increase monotonically, with the mass of C+ increasing somewhat faster than that of Hi. Both of these species are products of cosmic-rays interacting with H2, CO and C hence it is expected that by increasing their abundances will also increase. The observed trend, however, is likely to be a result of additional volumetric (3D) effects.
III.2. Heating and cooling processes
The 3d-pdr code performs thermal balance iterations and converges when the total heating rate matches with the total cooling rate calculated for each position within the cloud. The heating processes considered include the Bakes & Tielens (1994) grain and PAH photoeletric heating with the modifications suggested by Wolfire et al. (2003) to account for the revised PAH abundance estimate from the Spitzer data; carbon photoionization heating (Black, 1987); H2 formation and photodissociation heating (Tielens & Hollenbach, 1985); collisional de-excitation of vibrationally excited H2 following FUV pumping (Hollenbach & McKee, 1979); heat deposition per cosmic-ray ionization (Tielens & Hollenbach, 1985); supersonic turbulent decay heating (Black, 1987); exothermic chemical reaction heating (Clavel et al., 1978); and gas-grain collisional coupling (Burke & Hollenbach, 1983). The particular H2 formation rate is calculated using the treatment of Cazaux & Tielens (2002); Cazaux & Spaans (2004). The turbulent heating that is included in 3d-pdr is , where and . These values are constant throughout all calculations, giving . Our chosen is on par of what is expected from the Larson relation and its subsequent observational study by Solomon et al. (1987). This turbulent heating term assumes that turbulence is driven at the largest scale of the cloud (Heyer & Brunt, 2004; Padoan et al., 2009).
The gas primarily cools due to the collisional excitation, subsequent C+, C, O fine-structure line emission and emission due to rotational transitions of CO. The cooling rate of each processes are estimated using a 3D escape probability routine. The details are described in Bisbas et al. (2012) and the data-files are adopted from the Leiden Atomic and Molecular Database (LAMDA Schöier et al., 2005)444http://home.strw.leidenuniv.nl/moldata/. We use a macroturbulent expression to account for the optical depth (Papadopoulos & Seaquist, 1999, and Appendix A of B15).
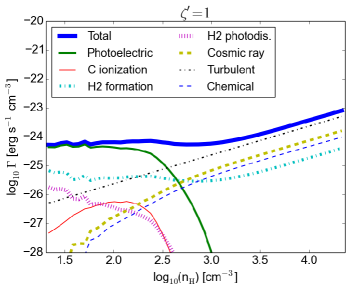
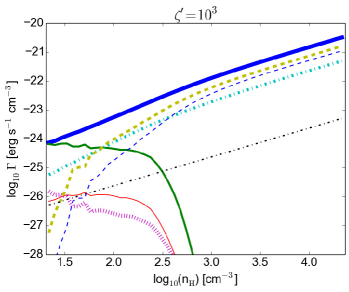
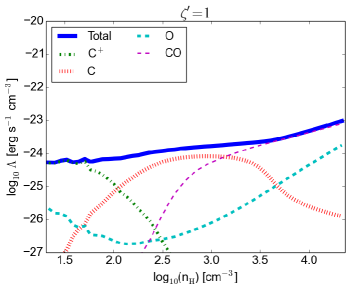
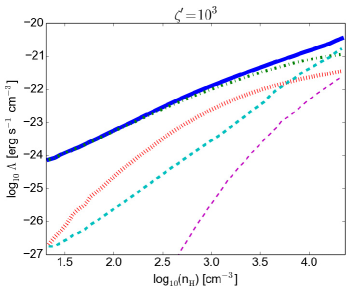
For densities located mainly at the outer regions of the GMC, heating comes predominantly from photoelectrons which are produced due to the isotropic FUV radiation field (see Fig. 4). For and for all , we find that heating results predominantly from contributions due to photoelectrons, dissipation of turbulence, exothermic reactions due to recombinations of HCO+, H, H3O+ and ion-neutral reactions of He+ + H2 (chemical heating), energy deposition due to cosmic-ray reactions and heating due to H2 formation. For higher densities and for , heating results from the turbulence with smaller contributions from cosmic rays and chemical heating. As increases, however, we find that cosmic rays dominate over all other heating mechanisms. The chemical heating also contributes significantly. The latter results from the abundance increase of all participating ions due to reactions ignited by the high cosmic-ray energy density. This is reflected in the lower panel of Fig. 4 where we show the heating functions at .
Likewise, cooling depends on and (see Fig. 5). In particular, for all we find that at low densities, cooling results predominantly from C+ which – along with photoelectric heating – controls the gas temperature at the outer shell of the GMC. The increase of the cosmic-ray ionization rate results in the increase of C+ abundance and hence its cooling efficiency, which in turn decreases the gas temperature. This is actually the reason why the gas temperature is lower at low AV,eff (see §III.3) with increasing cosmic-rays (see §III.4). This result has been further reproduced by 1D calculations confirming the importance of the [C+] increase. For , we find that C+ cooling dominates for densities up to . On the other hand, cooling due to C is important for particularly for densities between . Finally, for CO rotational lines contribute predominantly in the gas cooling for with O to become substantially important for high densities () and high cosmic-ray ionization rates (), although it is not a main coolant in all other cases.
Dust temperatures are calculated for each SPH particle using the treatment of Hollenbach et al. (1991) for the heating due to the incident FUV photons. This approach is further modified to include the attenuation of the IR radiation as described by Rowan-Robinson (1980). Since the UV radiation on the surface of the cloud is approximately Draine (see §II.2), the maximum dust temperature we find is , located at large radii. We impose a floor dust temperature of which is consisted with the average lowest temperatures observed (e.g. Planck Collaboration et al., 2016). We can therefore assume that the dust temperature in the entire cloud is approximately uniform and equal to .
In regions with densities exceeding , CO freeze-out on dust grains may become an important process and the CO abundance in gas phase can be sufficiently reduced affecting its emissivity. Cosmic-ray induced (photo-)desorption can then bring a small fraction of this gas back to gas phase. Our results would not be altered if we were to include this process. This is because only of the total mass of the simulated cloud has densities exceeding and the corresponding CO abundance never exceeds of the total CO abundance throughout the cloud (for whereas for all other cases it is well below ). Moreover in GMCs typically only small H2 gas mass fractions reside at regions with making CO-freeze of little importance for the bulk of their mass.
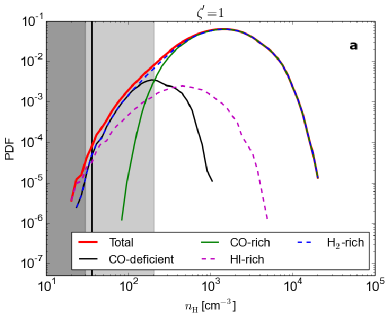
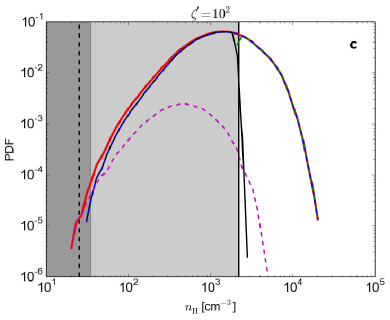
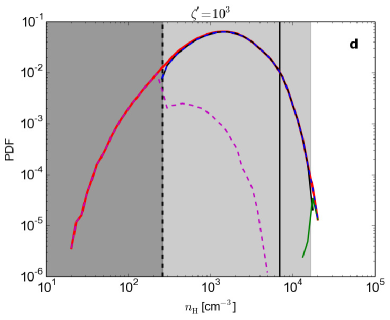
III.3. Probability density functions
Figure 6 shows mass-weighted probability density distribution functions (PDFs) for each simulation. In these plots it can be seen how the effect of CO-destruction operates volumetrically, particularly when applying conditions (2) and (3). In all plots, the non-shaded part corresponds to CO-rich densities, the light-shaded part to all H2-rich but CO-deficient densities and the dark-shaded part to all Hi-rich densities. It is interesting to compare the CO-rich, CO-deficient and Hi regimes with those predicted by B15 from one-dimensional calculations. For this purpose, we plot also in each case the limits for the CO-deficient (vertical solid) and Hi-rich (vertical dashed) regions as indicated in the B15 parameter plot (their Fig. 1). For , B15 find that for densities the gas will be CO-deficient. However, in our 3D simulations we find that for densities up to this value the gas will also be in Hi form. The CO-deficient/H2-rich density range now lies in (Fig. 6a). This difference occurs because of the additional effect of photodissociation of CO due to the isotropic FUV radiation being more effective at lower densities which are located at the outer parts of the cloud (larger radii). This radiation creates also some additional amount of Hi at the outer shell of the cloud, on top of the CR interaction, due to photodissociation of H2.
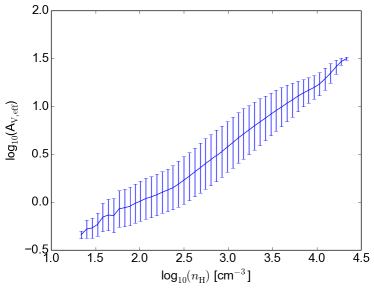
The fact that lower densities are located mostly at the outer parts of the cloud is verified in Fig. 7 where we correlate the effective visual extinction (e.g. Glover et al., 2010; Offner et al., 2013), , defined as
| (8) |
with the number density. This is different from the observed visual extinction. When looking towards the centre of a spherically symmetric cloud, this expression would give half of the observed , which is calculated from one edge of the cloud to the other. In the above equation, corresponds to the number of HEALPix (Górski et al., 2005) rays we used and which is equal555Following the analysis by Offner et al. (2013) we do not expect our result to sensitively depend on the chosen angular resolution. See also Clark et al. (2012) to 12. Indeed from Fig. 7 we find that densities of have mean visual extinction of A and are located mainly at the outer shell of the cloud (see also Wu et al., 2015). They are therefore affected by the FUV radiation.
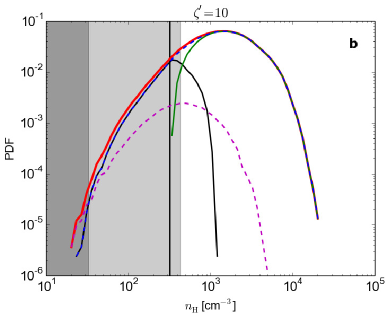
For and (Fig. 6b, c) we find very good agreement with the B15 parameter plot in estimating the density range of the CO-deficient gas. As discussed above, this is the range of cosmic-ray ionization rates for which we obtain high abundances of C while the gas remains almost entirely H2-rich. As can be seen in both cases, the [CO]/[H2] ratio is only for moderate/high densities (i.e. and respectively, see Bialy & Sternberg, 2015, for an analytical description concerning the dependency of the [CO]/[H2] ratio as a function of )
As seen in Fig. 6d, for we find that the density range dominated by Hi is in agreement with the B15 parameter plot at a remarkable precision. However, the density range of the CO-deficient gas is now wider. Although for this , B15 predict that the CO-deficient gas will be observed in the density range, the corresponding upper limit that we find here is . As discussed in B15, the ‘turnover’ point is sensitive to the gas temperature obtained from the thermal balance, whereas the latter is also sensitive to the cooling functions, which depend on the density distribution. We therefore assign this discrepancy to the additional 3D effects that cannot be modelled with corresponding 1D calculations.
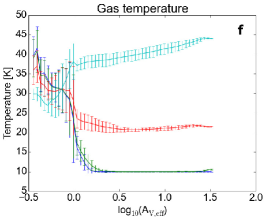
III.4. Abundances distribution and gas temperatures
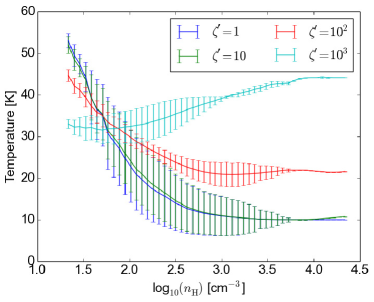
In Fig. 8 we show the gas temperature, , versus the number density for all four different simulations. For all and for we find very good agreement with the predicted of B15 (their Fig. 9). This is because for this range of densities, A thus the isotropic FUV is sufficiently attenuated. Note that the standard-deviation bars of at decrease while for they are negligible. While the FUV has been severely extinguished, this regime is predominantly controlled by the cosmic-ray interaction which in turn depends very weakly on as illustrated in Fig. 9 of B15. We also find that the mean gas temperatures, , in each different are , , and . The low temperatures obtained for Galactic average CR energy densities are similar to those observed for FUV-shielded dark cores (see Bergin & Tafalla, 2007, for a review). Moreover, the fact that remains low and nearly constant for modestly boosted CR energy densities (e.g. Galactic) recovers the result obtained by Papadopoulos et al. (2011) for uniform clouds, further demonstrating the robustness of the initial conditions of star-formation set deep inside such FUV-shielded dense gas regions. This robustness is an important starting point for all gravoturbulent theories of star-formation inside GMCs (Papadopoulos et al., 2011, and references therein).
Note also that for low densities i.e. , found mostly in outer cloud layers and in principle exposed to the isotropic FUV radiation, decreases as increases. This is because the FUV radiation along with the high CR ionization rate creates large amounts of C+, whose emission line is an effective coolant (as discussed in §III.2), driving the decrease of .
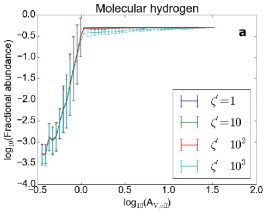
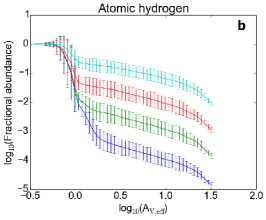
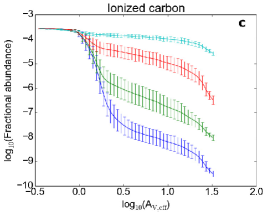
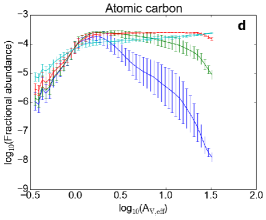
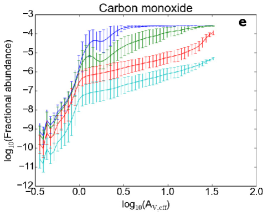
To further understand how the abundance distribution of species changes with it is convenient to correlate them with AV,eff. This is shown in Fig. 9 where panels (a)-(e) show the abundances of H2, Hi, C+, C and CO, and panel (f) that for versus AV,eff. As demonstrated earlier, the abundance of H2 remains remarkably similar under all values. The differences in H2 abundance as a function of are reflected in the abundance of Hi in each case; here we can see that for all , [Hi] in the interior of the cloud i.e. where A. On the contrary, C+, C and CO depend more sensitively on an increasing with CO abundance destroyed even at high density clumps close to the centre of the GMC when are high. As expected, C and C+ follow the reverse trend in which they increase in abundance with increasing . Observe again that for the abundance of C is less than in (as it is also destroyed) indicating that there is a range of cosmic-ray energy densities for which the overall abundance of C peaks and where the C-to-H2 method will be particularly robust. Note that in both Fig. 8 and Fig. 9f, the error bars (corresponding to standard deviation) are much smaller for high and AV,eff respectively meaning that in this regime is approximately uniform and entirely controlled by cosmic-ray heating.
IV. Thermal Balance and the crucial role of OH
The CO molecule can form through various channels (e.g. Herbst & Klemperer, 1973; van Dishoeck & Black, 1988; Sternberg & Dalgarno, 1995; Tielens, 2013). An important formation route, especially at moderate-to-high cosmic-ray or X-ray ionization rates, as well as in low metallicity gas (Bialy & Sternberg, 2015), depends on the OH intermediary. In cold gas () the ion-molecule chemistry dominates, the OH formation is initiated by cosmic-ray ionization of atomic oxygen or its reaction with H, and the OH abundance increases with (Meijerink et al., 2011). However, as discussed by Bialy & Sternberg (2015), this trend holds only up to a critical ionization rate of s-1 (where is the density in units of and is the metallicity relative to Solar). For higher the Hi-to-H2 transition occurs and the abundances of both OH and CO decrease with increasing .
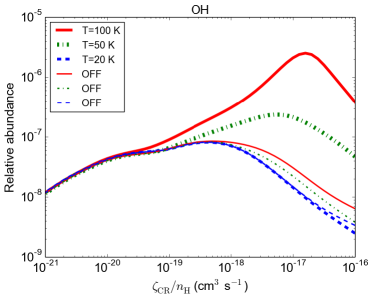
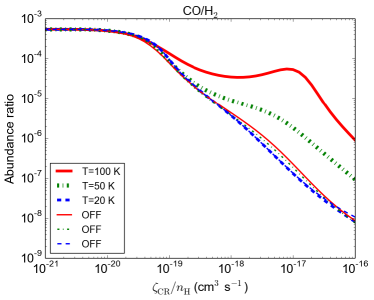
In B15, it was shown that the [CO]/[H2] abundance ratio changes when varying and number density (their Figures 1 and 7 respectively). The chemical analysis discussed in that work (their §4.1) used a gas temperature obtained from full thermal balance calculations. Comparison of our isothermal models at with those of Bialy & Sternberg (2015) showed excellent agreement. Here, we additionally consider isothermal simulations at and at to explore how the [CO]/[H2] ratio depends on sensitivity, a process that was left unclear in the B15 work. We complement the latter work by examining the chemical network responsible for this behaviour and what determines the [CO]/[H2] ratio at different temperatures and a given and .
We use three different isothermal models, at , at and at gas temperatures with . Figure 10 shows the abundances of OH (upper panel) and [CO]/[H2] (lower panel) for those two different temperatures in red, green and blue colours respectively. As can be seen in the upper panel of Fig. 10, at (thick blue dashed lines), the abundance of OH slightly increases from until at which point OH strongly decreases for an increasing ratio. As soon as is increased, the abundance of OH also increases affecting the [CO]/[H2] ratio. In particular, for (thick dot-dashed lines) the abundance of OH keeps increasing monotonically until where it peaks at an abundance of with respect to hydrogen. For (thick red solid lines), the OH abundance peaks at . This trend is reflected in the [CO]/[H2] abundance ratio as shown in the lower panel of this figure. In particular, for , [CO]/[H2] decreases continuously with increasing . For and , a different situation is seen: for a ‘turnover’ appears with a local minimum at and a local maximum at , while for higher , [CO]/[H2] falls.
CO forms through the OH intermediary, and OH is initiated by two important reactions; via proton transfer:
| (9) |
or via charge transfer:
| (10) |
| (11) |
(see also van Dishoeck & Black, 1986; Meijerink et al., 2011; Bialy & Sternberg, 2015). A sequence of abstraction reactions with H2 followed by dissociative recombination then leads to the formation of OH (see Fig. 3 of Bialy & Sternberg, 2015). For low gas temperatures, Reaction 10 is substantially inefficient since it is endoergic by and therefore OH is mainly formed via the H route (Reaction 9). CO is destroyed with He+ and the reaction rate increases with increasing implying that [CO]/[H2] also decreases with increasing . Note that at all times as we have illustrated above, H2 remains unaffected and all changes in the [CO]/[H2] ratio reflect mostly the CO behaviour.
For high gas temperatures and as long as , the abundance of protons is low and therefore OH formation is dominated by Reaction 9. This makes the abundance of OH at and to be almost identical to that at . In this regime, we further find that the removal of OH by C+ is more efficient at low gas temperatures. Once , the abundance of protons is rapidly increasing and Reaction 10 becomes very efficient. This reflects the sudden increase of OH abundance as (red solid line of Fig. 10 upper panel) and hence [CO]/[H2] rises (red solid line, lower panel). Finally, for , the Hi-to-H2 transition takes place and more Hi is formed. This makes the OH and consequently CO formation to become inefficient and thus both those abundances fall.
We then perform a test to study the contribution of Reaction 10 in determining the [CO]/[H2] abundance ratio at different gas temperatures. To do this, we neglect this reaction by setting its rate to a negligible value and re-running the models discussed here. The resultant abundances are plotted in dashed lines in both panels of Fig. 10. For the abundances of OH and [CO]/[H2] (blue dashed lines) are identical to the previous case (blue solid lines) indicating that the charge tranfer reaction is very inefficient at low temperatures. However, for higher temperatures we see that Reaction 10 plays the dominant role in OH formation at high since it is primarily responsible for removing almost all protons; by neglecting it, we obtain the results of the test (red dashed). In turn, this is reflected in the [CO]/[H2] (red dashed) as expected. This work considers Reaction 10 and uses it with temperature dependency. We find that Reaction 10 becomes important for gas temperatures exceeding .
Here it is important to consider that even in vigorously SF galaxies, temperatures significantly higher than may not be reached for most of their molecular gas mass. Thus the large CR-induced depressions of the average [CO]/[H2] abundance ratio are expected to be maintained by the -sensitive chemistry of the chemical network controlling the OH abundance. Indeed, as our Fig. 1 shows, even when Galactic (ULIRG-type of ISM), . Furthermore, for metal-rich ISM environments, FUV photons cannot propagate through sufficiently high gas mass fractions to raise the average beyond that range either (e.g. Papadopoulos et al., 2014), while turbulent heating can only do this for minute fraction of molecular gas mass even in the most turbulent of clouds (Pan & Padoan, 2009; Pon et al., 2012). Exceptions to this will be places, such as the Galactic Center, and possibly some very extreme ULIRGs, such as Arp 220, where are reached, places that either do not contain much of the total H2 gas in otherwise SF-quiescent galaxies or represent SF outliers with respect to the major mode of SF in the Universe.
V. Discussion
In this work we recover the results of B15 of a CR-induced CO destruction in H2 clouds using the more realistic rendering of inhomogeneous clouds. Our three-dimensional simulations demonstrate that by increasing the cosmic-ray ionization rate, the abundance of H2 molecule remains unaffected even for high cosmic-ray ionization rates of the order of times the mean Galactic value. On the other hand the CO abundance is sensitive to even small boosts of , and is easily destroyed forming C+ and consequently C (via recombination with free electrons) as long as gas temperatures . Thus low- CO line emission may become very weak in such ISM environments.
Figures 2 and 3 of B15 show that the emissivities of both C lines are stronger than low- CO lines in CO-poor/H2-rich regimes. This consequently yields a potential advantage of the C lines in tracing the CO-poor H2 gas around the CO-rich regions of inhomogeneous H2 clouds (Bisbas et al. in prep.), along with the CO-rich H2 gas. Secondary effects of a CR-induced and (H2)-sensitive CO destruction can make the visible H2 gas distributions in SF galaxies traced by low- CO line appear clumpier than it actually is. This has been discussed by B15, but here these effects are actually computed for inhomogeneous H2 clouds irradiated by elevated CR energy backgrounds (see Fig. 1). It is worth noting that the CR-induced effects studied in this work mark the warm ‘end’ of the thermal states of potentially CO-invisible H2 gas, while those affected by an enhanced Cosmic Microwave Background Radiation on low-J CO line (and dust continuum) brightness distributions at high redshifts mark the cold ‘end’ (Zhang et al., 2016). Both of these regimes may contain large amounts of molecular gas in galaxies at high () redshifts as SF is typically a highly inefficient process, i.e. there will always be large amounts of cold non-SF H2 gas and dust mass even in SF galaxies.
V.1. Main Sequence galaxies: on the CR ‘firing’ line
The destruction of the CO molecule by SF-powered CRs in H2-rich galaxies is of great importance for studying star formation and its modes in the early Universe where such galaxies still strongly evolve. This is because the H2 gas mass surface density and H2 gas velocity dispersions are deduced from low- CO lines and are the tools to evaluate the stability of gas-rich disks via the Q-Toomre criterion (Hodge et al., 2012; Daddi et al., 2010). Current theoretical views of what drives SF in strongly evolving gaseous galactic disks (e.g. Elmegreen et al., 2008a, b; Bournaud & Elmegreen, 2009; Bournaud et al., 2011) depend on an accurate depiction of the H2 mass surface density and velocity fields, a picture that may be incomplete because of the CR-induced CO destruction in exactly such systems.
In B15 we discussed the possibility that the average [CO]/[H2] abundance may remain high in the ISM of U/LIRGs because the effect of CRs is countered by higher average molecular gas densities. However, such strong merger/starburst systems are not the main mode of SF in the early Universe. Indeed it is in massive gas-rich galaxies, evolving along a narrow region of stellar mass ()-SFR plane, the so-called “Main Sequence” (MS) galaxies (Noeske et al., 2007), where of the cosmic star formation takes place up to (e.g., Bell et al., 2005; Elbaz et al., 2007; Rodighiero et al., 2011). It is these systems, with (e.g Genzel et al., 2012) and seemingly ordinary GMCs (Carleton et al., 2016), that are expected to be the most affected by a CR-induced destruction of CO. This is apparent from Fig. 1 of B15 (where BzK galaxies are MS systems) as well as Fig. 1 of this work from where it can be seen that for , which may correspond to , the CO ‘marking’ of a typical molecular cloud is significantly reduced.
The metallicity-insensitive CR-induced destruction of CO in MS galaxies can only compound the difficulties already posed by the lower metallicities prevaling in some of these systems (Genzel et al., 2012, and references therein), making any CO-deduced H2 gas mass distributions, their scale-lengths, their SFR-controlled gas depletion timescales, dynamical masses and Q-Toomre stability criteria, provisional. In this context it is important to remember that even the well-known effects of strong FUV/low-Z on the [CO]/[H2] abundance ratio can render entire clouds CO-free (Bolatto et al., 1999; Pak et al., 1998) boosting their C (and C+) content. In the /CR domain where a phase transition to very CO-poor H2 gas phases happens, it will be highly non-linear, making a practical calibration of the so-called factor in MS galaxies (Daddi et al., 2010; Genzel et al., 2012; Carleton et al., 2016) and local spiral LIRGs (Papadopoulos et al., 2012a) challenging, even for their CO-marked H2 gas distributions.
Indeed as we have already discussed in §III.1, the ability of CO to survive only in the densest regions of CR-irradiated clouds (Fig. 1) can yield a misleading picture about the actual gas distribution and its thermal and dynamical state. Moreover, a nearly-Galactic factor may still be obtained if such CO-marked sub-regions of the underlying H2 distribution are used for its calibration, even as they are no longer representative of the actual H2 clouds. This can be shown if we consider the dense H2 gas regions where CO survives embedded in columns of CO-free gas. The latter will exert a non-thermal pressure of
| (12) |
where we assumed that the CO-rich gas regions lie mid-plane in a rotating -rich disk, with stars mixed in, at a surface mass density of and vertical velocity dispersion of (with and the corresponding quantities for the gas). For Milky Way, is the average non-thermal pressure on the boundaries of molecular clouds (Elmegreen, 1989). This, crucially, determines the normalization of the so-called linewidth-size relation for a molecular cloud of radius :
| (13) |
(Chieze, 1987; Elmegreen, 1989). Should a CO-invisible H2 gas mass lie ‘on-top’ of CO-rich (and thus observable) cloud regions in the mid-plane of a SF disk, it would exert an ‘overpressure’ on the CO-rich ones. This would appear as a deviation from a Galactic line-width size relation and CO clouds that would seem to be out of virial equillibrium, lowering their corresponding factor (Downes & Solomon, 1998; Papadopoulos et al., 2012a). Nevertheless the very weak dependance of the line-width size relation on allows large amounts of CO-invisible gas to exist without easily discernible observational effects. For a purely H2 gas disk () (assumed here for simplicity), a larger H2 gas surface density would raise by a factor of 25, but the corresponding of CO-rich clouds embedded inside such overlying columns of CO-invisible gas only by a factor of . The latter is within the observational uncertainty of the relation in the Galaxy (e.g. Heyer & Brunt, 2004) and thus any calibration of such overpressured CO-rich clouds would still give a value consistent with a Galactic one within the uncertainties.
V.2. CO chemistry in SF galaxies: towards a dynamical framework
The physics and chemistry of the CR-induced destruction of CO can now be readily used in galaxy-sized/cosmological evolution models. Doing so will: a) shed light on what happens in the context of galaxy evolution models as the /CR ‘boundary’ conditions of molecular clouds evolve, and b) help the interface of such models with actual observables (e.g. low- CO and C images of galaxies with ALMA/JVLA). Past work has already incorporated, in a sub-grid fashion, the effects of FUV destruction of CO in H2 clouds inside galaxies (Pelupessy & Papadopoulos, 2009; Olsen et al., 2015; Richings & Schaye, 2016). CR-driven effects will be even easier to implement in such models insofar as full transparency of H2 clouds to CRs and are assumed. Moreover, C lines as H2 gas mass tracers in galaxies at high redshifts have already been discussed in a cosmological context (Tomassetti et al., 2014). Once CR effects are taken into account in galaxy-scale models, one can then: a) evaluate the best method(s) in obtaining the H2 mass distributions and velocity fields in SF galaxies evolving across cosmic epoch, and b) ascertain whether current theoretical views about the role of unstable giant H2 clumps in driving the SF of gas-rich early galaxies (Bournaud et al., 2014) still hold (e.g. a C-imaged distribution may be a smoother one than a CO-imaged one in a CR-irradiated gaseous disk, impacting also the deduced gas velocity fields from these lines).
Such models can also shed light on another very important caveat discussed by B15, namely the role of turbulence. Observations of the so called (U)LIRGs, extreme merger/starburst systems, indicate that regions with high SFR density (and thus ) are also regions of strong turbulence of H2 clouds, and thus of high mass fractions per GMC. With CO remaining abundant in high-density gas (), even when average are high, this can diminish and even counteract the effects of CR-induced CO destruction in such environments as now most of the H2 gas no longer resides in the low-density regime () as in the MW (densities where CO would be CR-destroyed very effectively) but at high densities. In this regard, the [CO]/[H2] abundance ratio obtained from our simulations is of particular interest. In Fig. 11 we plot this ratio versus the total H-nucleus number density for all four different examined. For most of the molecular cloud gas has [CO]/[H2], making it very CO-poor. For higher densities and according to B15, this ratio would exceed at only for assuming no significant freeze-out.
Numerical simulations of individual turbulent H2 clouds study the effects of constant, pre-set FUV radiation fields and CR energy densities on the CO and C distributions and the corresponding line emission (e.g. Glover & Clark, 2016, as well as the present work). Such models, while useful in finding trends of CO and C line emission as H2 gas mass tracers in GMCs, they cannot address the issue of what happens when such clouds are immersed in actual galaxies, where the FUV and CR energy densities around these clouds vary strongly on timescales equal or shorter than internal cloud chemical and dynamical timescales (Pelupessy et al., 2006). This is because in individual cloud simulations the ‘boundary’ conditions of FUV radiation, , and turbulent energy injection are not tracked. Galaxy-sized models (e.g. Smith et al., 2014) that include H2 clouds, along with the appropriate physics and chemistry behind the FUV/CR ‘drivers’, modelled in tandem with the evolving conditions of a SF galaxy are thus invaluable in examining whether in high SFR-density environments, H2 gas remains mostly CO-rich or not (see Pelupessy & Papadopoulos, 2009, for an early such treatment where CO and H2 are treated separately and FUV radiation onto clouds within galaxies is tracked).
Regardless of any future theoretical ‘verdict’ on whether CO-invisible molecular gas can exist in large quantities in SF galaxies in the early Universe during periods of high SFR densities, observations of low- CO and C lines in such systems are indispensable. Here we re-iterate that the C column density retains its robustness in tracing H2 column near-proportionally for (see Fig. 1). In particular we find that for such CR-ionization rates, i (for our adopted carbon elemental abundance). This relation depends weakly on provided that , contrary to the corresponding one for CO. Moreover, even for MW-level of values, the per beam will remain larger than that of CO or (the two CO transitions used to trace the bulk of H2 mass in galaxies) as long as the same beam is used to image the H2 gas in all lines666The lowest observed brightness temperature ratio of / in Milky Way is (Papadopoulos et al., 2004). If we were to observe and at the same resolution, then in the Rayleigh-Jeans regime the flux per beam boost would be . This can lead to signal-to-noise advantages for the C line obsrevations depending on the redshift of the object (see Papadopoulos et al., 2004). If is increased, C lines are becoming brighter still, increasing this kind of advantage.. This, along with the possibility that C line imaging of SF disks at high- finds a different (smoother and/or possibly more extended) H2 gas distribution, because of large quantities of CO-poor H2, argues strongly for sensitive C line imaging of gas-rich SF galaxies (Bisbas et al. in preparation).
In this work we also identified the exact chemistry behind the large gas temperature sensitivity on the CO formation in H2 clouds (see §IV), an issue initially discussed by B15. The gas temperature sensitivity of our results elevates the importance of reliable computation of the average thermal state of H2 gas in FUV/CR-intensive environments found within SF galaxies. As demonstrated in Fig. 4, CRs can provide an important heating source throughout the GMC and particularly in regions with . This in turn can increase the gas temperature deep in the cloud (where the FUV has been severely attenuated) to values of the order of (Meijerink et al., 2011; Papadopoulos et al., 2011). Such gas temperatures are still low for the CO formation to occur via the O+H+ charge transfer. In low metallicity galaxies, a higher gas temperature may be expected as cooling efficiency and shielding is less than in solar metallicity ones, perhaps moderating the CR-induced destruction of CO in high environments, as discussed in §IV. It is thus necessary that the CR effects are studied together with those driven by lower metallicities in order to discern their combined impact on the average [CO]/[H2] abundance in metal-poor star forming galaxies.
Even though we used standard cooling/heating mechanisms of PDR/CRDR physics (see §III.2), turbulence will also heat the molecular gas (e.g. Pan & Padoan, 2009), and do so in a volumetric manner just like the CRs. Turbulent heating has even been argued as a dominant heating mechanism of galaxy-sized H2 gas reservoirs in some extreme SF galaxies (Papadopoulos et al., 2012b), even as numerical simulations of individual molecular clouds show that turbulent heating typically affects only of their mass (Pan & Padoan, 2009; Pon et al., 2012). The so-called ‘Brick’ cloud is a well studied object close to the Galactic Centre. Simulations performed by Clark et al. (2013) have reproduced its observed gas and dust temperatures when their modeled cloud interacts with a FUV of strength and a . Early suggestions by Ao et al. (2013) proposed that the gas heating of the Central Molecular Zone (CMZ) at the Galactic Centre is primarily dominated by cosmic-rays and/or turbulence. Recent observations by Ginsburg et al. (2016), however, show that the dominant heating mechanism of the particular ‘Brick’ cloud is turbulence which, in association with an LVG analysis, give an upper limit of . However, in places of the CMZ cosmic-rays may still be a very important heating source particular in less turbulent sub-regions (Ginsburg et al., 2016).
Our simple treatment of turbulent heating (Black, 1987; Rodríguez-Fernández et al., 2001; Bisbas et al., 2012) leaves unaswered the question of how much it can influence the average thermal states of the typically very turbulent H2 gas in extreme starbursts with high SFR densities. Numerical simulations of individual H2 gas clouds, at Mach numbers appropriate for the ISM of galaxies with very high SFR densities ( times that of ordinary spirals), that include turbulent heating along with the chemistry and physics of CR-induced CO destruction are necessary for answering this question. If strong turbulence can elevate the average H2 gas temperatures and densities of galaxies with high SFR densities (typically merger/starbursts), it may still keep the [CO]/[H2] abundance ratio high and the H2 gas traceable via the traditional methods based on CO (see B15 for the relevant discussion).
VI. Conclusions
In this paper, continuing the study of Bisbas et al. (2015), we present results from a suite of three-dimensional astrochemical simulations of inhomogeneous molecular clouds, rendered as a fractal, and embedded in different cosmic-ray ionization rates spanning three orders of magnitude () along with a constant isotropic FUV radiation field (). Our study therefore focuses only on the effect of high cosmic-ray ionization rates expected in SF galaxies in the Universe, and how it affects the abundances of CO, C, C+, Hi and H2. We used the 3d-pdr (Bisbas et al., 2012) code to perform full thermal balance and chemistry calculations. Our results can be summarized as follows:
-
1.
The column density and total H2 mass of a typical inhomogeneous GMC remains nearly constant for increasing , with the total mass of H2 decreasing by for (). On the other hand a significant reduction of the [CO]/[H2] abundance ratio sets in throughout the cloud, even when (), a value expected for the ISM of many star-forming galaxies in the Universe.
-
2.
When the average increases further, up to the CO molecule is destroyed so thoroughly that only the densest regions of the GMC remain CO-rich. The abundances of C and C+ on the other hand increase, with the latter becoming particularly abundant for . Atomic carbon is the species that proves to be the most abundant, ‘marking’ most of the H2 mass of the cloud over a wide range of values. Using only CO rotational transitions to discern the average state and mass of such CR-irradiated GMCs will only recover their highest density peaks (), make the clouds appear clumpier than they truly are, and convey biased information on the molecular gas velocity fields.
-
3.
We expect significant effects of CR-induced destruction of CO to occur in the so-called Main Sequence Galaxies, the systems where most of the cosmic history of star formation unfolds. This is a result of their high SF rates (implying high CR rates) and seemingly Galactic-type molecular clouds. The widespread CR destruction of CO expected in such systems will make the calibration of their factor challenging, even for their CO-bright gas.
-
4.
Our computations recover gas temperatures of for the CR-irradiated and FUV-shielded dense regions inside those GMCs. This is indeed typical for such regions in the Galaxy and it remains robust over . This is of particular importance if the initial conditions of SF, and the stellar initial mass function (IMF) mass scale (i.e. the IMF ‘knee’) are indeed set within such regions. Nevertheless, once , the temperature of such regions rises up to , and the initial conditions of star formation in such galaxies are bound to change.
-
5.
The main heating mechanisms in cosmic-ray dominated regions apart from CRs, are the chemical mechanism (due to the large amounts of ions expected in CRDRs) and the H2 formation mechanism. Cooling on the other hand, is mainly due to C+ and O with the contribution of CO cooling nearly negligible, as its abundance is at least two orders of magnitude lower than in normal Galactic conditions.
-
6.
We find the CR-regulated [CO]/[H2] abundance ratio to be sensitive to the temperature of the gas once . A significant production of the OH molecule, acting as an intermediary, is the -sensitive part of the chemical network that determines the [CO]/[H2] ratio. For warm gas at abundant OH can keep the molecular gas CO-rich (i.e. [CO]/[H2]), even in high CR energy environments. The severe CR-induced destruction of CO sets in for , which our thermochemical calculations indicate as containing the bulk of H2 mass in our inhomogeneous cloud models, and indeed the bulk of molecular gas in SF galaxies, except perhaps in the most extreme merger/starbursts.
-
7.
Our simple treatment of turbulent heating, and the fact that GMCs in the very high SFR density environments of merger/starburst galaxies are much more turbulent and thus denser, necessitate careful considerations of turbulent heating and a dynamic rendering of density inhomogeneities in order to explore our findings in a fully realistic setting.
-
8.
Finally, the chemistry and thermal-balance calculations behind the CR-controlled [CO]/[H2], [C]/[H2], and [C+]/[H2] abundance ratios inside inhomogeneous H2 clouds can be used in a sub-grid fashion as elements of galaxy-sized numerical simulations of evolving galaxies. This is perhaps a vital ingredient of any realistic galaxy evolution model across cosmic epoch, given the elevated SFR densities –and thus CR energy densities– typically observed in galaxies in the distant Universe.
As a final conclusion we mention that because of the strong effects of CRs on the CO abundance combined with the effects of high FUV and/or low metallicity environments in further reducing its abundance, and the impracticallity of C+ imaging in SF galaxies except for the highest redshift objects (), a concerted effort must be mounted by the extragalactic community towards C line imaging of H2 gas in the Universe as a viable alternative.
Acknowledgements
The authors thank an anonymous referee for reviewing the manuscript and whose comments have impoved the clarity of this work. We thank Andreas Schruba, Andrew Strong, Rob Ivison, Nick Indriolo, Steffi Walch and Paola Caselli for the useful discussions. This work is supported by a Royal Netherlands Academy of Arts and Sciences (KNAW) professor prize, and by the Netherlands Research School for Astronomy (NOVA). The work of PPP was funded by an Ernest Rutherford Fellowship. SB acknowledges support from the DFG via German-Israel Project Cooperation grant STE1869/2-1 GE625/17-1. LSz acknowledges support from the A-ERC grant 108477 PALs. ZYZ acknowledges support from ERC in the form of the Advanced Investigator Programme, 321302 COSMICISM.
References
- Ao et al. (2013) Ao, Y., Henkel, C., Menten, K. M., et al. 2013, A&A, 550, A135
- Asplund et al. (2009) Asplund, M., Grevesse, N., Sauval, A. J., & Scott, P. 2009, ARA&A, 47, 481
- Bakes & Tielens (1994) Bakes, E. L. O., & Tielens, A. G. G. M. 1994, ApJ, 427, 822
- Bell et al. (2005) Bell, E. F., Papovich, C., Wolf, C., et al. 2005, ApJ, 625, 23
- Bell et al. (2006) Bell, T. A., Roueff, E., Viti, S., & Williams, D. A. 2006, MNRAS, 371, 1865
- Bell et al. (2007) Bell, T. A., Viti, S., & Williams, D. A. 2007, MNRAS, 378, 983
- Bergin & Tafalla (2007) Bergin, E. A., & Tafalla, M. 2007, ARA&A, 45, 339
- Bialy & Sternberg (2016) Bialy, S., & Sternberg, A. 2016, ApJ, 822, 83
- Bialy & Sternberg (2015) Bialy, S., & Sternberg, A. 2015, MNRAS, 450, 4424
- Bisbas et al. (2015) Bisbas, T. G., Papadopoulos, P. P., & Viti, S. 2015, ApJ, 803, 37 [‘B15’]
- Bisbas et al. (2012) Bisbas, T. G., Bell, T. A., Viti, S., Yates, J., & Barlow, M. J. 2012, MNRAS, 427, 2100
- Black (1987) Black J. H., 1987, in Hollenbach D. J., Thronson H. A. Jr., eds, Astrophys. Space Sci. Libr., Vol. 134, Interstellar processes. Reidel, Dordrecht, p. 731
- Bradford et al. (2003) Bradford, C. M., Nikola, T., Stacey, G. J., et al. 2003, ApJ, 586, 891
- Bryant & Scoville (1996) Bryant, P. M., & Scoville, N. Z. 1996, ApJ, 457, 678
- Bolatto et al. (1999) Bolatto, A. D., Jackson, J. M., & Ingalls, J. G. 1999, ApJ, 513, 275
- Bolatto et al. (2013) Bolatto, A. D., Wolfire, M., & Leroy, A. K. 2013, ARA&A, 51, 207
- Bothwell et al. (2017) Bothwell, M. S., Aguirre, J. E., Aravena, M., et al. 2017, MNRAS, 466, 2825
- Bournaud & Elmegreen (2009) Bournaud, F., & Elmegreen, B. G. 2009, ApJ, 694, L158
- Bournaud et al. (2011) Bournaud, F., Chapon, D., Teyssier, R., et al. 2011, ApJ, 730, 4
- Bournaud et al. (2014) Bournaud, F., Perret, V., Renaud, F., et al. 2014, ApJ, 780, 57
- Burke & Hollenbach (1983) Burke, J. R., & Hollenbach, D. J. 1983, ApJ, 265, 223
- Cardelli et al. (1996) Cardelli, J. A., Meyer, D. M., Jura, M., & Savage, B. D. 1996, ApJ, 467, 334
- Carleton et al. (2016) Carleton, T., Cooper, M. C., Bolatto, A. D., et al. 2016, arXiv:1611.04587
- Cartledge et al. (2004) Cartledge, S. I. B., Lauroesch, J. T., Meyer, D. M., & Sofia, U. J. 2004, ApJ, 613, 1037
- Cazaux & Spaans (2004) Cazaux, S., & Spaans, M. 2004, ApJ, 611, 40
- Cazaux & Tielens (2002) Cazaux, S., & Tielens, A. G. G. M. 2002, ApJ, 575, L29
- Chen et al. (2015) Chen, B.-Q., Liu, X.-W., Yuan, H.-B., Huang, Y., & Xiang, M.-S. 2015, MNRAS, 448, 2187
- Chieze (1987) Chieze, J. P. 1987, A&A, 171, 225
- Clark et al. (2012) Clark, P. C., Glover, S. C. O., & Klessen, R. S. 2012, MNRAS, 420, 745
- Clark et al. (2013) Clark, P. C., Glover, S. C. O., Ragan, S. E., Shetty, R., & Klessen, R. S. 2013, ApJ, 768, L34
- Clavel et al. (1978) Clavel, J., Viala, Y. P., & Bel, N. 1978, A&A, 65, 435
- Cummings et al. (2015) Cummings, A. C., Stone, E. C., Heikkila, B. C., et al., 2015, PoS(ICRC2015)318
- Daddi et al. (2010) Daddi, E., Bournaud, F., Walter, F., et al. 2010, ApJ, 713, 686
- Dalgarno (2006) Dalgarno, A. 2006, Proceedings of the National Academy of Science, 103, 12269
- Dickman et al. (1986) Dickman, R. L., Snell, R. L., & Schloerb, F. P. 1986, ApJ, 309, 326
- Downes & Solomon (1998) Downes, D., & Solomon, P. M. 1998, ApJ, 507, 615
- Draine (1978) Draine, B. T. 1978, ApJS, 36, 595
- Elbaz et al. (2007) Elbaz, D., Daddi, E., Le Borgne, D., et al. 2007, A&A, 468, 33
- Elmegreen (1989) Elmegreen, B. G. 1989, ApJ, 338, 178
- Elmegreen et al. (2008a) Elmegreen, B. G., Bournaud, F., & Elmegreen, D. M. 2008a, ApJ, 688, 67-77
- Elmegreen et al. (2008b) Elmegreen, B. G., Bournaud, F., & Elmegreen, D. M. 2008b, ApJ, 684, 829-834
- Genzel et al. (2012) Genzel, R., Tacconi, L. J., Combes, F., et al. 2012, ApJ, 746, 69
- Genzel et al. (2015) Genzel, R., Tacconi, L. J., Lutz, D., et al. 2015, ApJ, 800, 20
- Gerin & Phillips (2000) Gerin, M., & Phillips, T. G. 2000, ApJ, 537, 644
- Ginsburg et al. (2016) Ginsburg, A., Henkel, C., Ao, Y., et al. 2016, A&A, 586, A50
- Glover et al. (2010) Glover, S. C. O., Federrath, C., Mac Low, M.-M., & Klessen, R. S. 2010, MNRAS, 404, 2
- Glover et al. (2015) Glover, S. C. O., Clark, P. C., Micic, M., & Molina, F. 2015, MNRAS, 448, 1607
- Glover & Clark (2016) Glover, S. C. O., & Clark, P. C. 2016, MNRAS, 456, 3596
- Glover & Clark (2012) Glover, S. C. O., & Clark, P. C. 2012, MNRAS, 421, 9
- Górski et al. (2005) Górski, K. M., Hivon, E., Banday, A. J., et al. 2005, ApJ, 622, 759
- Gratier et al. (2016) Gratier, P., Braine, J., Schuster, K., et al. 2016, arXiv:1609.03791
- Gullberg et al. (2016) Gullberg, B., Lehnert, M. D., De Breuck, C., et al. 2016, A&A, 591, A73
- Habing (1968) Habing, H. J. 1968, Bull. Astron. Inst. Netherlands, 19, 421
- Herbst & Klemperer (1973) Herbst, E., & Klemperer, W. 1973, ApJ, 185, 505
- Heyer & Brunt (2004) Heyer, M. H., & Brunt, C. M. 2004, ApJ, 615, L45
- Hodge et al. (2012) Hodge, J. A., Carilli, C. L., Walter, F., et al. 2012, ApJ, 760, 11
- Hollenbach et al. (1991) Hollenbach, D. J., Takahashi, T., & Tielens, A. G. G. M. 1991, ApJ, 377, 192
- Hollenbach & McKee (1979) Hollenbach, D., & McKee, C. F. 1979, ApJS, 41, 555
- Hopkins & Beacom (2006) Hopkins, A. M., & Beacom, J. F. 2006, ApJ, 651, 142
- Hubber et al. (2011) Hubber, D. A., Batty, C. P., McLeod, A., & Whitworth, A. P. 2011, A&A, 529, A27
- Indriolo & McCall (2012) Indriolo, N., & McCall, B. J. 2012, ApJ, 745, 91
- Indriolo et al. (2015) Indriolo, N., Neufeld, D. A., Gerin, M., et al. 2015, ApJ, 800, 40
- Israel & Baas (2001) Israel, F. P., & Baas, F. 2001, A&A, 371, 433
- Krips et al. (2016) Krips, M., Martín, S., Sakamoto, K., et al. 2016, A&A, 592, L3
- Lacy et al. (1994) Lacy, J. H., Knacke, R., Geballe, T. R., & Tokunaga, A. T. 1994, ApJ, 428, L69
- Lada & Blitz (1988) Lada, E. A., & Blitz, L. 1988, ApJ, 326, L69
- Le Petit et al. (2016) Le Petit, F., Ruaud, M., Bron, E., et al. 2016, A&A, 585, A105
- Lo et al. (2014) Lo, N., Cunningham, M. R., Jones, P. A., et al. 2014, ApJ, 797, L17
- Mashian et al. (2013) Mashian, N., Sternberg, A., & Loeb, A. 2013, MNRAS, 435, 2407
- McCall et al. (2003) McCall, B. J., Huneycutt, A. J., Saykally, R. J., et al. 2003, Nature, 422, 500
- McElroy et al. (2013) McElroy, D., Walsh, C., Markwick, A. J., et al. 2013, A&A, 550, A36
- Meijerink et al. (2011) Meijerink, R., Spaans, M., Loenen, A. F., & van der Werf, P. P. 2011, A&A, 525, A119
- Monaghan & Lattanzio (1985) Monaghan, J. J., & Lattanzio, J. C. 1985, A&A, 149, 135
- Narayanan & Krumholz (2016) Narayanan, D., & Krumholz, M. 2016, arXiv:1601.05803
- Neufeld et al. (2010) Neufeld, D. A., González-Alfonso, E., Melnick, G., et al. 2010, A&A, 521, L5
- Nishimura et al. (2015) Nishimura, A., Tokuda, K., Kimura, K., et al. 2015, ApJS, 216, 18
- Noeske et al. (2007) Noeske, K. G., Weiner, B. J., Faber, S. M., et al. 2007, ApJ, 660, L43
- Offner et al. (2013) Offner, S. S. R., Bisbas, T. G., Viti, S., & Bell, T. A. 2013, ApJ, 770, 49
- Offner et al. (2014) Offner, S. S. R., Bisbas, T. G., Bell, T. A., & Viti, S. 2014, MNRAS, 440, L81
- Olsen et al. (2015) Olsen, K. P., Greve, T. R., Narayanan, D., et al. 2015, ApJ, 814, 76
- Padoan et al. (2009) Padoan, P., Juvela, M., Kritsuk, A., & Norman, M. L. 2009, ApJ, 707, L153
- Padovani et al. (2013) Padovani, M., Hennebelle, P., & Galli, D. 2013, A&A, 560, A114
- Pak et al. (1998) Pak, S., Jaffe, D. T., van Dishoeck, E. F., Johansson, L. E. B., & Booth, R. S. 1998, ApJ, 498, 735
- Pan & Padoan (2009) Pan, L., & Padoan, P. 2009, ApJ, 692, 594
- Papadopoulos & Seaquist (1999) Papadopoulos, P. P., & Seaquist, E. R. 1999, ApJ, 516, 114
- Papadopoulos et al. (2002) Papadopoulos, P. P., Thi, W.-F., & Viti, S. 2002, ApJ, 579, 270
- Papadopoulos et al. (2004) Papadopoulos, P. P., Thi, W.-F., & Viti, S. 2004, MNRAS, 351, 147
- Papadopoulos & Greve (2004b) Papadopoulos, P. P., & Greve, T. R. 2004b, ApJ, 615, L29
- Papadopoulos (2010) Papadopoulos, P. P. 2010, ApJ, 720, 226
- Papadopoulos et al. (2011) Papadopoulos, P. P., Thi, W.-F., Miniati, F., & Viti, S. 2011, MNRAS, 414, 1705
- Papadopoulos et al. (2012a) Papadopoulos, P. P., van der Werf, P., Xilouris, E., Isaak, K. G., & Gao, Y. 2012a, ApJ, 751, 10
- Papadopoulos et al. (2012b) Papadopoulos, P. P., van der Werf, P. P., Xilouris, E. M., et al. 2012b, MNRAS, 426, 2601
- Papadopoulos et al. (2014) Papadopoulos, P. P., Zhang, Z.-Y., Xilouris, E. M., et al. 2014, ApJ, 788, 153
- Pelupessy et al. (2006) Pelupessy, F. I., Papadopoulos, P. P., & van der Werf, P. 2006, ApJ, 645, 1024
- Pelupessy & Papadopoulos (2009) Pelupessy, F. I., & Papadopoulos, P. P. 2009, ApJ, 707, 954
- Planck Collaboration et al. (2016) Planck Collaboration, Ade, P. A. R., Aghanim, N., et al. 2016, A&A, 594, A28
- Polychroni et al. (2012) Polychroni, D., Moore, T. J. T., & Allsopp, J. 2012, MNRAS, 422, 2992
- Pon et al. (2012) Pon, A., Johnstone, D., & Kaufman, M. J. 2012, ApJ, 748, 25
- Price (2007) Price, D. J. 2007, PASA, 24, 159
- Richings & Schaye (2016) Richings, A. J., & Schaye, J. 2016, MNRAS, 460, 2297
- Rimmer et al. (2012) Rimmer, P. B., Herbst, E., Morata, O., & Roueff, E. 2012, A&A, 537, A7
- Rodighiero et al. (2011) Rodighiero, G., Daddi, E., Baronchelli, I., et al. 2011, ApJ, 739, L40
- Rodríguez-Fernández et al. (2001) Rodríguez-Fernández, N. J., Martín-Pintado, J., Fuente, A., et al. 2001, A&A, 365, 174
- Rowan-Robinson (1980) Rowan-Robinson, M. 1980, ApJS, 44, 403
- Sánchez et al. (2010) Sánchez, N., Añez, N., Alfaro, E. J., & Crone Odekon, M. 2010, ApJ, 720, 541
- Sanders et al. (2003) Sanders, D. B., Mazzarella, J. M., Kim, D.-C., Surace, J. A., & Soifer, B. T. 2003, AJ, 126, 1607
- Schöier et al. (2005) Schöier, F. L., van der Tak, F. F. S., van Dishoeck, E. F., & Black, J. H. 2005, A&A, 432, 369
- Solomon et al. (1997) Solomon, P. M., Downes, D., Radford, S. J. E., & Barrett, J. W. 1997, ApJ, 478, 144
- Solomon et al. (1987) Solomon, P. M., Rivolo, A. R., Barrett, J., & Yahil, A. 1987, ApJ, 319, 730
- Smith et al. (2014) Smith, R. J., Glover, S. C. O., Clark, P. C., Klessen, R. S., & Springel, V. 2014, MNRAS, 441, 1628
- Sternberg & Dalgarno (1995) Sternberg, A., & Dalgarno, A. 1995, ApJS, 99, 565
- Sternberg et al. (2014) Sternberg, A., Le Petit, F., Roueff, E., & Le Bourlot, J. 2014, ApJ, 790, 10
- Strong et al. (2004a) Strong, A. W., Moskalenko, I. V., Reimer, O., Digel, S., & Diehl, R. 2004, A&A, 422, L47
- Strong et al. (2004b) Strong, A. W., Moskalenko, I. V., & Reimer, O. 2004, ApJ, 613, 962
- Szűcs et al. (2016) Szűcs, L., Glover, S. C. O., & Klessen, R. S. 2016, MNRAS, 460, 82
- Tielens (2013) Tielens, A. G. G. M. 2013, Reviews of Modern Physics, 85, 1021
- Tielens & Hollenbach (1985) Tielens, A. G. G. M., & Hollenbach, D. 1985, ApJ, 291, 722
- Tomassetti et al. (2014) Tomassetti, M., Porciani, C., Romano-Díaz, E., Ludlow, A. D., & Papadopoulos, P. P. 2014, MNRAS, 445, L124
- van Dishoeck & Black (1986) van Dishoeck, E. F., & Black, J. H. 1986, ApJS, 62, 109
- van Dishoeck & Black (1988) van Dishoeck, E. F., & Black, J. H. 1988, ApJ, 334, 771
- van Dishoeck (1992) van Dishoeck, E. F. 1992 in IAU Symp. 150, Astrochemistry of Cosmic Phenomena, ed. P. D. Singh (Dordrecht: Kluwer), 143
- Walch et al. (2015) Walch, S., Whitworth, A. P., Bisbas, T. G., Hubber, D. A., Wünsch, R. 2015, MNRAS, 452, 2794
- Wolfire et al. (2003) Wolfire, M. G., McKee, C. F., Hollenbach, D., & Tielens, A. G. G. M. 2003, ApJ, 587, 278
- Wolfire et al. (2010) Wolfire, M. G., Hollenbach, D., & McKee, C. F. 2010, ApJ, 716, 1191
- Wu et al. (2015) Wu, B., Van Loo, S., Tan, J. C., & Bruderer, S. 2015, ApJ, 811, 56
- Xie et al. (1995) Xie, T., Allen, M., & Langer, W. D. 1995, ApJ, 440, 674
- Zhang et al. (2014) Zhang, Z.-Y., Henkel, C., Gao, Y., et al. 2014, A&A, 568, A122
- Zhang et al. (2016) Zhang, Z.-Y., Papadopoulos, P. P., Ivison, R. J., et al. 2016, Royal Society Open Science, 3, 160025
Appendix A A. Chemical network and initial elemental abundances
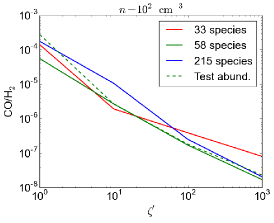
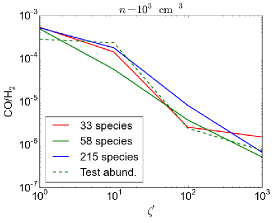
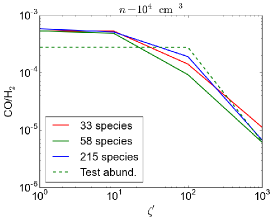
We explore the dependence of our results on the choice of chemical network and the choice of initial elemental abundances. To do this, we perform a suite of 0D calculations where we switch off the UV radiation field. We use densities of interacting with cosmic-ray ionization rates (see Eqn. 1). We consider two subsets and the full UMIST 2012 (McElroy et al., 2013) consisting of 33 species (4 elements: H, He, C, O), 58 species (2 additional elements: Mg, S), and 215 species (4 additional elements: Na, Fe, Si, N) respectively. In addition to Table 1, the initial abundances of the last four elements used are Na=1.73810-6, Fe=3.16210-5, Si=3.23610-5 and N=6.7610-5 (Asplund et al., 2009). The results of the above tests are shown in red solid (33 species), green solid (58 species) and blue solid (215 species) lines in Fig. 121.
We further perform additional simulations using the subset of 58 species only and in which we change the initial values of elemental abundances to those that have been measured by optical/UV absorption lines in diffuse clouds with densities similar to those of our fractal GMCs. We use C=1.410-4 (Cardelli et al., 1996), O=2.810-4 (Cartledge et al., 2004) and Mg=7 while keeping S as shown in Table 1 as it is observed to remain largely undepleted. The reduction of the Mg abundance by orders of magnitude compared to the value shown in Table 1 is motivated by the fact that such high abundances of Mg may act as a non-negligible source of electrons which can in turn affect the [CO]/[H2] ratio. The results of this test are shown in Fig. 121 as green dashed lines. These abundances correspond to environments with metallicities . We note that thoughout this work we have assumed solar metallicity at all times and we do not explore the effect of CR-induced CO destruction in sub-solar and super-solar environments. For all reasonable assumptions, C/O which is consistent with diffuse ISM observations, and always .
Overall, from the above suite of tests we find that the general trend of the [CO]/[H2] abundance ratio decrease by increasing the cosmic-ray ionization rate remains robust. We therefore demonstrate that the validity of findings presented in this work and in particular the column density maps shown in Fig. 1 do not strongly depend on the complexity of the chemical network used or the choice of initial elemental abundances adopted.
Appendix B B. Mapping SPH to grid
We convert the properties of the cloud (number density distribution, gas temperatures, etc.) from SPH to uniform grid in order to produce the column density plots of Fig. 1. Each SPH particle, , comprising the cloud has a smoothing length and carries the corresponding PDR information from the 3d-pdr calculations. In order to weight an SPH quantity, , in the centroid, , of a given cell of the uniform grid we use the equation
| (B1) |
where is the number of the closest neighbouring SPH particles to the centroid of the cell and is the Monaghan & Lattanzio (1985) softening kernel
| (B2) |
where . The number of SPH particles in each grid cell varies from few tens (highest density regions) to none (outside the cloud). Similar techniques have been discussed by Price (2007).