Landau level spectroscopy of massive Dirac fermions in single-crystalline ZrTe5 thin flakes
Abstract
We report infrared magneto-spectroscopy studies on thin crystals of an emerging Dirac material ZrTe5 near the intrinsic limit. The observed structure of the Landau level transitions and zero-field infrared absorption indicate a two-dimensional Dirac-like electronic structure, similar to that in graphene but with a small relativistic mass corresponding to a 9.4 meV energy gap. Measurements with circularly polarized light reveal a significant electron-hole asymmetry, which leads to splitting of the Landau level transitions at high magnetic fields. Our model, based on the Bernevig-Hughes-Zhang effective Hamiltonian, quantitatively explains all observed transitions, determining the values of the Fermi velocity, Dirac mass (or gap), electron-hole asymmetry, and electron and hole -factors.
pacs:
71.55.Ak, 71.70.Di, 78.20.-e, 78.20.LsZirconium pentatelluride (ZrTe5) has long been recognized as a layered thermoelectric material thermo . It has attracted substantial interest lately in the wave of Dirac and topological material exploration Vafek , due to the theoretical prediction of a large-gap quantum spin Hall insulator phase in its monolayer form Thoery1_FZ . Theory also predicts that the electronic structure of bulk ZrTe5 resides near the phase boundary between weak and strong topological insulators (TIs) Thoery1_FZ ; NewTheory_Zhou , providing an ideal platform for studying topological phase transitions. Surface-sensitive spectroscopy techniques such as angle-resolved photoemission spectroscopy (ARPES) and scanning tunneling spectroscopy have recently been used to probe the surface and bulk states of ZrTe5 Arpes0_GDG ; ARST_SHP ; STM_XQK ; Arpes1_MG ; Arpes4_AC ; Arpes5_YLC ; Arpes2_XJZ . Intriguingly, results from different groups lead to conflicting interpretations ranging from strong/weak TI ARST_SHP ; STM_XQK ; Arpes1_MG ; Arpes4_AC ; Arpes2_XJZ to Dirac semimetal Arpes0_GDG ; Arpes5_YLC .
On the other hand, infrared (IR) spectroscopy is a bulk-sensitive technique. Recent IR reflectance studies have suggested that bulk ZrTe5 is a three-dimensional (3D) massless Dirac semimetal Refl1_NLW ; Refl_NLW ; ReflTP_XFX . However, the accuracy of the transition energies extracted from the reflectance measurements may be questioned since a true Kramers-Kronig transformation cannot be implemented within the limited spectral range of magneto-IR reflectance measurements Refl_NLW ; ReflTP_XFX . Therefore, magneto-IR transmission measurements are needed to quantitatively describe the exact topological nature of ZrTe5.
In this Letter, we present the IR transmission magneto-spectroscopy study of mechanically exfoliated ZrTe5 thin crystals near the intrinsic limit. Because of the low carrier density, we are able to observe a series of interband Landau level (LL) transitions that exhibit the characteristic dispersion of two-dimensional (2D) massive Dirac fermions—a signature of the 2D Dirac semimetal electronic structure. We employ high-field magneto-spectroscopy with circularly polarized IR light to resolve a four-fold splitting of low-lying LL transitions, which is attributed to the combined effect of finite mass, large g-factor, and electron-hole asymmetry.
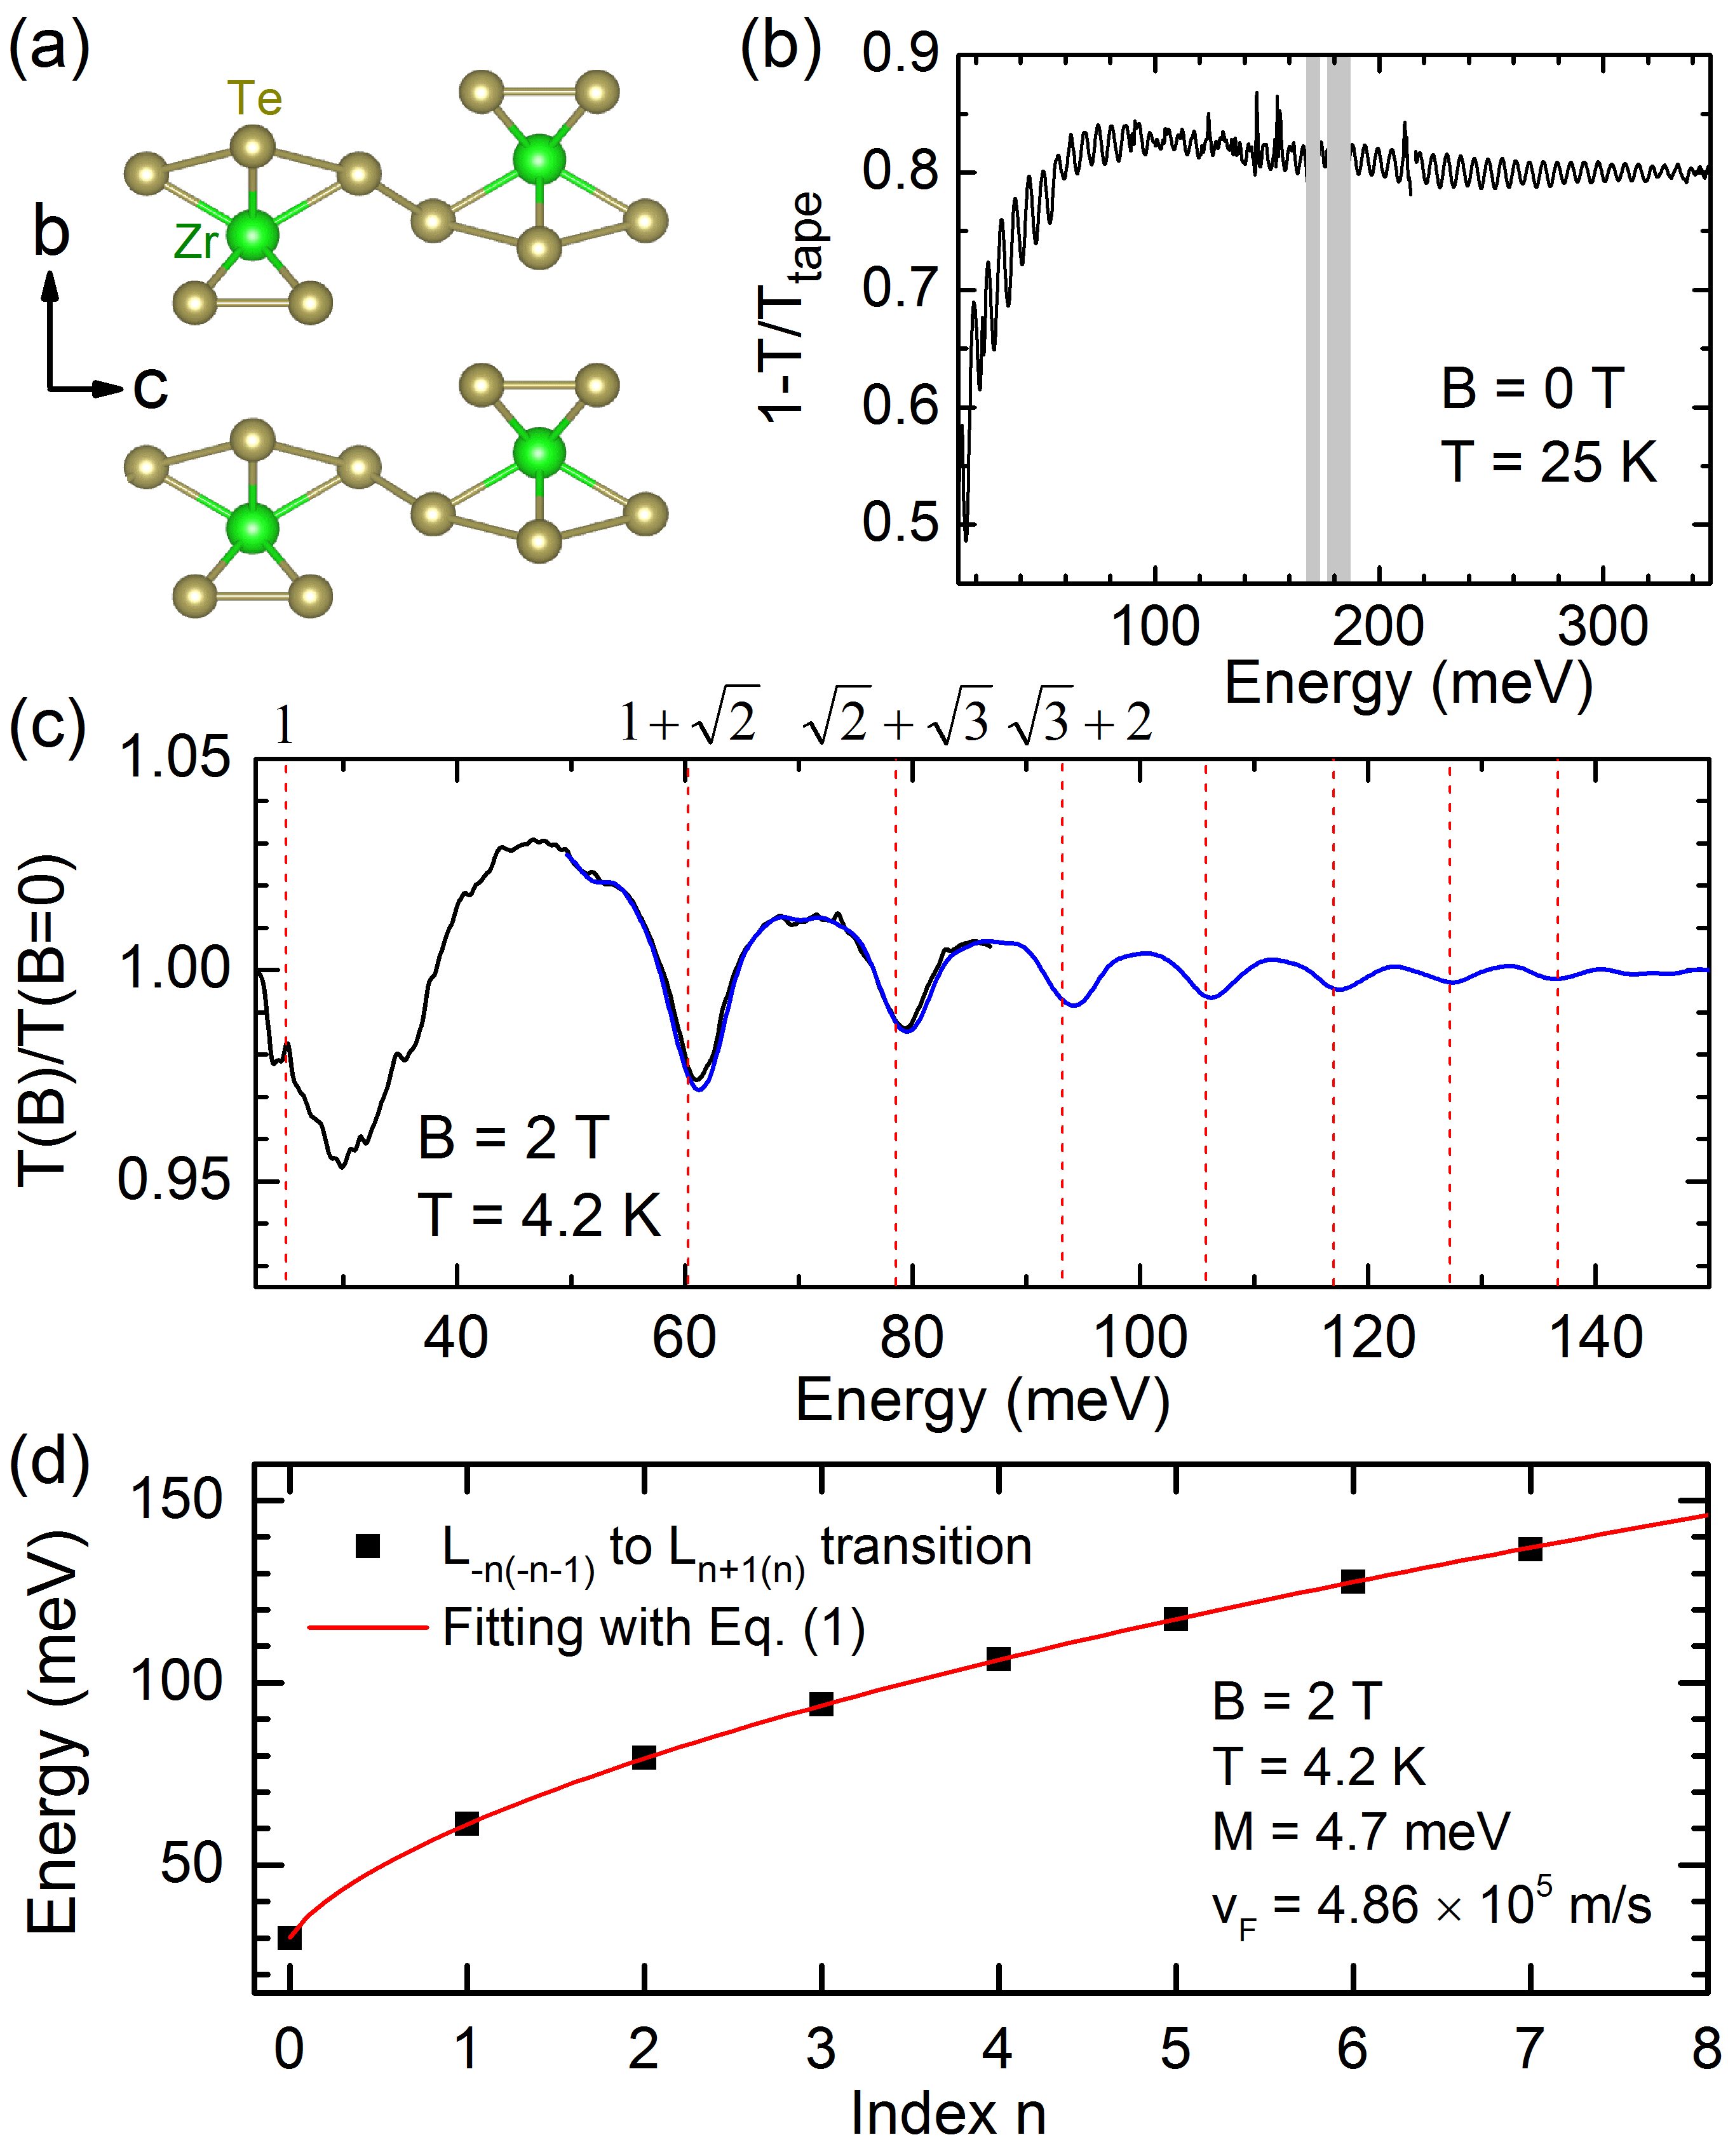
ZrTe5 single crystals were prepared by the Te-assisted chemical vapor transport (CVT) method CVT_growth or molten Te flux growth Arpes0_GDG . The crystal has a layered structure with weakly van der Waals coupled layers along the -axis (Fig. 1(a)). By repeatedly exfoliating the material with an IR-transparent Scotch tape, we prepared thin ZrTe5 flakes with the average thickness of about 1 m that enables IR transmission/absorption measurements. This method has been proven successful in the previous studies of graphite MPotemski ; RJNicholas and TI materials such as Bi2Te3 TItape . In the main text below, we present the data taken on CVT-grown samples. Similar results were measured with the flux-grown samples, as reported in the Supplemental Material SM together with the detailed description of the crystal growth and experimental setup.
In Fig. 1(b), we plot the zero-field extinction spectrum, , of ZrTe5/tape composite measured at 25 K. Here, the sample spectrum () is referenced to the transmission through a bare tape (). At low photon energies, the extinction coefficient, and consequently, the absorption () first increases with energy () and then becomes spectrally flat at meV. This behavior clearly deviates from the expected linear dependence, , for 3D Dirac semimetals Timusk-2013 , and differs our thin flake samples from the thick, opaque samples studied in Refs. Refl1_NLW ; Refl_NLW , where a 3D massless Dirac semimetal electronic structure was concluded for ZrTe5. Moreover, our data are similar to that observed in graphene Mak ; ZL2 , the best known material system hosting 2D Dirac fermions, for the entire experimental spectral range. Due to its 2D nature, in mono-, bi-, and multi-layer graphene at high photon energies flat_theory1 ; flat_theory2 ; flat_theory3 ; flat_theory4 . This 2D Dirac fermion speculation is supported by recent transport studies on ZrTe5 thin flakes Tp4_WP ; TP_XFX ; ReflTP_XFX ; TP5_XSW .
To elucidate the electronic structure of ZrTe5 thin flakes, we carry out systematic low-temperature IR transmission measurements in the Faraday geometry in magnetic fields up to T. Figure 1(c) shows a normalized transmission spectrum taken at T featuring a characteristic, graphene-like series of absorption minima. Indeed, the transition energies, which can be readily and accurately determined from the central energy of the absorption line, can be be assigned to a series of interband LL transitions from to with the integer (or ) being the LL index. The LL spectrum of 2D Dirac fermions such as that in graphene can be described as
| (1) |
where is the energy of the LL, is the electron charge, is the reduced Planck’s constant, is the Fermi velocity, is the Dirac mass, and stands for the conduction and valence bands, respectively. For massless Dirac fermions, , leading to the characteristic dependence of optically allowed interband LL transitions WAdH ; ZJ1 . For massive Dirac fermions (), however, deviates from a perfect dependence ZL1 . The deviation becomes more pronounced for low-lying LL transitions when is small. Such a massive Dirac fermion scenario can precisely describe our data at low magnetic fields. The vertical dash lines in Fig. 1(c) indicate transition energies following a model dependence, with the parameter determined by the highest energy transition (). The measured energies of LL transitions exhibit a clear blueshift, particularly for low-lying transitions, suggesting the massive Dirac fermion interpretation. A more quantitative analysis is shown in Fig. 1(d), where the extracted transition energies are plotted as a function of and fitted with Eq. (1). The best fit to the data gives meV (corresponding to a 9.4 meV energy gap) and m/s. The latter is the average Fermi velocity in the ac plane of ZrTe5 and its value is consistent with recent transport Tp1_MLT , ARPES Arpes2_XJZ and IR Refl1_NLW measurements.
The observation of a small Dirac mass of meV is not a surprise. In theory, the Dirac point in semimetals such as ZrTe5 is composed of two overlapping Weyl points with opposite chirality gap_theory2 ; gap_theory1 ; gap_theory3 . When it lacks symmetry protection, the annihilation of the Weyl points leads to a gap opening at the Dirac point, equivalent to generating a Dirac mass. In addition, the lowest energy transition observed is , which implies that our sample is in quantum limit. This transition is visible at the magnetic field as low as 0.5 T, corresponding to a Fermi energy meV. Therefore, our samples are close to the intrinsic limit, suited for magneto-IR spectroscopy studies. Also, we note that the Lorentzian lineshape of LL transitions (Fig. 1(c)) provides another indication in favor of a 2D Dirac fermion picture, as the dispersion in a 3D system would lead to an asymmetric lineshape with abrupt cutoff on the low-energy side Orlita2 .
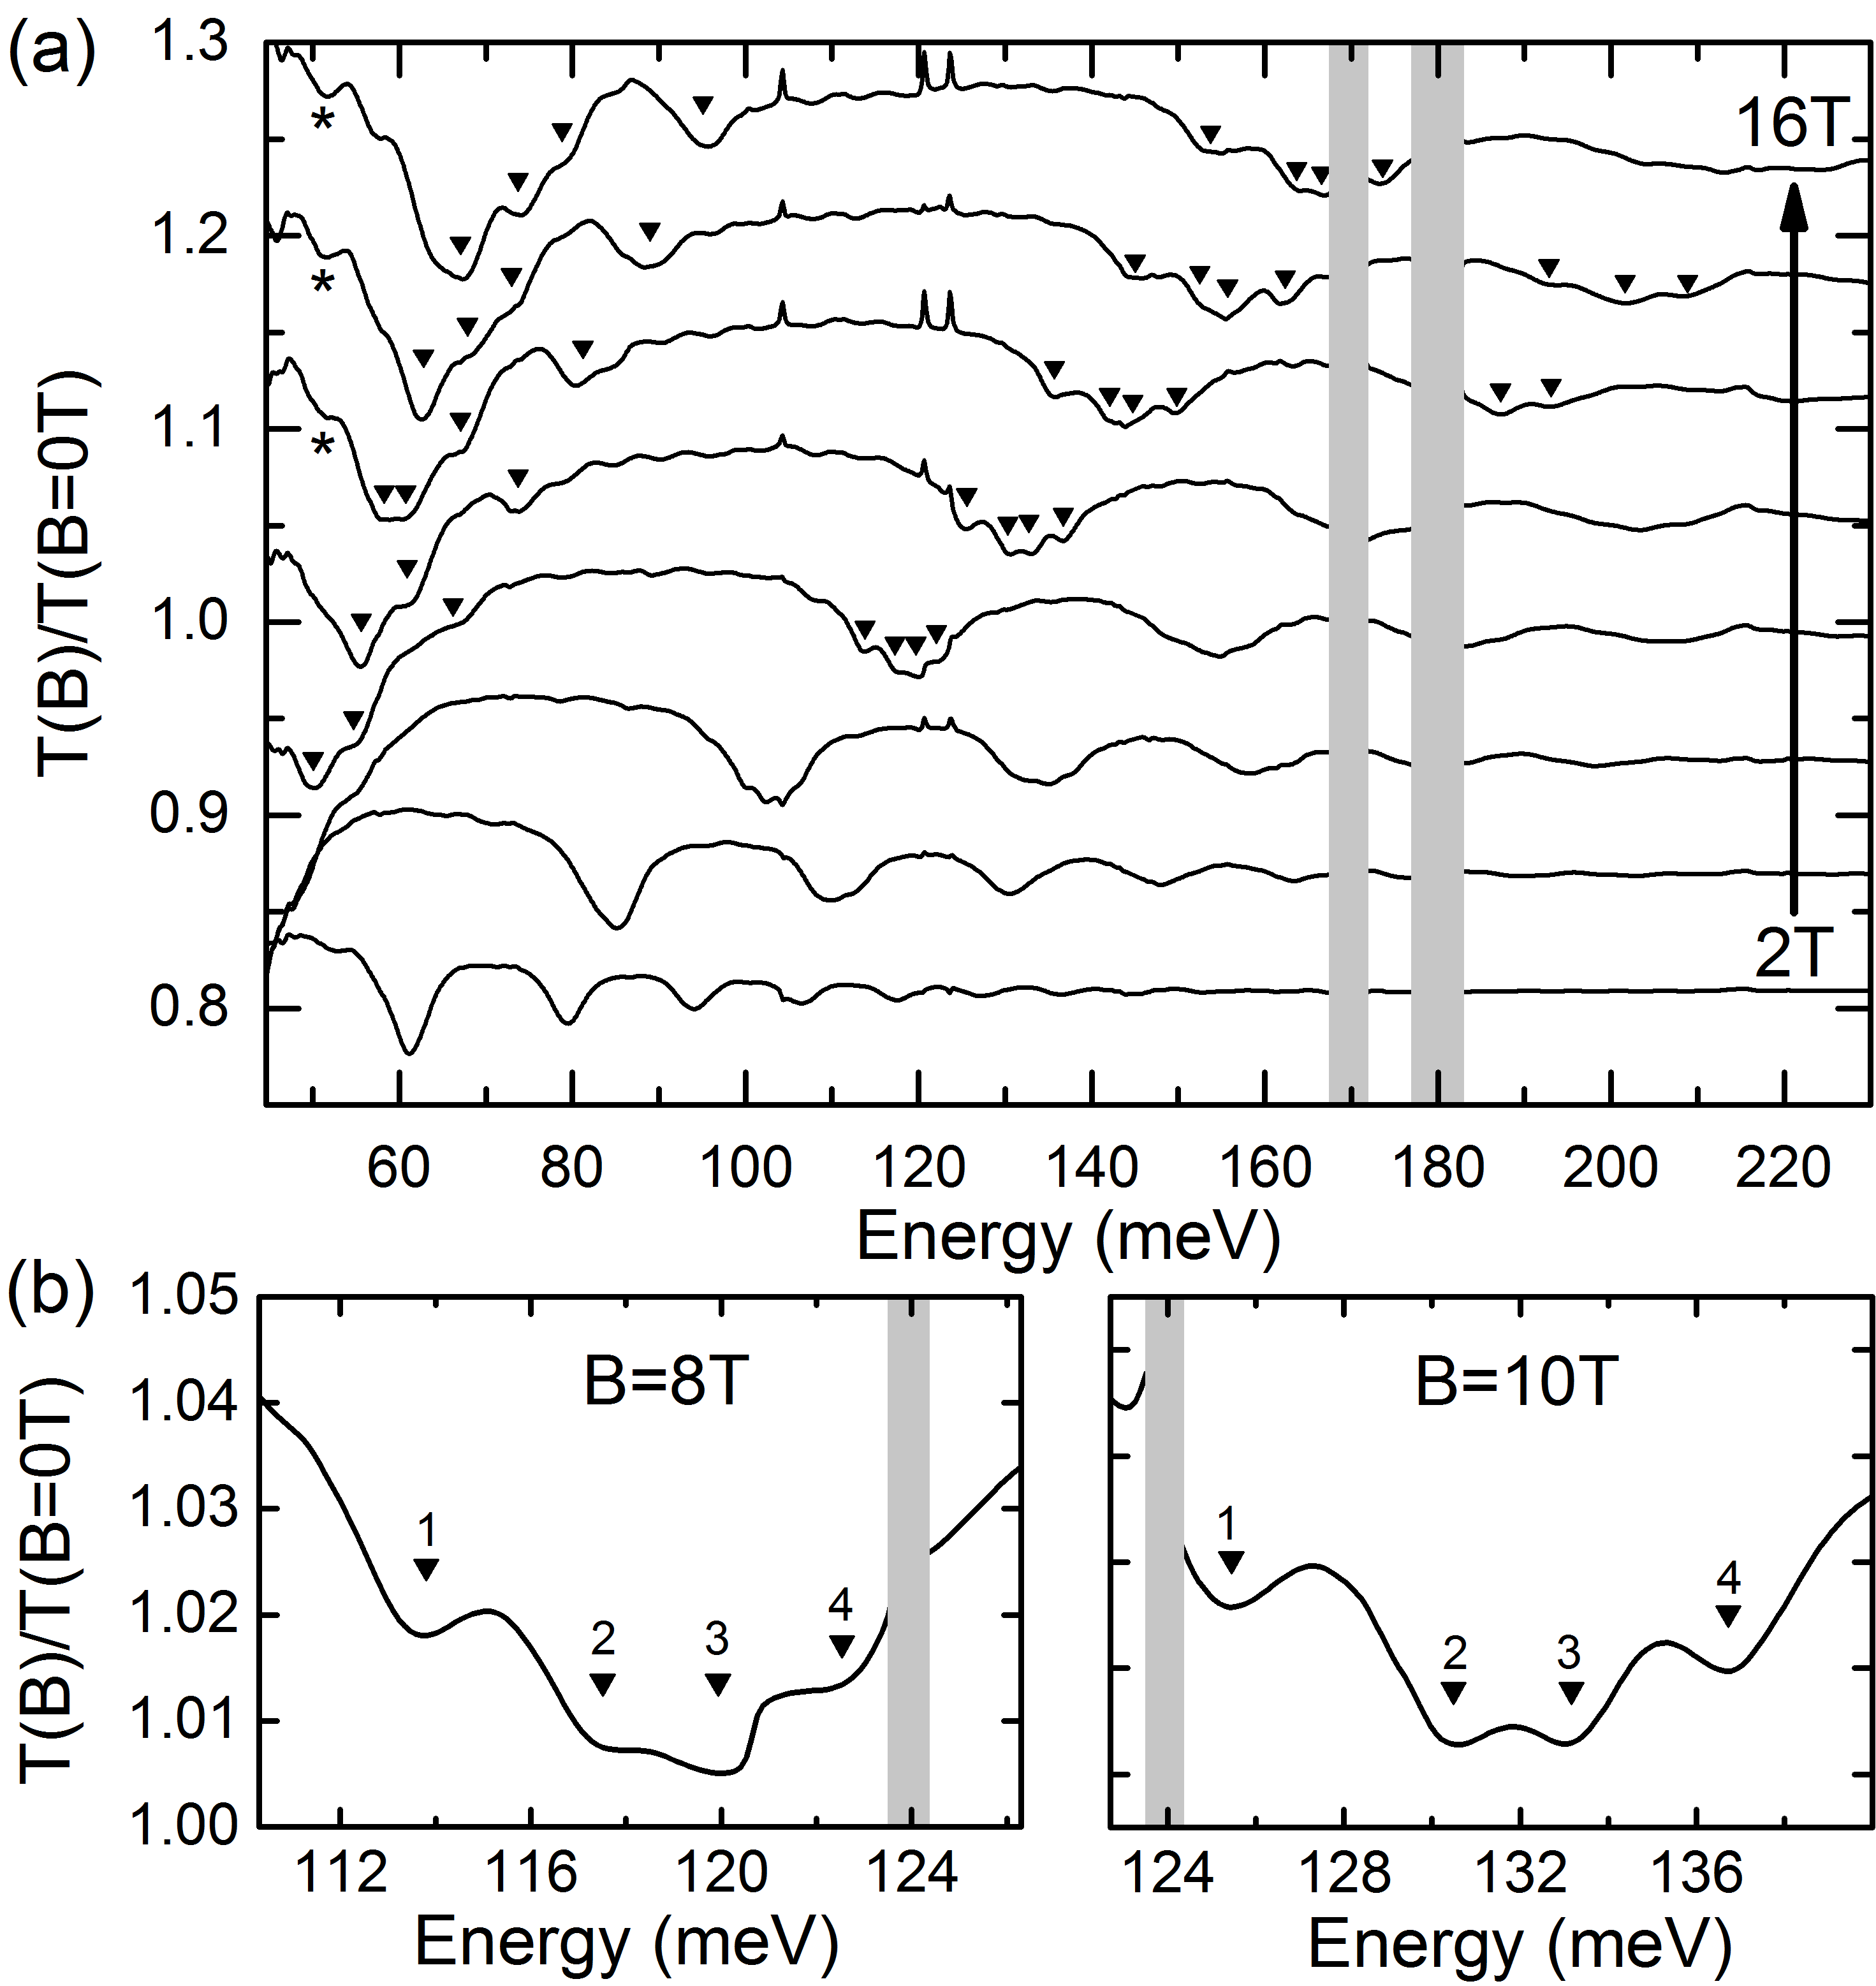
Figure 2(a) illustrates the magnetic field dependence of the LL transitions and their splitting in high magnetic fields, particularly for the three lowest interband transitions: , , and . The splitting of the transition was previously observed in magneto-IR reflectance measurements Refl_NLW , but the proposed interpretation suffers from the requirement of two sets of -factors. In this work, to explore the origins of the splitting, we performed magneto-IR circular polarization resolved measurements using mid-IR quantum cascade lasers (QCLs) SM . Magneto-spectroscopy with circularly polarized light has been successfully employed in the past to reveal details of specific LL transitions in graphite Toy-Dressel_1977 , and more recently in graphene Crassee-2011 and in a typical 3D TI Bi2Se3 Orlita-Bi2Se3-2015 . Here, we focus on the transition, which overlaps well the spectral range of our QCLs. The circular polarization resolved spectra are taken by fixing the light polarization and sweeping the magnetic field in positive or negative directions, which is equivalent to the use of and polarized light.
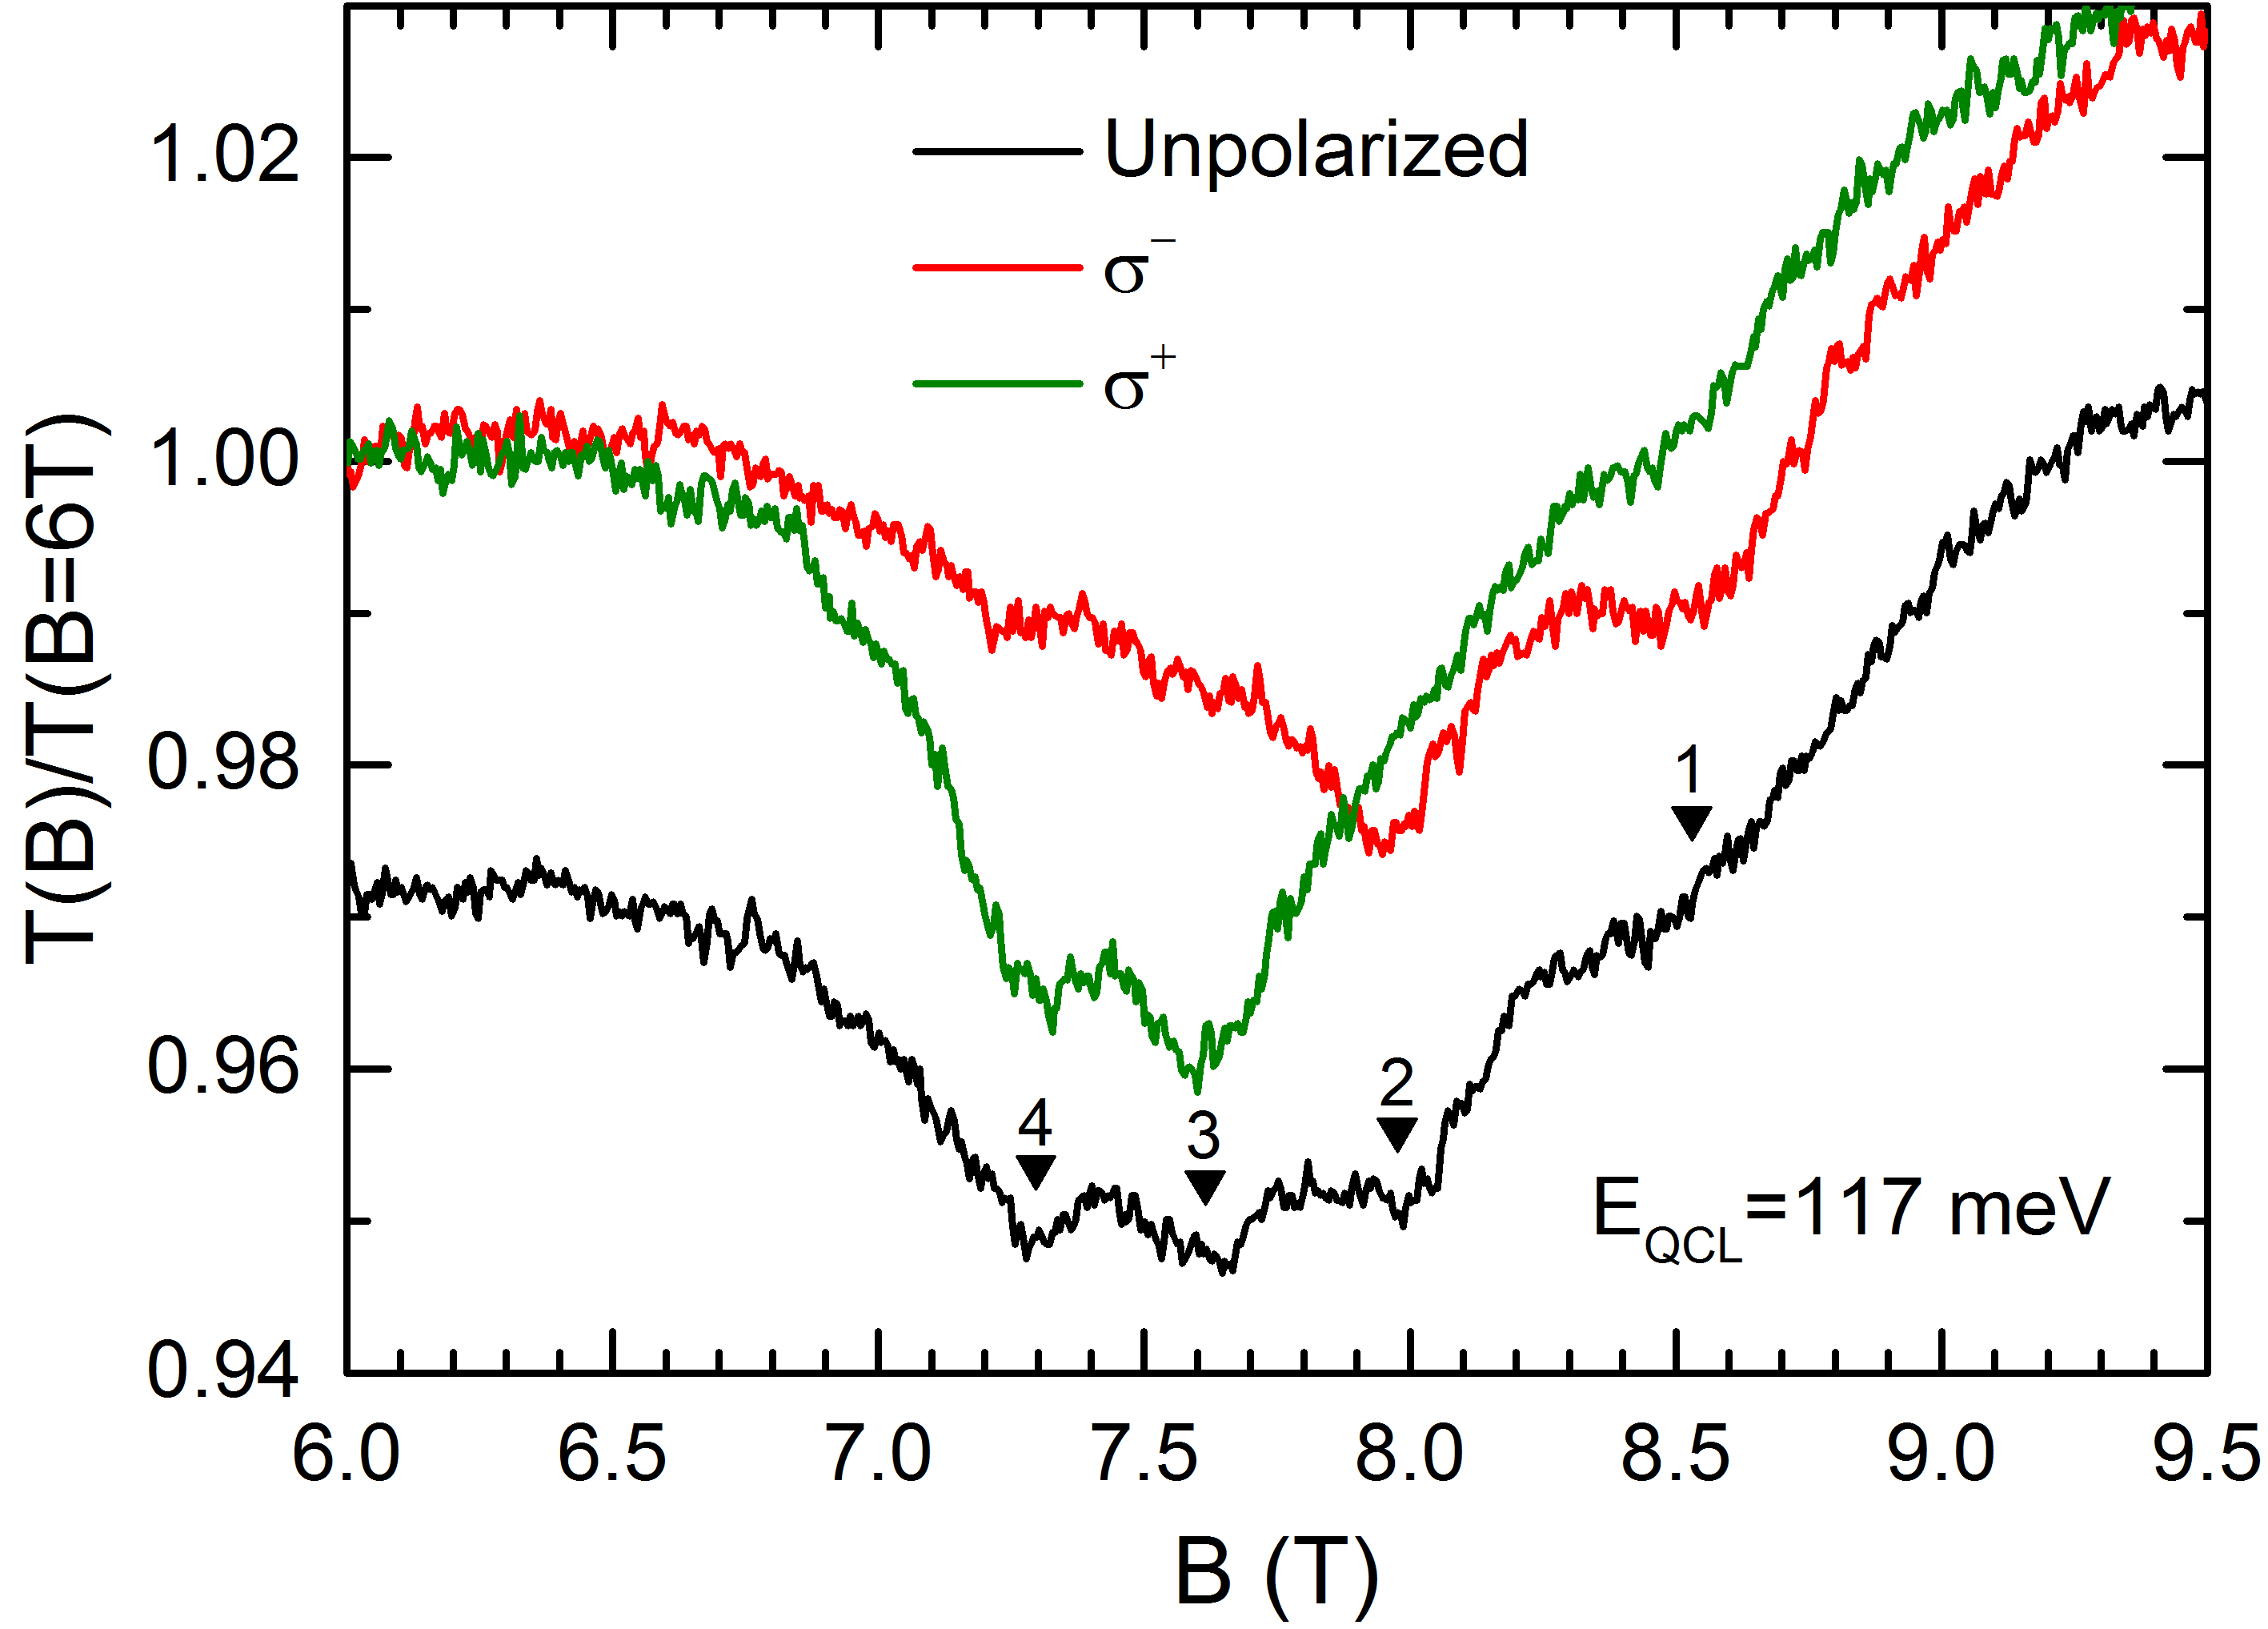
Figure 3 shows the normalized transmission through ZrTe5/tape composite as a function of magnetic field with the QCL energy fixed at meV. With unpolarized IR light, a four-fold splitting of the transition clearly reproduces that measured at (Fig. 2(b)). In a circularly polarized configuration, only two of the four split transitions are active in or polarized light. This observation indicates the lifting of the degeneracy between the (, active) and (, active) transitions, which can be attributed to an asymmetry between the electron and hole bands.
Next, we show that the remaining two-fold splitting of the (or ) transition reflects the lifting of the spin degeneracy, due to a combined effect of large -factor (Zeeman effect) and finite mass. We begin with an effective Hamiltonian postulated by Bernevig, Hughes, and Zhang BHZ
where , , , and terms neglected Model1_FZ . The actual electronic structure is then determined by a set of material parameters: (1) , (2) band inversion parameter , (3) energy offset (which is set to zero), (4) electron-hole asymmetry parameter , and (5) Dirac mass . In the presence of a magnetic field, one can add the Zeeman term Molenkamp1 ; Model2_DS , , where is the Bohr magneton, , and () are the effective -factors for conduction(valence) bands, and solve the eigenvalue problem for the LL spectrum of massive Dirac fermions in ZrTe5 thin flakes
| (2) | ||||
| (3) |
Here, stands for the spin-up and spin-down LLs, is the average -factor, and . In the low-field limit, Eqs. (2) and (3) reduce to Eq. (1). It should be emphasized that the Zeeman effect alone cannot lift the spin degeneracy of LL transitions even when considering electron-hole asymmetry, and . This can be seen in Eq. (3), where a finite mass, and/or note2 , is required to distinguish the term for . Therefore, the observed four-fold splitting of low-lying LL transitions provides another evidence of finite mass for the Dirac fermions in ZrTe5 thin flakes.
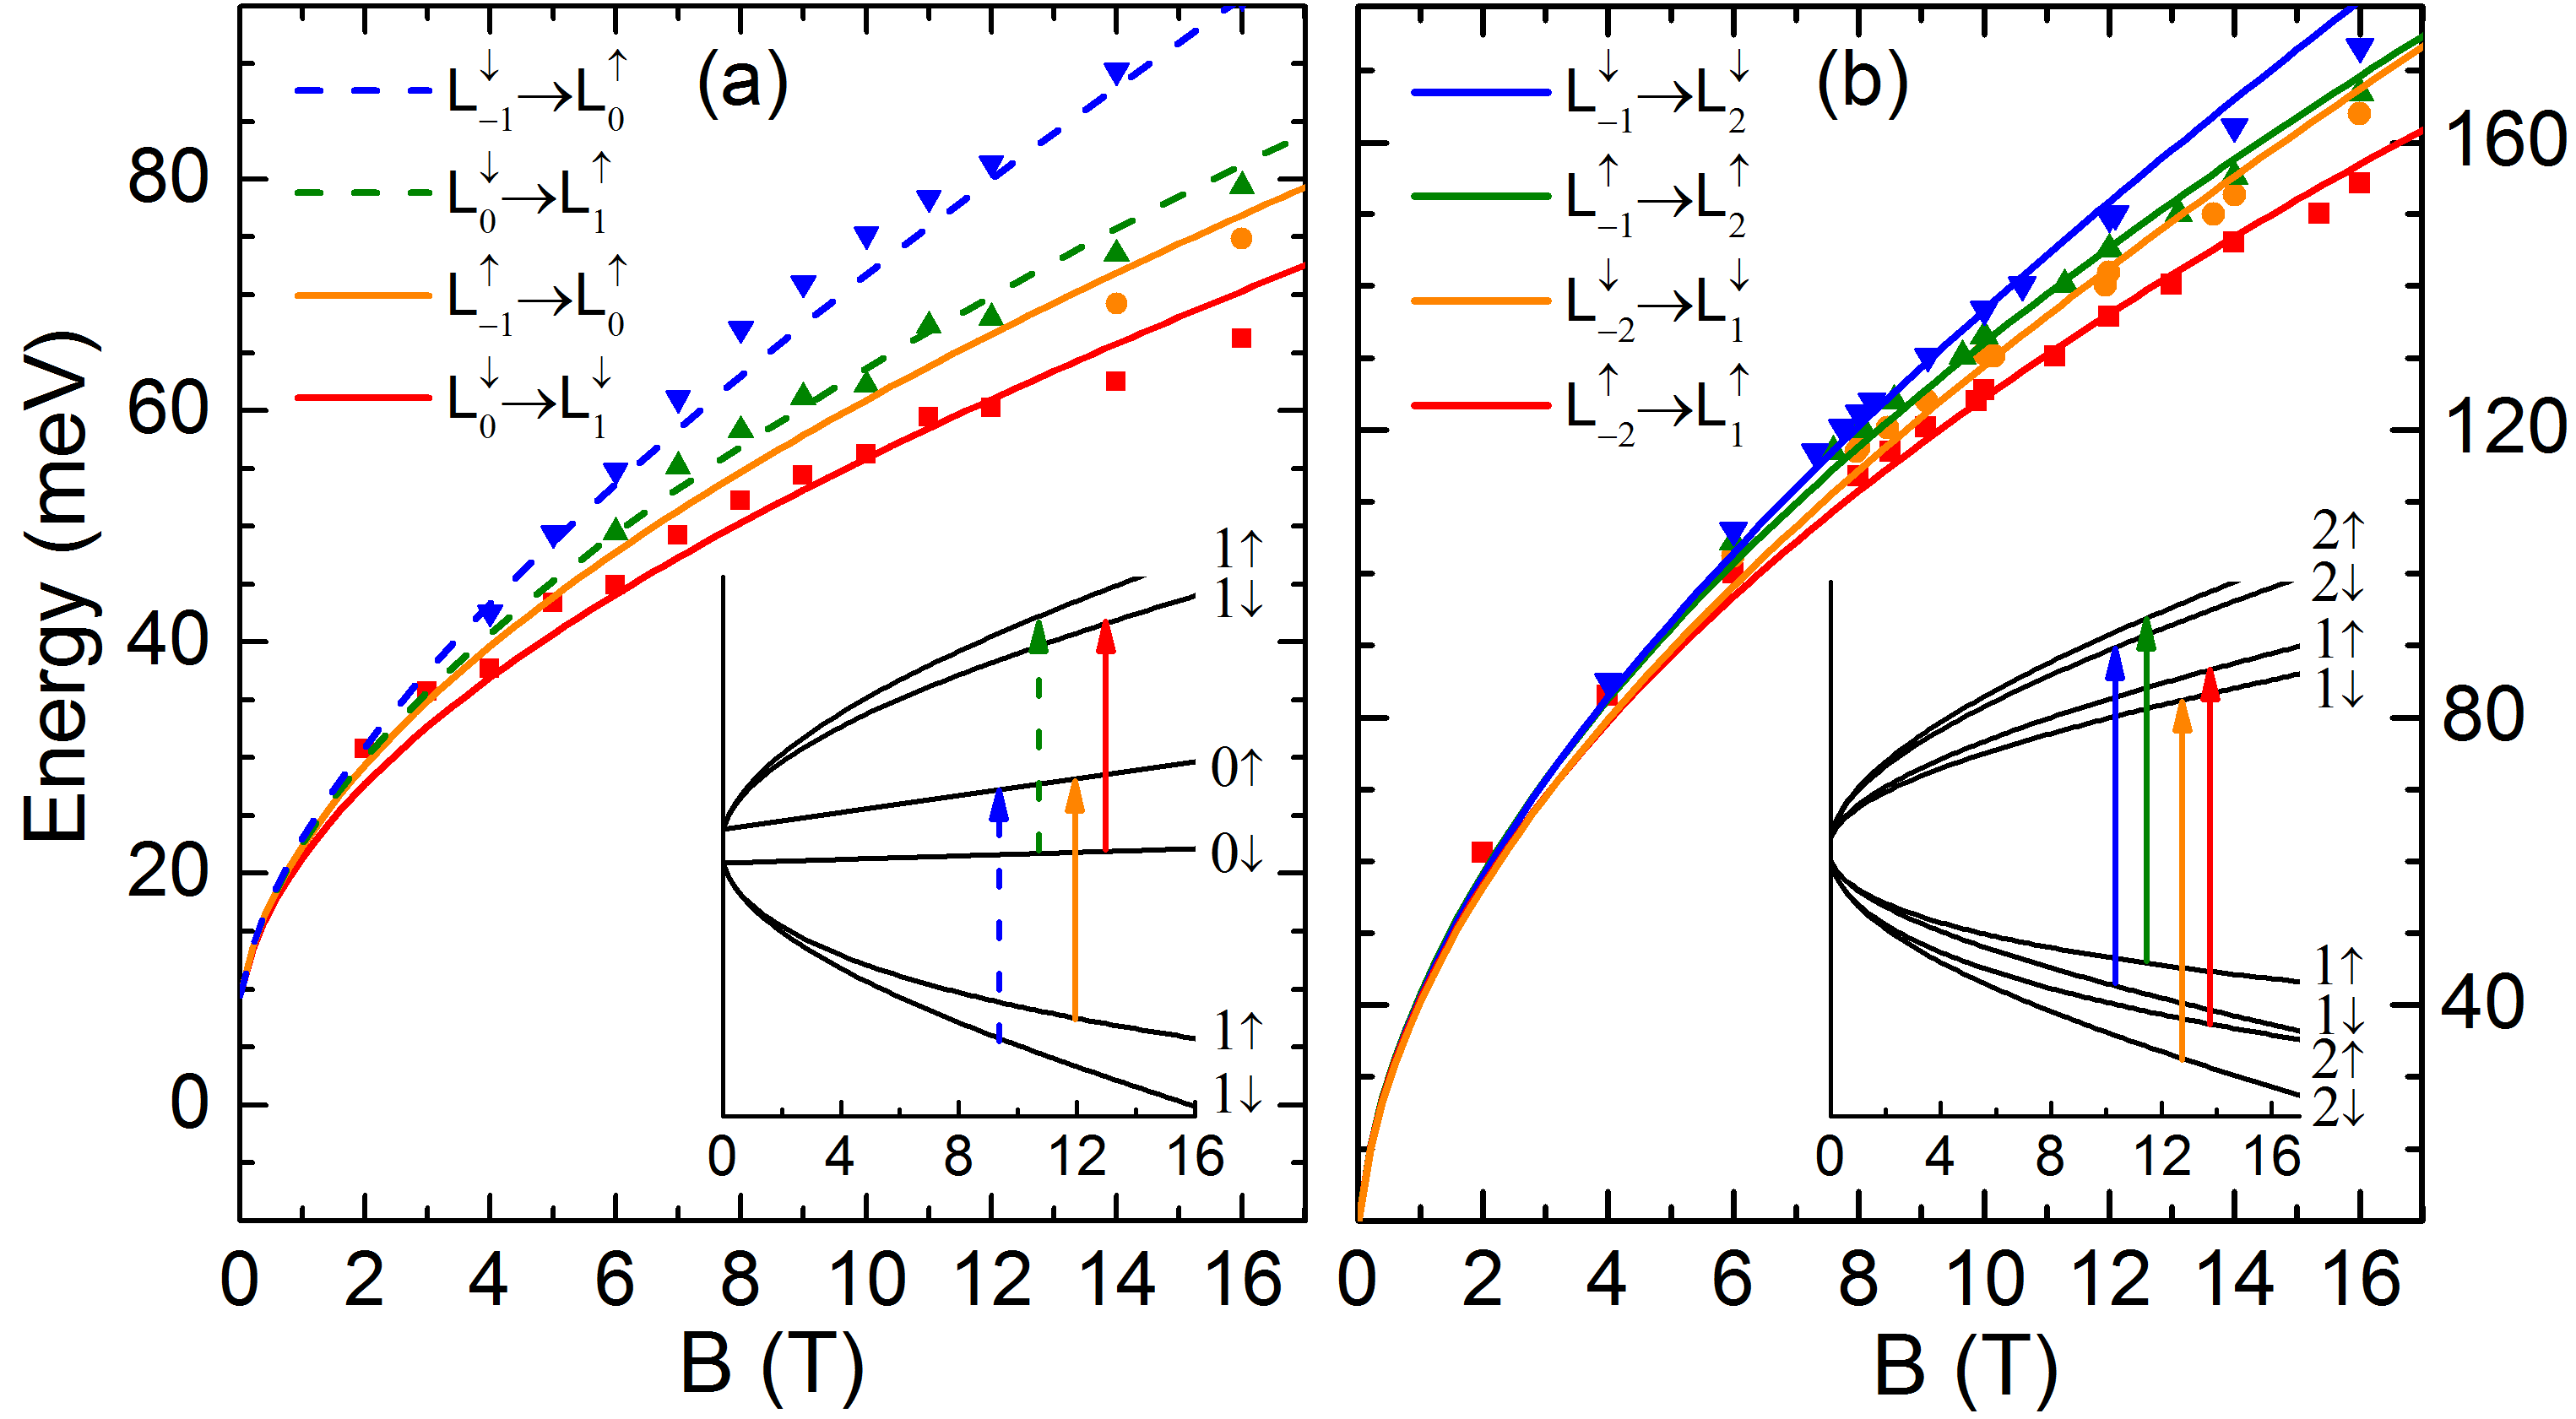
Figure 4(b) shows the four-fold splitting of the transition as a function of magnetic field and the color-coded lines are best fits to the data using Eq. (3). The associated fitting parameters are m/s, meV nm2, meV nm2, meV, , and . Here, is consistent with that obtained from Fig. 1(d) while is 4% smaller, and implies a steeper conduction band than the valence band. Interestingly, we notice that a smaller is also needed to better describe the high-field data in Ref. Molenkamp1 .
To further validate our model, we checked if the above parameters allow to describe other split transitions, and found a very good agreement for the transition (Fig. 4(a)). Due to the strong spin-orbit coupling in ZrTe5, spin-flipped LL transitions ( and ) are allowed and assigned to the two relatively weak high-energy modes of the splitting. The four-fold splitting of the transition, on the other hand, is related to the four strong spin-conserved modes, as the associated spin-flipped modes are expected to be very weak.
Lastly, our model predicts that additional splitting of the transition into () may occur at lower energies due to the presence of a small amount of electron (hole) doping. Quantitative study of this mode, however, is hindered by a field-independent spectral feature at 52 meV (labeled by star symbol in Fig. 2(a)) and thus not pursued in this work.
In conclusion, we have performed IR transmission measurements on exfoliated ZrTe5 near the intrinsic limit. The electronic structure of ZrTe5 thin crystals is found to be 2D-like and support a Dirac semimetal interpretation but with a small relativistic mass (or gap). High-field magneto-spectroscopy measurements reveal a four-fold splitting of low-lying LL transitions and circular polarization resolved measurements show that two-fold comes from breaking the electron-hole symmetry while the other two-fold is caused by lifting the spin degeneracy. The magnetic field dependence of the splitting can be fully described using the Bernevig-Hughes-Zhang effective Hamiltonian model.
Note: During the preparation of this manuscript, we became aware of another IR transmission study of ZrTe5 thin flake Chen_PNAS .
We thank Kun Yang and Markus Kindermann for helpful discussions. This work was primarily supported by the DOE (Grant No. DE-FG02-07ER46451). The CVT crystal growth at UT was supported by the NSF (Grant No. DMR-1350002). The flux crystal growth and IR measurements were performed at the National High Magnetic Field Laboratory (NHMFL), which is supported by the NSF Cooperative Agreement No. DMR-1157490 and the State of Florida. Z.J. acknowledges support from the NHMFL Visiting Scientist Program.
References
- (1) R. T. Littleton IV, T. M. Tritt, C. R. Feger, J. Kolis, M. L. Wilson, M. Marone, J. Payne, D. Verebeli, and F. Levy, Appl. Phys. Lett. 72, 2056 (1998).
- (2) O. Vafek and A. Vishwanath, Annu. Rev. Condens. Matter Phys. 5, 83 (2014).
- (3) H. M. Weng, X. Dai, and Z. Fang, Phys. Rev. X 4, 011002 (2014).
- (4) Z. Fan, Q.-F. Liang, Y. B. Chen, S.-H. Yao, and J. Zhou, arXiv:1611.04263.
- (5) Q. Li, D. E. Kharzeev, C. Zhang, Y. Huang, I. Pletikosić, A. V. Fedorov, R. D. Zhong, J. A. Schneeloch, G. D. Gu, and T. Valla, Nat. Phys. 12, 550 (2016).
- (6) R. Wu , Phys. Rev. X 6, 021017 (2016).
- (7) X.-B. Li , Phys. Rev. Lett. 116, 176803 (2016).
- (8) L. Moreschini, J. C. Johannsen, H. Berger, J. Denlinger, C. Jozwiak, E. Rotenberg, K. S. Kim, A. Bostwick, and M. Grioni, Phys. Rev. B 94, 081101(R) (2016).
- (9) G. Manzoni , Phys. Rev. Lett. 117, 237601 (2016).
- (10) L. Shen , J. Electron Spectrosc. Relat. Phenom. (in press).
- (11) Y. Zhang , arXiv:1602.03576.
- (12) R. Y. Chen, S. J. Zhang, J. A. Schneeloch, C. Zhang, Q. Li, G. D. Gu, and N. L. Wang, Phys. Rev. B 92, 075107 (2015).
- (13) R. Y. Chen, Z. G. Chen, X.-Y. Song, J. A. Schneeloch, G. D. Gu, F. Wang, and N. L. Wang, Phys. Rev. Lett. 115, 176404 (2015).
- (14) X. Yuan , NPG Asia Mater. 8, e325 (2016).
- (15) Chemical Vapor Transport Reactions, M. Binnewies, R. Glaum, M. Schmidt, and P. Schmidt (Walter de Gruyter, Berlin, 2012).
- (16) M. Orlita, C. Faugeras, G. Martinez, D. K. Maude, M. L. Sadowski, and M. Potemski, Phys. Rev. Lett. 100, 136403 (2008).
- (17) K.-C. Chuang, A. M. R. Baker, and R. J. Nicholas, Phys. Rev. B 80, 161410(R) (2009).
- (18) L.-C. Tung, W. Yu, P. Cadden-Zimansky, I. Miotkowski, Y. P. Chen, D. Smirnov, and Z. Jiang, Phys. Rev. B 93, 085140 (2016).
- (19) See Supplemental Material at http://link.aps.org/supplemental/… for crystal synthesis and experimental details, additional experimental data, and extended effective Hamiltonian model.
- (20) T. Timusk, J. P. Carbotte, C. C. Homes, D. N. Basov, and S. G. Sharapov, Phys. Rev. B 87, 235121 (2013).
- (21) K. F. Mak, M. Y. Sfeir, Y. Wu, C. H. Lui, J. A. Misewich, and T. F. Heinz, Phys. Rev. Lett. 101 196405 (2008).
- (22) Z. Q. Li, E. A. Henriksen, Z. Jiang, Z. Hao, M. C. Martin, P. Kim, H. L. Stormer, and D. N. Basov, Nat. Phys. 4, 532 (2008).
- (23) N. M. R. Peres, F. Guinea, and A. H. Castro Neto, Phys. Rev. B 73, 125411 (2006).
- (24) D. S. L. Abergel and V. I. Fal’ko, Phys. Rev. B 75, 155430 (2007).
- (25) S. Ryu, C. Mudry, A. Furusaki, and A. W. W. Ludwig, Phys. Rev. B 75, 205344 (2007).
- (26) M. Koshino and T. Ando, Phys. Rev. B 77, 115313 (2008).
- (27) W. Yu, Y. Jiang, J. Yang, Z. L. Dun, H. D. Zhou, Z. Jiang, P. Lu, and W. Pan, Sci. Rep. 6, 12576 (2016).
- (28) Y. W. Liu , Nat. Comm. 7, 12516 (2016).
- (29) J. J. Niu, J. Y. Wang, Z. J. He, C. L. Zhang, X. Q. Li, T. C. Cai, X. M. Ma, S. Jia, D. P. Yu, and X. S. Wu, Phys. Rev. B 95, 035420 (2017).
- (30) M. L. Sadowski, G. Martinez, M. Potemski, C. Berger, and W. A. de Heer, Phys. Rev. Lett. 97, 266405 (2006).
- (31) Z. Jiang, E. A. Henriksen, L.-C. Tung, Y.-J. Wang, M. E. Schwartz, M. Y. Han, P. Kim, and H. L. Stormer, Phys. Rev. Lett. 98, 197403 (2007).
- (32) Z. G. Chen, Z. W. Shi, W. Yang, X. B. Lu, Y. Lai, H. G. Yan, F. Wang, G. Y. Zhang, and Z. Q. Li, Nat. Commun. 5, 4461 (2014).
- (33) G. L. Zheng , Phys. Rev. B 93, 115414 (2016).
- (34) J. L. Mañes, Phys. Rev. B 85, 155118 (2012).
- (35) S. M. Young, S. Zaheer, J. C. Y. Teo, C. L. Kane, E. J. Mele, and A. M. Rappe, Phys. Rev. Lett. 108, 140405 (2012).
- (36) Z. J. Wang, Y. Sun, X. Q. Chen, C. Franchini, G. Xu, H. M. Weng, X. Dai, and Z. Fang, Phys. Rev. B 85, 195320 (2012); Z. J. Wang, H. M. Weng, Q. S. Wu, X. Dai, and Z. Fang, ibid 88, 125427 (2013).
- (37) M. Orlita , J. Appl. Phys. 117, 112803 (2015).
- (38) W. W. Toy, M. S. Dresselhaus, and G. Dresselhaus, Phys. Rev. B 15, 4077 (1977).
- (39) I. Crassee, J. Levallois, D. van der Marel, A. L. Walter, Th. Seyller, and A. B. Kuzmenko, Phys. Rev. B 84, 035103 (2011).
- (40) M. Orlita , Phys. Rev. Lett. 114, 186401 (2015).
- (41) B. A. Bernevig, T. L. Hughes, and S.-C. Zhang, Science 314, 1757 (2006).
- (42) Z. J. Wang, Y. Sun, X.-Q. Chen, C. Franchini, G. Xu, H. M. Weng, X. D, and Z. Fang, Phys. Rev. B 85, 195320 (2012).
- (43) B. Büttner , Nat. Phys. 7, 418 (2011).
- (44) J. Ludwig, Y. B. Vasilyev, N. N. Mikhailov, J. M. Poumirol, Z. Jiang, O. Vafek, and D. Smirnov, Phys. Rev. B 89, 241406(R) (2014).
- (45) The parameter can also be viewed as a field-induced mass.
- (46) Z.-G. Chen , Proc. Natl. Acad. Sci. USA 114, 816 (2017).