Prospects of LHC Higgs Physics at the end of Run III
Abstract
The document is prepared for the LCWS2016 conference proceedings. The expected status of Higgs physics at the end of Run-3 is presented. The current Run-2 status is briefly reviewed, and the expected Higgs reach after the HL-LHC period is also summarized for some channels.
1 Introduction
The Large Hadron Collider (LHC) is taking data at TeV centre of mass energy. At the end of Run-2 (2018), an integrated luminosity of 150 is expected, and at the end of Run-3, 300 is expected, after which is the HL-LHC period until about 3 of data is collected. There are two major detector upgrades happening after Run-2 and Run-3. Phase-I upgrade (2019-2020) prepares for an instantaneous luminosity of 2-. The production of detector parts for Phase-I has already started. The Phase-II upgrade (2024-2026) prepares for an instantaneous luminosity of 5-, and copes with an average pileup events of 140-200 per - collision. Phase-II is currently in the design and R&D stage. The major detector upgrades for the CMS and ATLAS experiments are outlined in Tab. 1:
| CMS | ATLAS | |
| Tracking | Extended to | Extended to . All silicon |
| Calorimeter | Update all readout electronics. Timing in EM endcap (to reject pileup) | |
| Trigger | Tracking added at L1, larger bandwith, finer granularity | |
| Muon | New chamber to complete , | New endcap wheel to reject |
| muon tagger up to | fake L1 muons (Phase-I) | |
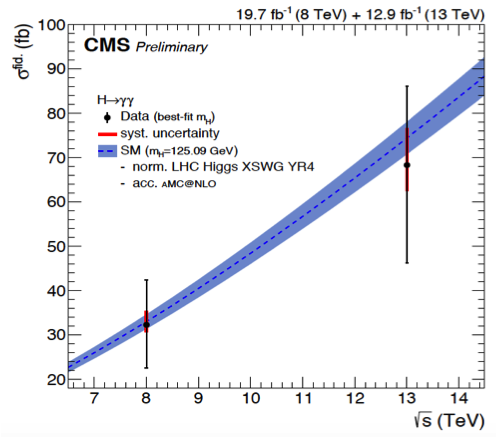
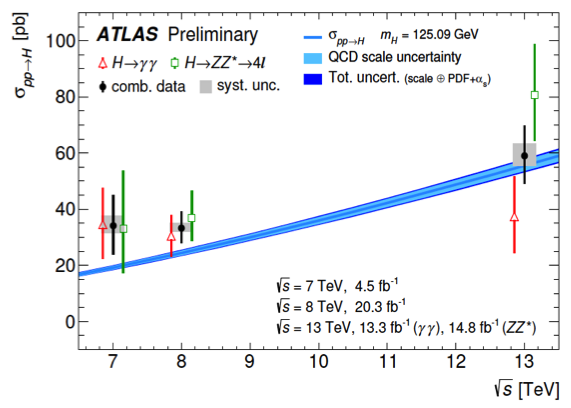
The fiducial cross section measurement results with initial Run-2 data at TeV data are given in Tab. 2. The Higgs cross sections roughly scale with the center of mass energy, as displayed in Fig. 1 ref1 ; ref2 ; ref3 ; ref4 ; ref5 .
| (fb) | SM pred. (fb) | (fb) | SM pred. (fb) | |
| ATLAS | ||||
| CMS | ||||
With about 10 times of the existing Run-1 data set, and larger Higgs cross sections, we are able to (1) precisely measure Higgs production and decay rates and couplings, (2) test the Higgs sector and probe for Beyond Standard Model (BSM) such as Minimal Supersymmetric Standard Model (MSSM), the double Higgs production rate (order of few percent effects on Higgs couplings in most models), (3) search for rare/new/invisible decay modes, (4) use Effective Field Theory for the Higgs tensor structure study. Current theory errors on the Higgs gluon-gluon-Fusion (ggF) and Vector-Boson-Fusion (VBF) production cross sections are about 3-4% and 0.5% for the scale, 3% and 2% for PDF+, respectively ref6 . The theory errors on the Higgs Branching Ratios (BR) are typically at 3-5%. Many projection results have particular assumptions made. The systematics can change and the analysis method can also improve. Projections for 300 and 3 (HL-LHC period) luminosities are given for some channels in this document. Physics projections for HL-LHC Higgs measurements are usually done in two ways:
-
•
Parametrized detector performance. Event-generator level particles are smeared with detector performance parametrized from full simulation and reconstruction of upgraded HL-LHC detectors. Effects of pile-up are included for either (average 140 pile-up events which is the old default) or (average 200 pile-up events, current new setup). Analysis is mostly based on the existing 8 TeV results with simple re-optimization for higher luminosity.
-
•
Extrapolation of Run-1 or Run-2 results. This means scaling signal and background to higher luminosities, correcting for different center-of-mass energy, assuming unchanged analysis (not re-optimized for higher luminosity) and the same detector performance as in Run-1/2 (some used corrections based on studies in the first approach).
For CMS, sometimes the projections are made with different systematics assumptions as listed in Tab. 3, which may appear in different projection plots and tables.
| systematics | exp. sys. | theo. sys. | high PU | |
| unchanged | scaled | scaled 1/2 | effects | |
| ECFA16 S1 | ✓ | |||
| ECFA16 S1+ | ✓ | |||
| ECFA16 S2 | ✓ | ✓ | ||
| ECFA16 S2+ | ✓ | ✓ | ✓ |
2 Projections for the signal strength and coupling factors
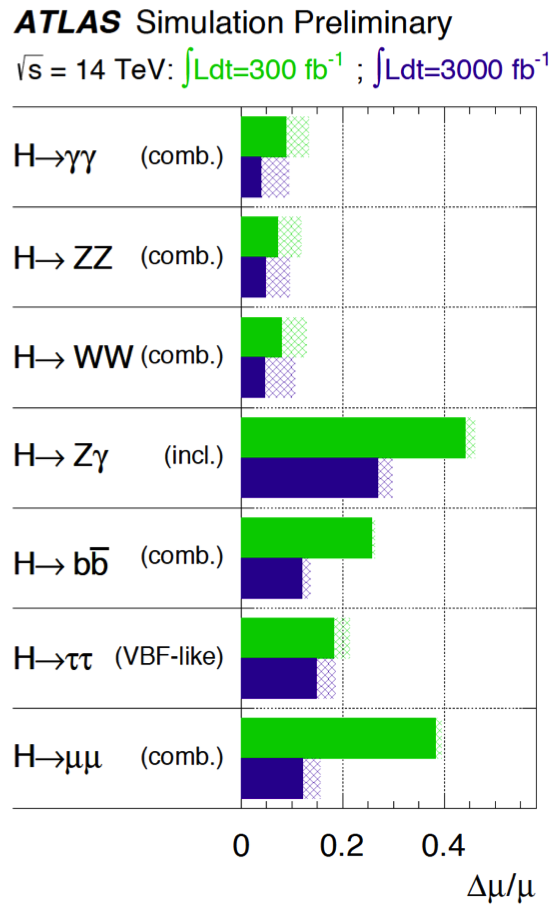
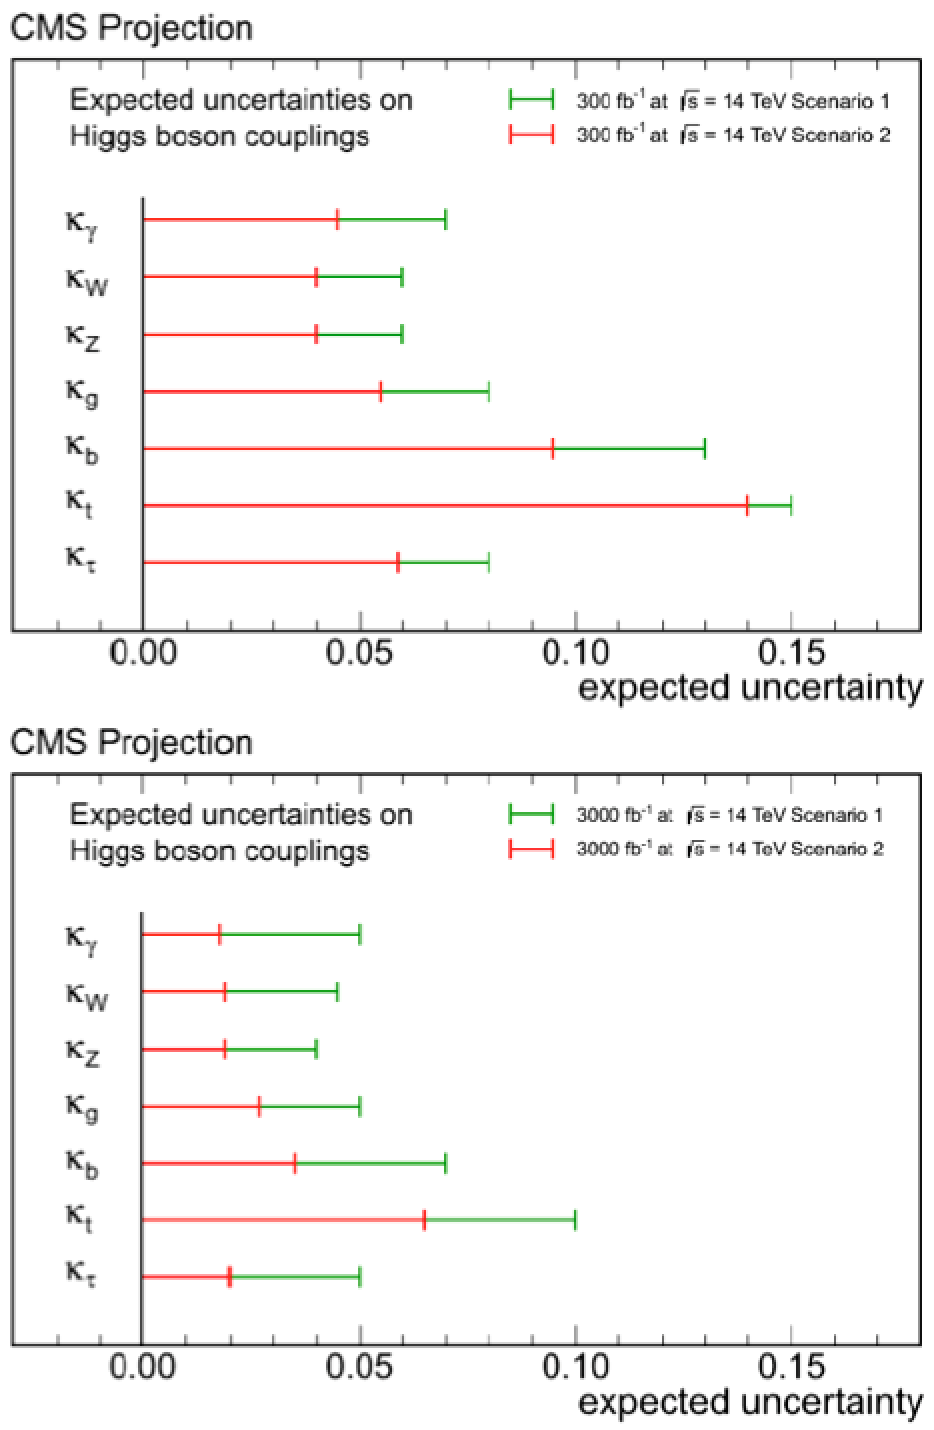
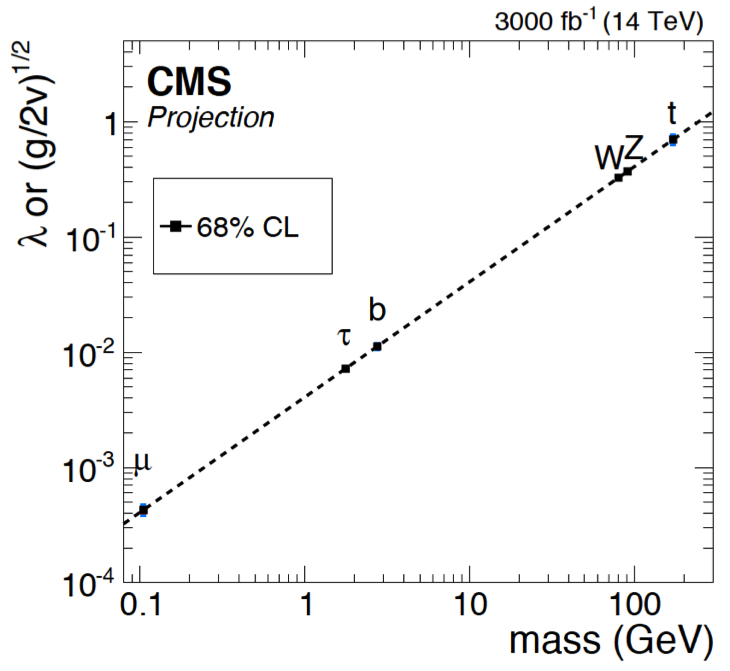
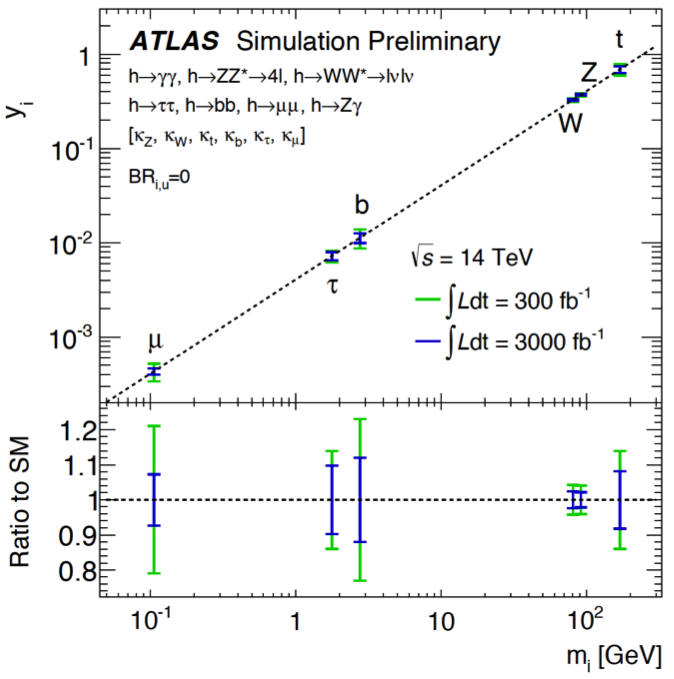
The projected uncertainty on the Higgs signal strength in different decays for ATLAS, and on the Higgs coupling to different particles for CMS, are shown in Fig. 2 ref7 ; ref8 . With larger statistics, the reduced coupling scale factors can be calculated to test the Higgs coupling dependence on the mass, as shown in Fig. 3 ref7 ; ref9 . The estimated precisions of such couplings with 3 of data at ATLAS are about 3% for the boson, 7% for the muon, and 8-12% for the fermions.
3 Projections for
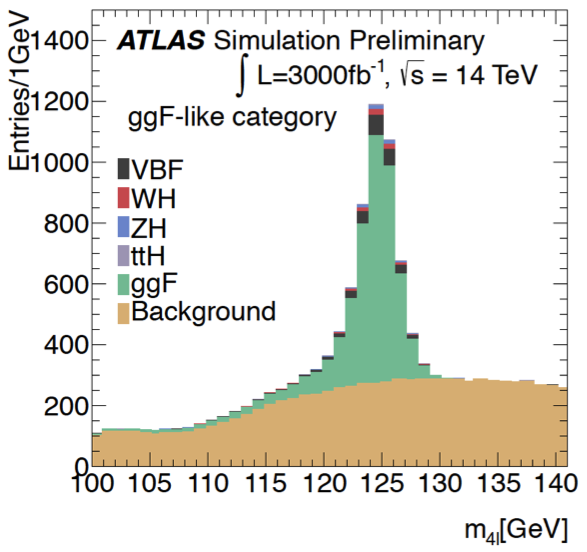
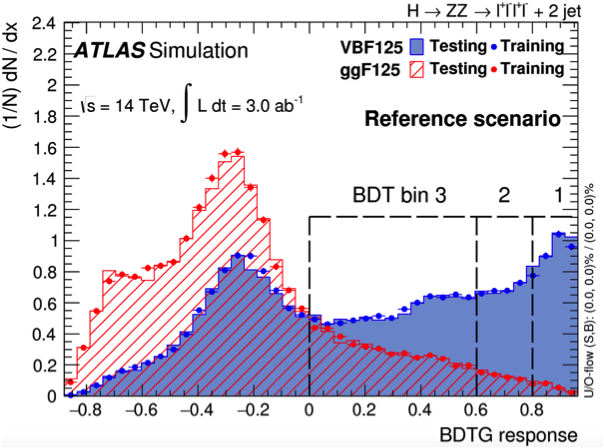
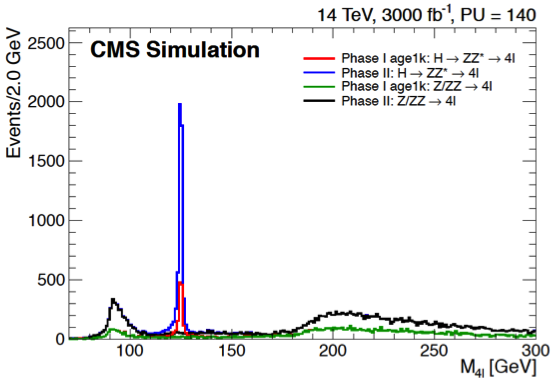
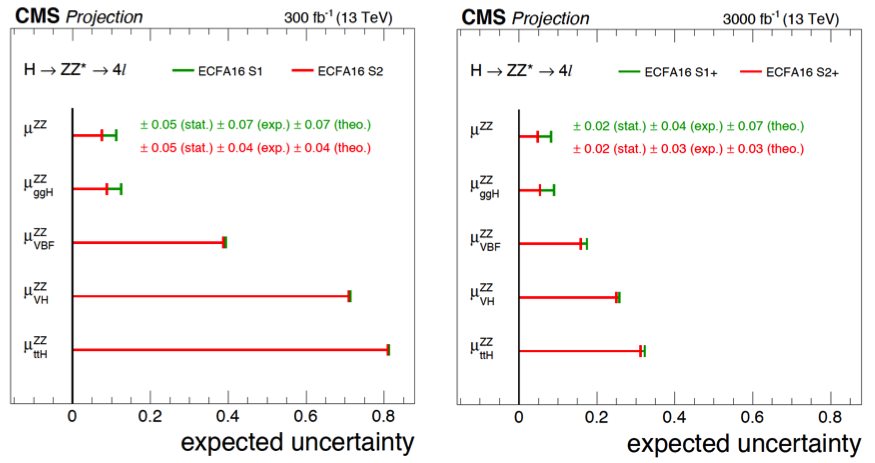
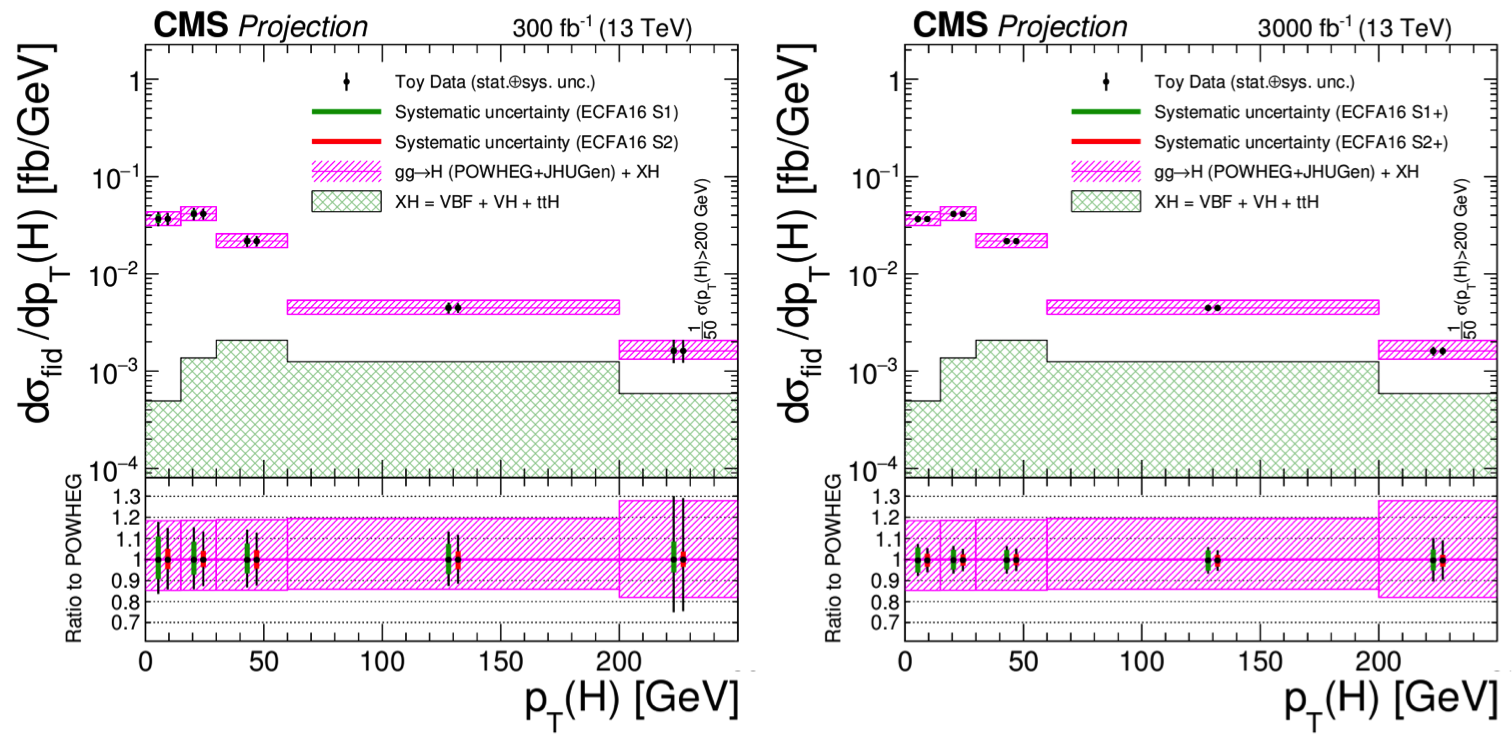
The channel is relatively clean. With more data such as 3 , the signal can be divided into VBF, VH, and ggH categories, as shown in Fig. 4 ref10 ; ref11 . With 300 of data, the combined uncertainty on the signal strength, , can be achieved. The VBF region is almost background free, and a multivariate analysis, in this case the Boosted Decision Trees (BDT), can be used to further separate the ggF and VBF productions. The BDT distribution is also shown in Fig. 4, assuming an extended tracking coverage is implemented. With an average pileup events of 140 (200), (0.18) and a signal significance of () can be reached. The Higgs mass distribution and the signal strengths in different production modes at CMS are shown in Fig. 5 ref8 ; ref12 . A of 5-10% can be achieved on the combined production of (dominated by ggH) with 3 at CMS. With abundant signal events, differential distributions such as the Higgs can be also measured as shown in Fig. 6 ref5 ; ref12 . It is seen that going from 300 to 3 , the statistical and some systematic errors are greatly reduced (less than the theory errors at NLO).
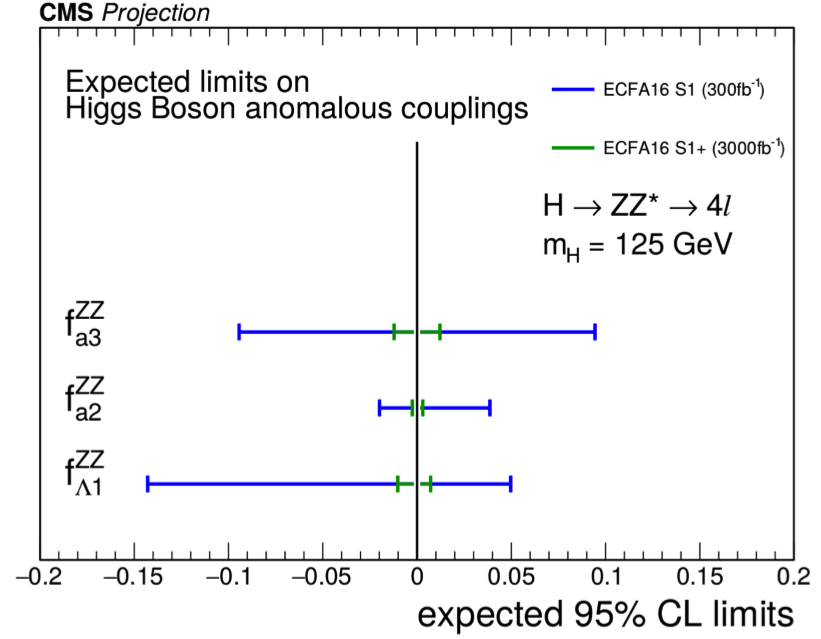
The channel can be also used to probe the anomalous tensor couplings in the following effective Lagrangian assuming spin-0 state of the Higgs:
| (1) |
where the terms other than are BSM dimension-6 operators. Using the phase space distributions of the four leptons in the final state, limits on the coefficients from BSM terms can be set as in Fig. 7 ref12 , in which the is defined as
| (2) |
where is the cross section from the th term in Eq. 1. As the measurement is statistically limited, a big improvement in the sensitivity to the anomalous couplings with 3 of data is expected.
4 Projections for
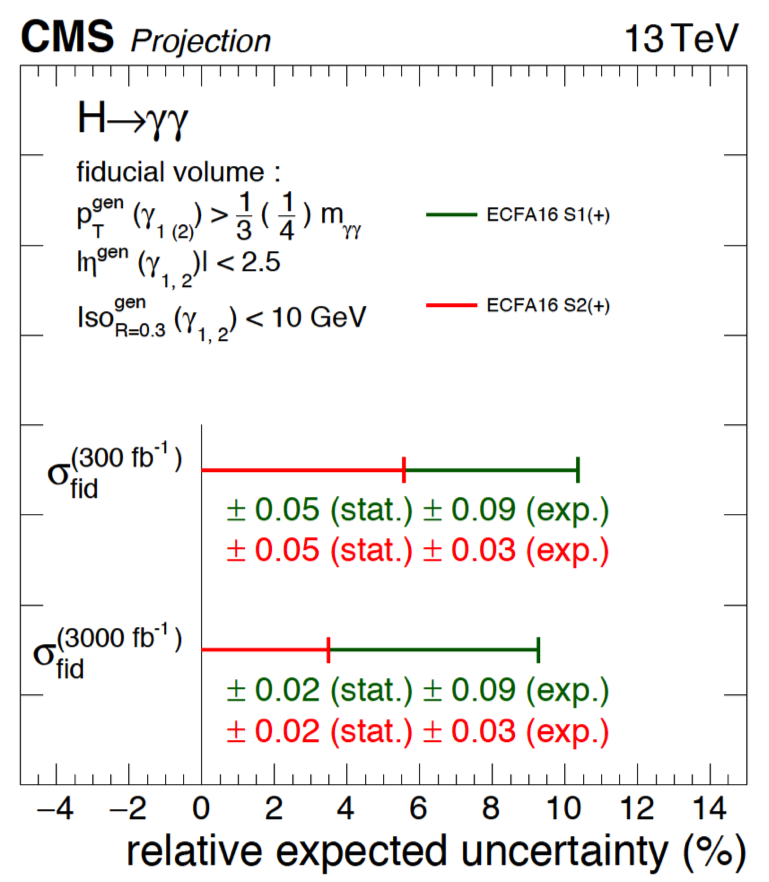
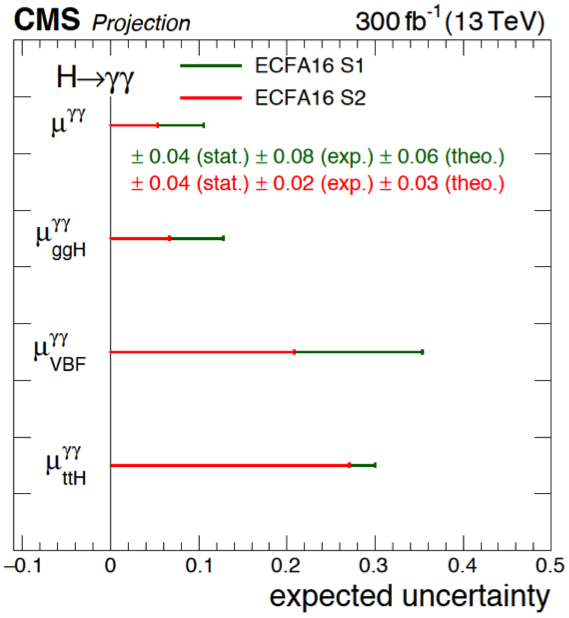
The expected uncertainties for the Higgs fiducial cross section, and for the signal strength of different production modes in the decay are shown for CMS in Fig. 8 ref12 . The fiducial cuts are defined at the generator level. The beam spot uncertainty in the beam direction is simulated to be about 5 cm with degraded vertex efficiency. The photon identification efficiency is degraded by 2.3% (10%) for the endcap+barrel (endcap+endcap) photons.
5 Projections for
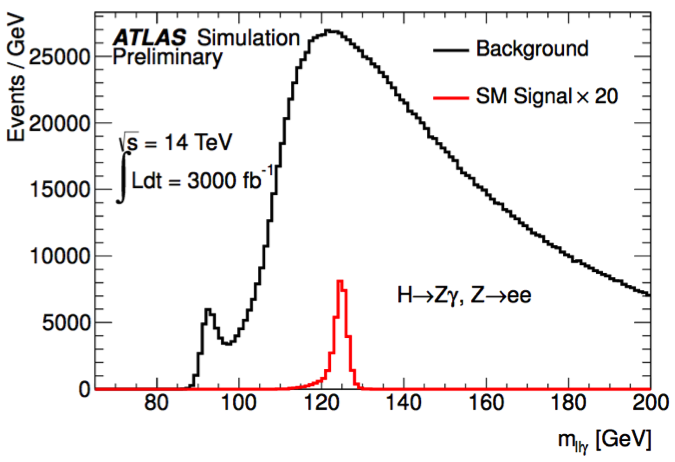
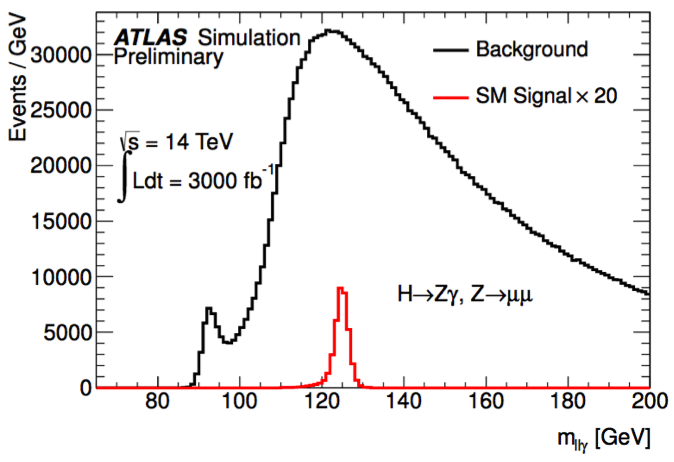
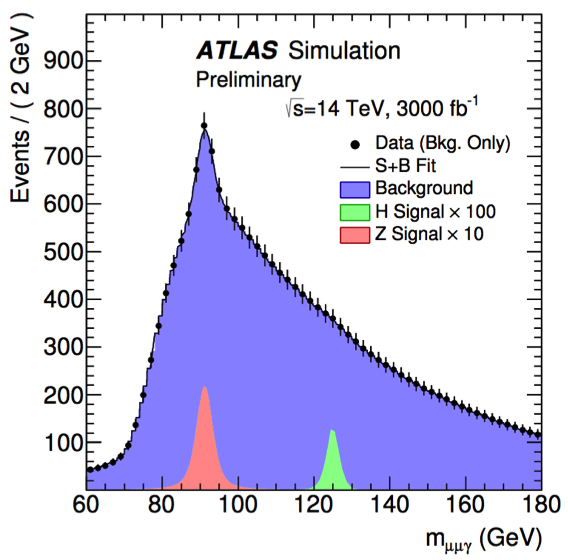
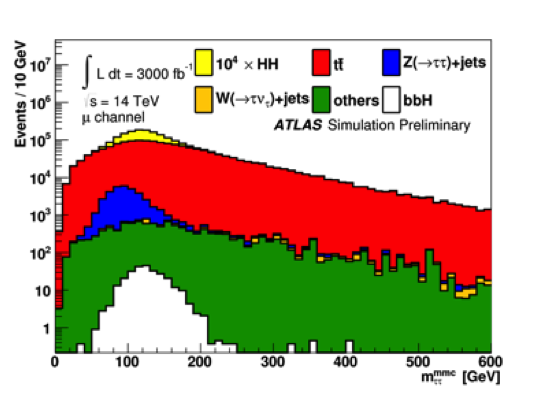
The channel is very challenging due to the high level of SM background. With 300 (3 ) of data, the expected signal significance is (). However, this channel may be sensitive to BSM through the loops. The invariant mass distributions with and are shown if Fig. 9 for ATLAS ref13 .
6 Projections for
The is sensitive to the Higgs coupling to charmed quarks. Using Run-1 data and the decay, an upper limit on the BR() has been set at , while the SM prediction gives BR()=. The mass spectrum with 3 of data is shown in Fig. 10 ref14 . With 3 , about 3 signal events are expected out of 1700 background events. Expected limits with Multi-Variate-Analysis (MVA) with no background systematics are BR()<, and BR()<fb. Although the sensitivity is not great, BSM physics can potentially enhance the rate and give an observable signal.
7 Projections for the Higgs width
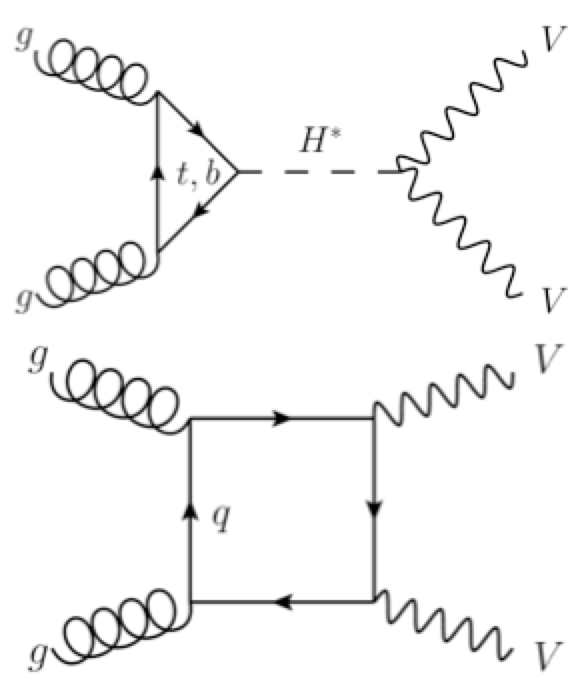
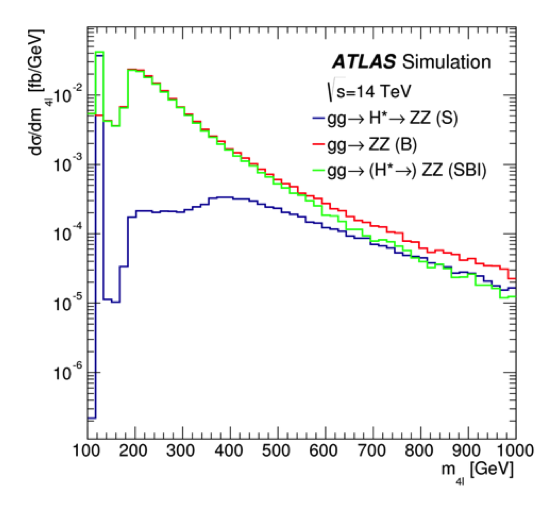
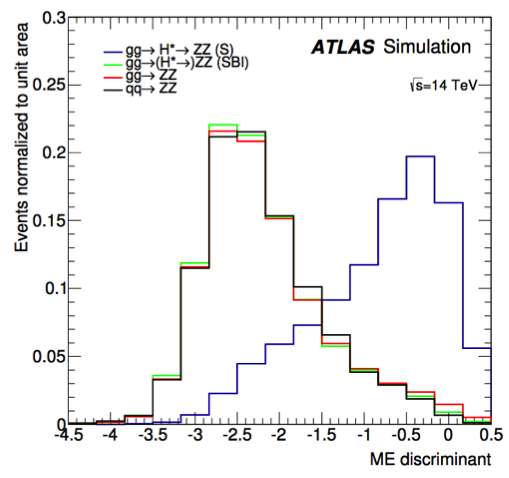
The Higgs width can be measured by the interference between the triangle and box diagrams in the process, as illustrated in Fig. 11. With the final state, the 4-lepton mass shape and the Matrix Element (ME) for each event can be used to discriminate the signal from background. Fig. 11 also shows the 4-lepton mass and ME distributions ref15 . When combined with the on-shell measurements of the Higgs, the Higgs width can be estimated. In Run-1 with the three decays of , and , upper limits of (8.1), and (8.0) for the observation (expectation), were obtained. With 3 , the precision can be improved to and MeV (statistical + systematic errors).
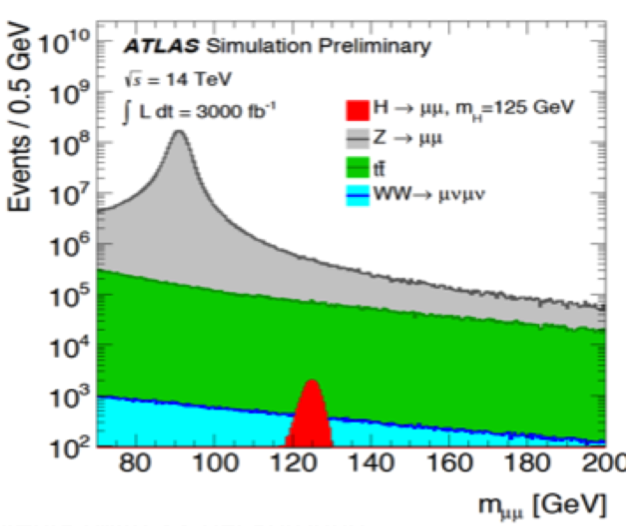
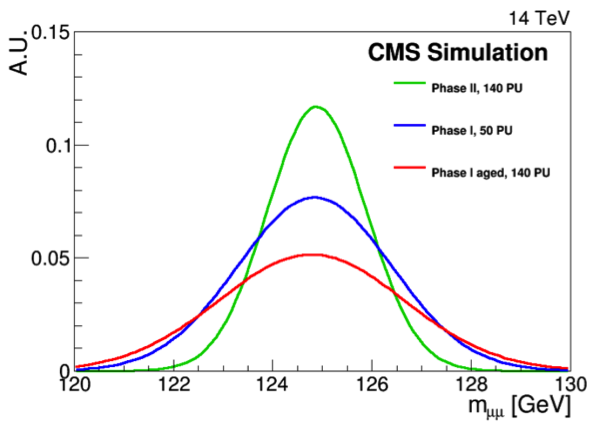
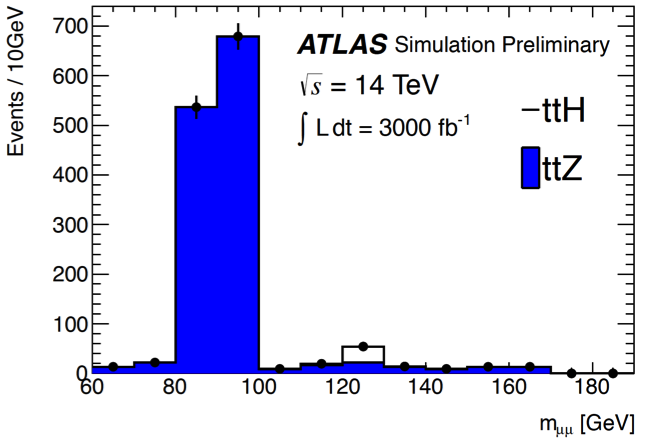
8 Projections for
The channel is very challenging because of the low BR. In Fig. 12 ref8 ; ref10 , the dimuon mass spectrum with 3 of data, the dimuon mass resolution for different detector and pileup conditions, and the dimuon mass in the associated production are given. The sharpness of the dimuon mass is crucial for both ATLAS and CMS. The coupling can be measured to a precision of 8-20% with 3 . In the , channel, about 33 signal events can be selectred out of about 22 background events, and with 300 , and a signal significance of can be reached.
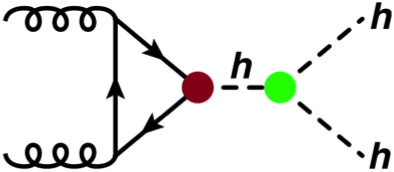
9 Projections for the double Higgs production
The Higgs self-coupling is measured with the double Higgs production. The relevant Feynman diagrams are shown in Fig. 13.
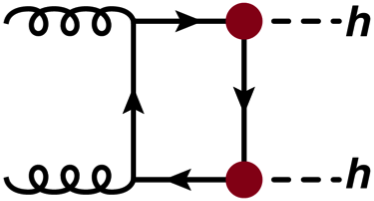
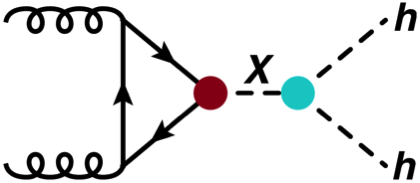
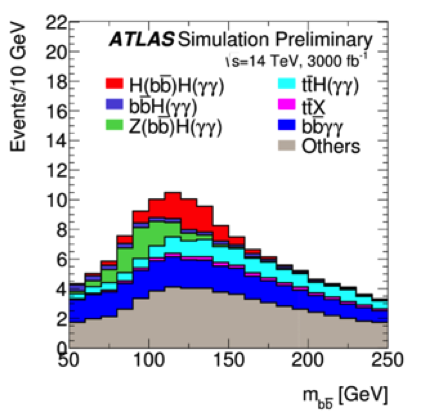
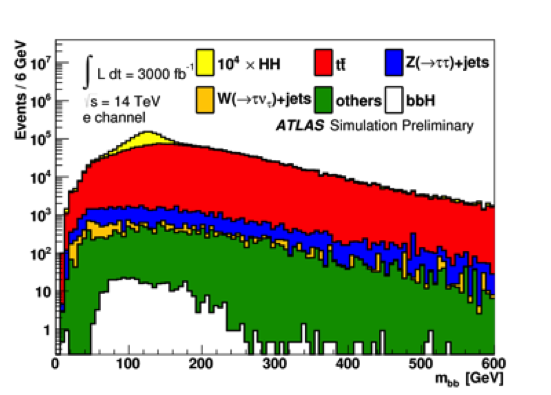
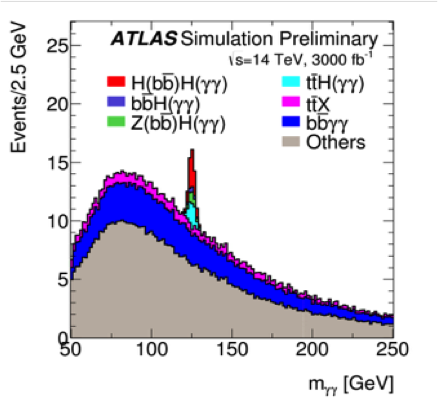
For the non-resonant SM double Higgs production, the triangle and box diagrams have negative interference, and the NNLO+NNLL prediction of the cross section is fb at 13 TeV. The invariant mass of and in the channel, and of the and in the channel with 3 of data at ATLAS are shown in Fig. 14 ref16 ; ref17 ; ref18 ; ref19 . The signal significances for , and are , and respectively. The 95% CL interval for the Higgs quartic coupling constant is () in the () channel. The expected uncertainties on the signal strength in different double Higgs decay modes from CMS are shown in Fig. 15 ref12 , and the upper limits on the signal strength are also listed in Tab. 4 ref12 . Sensitivity for the SM double Higgs production is still quite limited; anyway several BSM models can be excluded.
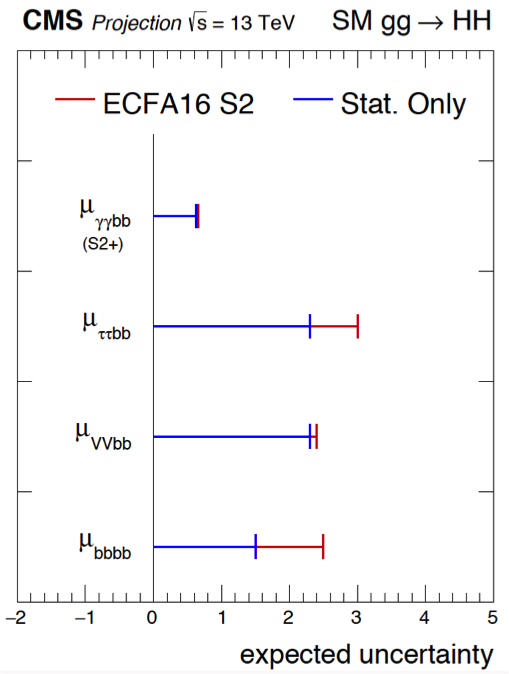
| Channel | Median expected | Z-value | Uncertainty | ||||||
|---|---|---|---|---|---|---|---|---|---|
| limits in | as fraction of | ||||||||
| ECFA16 | Stat. | ECFA16 | Stat. | ECFA16 | Stat. | ||||
| S1 | S2 | Only | S1 | S2 | Only | S1 | S2 | Only | |
| (S1+/S2+) | 1.3 | 1.3 | 1.3 | 1.6 | 1.6 | 1.6 | 0.64 | 0.64 | 0.64 |
| 7.4 | 5.2 | 3.9 | 0.28 | 0.39 | 0.53 | 3.7 | 2.6 | 1.9 | |
| 4.8 | 4.6 | 0.45 | 0.47 | 2.4 | 2.3 | ||||
| 7.0 | 2.9 | 0.39 | 0.67 | 2.5 | 1.5 | ||||
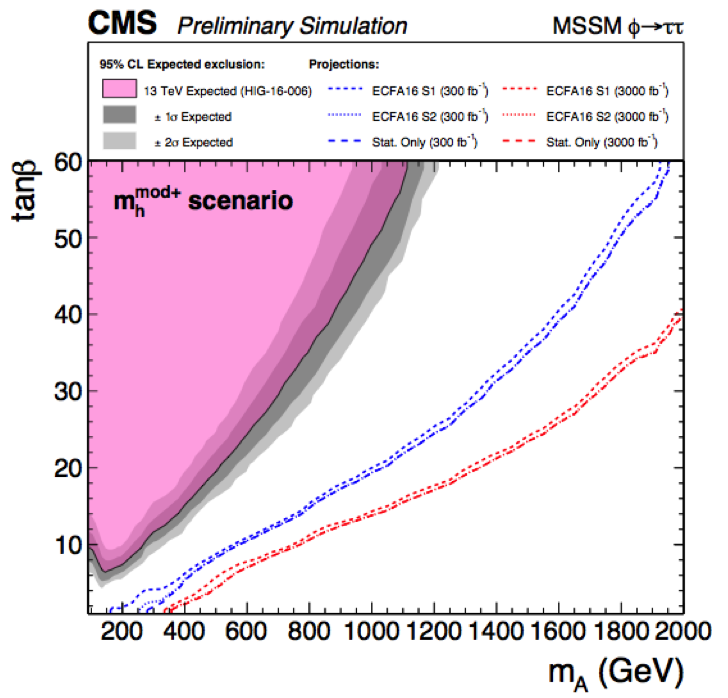
10 Projections for MSSM
In MSSM, there are five Higgs scalars, namely , , and . To be compatible with a 125 GeV Higgs, usually two scenarios are considered:
-
•
hMSSM scenario: the measured value of 125 GeV can be used to predict masses and decay branching ratios of the other Higgs bosons.
-
•
scenario: the lightest CP-even Higgs is assigned to be the 125 GeV boson.
The expected exclusion region in the - plane in the scenario for the decay at CMS is shown in Fig. 16 ref12 .
11 Projections for VBF
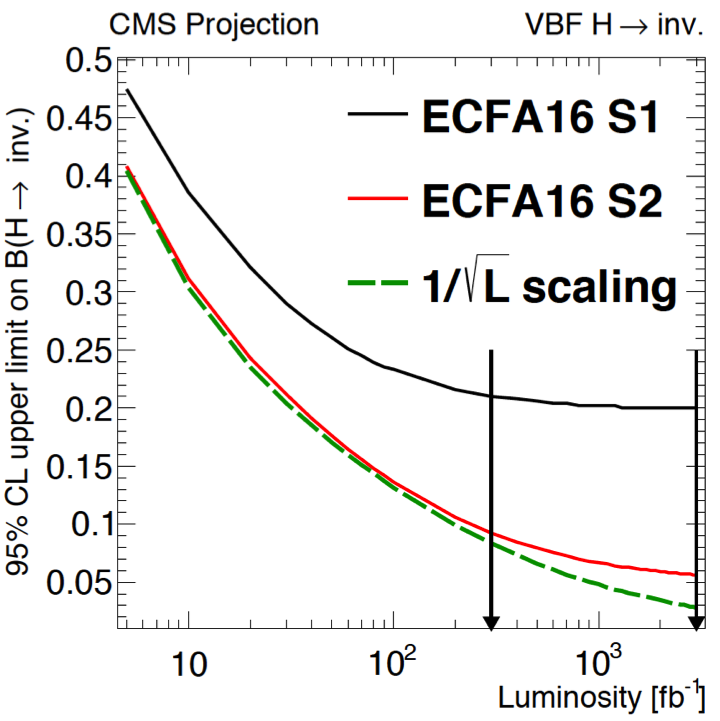
The Higgs can decay to dark matter particles such as the neutralinos leading to large Missing (MET) events. To select these events, MET triggers are required, and the VBF region with large and cuts are investigated. Dedicated and control regions are available to check the background from single vector boson processes. The VBF channel is found to be more powerful than the VH, channel. With Run-1 data, the limit of BR (0.31) was obtained for the observation (expectation) from ATLAS ref20 . The projected limits with the VBF production as a function of integrated luminosity from CMS are shown in Fig. 17 ref12 .
12 Conclusion
With a successful startup of LHC Run-2, both CMS and ATLAS are fully engaged in the 13 TeV centre of mass energy running. To exploit at best the LHC upgrade (Run III and HL-LHC), both experiments have to cope with the challenges of increased pileup rates with dedicated upgrades to the detectors. At the end of Run 3 with 300 , the Higgs couplings can be measured to 10-20%. At the end of HL-LHC with 3 of data, the precision on the couplings can improve to about 5-10%, and statistically limited measurements, like the differential Higgs distributions and test for Higgs tensor couplings, can be significantly improved. Rare Higgs decays can be probed as well. For example, the channel can reach precision, and the sensitivity for the anomalous decay at SM level can be achieved. The Higgs self-coupling via double Higgs productions can be searched for, although is still quite challenging. Indirect search for BSM through the Higgs width, and direct search for new signatures such as and the MSSM Higgs will make tighter tests of the theory. Higgs precision physics is one of the main motivations and design considerations for the HL-LHC and experiments programs.
References
- (1) ATLAS Collaboration, ATLAS-CONF-2016-067.
- (2) ATLAS Collaboration, ATLAS-CONF-2016-079.
- (3) ATLAS Collaboration, ATLAS-CONF-2016-081.
- (4) CMS Collaboration, CMS-PAS-HIG-16-020.
- (5) CMS Collaboration, CMS-PAS-HIG-16-033.
- (6) D. de Florian et al., arXiv:1610.07922.
- (7) ATLAS Collaboration, ATL-PHYS-PUB-2014-016.
- (8) CMS Collaboration, LHCC-P-008.
- (9) CMS Collaboration, LHCC-G-165.
- (10) ATLAS Collaboration, ATL-PHYS-PUB-2013-014.
- (11) ATLAS Collaboration, ATL-PHYS-PUB-2016-008.
- (12) CMS Collaboration, CMS DP-2016/064.
- (13) ATLAS Collaboration, ATL-PHYS-PUB-2014-006.
- (14) ATLAS Collaboration, ATL-PHYS-PUB-2015-043.
- (15) ATLAS Collaboration, ATL-PHYS-PUB-2015-024.
- (16) ATLAS Collaboration, ATL-PHYS-PUB-2014-019.
- (17) ATLAS Collaboration, ATL-PHYS-PUB-2015-046.
- (18) ATLAS Collaboration, ATL-PHYS-PUB-2016-023.
- (19) ATLAS Collaboration, ATL-PHYS-PUB-2016-024.
- (20) ATLAS Collaboration, JHEP 01 (2016) 172.