Supplementary Material for:

Jamming and percolation in random sequential adsorption of straight rigid rods on a two-dimensional triangular lattice

Data collapsing

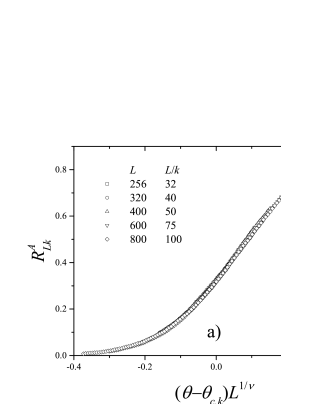
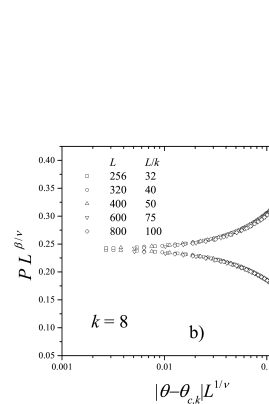
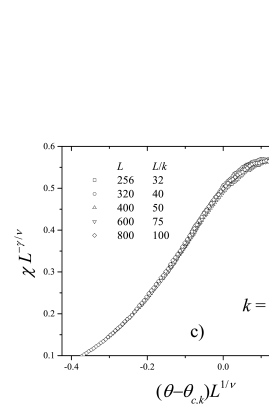
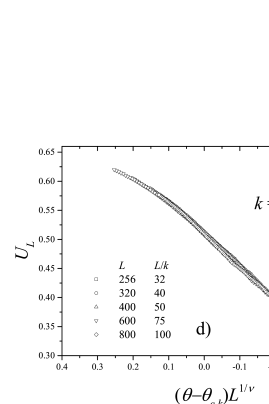
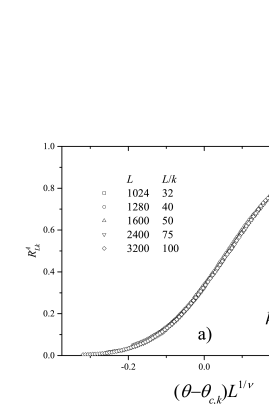
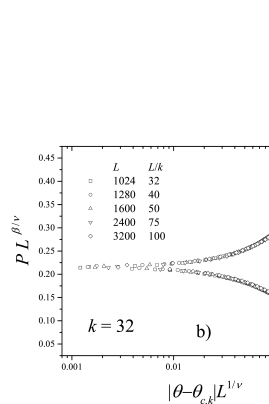
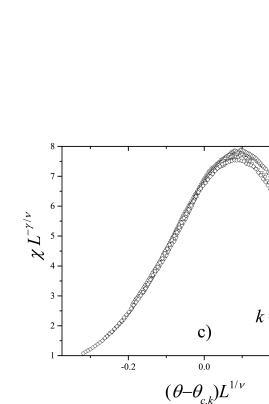
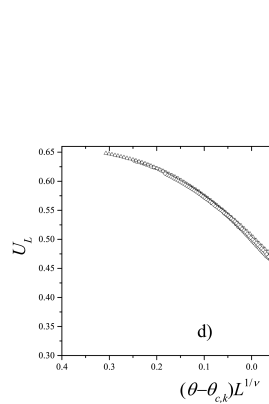
The scaling behavior can be further tested by plotting RL,kX(θ)subscriptsuperscript𝑅𝑋𝐿𝑘𝜃R^{X}_{L,k}(\theta) vs (θθp,k)L1/ν𝜃subscript𝜃𝑝𝑘superscript𝐿1𝜈\left(\theta-\theta_{p,k}\right)L^{1/\nu}, PLβ/ν𝑃superscript𝐿𝛽𝜈PL^{\beta/\nu} vs |θθp,k|L1/ν𝜃subscript𝜃𝑝𝑘superscript𝐿1𝜈|\theta-\theta_{p,k}|L^{1/\nu} and χLγ/ν𝜒superscript𝐿𝛾𝜈\chi L^{-\gamma/\nu} vs (θθp,k)L1/ν𝜃subscript𝜃𝑝𝑘superscript𝐿1𝜈\left(\theta-\theta_{p,k}\right)L^{1/\nu} and looking for data collapsing Stauffersup . Figs. 1 and 2 show the excellent collapse of curves of RL,kAsubscriptsuperscript𝑅𝐴𝐿𝑘R^{A}_{L,k} (a), P𝑃P (b), χ𝜒\chi (c) and the cumulant ULsubscript𝑈𝐿U_{L} (d), for two typical cases (k=8𝑘8k=8 and k=32𝑘32k=32) and different lattice sizes, as indicated. The plots were made using the value of θp,k=8=0.4118subscript𝜃𝑝𝑘80.4118\theta_{p,k=8}=0.4118 and θp,k=32=0.4303subscript𝜃𝑝𝑘320.4303\theta_{p,k=32}=0.4303 calculated above and the exact values of the critical exponents of the ordinary percolation ν=4/3𝜈43\nu=4/3, β=5/36𝛽536\beta=5/36 and γ=43/18𝛾4318\gamma=43/18. This leads to independent controls and consistency checks of the values of all the critical exponents.

Refer to caption
Refer to caption
Refer to caption
Refer to caption
Figure 1: Data collapsing of the percolation probability, RL,kA(θ)subscriptsuperscript𝑅𝐴𝐿𝑘𝜃R^{A}_{L,k}(\theta) vs (θθp,k)L1/ν𝜃subscript𝜃𝑝𝑘superscript𝐿1𝜈\left(\theta-\theta_{p,k}\right)L^{1/\nu} (a), for k=8𝑘8k=8. Data collapsing of the percolation order parameter, PLβ/ν𝑃superscript𝐿𝛽𝜈PL^{\beta/\nu} vs |θθp,k|L1/ν𝜃subscript𝜃𝑝𝑘superscript𝐿1𝜈|\theta-\theta_{p,k}|L^{1/\nu} (b). Data collapsing of the susceptibility, χLγ/ν𝜒superscript𝐿𝛾𝜈\chi L^{-\gamma/\nu} vs (θθp,k)L1/ν𝜃subscript𝜃𝑝𝑘superscript𝐿1𝜈(\theta-\theta_{p,k})L^{1/\nu} (c). Data collapsing of the percolation cumulant, ULsubscript𝑈𝐿U_{L} vs (θθp,k)L1/ν𝜃subscript𝜃𝑝𝑘superscript𝐿1𝜈(\theta-\theta_{p,k})L^{1/\nu} (d). The plots were made using θp,k=8=0.4118subscript𝜃𝑝𝑘80.4118\theta_{p,k=8}=0.4118, θp,k=32=0.4303subscript𝜃𝑝𝑘320.4303\theta_{p,k=32}=0.4303 and the exact percolation exponents ν=4/3𝜈43\nu=4/3, β=5/36𝛽536\beta=5/36 and γ=43/18𝛾4318\gamma=43/18.
Refer to caption
Refer to caption
Refer to caption
Refer to caption
Figure 2: Idem to Fig. 1 for k=32𝑘32k=32.

References

  • (1) D. Stauffer and A. Aharony, Introduction to Percolation Theory (Taylor & Francis, London, 1994).