Identification of the Hard X-ray Source Dominating the 25 keV Emission of the nearby galaxy M31
Abstract
We report the identification of a bright hard X-ray source dominating the M31 bulge above 25 keV from a simultaneous NuSTAR-Swift observation. We find that this source is the counterpart to Swift J0042.6+4112, which was previously detected in the Swift BAT All-sky Hard X-ray Survey. This Swift BAT source had been suggested to be the combined emission from a number of point sources; our new observations have identified a single X-ray source from 0.5 to 50 keV as the counterpart for the first time. In the 0.5–10 keV band, the source had been classified as an X-ray binary candidate in various Chandra and XMM-Newton studies; however, since it was not clearly associated with Swift J0042.6+4112, the previous E 10 keV observations did not generate much attention. This source has a spectrum with a soft X-ray excess ( 0.2 keV) plus a hard spectrum with a power law of 1 and a cutoff around 15–20 keV, typical of the spectral characteristics of accreting pulsars. Unfortunately, any potential pulsation was undetected in the NuSTAR data, possibly due to insufficient photon statistics. The existing deep HST images exclude high-mass (3 ) donors at the location of this source. The best interpretation for the nature of this source is an X-ray pulsar with an intermediate-mass (3 ) companion or a symbiotic X-ray binary. We discuss other possibilities in more detail.
Subject headings:
stars: neutron — (stars:) pulsars: general — galaxies: individual (M31) — galaxies: bulges — X-rays: binariesI. Introduction
Thanks to the sensitivity and spatial resolution of NuSTAR, we can investigate the E10 keV properties of nearby galaxies in detail. We now know that starburst and normal galaxies have X-ray spectra which drop quickly above 10 keV (Wik et al., 2014b; Lehmer et al., 2015; Yukita et al., 2016). Since a soft spectrum above 10 keV is observed in ultraluminous X-ray sources (ULXs), black hole (BH) binaries in their intermediate accretion state, and Z-sources (a subclass of neutron star low-mass X-ray binaries), we conclude that some combination of these types of sources is likely dominating the integrated galaxy spectra at harder energies (10 keV). Individual resolved sources in starburst and normal galaxies similarly show high-energy cutoffs around 5–15 keV (e.g., Church et al., 2012; Bachetti et al., 2013; Lehmer et al., 2013; Walton et al., 2013, 2014).
We expect starburst galaxies, whose specific star formation rates (sSFRs) are high, to be dominated by short-lived high-mass X-ray binaries, and that more quiescent galaxies with lower sSFRs have a contribution from low-mass X-ray binary (LMXB) systems. To isolate the E 10 keV spectral properties of the LMXB population that are related to older stellar populations, we have observed the M31 bulge, which shares basic properties (kinematics, stellar populations, etc.) with early-type galaxies.
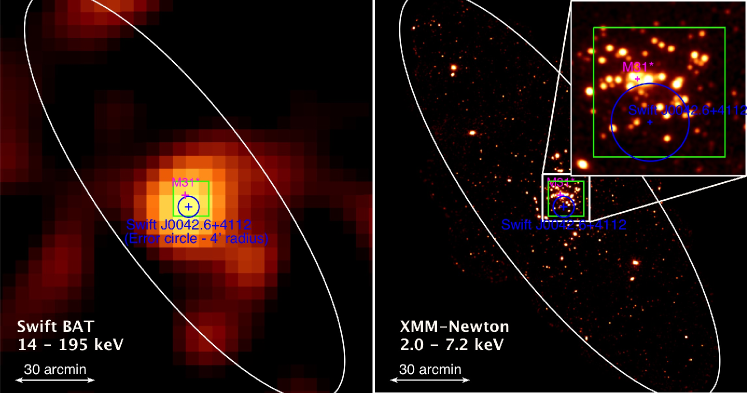
M31 was previously detected at hard energies in the Swift BAT (14–195 keV) all-sky survey (Baumgartner et al., 2013) with 7 significance. The BAT flux is dominated by a single source, Swift J0042.6+4112, located 6′ away from M31’s dynamical center with = 9 10-12 erg cm-2 s-1 in the 14–195 keV band. Its classification is listed as unknown in the BAT catalog. Revnivtsev et al. (2014) investigated the broadband 3–100 keV spectrum of the integrated M31 galaxy emission based on RXTE, Swift BAT, and INTEGRAL data and suggested that Swift J0042.6+4112 represents the total emission from the M31 galaxy above 20 keV, but 6% of the total X-ray (3 – 100 keV) luminosity for M31. The 2–10 keV luminosity of the source, extrapolated from its hard X-ray luminosity, would be 5 1038 erg s-1. Although this luminosity is bright enough to be detected with XMM-Newton or Chandra, there is no unique counterpart found in XMM-Newton or Chandra images (Revnivtsev et al., 2014). Hence, Revnivtsev et al. (2014) surmised it is a collection of very faint sources rather than a single bright point source.
Recently, we have obtained simultaneous NuSTAR-Swift observations of the M31 bulge, which detected and resolved roughly 20 X-ray point sources above 10 keV in the bulge region. We note that all the other resolved X-ray sources with NuSTAR will be reported in a follow-up paper (D. Wik et al. 2017 in-prep).
In this paper, we report the discovery of a single NuSTAR point-source counterpart to Swift J0042.6+4112, which completely dominates the bulge region at E 25 keV. We describe the NuSTAR and Swift data and data reduction in Section 2. In Section 3, the X-ray data analysis of Swift J0042.6+4112 is performed. Section 4 investigates its possible optical counterparts. We discuss the nature of this source in Section 5. We adopt a distance to M31 of 784 13 kpc (Stanek & Garnavich, 1998), for which 1′′ corresponds to 3.8 pc. Unless noted otherwise, quoted uncertainties correspond to 90% confidence intervals for one interesting parameter.
II. Observations & Data Reduction
The M31 bulge was observed with NuSTAR on 2015 October 12–14 (obsid 50101001002, PI: Yukita) for 98.5 ks. The data were then processed from level 1 to level 2 using the nupipeline script available in HEASoft version 6.17 with CALDB version 20151008. This observation suffered from strong background flares during passes through the South Atlantic Anomaly, and we manually removed contaminated periods from the good time intervals (GTIs), resulting in a final exposure of 92.2 ks. Source spectra were extracted using a 45′′ radius circular aperture, and response files (ARFs and RMFs) were created using the nuproducts script. The background spectra were extracted using a source-free region near the source in the same observation. The NuSTAR FMPA and FMPB spectra and corresponding response files were co-added using the addascaspec script, and then the final source spectrum was grouped to achieve at least one count in each bin (see Wik et al., 2014a, for discussion about grouping NuSTAR data).
Swift observed the M31 bulge on 2015 October 13–14 (obsids 00081682001 and 00081682002), simultaneous with part of the NuSTAR observation, for a total XRT exposure of 17 ks. The XRT spectra were extracted using a 45′′ radius circular region, and the ARFs were created using the xrtmkarf tool. The relevant RMFs for the observations were obtained from CALDB. We note that within our Swift observations there was exactly one XRT source consistent with the NuSTAR counterpart to the Swift BAT source; there are no other XRT sources within the NuSTAR aperture for the counterpart. Similarly to the NuSTAR data, the background spectra were extracted using the source-free region near the source in the same observations. The Swift XRT spectra and responses were also combined using the addascaspec script. The co-added XRT spectrum was grouped to achieve at least one count in each bin. Spectral analysis was performed in XSPEC version 12.9.0 using the C-statistic.
III. NuSTAR counterpart of Swift J0042.6+4112
The Swift BAT all-sky survey (Baumgartner et al., 2013) identified a hard X-ray source along the line of sight of M31 (see the left panel of Figure 1), and this is the only source listed in the 70-month catalog within the of M31. At 10 keV, using higher angular resolution observations such as XMM-Newton and Chandra, there are quite a number of X-ray point sources detected (see the right panel of Figure 1) in the M31 bulge (i.e., Kong et al., 2002; Stiele et al., 2011; Hofmann et al., 2013; Barnard et al., 2014). However, no single 0.5-10 keV X-ray point source has been constrained as a counterpart of Swift J0042.6+4112.
III.1. Source Identification
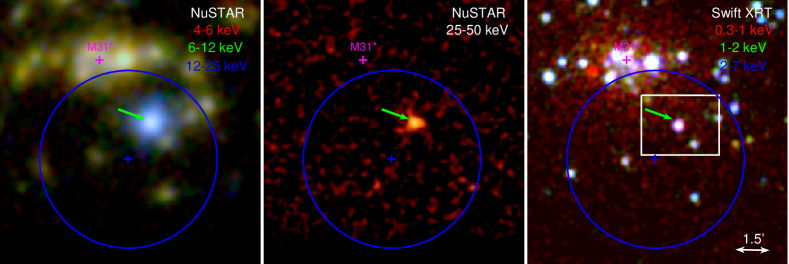
Figure 2 shows the NuSTAR (left and middle panels) and Swift (right panel) images of the M31 bulge region. Running the CIAO wavdetect tool on the Swift 0.3–7 keV image, we detected 10 sources within the BAT 91% position error circle (Baumgartner et al., 2013) indicted as a blue (4′ radius) circle in Figure 2. We note that the detection limit of our Swift observations is 1036 erg s-1 in the 0.3 – 7 keV band; however, the simultaneity of the Swift observations is of great benefit to anchor the archival (and therefore nonsimultaneous) Chandra and XMM-Newton observations to guard against the effect of variability. These 10 Swift sources in our observation were all listed in the Chandra catalog (Barnard et al., 2014), which contains more than 50 point sources within the error radius, reaching down to a luminosity limit of 5 1034 erg s-1 in the 0.3–10 keV band.
The left panel of Figure 2 shows that several Swift point sources seen in the right panel of Figure 2 are also apparent in the NuSTAR 4–25 keV color image. We point out that there is a distinctive hard source appearing in blue within the position error circle of Swift J0042.6+4112 in the NuSTAR image. This blue source is also seen in the NuSTAR 25–50 keV image (middle panel). In fact, this is the only source apparent in the FoV in this harder 25 – 50 keV band. Therefore, this source is likely to be the sole NuSTAR counterpart of Swift J0042.6+4112. This source is also clearly detected in the better spatial resolution Swift 0.3–7.0 keV image.
To obtain a better source position, we also examined the archived Chandra data and published source catalogs (Hofmann et al., 2013; Barnard et al., 2014). The high-resolution (0.5′′) Chandra data (left panel of Figure 3) reveals that there are two X-ray point sources (S184, and S188; Barnard et al., 2014) separated by 8′′ at the location of the NuSTAR counterpart of Swift J0042.6+4112, although these sources are unresolved and appear as a single source in both the NuSTAR and Swift data.
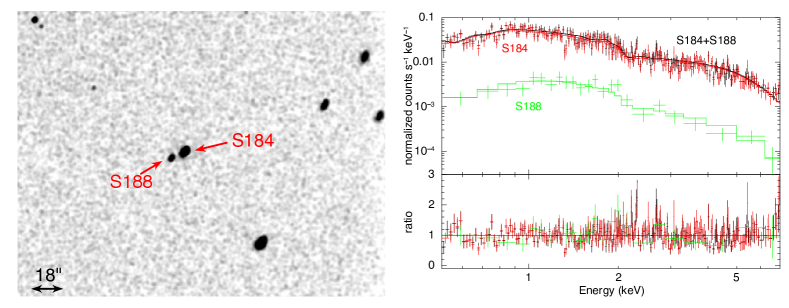
To determine which of the Chandra sources is the counterpart of Swift J0042.6+4112, we performed spectral analysis using the 2012 Chandra observation (obsid 13826, 37 ks exposure; one of the longest exposures) and compared it to the Swift observation taken in 2015. We applied an absorbed power-law model for S184 and obtained a power-law index of 1.4 with C-stat of 522 (with 410 dof). This model is statistically disfavored with null probability of 10-4 (no simulations were as bad as the model fit). Then, we applied an absorbed power law plus disk blackbody, which was chosen as a canonical X-ray binary spectral model, and we defer detailed discussion of the spectral properties to the next subsection. We note that S188 did not contain enough counts (240 counts in the 0.5 – 7.0 keV band) to fit complicated models. Therefore, we fitted absorbed power-law or disk-blackbody models only. Table 1 lists the fitting results. In 2012, the observed flux of S188 in the 0.5–7.0 keV band was less than 10% of S184. When summing the spectra of both sources, the fitted parameters listed in Table 1 are consistent with those of S184, having a 0.2 keV and power-law index of 1. The fitting results confirm that S184 dominated the spectra in the 0.5–7.0 keV as also shown in the right panel of Figure 3. We point out these best-fit parameter values are consistent with the Swift spectrum (for the sum of S184 and S188) taken in 2015, namely, having a 0.2 keV and power-law index of 0.8 (see Table 1), as well as the NuSTAR spectra exhibiting a flat power-law slope ( =1.20.2) in the 3.0 – 7.0 keV band. S184 dominates the soft X-ray spectral properties in 2012, and its spectral properties are consistent with both S184 and S188 sources combined in the 2015 Swift data. In addition, the light curves for the two Chandra sources published by Hofmann et al. (2013) show that S188 was always fainter than S184 during 2006 – 2012. Hence, we assume that S184 also dominates during our Swift observations and determine that S184 is likely the Chandra counterpart for Swift J0042.6+4112. With the better NuSTAR PSF compared to Swift BAT’s angular resolution, Swift J0042.6+4112 is identified as a single X-ray point source, previously known as S184 or CXOM31 J004232.0+411314 (Kong et al., 2002) with Chandra coordinates of = 00:42:32.072 and = 41:13:14.33 (Barnard et al., 2014), from 0.5 to 50 keV for the first time. We note that the statistical uncertainty of NuSTAR position (1 ) of this source is 0.25′′. There is no robust measurements of systematic uncertainty of the NuSTAR position, and we conservatively use 2.5′′ (1 pixel scale). Therefore, we estimate a NuSTAR position uncertainty of 2.5′′ for Swift J0042.6+4112.
Interestingly, S184 is one of the brighter point sources (1037 erg s-1) in the M31 bulge and has been detected with various X-ray telescopes (e.g., Einstein: van Speybroeck et al. 1979; Trinchieri & Fabbiano 1991; ROSAT: Primini et al. 1993; Supper et al. 2001; Chandra: Kong et al. 2002; Kaaret 2002; Hofmann et al. 2013; Barnard et al. 2014; XMM-Newton: Pietsch et al. 2005; Stiele et al. 2011). Its flux and spectral variabilities have been reported (e.g. Kong et al., 2002). The source has been interpreted as an X-ray binary candidate in M31 without further discussion of the nature of this source. We now investigate the nature of Swift J0042.6+4112 to examine what type of point sources dominate M31 at harder energies.
| Norm | Norm | (0.5–7.0 keV) | Null | ||||||
|---|---|---|---|---|---|---|---|---|---|
| SRC | (1020 cm-2) | (keV) | DBB | PL | (erg cm-2 s-1) | C-stat | dof | prob | |
| Chandra 2012 Jun 6 (obsid 13826) | |||||||||
| S184 | 7 | 1.410.05 | (1.40.6)10-5 | 9.210-13 | 522 | 410 | 10-4 | ||
| S184 | 7 | 0.200.03 | 13 | 0.920.11 | (8.51.1)10-5 | 1.010-12 | 383 | 408 | 0.6503 |
| S188 | 7 | 1.35 | 0.0010 | 5.910-14 | 100 | 149 | 0.5934 | ||
| S188 | 7 | 1.520.19 | (1.20.2)10-5 | 6.510-14 | 98 | 149 | 0.7615 | ||
| S188+S184 | 7 | 0.200.03 | 14 | 0.990.10 | (9.81.6)10-5 | 1.110-12 | 391 | 412 | 0.6083 |
| Swift 2015 Sep 13–14 (obsids 00081682001 and 00081682002) | |||||||||
| S188+S184 | 7 | 0.21 | 12 | 0.80 | 7.410-5 | 1.110-12 | 224 | 263 | 0.9999 |
III.2. NuSTAR & Swift Spectral Analysis
In this section, we explore the 0.5–50 keV spectral properties of Swift J0042.6+4112 with NuSTAR and Swift. We limit the joint spectral analysis to the simultaneously taken NuSTAR and Swift observations, as we see flux variabilities of this source (see Tables 1 and 3). Since both NuSTAR and Swift spectra include emission contributed from S188, we take its contribution into account by including the fit model of S188 from Table 1. Two S188 models are indistinguishable, but we use an absorbed disk-blackbody model as it is a slightly better description of the observed spectrum (null probability of 0.6). We fixed the parameter values, except for allowing the normalization to vary by up to 30%. We note, however, that the fit results are consistent within the errors when we do not include the S188 component. Therefore, contamination by emission from S188 has no appreciable impact on the conclusions we make here.
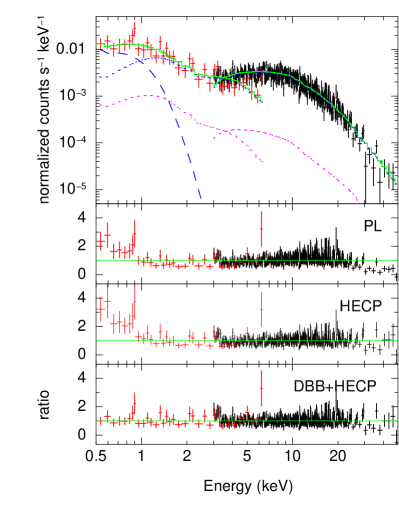
Initially, we fit S184 (the Swift J0042.6+4112 counterpart) with a simple absorbed power-law model. The photon index and null probability from this model were 1.2 and 0.0002, respectively (see Table 2). This model is disfavored statistically. Inspecting the residuals, this power-law model deviates from the data below 1 keV and above 30 keV (see Figure 4), suggesting that the spectrum has curvature. Hence, we proceeded with a high-energy cutoff power-law model, often used for accreting X-ray pulsars (i.e., strong magnetic field neutron star binary systems; Müller et al., 2013). This model was marginally accepted with the null probability of 0.12. We also apply a broken power-law model to compare with the BAT power-law slope. Both models fit reasonably well (null probability of 0.21), including the data above 20 keV, demonstrating that the spectrum steepens at higher energies. The photon index above the break energy for the broken power-law model is = 2.47, which agrees within the errors with the power law index of = in the 14–195 keV band obtained from the BAT 70-month survey (Baumgartner et al., 2013).
To better fit the spectrum below 1 keV, we added a disk-blackbody component. This additional soft component models the spectrum below 1 keV well with = 0.2 keV, consistent with parameter values listed in Table 1 and reduces C-stat by 50 for one additional parameter. The null probability is also improved from 0.12 to 0.75. We note that the absorption was fixed to the Galactic value, as there were not enough counts in the Swift spectrum to constrain both and the disk-blackbody component. We also applied the disk-blackbody plus broken power-law model; which fits equally well (see Table 2). We note that the additional soft component does not impact the broken power law or high energy cutoff power law model parameters significantly. We also note that the disk-blackbody component flux is less than 15% of the total flux in the 0.5–7.0 keV band. Table 2 tabulates the fitting results.
The 0.5–50 keV spectral analysis results suggest that Swift J0042.6+4112 possesses similar X-ray spectral properties to accreting X-ray pulsars that have a soft X-ray excess (e.g., Hickox et al., 2004). The observed flux in 0.5–50 keV for the best-fit model (disk blackbody plus high-energy cutoff power law) is 5.5 10-12 erg cm-2 s-1 (the unabsorbed flux does not differ, due to the relatively low value). Assuming that this object is located within M31, the corresponding luminosity is 4.0 1038 erg s-1 in the 0.5–50 keV band. The brightest known accreting X-ray pulsars typically achieve similar luminosities (e.g., LMC X-4; Hung et al., 2010, SMC X-1; Neilsen et al., 2004, RX J0059.2-7138, Hughes, 1994; M82 X-2, NGC7793 P13 and NGC 5907 ULX1 for exceptionally bright examples; Bachetti et al., 2014; Fürst et al., 2016; Israel et al., 2017, 2016).
The Swift BAT 70-month averaged flux in the 14–195 keV band is 9.65 10-12 erg cm-2 s-1 (Baumgartner et al., 2013). We estimate the 14–195 keV flux for our observation by extrapolating the disk-blackbody plus a high energy cutoff power-law model and obtain 3.9 (3.8 for broken power law) 10-12 erg cm-2 s-1, which is about 40 % of the BAT 70-month flux. We also fit the disk-blackbody plus a high-energy cutoff power-law model to the NuSTAR, Swift XRT, and Swift BAT 70-month averaged spectrum, with the Swift BAT spectrum scaled to take variability into account. This fit is consistent with the results presented in Table 2, with the BAT 70-month spectrum having a normalization 2.2 times higher for the high-energy cutoff power law component. This suggests that the hard X-ray flux was a factor of 2 fainter in 2015 compared to the average flux during 2006–2012, or that there were additional sources that varied within the BAT source region.
The BAT 70-month light curve does not show strong variability (Baumgartner et al., 2013), but the signal-to-noise ratio is not high, and the statistical uncertainty may be large. We note that the 0.5–7.0 keV flux did not change in observations between 2012 and 2015 (Table 1); however, the Chandra light curve between 2006 and 2012 shows flux variability more than factor of 2 in the 0.2–10 keV band (see Figure B1, source 75 of Hofmann et al., 2013). We also confirmed that the 0.5–7.0 keV flux in 2010 was about 2–4 times dimmer (see Table 3).
Concerning the possibility that other sources are contributing to the BAT source flux, there are faint sources located outside of the NuSTAR 45′′ radius aperture, which were undetected in the NuSTAR data at harder energies. Some of these faint sources could contribute to the flux listed in the BAT catalog. We examined how much hard X-ray emission (in the 25–50 keV band) comes from Swift J0042.6+4112 compared to the total NuSTAR FoV in our NuSTAR observation. We note that the background for the NuSTAR FoV was estimated using the nuskybgd tool (see Wik et al., 2014a, for details). We found that no more than 15% of emission is contributed from sources other than Swift J0042.6+4112 in the NuSTAR 25–50 keV band, and it is unlikely that undetected faint point sources largely contribute to the BAT flux.
| Modela | b | b | (0.5–50 keV) | Null | |||||
|---|---|---|---|---|---|---|---|---|---|
| +S188 | (1020 cm-2) | (keV) | b | (keV)/(keV) | (keV)/– | (erg cm-2 s-1) | C-stat | dof | probc |
| PL | 7.0 | 1.150.03 | 7.010-12 | 1207 | 1143 | 0.0002 | |||
| BKNPL | 7.0 | 0.99 | 18 | 2.47 | 5.410-12 | 1100 | 1141 | 0.2076 | |
| HECP | 7.0 | 1.00 | 17 | 19 | 5.410-12 | 1100 | 1141 | 0.1211 | |
| DBB+HECP | 7.0 | 0.19 | 0.86 | 14 | 19 | 5.510-12 | 1050 | 1140 | 0.7498 |
| DBB+BKNPL | 7.0 | 0.19 | 0.91 | 17 | 2.310.31 | 5.610-12 | 1051 | 1140 | 0.8839 |
III.3. Timing Analysis
We performed timing analysis on the NuSTAR data to in order to search for spin and orbital periods. Detecting a pulsation would be strong evidence that the X-ray source is a neutron star system. Also, a relation between pulse period and orbital period gives some information such as mass transfer mechanisms (i.e., Corbet diagram; Corbet, 1986).
We binned the NuSTAR barycenter corrected lightcurve of Swift J0042.6+4112 (combined FMPA and FMPB) using the 3.0–50 keV band. We first fit a constant to the lightcurve binning by 7000 s, and obtained /dof = 39.2/27, suggesting possible moderate flux variability on timescales of several hours. We note that the net count rate of both telescopes for a 45′′ aperture is 0.085 count s-1 (the background is included). Using the barycenter corrected 3-50 keV events we then looked for any periodicity between 0.1 and 10000s applying the epoch folding technique (Leahy et al., 1983). We used 32 phase bins, and roughly 18.6 million test periods were investigated for this period range. However, we did not find significant signals besides the 5.8 ks period of the satellite orbit. Based on Equation 15 of Leahy et al. (1983) we determine an upper limit for a possible pulsation amplitude of 0.08 counts s-1 on a 99% confidence level.
We note that there will be another NuSTAR observation of this source simultaneously taken with XMM-Newton during NuSTAR Cycle 2, and detailed long-term variability including the use of the archived Chandra, XMM-Newton and Swift data will be presented in a future paper.


IV. UV & Optical counterparts
The X-ray spectral properties suggest that Swift J0042.6+4112 is likely an accreting pulsar. In this section, we examine the UV to optical properties of the source to help determine its nature.
The bulge of M31 is partially observed with HST as part of the Panchromatic Hubble Andromeda Treasury (PHAT, Dalcanton et al., 2012) Survey. The area of the sky around Swift J0042.6+4112 is covered with 4 filters (F275W, F336W, F475W and F814W). The reduced images and photometry of individual sources are published by Williams et al. (2014), which we use in our analysis below.
Figure 5 shows an HST three color (F336W, F475W, and F814W for blue, green, and red, respectively) image at the location of the Chandra source S184. We adopted the source position published by Barnard et al. (2014), which was registered to the LGS M31 Field 5 -band image by Massey et al. (2006). We checked for any astrometry offset between the HST and Chandra positions, using the brightest optical source marked in Figure 5, J004232.08+411315.2 in Massey et al. (2006). The position of J004232.08+411315.2 reported by Massey et al. (2006) agrees with the HST position reported by Williams et al. (2014) within 0.06′′. Therefore, further corrections to the astrometry were not necessary.
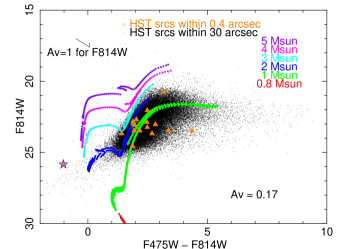
We searched for UV/optical counterparts of Swift J0042.6+4112 within a Chandra error circle with a radius of 0.4′′ (Barnard et al., 2014) . There are 17 HST sources listed within this 0.4′′ radius in Williams et al. (2014). Utilizing the photometry published in that work, we constructed a color-magnitude diagram using the F814W and F475W filter magnitudes as shown in the left panel of Figure 6. In this figure, we overplotted the PARSEC stellar evolutionary tracks (Bressan et al., 2012) for 0.8, 1, 2, 3, 4, and 5 stars. We assumed solar metallicity (Saglia et al., 2010), and the extinction was fixed at the Galactic value of = 0.170 mag (Schlafly & Finkbeiner, 2011). The observed column density in the M31 bulge area is relatively low ( log 21 cm-2; Braun et al., 2009). However, high spatial extinction maps indicate there are the patchy dust lanes in the bulge region (e.g., Li et al., 2009; Dong et al., 2016). We investigated the Spitzer 8µm map by Li et al. (2009) and also created the F475W-F814W color map to look for potential dust lanes. We determined that the region around Swift J0042.6+4112 is not likely to have a high extinction and using a Galactic excitation value is adequate.
Figure 6 suggests that all HST sources within the 0.4′′ radius region except one are very similar to the surrounding stellar populations. We also find that there are no high-mass (3 ) stars within the 0.4′′ radius region. In addition, no HST matches are consistent with main sequence stars; most of them are likely evolved intermediate- and/or low-mass stars. We note that there is a unique HST blue source in the 0.4′′ region (the open blue star in Figure 6). Fitting the 4-band SED using the Bayesian Extinction and Stellar Tool (Gordon et al., 2016) suggests that it is not consistent with any model of stable evolutionary phases, suggesting that it is a post-AGB and/or the x-ray source is contaminating the UV and optical flux. We examined the F275W-F336W color and magnitude of this blue source and found that it is likely a hot post-horizontal branch star at the distance of M31 as studied in Rosenfield et al. (2012). The surface density for hot post-horizontal branch stars at the location of Swift J0042.6+4112 is lower than 0.01 arcsec-2 (Rosenfield et al., 2012); therefore, the probability that such a star is found within the 0.4′′ radius circle is 0.005. This is a small value and makes it an interesting HST match.
The optical emission associated with Galactic LMXBs are related to their accretion disks rather than their companions. We also checked whether or not any of these optical matches could be an accretion disk by comparing the HST photometric data to the best-fit disk-blackbody component. We first analyzed the Chandra and XMM-Newton data (obsids 11840 and 0650560201), which are taken on similar epochs as the HST PHAT data (2010 July 24 for F275W and F336W, and 2010 December 25–26 for F475W and F814W) to measure the disk-blackbody flux during those periods. Similar to the previous section, we applied an absorbed power-law plus disk-blackbody model in the 0.5–7.0 keV band. The results are given in Table 3. Due to the small number of counts in the spectra (especially the Chandra spectrum), we fixed the absorption to the Galactic value. The Chandra observation in 2010 July did not constrain the disk component; therefore, we fixed the disk temperature at = 0.2 keV. For the XMM-Newton data taken in 2010 December, the spectrum contains both S184 and S188 as they were not resolved in the XMM-Newton observation. However, we point out that the disk component parameters agree within the uncertainties with and without the S188 contribution using the listed values in Table 1. These spectral fitting results suggest that Swift J0042.6+4112 was 2–5 times dimmer than in the Oct 2015 NuSTAR-Swift observation. The disk component is barely detected.
The right panel of Figure 6 shows two SED (F814W, F475W, F336W and F275W photometry data points) examples of the HST matches with the best-fit absorbed disk-blackbody models obtained from Table 3 to see if the UV/optical counterpart is related to the accretion disk. We note that the power-law component is unlikely to be emitted in the UV-optical band; therefore, it is omitted. The figure suggests that these two HST matches are not likely due to accretion disk flux. For example, the open green square match has an observed optical emission that is higher than predicted from the disk model. Moreover, its UV/optical emission is rather consistent with a K0III star spectrum, as expected from the color-magnitude diagram. Another example, the blue match with open blue star symbol, is not consistent with the accretion disk model either. We repeated the same exercise for the remaining sources and found that no HST sources are consistent with the accretion disk model. This suggests that the optical matches are not related to the accretion disk and are likely stellar objects.
We note that it is possible that the system has a companion that is below the detection limit of the HST data (i.e., 2 main-sequence star or a bit lower if it is an evolved star).
| Norm | Norm | (0.5–7.0 keV) | Null | ||||||
|---|---|---|---|---|---|---|---|---|---|
| SRC | (1020 cm-2) | (keV) | DBB | PL | (erg cm-2 s-1) | C-stat | dof | prob | |
| Chandra 2010 July 20 (obsid 11840) | |||||||||
| S184 | 7 | 0.20 | 2 | 1.26 | 8.310-5 | 6.310-13 | 93 | 119 | 0.9261 |
| XMM-Newton 2010 December 26 (obsid 0650560201) PN only | |||||||||
| S188+S184 | 7 | 0.20 | 2 | 1.22 | 2.710-5 | 2.310-13 | 311 | 407 | 0.8961 |
V. Discussion
We have identified a single hard X-ray (25 keV) source within the error circle of Swift J0042.6+4112 with NuSTAR. In a simultaneous Swift observation, we also detected an X-ray point source at the location of this NuSTAR source in the 0.5–7.0 keV band. We have investigated the high spatial resolution Chandra data, as well as the literature, and pinpointed the location of this source to within 0.4′′. In this section, we discuss the possible nature of Swift J0042.6+4112.
First, we consider whether or not this source is a background AGN. Based on the log –log of the Swift BAT AGN (Ajello et al., 2012), we expect 0.03 AGN at the flux limit of 6 10-12 erg cm-2 s-1 in the 15–55 keV band for the entire (3) of M31. If we restrict the area to the central 6′ radius, the probability for an AGN is 5 10-4, confirming the estimate from Revnivtsev et al. (2014). Similarly, we estimated the probability for the source being a background AGN from the NuSTAR 8–24 keV band using the number counts from Harrison et al. (2015) and obtained 0.05 and 8 10-4 for the entire galaxy and the central 6′, respectively. These estimates suggest that Swift J0042.6+4112 is unlikely to be a background AGN. In addition, the structure function based on long-term variability from 13 years of Chandra observations is not consistent with the ensemble AGN structure function (Barnard et al., 2014), suggesting that Swift J0042.6+4112 is unlikely to be a background AGN. Furthermore, the shape of the X-ray spectrum having a flat slope would have to be a highly obscured AGN; however, we do not see a rising power law to 20–40 keV (i.e., Lansbury et al., 2015; Ptak et al., 2015).
The X-ray broadband (0.5–50 keV) spectral properties, i.e., the hard spectrum ( 1) at lower energies with a cutoff around 15–20 keV, are more consistent with Galactic X-ray pulsars (e.g., Hung et al., 2010; Camero-Arranz et al., 2012; Fürst et al., 2013) than with black hole binaries and neutron star binaries with weak magnetic fields (Z-sources and atoll sources). Our observations suggest that there is a soft X-ray excess in this system, and the soft excess has been also seen in several accreting pulsars (e.g. Nagase, 2002; Hickox et al., 2004). One of the well-studied systems with a soft excess is the Galactic X-ray pulsar Her X-1. In this case the soft excess is modeled as reprocessed hard X-rays through the inner edge of the accretion disk (Endo et al., 2000; Ramsay et al., 2002). The soft excess of Her X-1 is fit with a blackbody temperature of keV, which is similar to the disk blackbody temperature found here for Swift J0042.6+4112. The X-ray luminosity of Her X-1 is 3.1 1037 erg s-1 (in the 1.0 – 50 keV band; Enoto et al., 2008). If Swift J0042.6+4112 belongs to M31, then the X-ray luminosity in the 1.0 – 50 keV band is 4 1038 erg s-1, which is a factor of 10 higher than Her X-1. However, the bright end of the Galactic accreting pulsars reaches this luminosity (i.e., SMC X-1, LMC X-4, Cen X-3 and RX J0059.2–7138).
Inspecting the UV and optical HST images of the M31 bulge, we concluded that the potential optical counterparts of Swift J0042.6+4112 have magnitudes that are inconsistent with the standard accretion disk model, and so are likely unrelated to the accretion disk of Swift J0042.6+4112. Also, the detected HST matches are unlikely to be main sequence stars and probably less massive than 3 . This suggests that the Swift J0042.6+4112 system has either an evolved 1–3 companion or a 2 main-sequence donor below the HST detection limit. The Her X-1 system also has an intermediate mass companion with 2 (though a main sequence donor. This makes it a unique system, because a majority of accreting pulsars are known to be young systems having a Be, B, or O companion. Swift J0042.6+4112 could be a very similar system to the Her X-1. Swift J0042.6+4112 may not be a young system, but perhaps the compact object does not have enough accreted material yet to decay its magnetic field, making it still an X-ray pulsar.
Alternatively, Swift J0042.6+4112 could be a symbiotic X-ray binary. This type of source has an M giant companion with long spin and orbital periods, often found accreting via a wind. This type of source is rare, with only 5 of them found in the Galaxy (Enoto et al., 2014). GX 1+4, the bright prototype, has an M giant donor with an upper limit of about 1.22 (Hinkle et al., 2006), which may be comparable to the HST matches we found for Swift J0042.6+4112. The known symbiotic X-ray binaries have luminosity of 1033 – 1036 erg s-1, more than 2 orders of magnitude lower than Swift J0042.6+4112. However, it may be possible to brighten to 1038 erg s-1 depending on the wind velocity and the binary separation that would determine the accretion rate.
Another counterpart of interest is a hot post-horizontal branch star candidate (the blue source in the HST image) in the region. However, it is unlikely a companion because it should be shrinking as it cools. We also note that Swift J0042.6+4112 could be an ultracompact binary (i.e., 4U 1626-67 and 4U 1822-37) with a white dwarf companion (Savonije et al., 1986) that is under the HST detection limit. This kind of system has a hard power spectrum below 10 keV (see Esposito et al., 2016), which is similar to Swift J0042.6+4112. We point out that this type of system has a very short orbital period (on the order of subhours). Detecting an orbital period and pulsation of Swift J0042.6+4112 will certainly help determine the nature of the source.
Recently, Esposito et al. (2016) discovered the first accreting pulsar in the direction of an external arm of M31 with detection of its 1.2 s spin, thanks to its relatively high pulse fraction (50%), using XMM-Newton observations. They also found that its orbital modulation is about 1.3 days. The 0.3–10 keV luminosity is 1037– 1038 erg s-1, which is comparable to Swift J0042.6+4112. Since there is no potential high-mass donor in the field, they suggest that the system is likely an accreting pulsar with an intermediate donor like Her X-1 or an ultracompact binary with a very low mass donor. This suggests that a similar population to Swift J0042.6+4112 exists in M31. However, it is unclear why only Swift J0042.6+4112 dominates the entire galaxy at hard energies.
Lastly, we consider a possibility that it is a Galactic source along the line of sight toward M31, such as an Intermediate polar (IP) CV system, symbiotic X-ray binary, ultracompact binary or black widow. IP CV systems are known to have hard X-ray emission. We can estimate a probability that Swift J0042.6+4112 is a Galactic IP using the space density derived from the Swift BAT 70-month catalog by Pretorius & Mukai (2014). Assuming that IPs are detectable up to 500 pc, we expect 0.09 and 0.001 foreground IPs for the area of the entire M31 galaxy and the central 6′ radius, respectively, for the observed 14–195 keV flux of 9 10-12 erg cm-2 s-1 toward the M31 direction (b= 21∘). The X-ray spectrum of these systems are generally characterized with thermal (multi-temperature) emission with Compton reflection with an association of the Fe K fluorescent line (i.e., Mukai et al., 2015). However, the NuSTAR observation does not show strong Fe emission lines. We also applied a thermal plasma model instead of a power law to the NuSTAR spectra, but the parameters are not well constrained ( 1.8 erg cm-2 s-1 for a 90% upper limit and 80 keV which is exceeding the mekal or apec model limit), suggesting that it is unlikely an IP CV system.
If we assume a Galactic source located at 1–10 kpc, the expected X-ray luminosity would be about 1032 – 1034 erg s-1 in the 0.5–50 keV band. At these distances, the HST image should identify its companion down to a 0.2 – 0.5 main-sequence star. The X-ray luminosity would be reasonable for a Galactic symbiotic X-ray binary system (Enoto et al., 2014), but the HST image should identify its M giant companion. Hence, it is unlikely to be a Galactic symbiotic X-ray binary.
Galactic black widows may contain very low mass companions ( 0.1 ), which may be at or below the HST detection limit (e.g. 23 for PSR J1953+1846A at 4 kpc; Cadelano et al. 2015). Often, Galactic black widows are also known as radio pulsars; however, there are no known radio sources with periodicities detected in the direction of M31 (Rubio-Herrera et al., 2013). The 0.3 – 8.0 keV spectrum of Galactic black widows can be characterized by blackbody plus power-law components with similar photon index and values (Gentile et al., 2014) to Swift J0042.6+4112. However, the flux of the thermal component is, in general, about 40% (or higher) of the power law component (Gentile et al., 2014). In contrast, the thermal component of Swift J0042.6+4112 is less than 15% of the power law flux in the Swift data. Also, the flux of Swift J0042.6+4112 is about an order of magnitude higher. Therefore, the source is unlikely to be a Galactic black widow.
Some known Galactic ultracompact binaries (i.e., 4U 1626-67 and 4U 1822-37) also contain very low mass donors ( 0.1 ). Unfortunately, it is difficult to compare from the Galactic ultracompact binary population, as it is not well sampled. Therefore, we cannot reject the possibility of Swift J0042.6+4112 being a Galactic ultracompact binary completely.
Finally, the 0.5–2.0 keV spectrum of Swift J0042.6+4112 suggests a disk-like feature, and often a disk is found in the bright end of the X-ray binary systems. We conclude that Swift J0042.6+4112 is likely to be an X-ray accreting pulsar with an intermediate-mass ( 3 ) companion or a symbiotic X-ray binary located in M31 with X-ray luminosity of a few times 1038 erg s-1. In either case, it dominates all emission from M31 at harder energies.
We would like to thank the referee for his/her comments, which improved our manuscript. We sincerely thank Neil Gehrels for approving the Swift DDT observations used in this work. We also thank NuSTAR and Swift mission planners for making the Swift and NuSTAR observations simultaneous. This research has made use of the NuSTAR Data Analysis Software (NuSTARDAS) jointly developed by the ASI Science Data Center (ASDC, Italy) and the California Institute of Technology (Caltech, USA). This work was supported by NuSTAR GO NNX15AV30G. We are grateful to Antara Basu-Zych, Hans Krimm, Craig Markwardt, Ryan Hickox, Dheeraj Pasham, Koji Mukai, Lennart van Haaften, and Panayiotis Tzanavaris for helpful discussions. KLP acknowledges funding from the UK Space Agency. RB acknowledges funding from the Deutsches Zentrum für Luft- und Raumfahrt grant 50 OR 1410.
Facilities: NuSTAR, Swift
References
- Ajello et al. (2012) Ajello, M., Alexander, D. M., Greiner, J., et al. 2012, ApJ, 749, 21
- Bachetti et al. (2013) Bachetti, M., Rana, V., Walton, D. J., et al. 2013, ApJ, 778, 163
- Bachetti et al. (2014) Bachetti, M., Harrison, F. A., Walton, D. J., et al. 2014, Nature, 514, 202
- Barnard et al. (2014) Barnard, R., Garcia, M. R., Primini, F., et al. 2014, ApJ, 780, 83
- Baumgartner et al. (2013) Baumgartner, W. H., Tueller, J., Markwardt, C. B., et al. 2013, ApJS, 207, 19
- Braun et al. (2009) Braun, R., Thilker, D. A., Walterbos, R. A. M., & Corbelli, E. 2009, ApJ, 695, 937
- Bressan et al. (2012) Bressan, A., Marigo, P., Girardi, L., et al. 2012, MNRAS, 427, 127
- Cadelano et al. (2015) Cadelano, M., Pallanca, C., Ferraro, F. R., et al. 2015, ApJ, 807, 91
- Camero-Arranz et al. (2012) Camero-Arranz, A., Pottschmidt, K., Finger, M. H., et al. 2012, A&A, 546, A40
- Cardelli et al. (1989) Cardelli, J. A., Clayton, G. C., & Mathis, J. S. 1989, ApJ, 345, 245
- Castelli & Kurucz (2004) Castelli, F., & Kurucz, R. L. 2004, ArXiv Astrophysics e-prints, astro-ph/0405087
- Church et al. (2012) Church, M. J., Gibiec, A., Bałucińska-Church, M., & Jackson, N. K. 2012, A&A, 546, A35
- Corbet (1986) Corbet, R. H. D. 1986, MNRAS, 220, 1047
- Dalcanton et al. (2012) Dalcanton, J. J., Williams, B. F., Lang, D., et al. 2012, ApJS, 200, 18
- Dickey & Lockman (1990) Dickey, J. M., & Lockman, F. J. 1990, ARA&A, 28, 215
- Dong et al. (2016) Dong, H., Li, Z., Wang, Q. D., et al. 2016, MNRAS, 459, 2262
- Endo et al. (2000) Endo, T., Nagase, F., & Mihara, T. 2000, PASJ, 52, 223
- Enoto et al. (2008) Enoto, T., Makishima, K., Terada, Y., et al. 2008, PASJ, 60, S57
- Enoto et al. (2014) Enoto, T., Sasano, M., Yamada, S., et al. 2014, ApJ, 786, 127
- Esposito et al. (2016) Esposito, P., Israel, G. L., Belfiore, A., et al. 2016, MNRAS, 457, L5
- Fürst et al. (2013) Fürst, F., Grefenstette, B. W., Staubert, R., et al. 2013, ApJ, 779, 69
- Fürst et al. (2016) Fürst, F., Walton, D. J., Harrison, F. A., et al. 2016, ApJL, 831, L14
- Gentile et al. (2014) Gentile, P. A., Roberts, M. S. E., McLaughlin, M. A., et al. 2014, ApJ, 783, 69
- Gordon et al. (2016) Gordon, K. D., Fouesneau, M., Arab, H., et al. 2016, ApJ, 826, 104
- Harrison et al. (2015) Harrison, F. A., Aird, J., Civano, F., et al. 2015, ArXiv e-prints, arXiv:1511.04183
- Hickox et al. (2004) Hickox, R. C., Narayan, R., & Kallman, T. R. 2004, ApJ, 614, 881
- Hinkle et al. (2006) Hinkle, K. H., Fekel, F. C., Joyce, R. R., et al. 2006, ApJ, 641, 479
- Hofmann et al. (2013) Hofmann, F., Pietsch, W., Henze, M., et al. 2013, A&A, 555, A65
- Hughes (1994) Hughes, J. P. 1994, ApJL, 427, L25
- Hung et al. (2010) Hung, L.-W., Hickox, R. C., Boroson, B. S., & Vrtilek, S. D. 2010, ApJ, 720, 1202
- Israel et al. (2016) Israel, G. L., Belfiore, A., Stella, L., et al. 2016, ArXiv e-prints, arXiv:1609.07375
- Israel et al. (2017) Israel, G. L., Papitto, A., Esposito, P., et al. 2017, MNRAS, 466, L48
- Kaaret (2002) Kaaret, P. 2002, ApJ, 578, 114
- Kong et al. (2002) Kong, A. K. H., Garcia, M. R., Primini, F. A., et al. 2002, ApJ, 577, 738
- Lansbury et al. (2015) Lansbury, G. B., Gandhi, P., Alexander, D. M., et al. 2015, ApJ, 809, 115
- Leahy et al. (1983) Leahy, D. A., Darbro, W., Elsner, R. F., et al. 1983, ApJ, 266, 160
- Lehmer et al. (2013) Lehmer, B. D., Wik, D. R., Hornschemeier, A. E., et al. 2013, ApJ, 771, 134
- Lehmer et al. (2015) Lehmer, B. D., Tyler, J. B., Hornschemeier, A. E., et al. 2015, ApJ, 806, 126
- Li et al. (2009) Li, Z., Wang, Q. D., & Wakker, B. P. 2009, MNRAS, 397, 148
- Massey et al. (2006) Massey, P., Olsen, K. A. G., Hodge, P. W., et al. 2006, AJ, 131, 2478
- Mukai et al. (2015) Mukai, K., Rana, V., Bernardini, F., & de Martino, D. 2015, ApJL, 807, L30
- Müller et al. (2013) Müller, S., Ferrigno, C., Kühnel, M., et al. 2013, A&A, 551, A6
- Nagase (2002) Nagase, F. 2002, Journal of Astrophysics and Astronomy, 23, 59
- Neilsen et al. (2004) Neilsen, J., Hickox, R. C., & Vrtilek, S. D. 2004, ApJL, 616, L135
- Pietsch et al. (2005) Pietsch, W., Freyberg, M., & Haberl, F. 2005, A&A, 434, 483
- Pretorius & Mukai (2014) Pretorius, M. L., & Mukai, K. 2014, MNRAS, 442, 2580
- Primini et al. (1993) Primini, F. A., Forman, W., & Jones, C. 1993, ApJ, 410, 615
- Ptak et al. (2015) Ptak, A., Hornschemeier, A., Zezas, A., et al. 2015, ApJ, 800, 104
- Ramsay et al. (2002) Ramsay, G., Zane, S., Jimenez-Garate, M. A., den Herder, J.-W., & Hailey, C. J. 2002, MNRAS, 337, 1185
- Revnivtsev et al. (2014) Revnivtsev, M. G., Sunyaev, R. A., Krivonos, R. A., Tsygankov, S. S., & Molkov, S. V. 2014, Astronomy Letters, 40, 22
- Rosenfield et al. (2012) Rosenfield, P., Johnson, L. C., Girardi, L., et al. 2012, ApJ, 755, 131
- Rubio-Herrera et al. (2013) Rubio-Herrera, E., Stappers, B. W., Hessels, J. W. T., & Braun, R. 2013, MNRAS, 428, 2857
- Saglia et al. (2010) Saglia, R. P., Fabricius, M., Bender, R., et al. 2010, A&A, 509, A61
- Savonije et al. (1986) Savonije, G. J., de Kool, M., & van den Heuvel, E. P. J. 1986, A&A, 155, 51
- Schlafly & Finkbeiner (2011) Schlafly, E. F., & Finkbeiner, D. P. 2011, ApJ, 737, 103
- Stanek & Garnavich (1998) Stanek, K. Z., & Garnavich, P. M. 1998, ApJL, 503, L131
- Stiele et al. (2011) Stiele, H., Pietsch, W., Haberl, F., et al. 2011, A&A, 534, A55
- Supper et al. (2001) Supper, R., Hasinger, G., Lewin, W. H. G., et al. 2001, A&A, 373, 63
- Trinchieri & Fabbiano (1991) Trinchieri, G., & Fabbiano, G. 1991, ApJ, 382, 82
- van Speybroeck et al. (1979) van Speybroeck, L., Epstein, A., Forman, W., et al. 1979, ApJL, 234, L45
- Walton et al. (2013) Walton, D. J., Fuerst, F., Harrison, F., et al. 2013, ApJ, 779, 148
- Walton et al. (2014) Walton, D. J., Harrison, F. A., Grefenstette, B. W., et al. 2014, ApJ, 793, 21
- Wik et al. (2014a) Wik, D. R., Hornstrup, A., Molendi, S., et al. 2014a, ApJ, 792, 48
- Wik et al. (2014b) Wik, D. R., Lehmer, B. D., Hornschemeier, A. E., et al. 2014b, ApJ, 797, 79
- Williams et al. (2014) Williams, B. F., Lang, D., Dalcanton, J. J., et al. 2014, ApJS, 215, 9
- Yukita et al. (2016) Yukita, M., Hornschemeier, A. E., Lehmer, B. D., et al. 2016, ApJ, 824, 107