Chandra spectroscopy of Rapid Burster type-I X-ray bursts
Abstract:
We observed the Rapid Burster with Chandra when it was in the ’banana’ state that usually precedes the type-II X-ray bursting ’island’ state for which the source is particularly known. We employed the High-Energy Transmission Grating Spectrometer in combination with the ACIS-S detector in continuous clocking mode. The observation yielded 20 thermonuclear type-I X-ray bursts emitted from the neutron star surface with recurrence times between 0.9 and 1.2 hr, and an e-folding decay time scale of 1 min. We searched for narrow spectral features in the burst emission that could constrain the composition of the ashes of the nuclear burning and the compactness of the neutron star, but found none. The upper limit on the equivalent width of narrow absorption lines between 2 and 6 keV is between 5 and 20 eV (single trial 3 confidence level) and on those of absorption edges between 150 and 400 eV. The latter numbers are comparable to the levels predicted by Weinberg, Bildsten & Schatz [1] for Eddington-limited thermonuclear bursts.
1 Introduction
An important question in (astro)physics concerns the behavior of matter at supranuclear densities and low temperatures such as in neutron stars. Due to the mathematical difficulty in describing multi-particle interactions under such circumstances, there is no unambiguous prediction and one needs to resort to observation and experiment. Macroscopically, one describes the behavior of matter by the equation of state (EOS). That, on its turn, prescribes the relationship between the mass and radius of neutron stars. Therefore, if one were able to measure mass and radius of a set of neutron stars, one would be able to infer the sought-after EOS (e.g., [2, 3]). This is one of the fundamental pursuits in astrophysics. One of the roads where this pursuit takes place [4] is that of type-I X-ray bursts. These are thermonuclear shell flashes on H/He-accreting neutron stars in low-mass X-ray binaries (LMXBs). Such a flash results for min in a luminous signal from the neutron star in 1-10 keV X-rays. If one were in the position to detect identifiable narrow spectral features in the flash emission, one could obtain, through the gravitational redshift, constraints on both mass and radius. The detection probability is improved if the neutron star is slowly spinning, thus avoiding Doppler smearing of narrow spectral features.
The Rapid Burster, or MXB 1730-335 [5, 6], is a puzzling LMXB. It earned its nickname because of its unique exhibition of bright quickly repetitive so-called type-II X-ray bursts that have different time profiles and spectra than type-I bursts and are thought to be due to an accretion instability. The Rapid Burster is a transient X-ray source in the globular cluster Liller 1 (distance 8.1 kpc; cm-2; [7]) that goes into outburst about every half a year for about one month [8, 9]. It is the only LMXB that exhibits both type-II and type-I X-ray bursts.
Bagnoli et al. [10, 11, 12, 13] made a comprehensive study of the large Rapid Burster data set (total observation time close to 2.4 Ms) provided by observation with the high-throughput Proportional Counter Array on the Rossi X-ray Timing Explorer during its 16 years of operation. They found the following features (see also [14]): 1) it is an Atoll source (for a definition, see [15]); 2) there is a clear division in behavior between the two Atoll states: the island and banana state; 3) it exhibits the quickly repetitive type-II X-ray bursts in the island state; 4) it acts as an ordinary LMXB without type-II bursts in the banana state; 5) it exhibits peculiar behavior in the transition between the two states with strong few-Hz quasi-periodic oscillations, dipped type-I X-ray bursts and very long (up to 103 s) type-II bursts; 6) it sometimes exhibits types of variability (’heartbeat’ and ’theta’) that is otherwise only seen in the peculiar black-hole LMXBs GRS 1915+105 and IGR J17091-3624; 7) the behavior of the type-I bursts suggests that the neutron star in MXB 1730-335 is slowly spinning, with a spin period of maybe about 1 s [10], in contrast to most other LMXBs where neutron stars spin at hundreds of Hz [16].

The transition state is particularly interesting because it represents the onset of the peculiar long type-II bursts. It was recently investigated through a dedicated simultaneous observation in 2015 with Swift, XMM-Newton and NuSTAR [17]. It was inferred from a broad Fe-K emission line that the accretion disk was truncated at 42 gravitational radii, almost 100 km away from a canonical neutron star. This conclusion is in line with the hypothesis that the type-II bursts are due to magnetic gating of the accretion flow through that inner edge [18].
The banana state, when the Rapid Burster is expected to exhibit frequent type-I bursts because the accretion rate is high, was thus far not covered by an observation with a high spectral resolution. Therefore, we applied for and received a Chandra target-of-opportunity observation of the Rapid Burster while it was in the banana state. Here, we report our findings from that observation. The aim was to detect as many type-I bursts as possible and investigate their spectrum for the occurrence of absorption lines and edges as a possible probe of the ashes of thermonuclear burning and of the compactness of the neutron star through a measurement of the gravitational redshift (e.g., [19]).
2 Observation

We started an observation campaign targeted on the outburst expected in the spring of 2015. Since the MAXI all-sky monitor onboard the ISS [20] is not able to distinguish clearly between the flux from the Rapid Burster and the 0.5 deg distant ’Slow Burster’ 4U 1728-34, we resorted to an observation campaign with the X-ray telescope XRT onboard Swift [21]. This campaign started on April 16, 2015. The observations occurred every 3 days and lasted each about 500 s. All but one were carried out in the Windowed Timing Mode of the XRT; the exception was in the Photon Counting Mode. The resulting light curve is shown in Fig. 1. It took more than one month before the start of the banana outburst could be unambiguously identified, on May 20 2015 10:02 UT. There is a small precursor outburst peaking two weeks before that. As most outbursts start with high luminosities and the banana state, it was crucial to schedule a follow-up observation quickly. As soon as the XRT flux reached 14 c/s on May 21 00:39 UTC, a Chandra observation was requested and granted.
The Chandra ([22]) observation started 1.31 d later, on May 22, 2015, at 15:14:10 UTC (MJD 57164.63472) and ended on May 23 at 14:06:53 UTC. The exposure time is 80.19 ks. Thanks to the prompt response, the Rapid Burster was caught while still in the banana state and before the onset of the island state with the type-II bursts that started five days later (c.f., Fig. 1). The High-Energy Transmission Grating Spectrometer (HETGS; [23]) was positioned into the telescope beam and ACIS-S ([24]) employed as focal plane detector, enabling high-resolution spectroscopy between 0.7 and 10 keV, although the high and high background precluded the usefulness of data below 1.5 keV. ACIS-S was employed in the continuous clocking (CC) mode because of the high fluxes expected from the Rapid Burster.
3 Light curve analysis
The light curve of all Chandra-detected photons is shown in Fig. 2. 20 type-I X-ray bursts were detected, in the longest continuous data set with that many type-I bursts from the Rapid Burster. The bursts occur frequently, as compared to other prolific bursters, and regularly at intervals ranging between 4215 s (for the first pair of bursts) and 3337 s (for the last pair) which is a change by a factor of 1.26. This matches well the general trend of an increasing non-burst flux level which increases by about a factor of 16 c s-1/13 c s-1=1.23, suggesting the non-burst flux to be an accurate representation of the accretion rate.

Figure 3 shows the average light curve of all bursts combined. Burst emission is clearly visible for about 180 s. As typical for type-I bursts from the Rapid Burster [10, 12], the profile has a flat top of 8-10 s and a hump feature in the decay between 30 and 120 s from the burst onset. We fitted an exponential function to the decay part of the light curve up to 300 s after and from 50 to 20 s before the onset, and find an e-folding decay time of s (). A power law function fits the data better, provided a Gaussian contribution is included to allow for the hump. The power law decay index is (). The Gaussian component contains % of all burst photons. The characteristic time scale of the burst, as determined by dividing the count fluence by the peak flux, is 46 s.
The hump arises probably from rapid proton capture (rp) burning in a H-rich environment. Protons are captured by a wide range of isotopes, followed by beta decay [25]. The latter is a decay process which for some isotopes has a relatively long time scale of tens of seconds, giving rise to the hump feature. The strength of the rp component is quite similar to that seen in the well-studied bursts from GS 1826-24 (e.g., [26]).
4 Spectral analysis
4.1 Methodology
We employed ciao version 4.9, CALDB version 4.7.2 (for details of HETGS calibration, see [27]) and xspec version 12.9 for our data analysis. In particular we employed the standard routines chandra_repro to reprocess the event file, tg_extract to extract for both MEG and HEG all six orders for any particular time stretch, mktgresp to generate (ancillary) response files and combine_grating_spectra to generate combined spectra for all plus and minus orders. In all spectral models, we applied absorption by the interstellar medium according to the model by [28] (model tbabs in xspec with abundances fixed). Although we here report only on spectra that are sums of negative and positive grating orders, we have inspected the orders separately but found no additional insight from that. We inspected all non-binned data for narrow spectral features, and as well 2x, 4x and 8x binned data.
On the basis of the light curve at 0.1 s resolution, we divided the 80.19 ks Chandra observation into 20 burst and 21 non-burst periods. Each burst period is 180 s (see folded burst light curve in Fig. 3). This leaves a total non-burst exposure time of 76.6 ks.
4.2 Non-burst spectrum
The non-burst spectrum has a photon count rate of 11.5 c s-1 in all first orders of both HEG and MEG, 0.06 c s-1 in the second and 1.0 c s-1 in the third orders. We therefore only studied first-order data. An absorbed power law does not fit the data well (=1.967 for ), but neither does an absorbed Comptonized spectrum plus (disk) black body. The spectra are not consistent between the MEG and HEG with uncorrelated deviations between the data of both instruments of up to about 10%. The systematic deviations between the data of HEG and MEG and the high value are attributed to issues with the handling of CC data (see Chandra memo by N. Schultz111http://asc.harvard.edu/cal/Acis/ccmode/ccmode_final_doc03.pdf). A systematic uncertainty of 5.5% per channel improves to an acceptable value (i.e., with a chance probability of 1%), with a photon index of and cm-2. is 1.3 times larger than the optical value (see Sect. 1) and 1.3 times smaller than inferred in [17]. This value is dependent on the continuum model at low energies which is ill determined for the Rapid Burster. The 1.5-7.0 keV flux is erg s-1cm-2. If we employ a Comptonized spectrum to better approximate the bolometric flux, we find an 1-30 keV unabsorbed flux of erg s-1cm-2. For the distance of kpc, this translates to % of the erg s-1 Eddington limit for a H-rich atmosphere. This is still 3 times lower than peak value of erg s-1cm-2 observed with RXTE [13].
We also tested the model employed on 1-30 keV XMM-Newton+NuSTAR data by [17], consisting of a combination of a Comptonized component, a (disk) black body, a narrow Fe-K line and a reflection component. We find an equally good agreement with the 1.5-7 keV Chandra data as the above-mentioned simpler models when we leave free the normalizations of all component and , with the Comptonized component converging to a 3 times larger value, the black body component 1.5 times larger, the reflection component 11 times smaller and cm-2. The narrow Fe-K line becomes insignificant. The unabsorbed 1-30 keV flux for this model is erg s-1cm-2 which is 1.9 times smaller than based on the above-mentioned model which testifies to an uncertainty of 50% in extrapolating from 1.5-7 to 1-30 keV. The absorbed 1.5-7 keV flux of the Chandra observation is 1.5 times larger than that of the XMM-Newton/NuSTAR observation.
There is a feature at 2.4 keV which coincides with the S K-edge that is also present in the model for the interstellar absorption. The measured edge is deeper than expected for the fitted value of . If we leave free the S abundance and , we find the S abundance to be times overabundant with respect to solar and cm-2.
We do not find other narrow spectral absorption features that are consistent between HEG and MEG. The 3 upper limit on the equivalent width for a narrow line at 6 keV (i.e., narrower than a few eV) is 3 eV and on an absorption edge at 6 keV 60 eV. For keV these upper limits are 1 eV and 30 eV, respectively. We can marginally improve on the fit beyond 6 keV if we include either an absorption edge at keV ( and from 1.050 to 1.029 with from 4105 to 4103) or a relativistically broadened Fe-K line [29] at keV (with a line strength of phot s cm-2, with ).
4.3 Burst spectrum

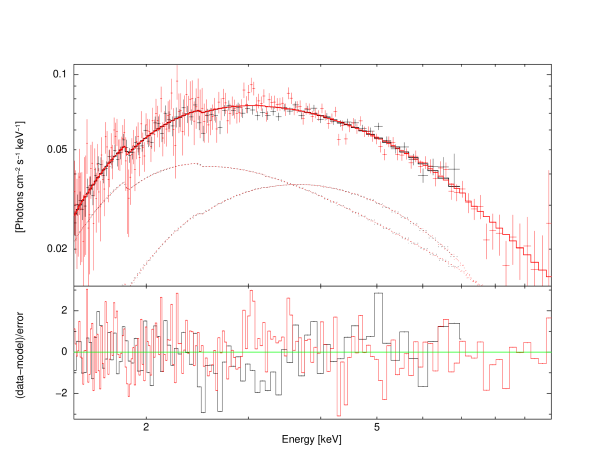
We extracted data for the initial 150 s of all bursts (exposure time 3000 s). The average count rate of all these data is 5.8 c s-1 above the non-burst level. We applied a continuum model consisting of the fixed non-burst spectrum discussed above and a black body component, both absorbed by the same amount of . We obtained an excellent continuum fit with a black body model temperature of k keV (=0.885 for ), see Fig. 4. No significant narrow spectral features were observed; neither were they in spectra of complete individual bursts. It should be mentioned that we, again, found the S K-edge at 2.4 keV to be deeper than expected for the used value of , by the same amount as for the non-burst spectrum. Since we found the same to be true for the non-burst spectrum, this edge is not directly attributable to burst ashes.
Since there are no unambiguous detections of narrow spectral features in the burst emission, we present in Fig. 5 the upper limits. For a line that is Doppler broadened by a spin of 400 Hz [30], the upper limits on the line strength are 5 times larger. For spectra of only the peak (180 s exposure time; 25.7 c s-1 above the non-burst level) and the initial phase of the decay we neither find narrow spectral features with upper limits that are three times worse for both the peak and decay spectrum. We find a peak bolometric flux of erg s-1cm-2 which is consistent with earlier studies of type-I bursts from the Rapid Burster [10]. The peak temperature is keV. For a distance of 8.1 kpc, the emission area radius is km and the peak luminosity erg s-1. The bursts do not reach the Eddington limit of erg s-1 for a canonical 1.4 M⊙ neutron star with a H-rich atmosphere.
5 Discussion
Weinberg et al. [1] modeled the composition of the neutron star photosphere in a type-I burst and predict that convection can dredge up nuclear ashes into the photosphere when the nuclear luminosity reaches the Eddington limit. Also, this cleans up the atmosphere from H and He. The result can be that strong absorption edges are imprinted into the burst spectrum. [1] calculate that photoionization edges of 60Zn, 28Si and 32S can reach equivalent widths of up to 300 eV or even 900 eV for 32S. The bursts that we investigate here do not reach the Eddington limit though, so the predictions by [1] can be considered upper limits to the situation for the Rapid Burster.
The upper limits that we find for the absorption edges are of the same order of magnitude as the predictions by [1] for three elements. Given the above-mentioned argument about the bursts not being Eddington limited, it is not unexpected that we do not detect absorption edges.
Models for absorption lines from enriched neutron star atmospheres, including radiation transfer calculations, convection and nuclear enrichment, are not found in the literature. Therefore, it is not possible to make comparisons with sensible predictions and we put forward the measured upper limits as constraints for future models.
One may wonder why it was worth doing this observation if the predictions were close to the detection sensitivity. The Rapid Burster may be the only neutron star spinning slowly and whose type-I bursts can fairly easy (i.e., with a moderate amount of exposure time) be measured with a spectrometer. Given the importance of the question about the EOS and the lack of an unambiguous detection of narrow spectral features sofar, this observation was considered worth the risk.
6 Conclusion
We successfully acquired, through a carefully planned observation campaign, a Chandra high-resolution grating spectrum of the Rapid Burster while it was in the banana state. The Chandra observation yielded 20 type-I X-ray bursts which was the goal of this observation. The motivation of the observation was to search for narrow spectrum features in the burst emission. None were found. This implies a stringent upper limit on such features for the non-burst data of about 10 eV in equivalent width. The upper limit for absorption edges are of the same order of magnitude as previously obtained for SAX J1808.4-3658 (e.g., [31]). It should be noted that that neutron star has a fast spin rate. The upper limits for an absorption edge are of the same order as the predictions by [1] and, thus, do not unambiguously constrain that model.
The observations obtained so far with Chandra and XMM-Newton have not been successful in finding unambiguously narrow spectral features in the emission of bright or many combined normal type-I bursts. The only alternative remaining with these instruments concerns the rare intermediate duration bursts with superexpansion [32] and superbursts [33] for which such features are already strongly suggested to exist from low spectral-resolution data (e.g., [32, 34]).
Acknowledgments. We thank the Swift and Chandra teams for their support in making the observation campaign a success. TB, DG and AW thank the International Space Science Institute in Bern, Switzerland, for hosting International Teams on X-ray bursts. We thank Jakob van den Eijnden for providing the model for the XMM-Newton/NuSTAR spectrum in a machine readable form.
References
- [1] N. N. Weinberg, L. Bildsten and H. Schatz, 2006, ApJ, 639, 1018–1032
- [2] J. M. Lattimer and M. Prakash, 2007, PhysRev 442, 109–165
- [3] A. L. Watts, N. Andersson, D. Chakrabarty, M. Feroci, K. Hebeler, G. Israel et al., 2016, Reviews of Modern Physics, 88, 021001
- [4] F. Paerels, M. Méndez, M. Agueros, M. Baring, D. Barret, S. Bhattacharyya et al., 2009, in astro2010: The Astronomy and Astrophysics Decadal Survey, vol. 2010 of Astronomy
- [5] W. Lewin, J. Doty, G. Clark, S. Rappaport, H. Bradt, R. Doxsey et al., 1976, ApJ, 207, L95–L99
- [6] W. H. G. Lewin, J. van Paradijs and R. E. Taam, 1993, Space Science Reviews, 62, 223
- [7] S. Saracino, E. Dalessandro, F. R. Ferraro, B. Lanzoni, D. Geisler, F. Mauro et al., 2015 ApJ, 806, 152
- [8] N. Masetti, 2002, å, 381, L45–L48
- [9] V. Simon, 2008, å, 492, 135–143
- [10] T. Bagnoli, J. J. M. in ’t Zand, D. K. Galloway and A. L. Watts, 2013, MNRAS, 431, 1947–1955
- [11] T. Bagnoli, J. J. M. in ’t Zand, A. Patruno and A. L. Watts, 2014, MNRAS, 437, 2790–2801
- [12] T. Bagnoli, J. J. M. in’t Zand, C. R. D’Angelo and D. K. Galloway, 2015, MNRAS, 449, 268–287
- [13] T. Bagnoli and J. J. M. in’t Zand, 2015, MNRAS 450, L52–L56
- [14] R. Guerriero, D. W. Fox, J. Kommers, W. H. G. Lewin, R. Rutledge, C. B. Moore et al., 1999, MNRAS, 307, 179–189
- [15] G. Hasinger and M. van der Klis, 1989, å, 225, 79–96
- [16] A. Patruno and A. L. Watts, 2012, arxiv.org:1206.2727
- [17] J. van den Eijnden, T. Bagnoli, N. Degenaar, A. M. Lohfink, M. L. Parker, J. J. M. in ’t Zand, A.C. Fabian, 2017, MNRAS, 466, L98-102
- [18] C. R. D’Angelo and H. C. Spruit, 2012, MNRAS, 420, 416–429
- [19] J. Cottam, F. Paerels and M. Mendez, 2002, Nat, 420, 51–54
- [20] M. Matsuoka, K. Kawasaki, S. Ueno, H. Tomida, M. Kohama, M. Suzuki et al., 2009, PASJ, 61, 999
- [21] N. Gehrels, G. Chincarini, P. Giommi, K. O. Mason, J. A. Nousek, A. A. Wells et al., 2004, ApJ, 611, 1005–1020
- [22] M. C. Weisskopf, B. Brinkman, C. Canizares, G. Garmire, S. Murray and L. P. Van Speybroeck, 2002, PASP, 114, 1–24
- [23] C. R. Canizares, J. E. Davis, D. Dewey, K. A. Flanagan, E. B. Galton, D. P. Huenemoerder et al., 2005, PASP, 117, 1144–1171
- [24] G. P. Garmire, M. W. Bautz, P. G. Ford, J. A. Nousek and G. R. Ricker, Jr., 2003, in X-Ray and Gamma-Ray Telescopes and Instruments for Astronomy. (J. E. Truemper and H. D. Tananbaum, eds.), vol. 4851 of Proc. SPIE, pp. 28–44
- [25] R. K. Wallace and S. E. Woosley, 1981, ApJs, 45, 389–420
- [26] D. K. Galloway, A. Cumming, E. Kuulkers, L. Bildsten, D. Chakrabarty and R. E. Rothschild, 2004, ApJ, 601, 466–473
- [27] H. L. Marshall, 2012, in Space Telescopes and Instrumentation 2012: Ultraviolet to Gamma Ray, vol. 8443 of Proc. SPIE, p. 844348
- [28] J. Wilms, A. Allen and R. McCray, 2000, ApJ, 542, 914–924
- [29] A. Laor, 1991, ApJ, 376, 90–94
- [30] M. Bauböck, D. Psaltis and F. Özel, 2013, ApJ, 766, 87
- [31] J. J. M. in ’t Zand, D. K. Galloway, H. L. Marshall, D. R. Ballantyne, P. G. Jonker, F. B. S. Paerels et al., 2013, A&A 553 A83
- [32] J. J. M. in ’t Zand and N. N. Weinberg, 2010, å, 520, A81
- [33] L. Keek and J. J. M. in ’t Zand, 2008, in Proceedings of the 7th INTEGRAL Workshop, Proc. of Sc., arxiv.org:0811.4574
- [34] J. J. E. Kajava, J. Nättilä, J. Poutanen, A. Cumming, V. Suleimanov and E. Kuulkers, 2017, MNRAS, 464, L6–L10