Luminous Infrared Galaxies with the Submillimeter Array V: Molecular Gas in Intermediate to Late-Stage Mergers
Abstract
We present new high-resolution ALMA (13CO =10 and = 2-1) and CARMA (12CO and 13CO =10) observations of two Luminous Infrared Galaxies (LIRGs): Arp 55 and NGC 2623. The new data are complementary to published and archival Submillimeter Array observations of 12CO =21 and =3–2. We perform a Bayesian likelihood non-local thermodynamic equilibrium analysis to constrain the molecular gas physical conditions such as temperature, column and volume densities and the [12CO]/[13CO] abundance ratio. For Arp 55, an early/intermediate staged merger, the line measurements are consistent with cold ( 10-20 K), dense ( 103.5 cm-3) molecular gas. For NGC 2623, the molecular gas is warmer ( 110 K) and less dense ( 102.7 cm-3). Since Arp 55 is an early/intermediate stage merger while NGC 2623 is a merger remnant, the difference in physical conditions may be an indicator of merger stage. Comparing the temperature and volume density of several LIRGs shows that the molecular gas, averaged over kiloparsec scale, of advanced mergers is in general warmer and less dense than early/intermediate stage mergers. We also find that the [12CO]/[13CO] abundance ratio of NGC 2623 is unusually high (250) when compared to the Milky Way; however, it follows a trend seen with other LIRGs in literature. This high [12CO]/[13CO] value is very likely due to stellar nucleosynthesis enrichment of the interstellar medium. On the other hand, Arp 55 has a more Galactic [12CO]/[13CO] value with the most probable [12CO]/[13CO] value being 20-30. We measure the CO-to-H2 conversion factor, , to be 0.1 and 0.7 (3 10-4/) (K km s-1 pc2)-1 for Arp 55 and NGC 2623, respectively. Since Arp 55 is an early/intermediate , this suggests that the transition from a Galactic conversion factor to a LIRG value happens at an even earlier merger stage.
1 Introduction
Galaxy mergers are an important process in the evolution of galaxies, as shown by the observed increase in merger rate in the early universe (e.g. Bridge et al., 2010). The gravitational interactions between the galaxies significantly alter the morphology, luminosity, colour, size, star formation rate, and mass distribution in a relatively short period of time. In particular, the molecular gas, which fuels the current and future star formation, begins in a structured morphology in the progenitor galaxies (assuming disk galaxies as the progenitors see M51 for an example; Pety et al., 2013; Schinnerer et al., 2013). During the merger event, the gas is driven towards the inner few kiloparsec regions triggering an intense starburst and/or feeding a supermassive black hole (e.g. Hopkins et al., 2006). The “classical” scenario for the merger process leads to the formation of an elliptical galaxy (Toomre, 1977); however, there is observational evidence that mergers can reemerge as disk galaxies (e.g. Ueda et al., 2014). Nevertheless, the merger process is still not well understood. We still do not have a physical connection between the merger process and star formation and in particular, the timescales and processes controlling star formation in mergers. High-resolution observational studies of Ultra/Luminous Infrared Galaxies (U/LIRGs) at different stages of the merger are needed to further our knowledge of what happens to the molecular gas during the merger.
An approach to understanding the physical conditions of the molecular gas during the merger process is to use a radiative transfer method. This method requires multiple transitions of molecular lines which were difficult to obtain a decade ago. Several starburst galaxies observed with Herschel’s Fourier Transform Spectrometer (FTS), which could observe several 12CO transitions simultaneously, were modelled using a non-local thermodynamic equilibrium (non-LTE) method (e.g. Panuzzo et al., 2010; Rangwala et al., 2011; Kamenetzky et al., 2012, 2014; Schirm et al., 2014; Tunnard et al., 2015). The FTS spectral line energy distributions (SLEDs) of the modeled starbursts are consistent with a two-component molecular ISM: cold, moderately dense gas and a hot, very dense gas. The high- transitions ( 4-3) are important to constrain the hot molecular gas component properties, lines that are difficult to obtain from the ground with only a few local galaxies observed in such transitions (e.g. Sliwa et al., 2013; García-Burillo et al., 2014; Xu et al., 2014, 2015; Rangwala et al., 2015; Krips et al., 2016; Aalto et al., 2017). Modeling the molecular gas at higher resolution has been difficult with only a few starbursts analyzed (e.g. Matsushita et al. 2009; Sliwa et al. 2012, 2013, 2014; Saito et al. 2017; Sliwa Downes submitted) due in part to the lack of high-resolution observations of optically thin tracers such as 13CO. However, with the Atacama Large Millimeter/submillimeter Array (ALMA) and the Northern Extended Millimeter Array (NOEMA; formerly the Plateau de Bure Interferometer), observations of such weakly emitting tracers have become routine. Eventually with ALMA, the higher CO transitions will be observed and we will start to probe the hot molecular gas components that Herschel has observed.
In this paper, we present new high-resolution ALMA (13CO =10 and =2-1) and Combined Array for Research in Millimeter-wave Astronomy (CARMA; 12CO and 13CO =10) observations for two LIRGs: Arp 55 and NGC 2623. These LIRGs are at very different merger stages and offer snapshots at how the molecular gas evolves over the merger process. The new observations complement existing Submillimeter Array (SMA) data and we use the measured line intensities to perform a non-LTE analysis to determine the molecular gas physical conditions on 1 kpc scales. The paper is organized as follows: In Section 2, we present the targets and describe the observations, data reduction and short spacings details. In Section 3, we describe the new 12CO =10 observations from CARMA, where we detect new features, compared to the previously published maps. In Section 4, we present the non-LTE modeling and results. In Section 5, we discuss the results of the non-LTE modeling such as the [12CO]/[13CO] abundance ratio, the 12CO =10 luminosity to mass conversion factor () and the evolution of the molecular gas as a function of merger stage on kiloparsec scales. In Appendix A, we present the various integrated brightness temperature line ratio maps. In Appendix B, we present the velocity field and dispersion ( = FWHM/2) maps from the CARMA observations.
2 Observations
In the sections below, we present the targets and then describe the observations in detail. Table 1 summaries the properties of the observations. Table 2 presents the measured line fluxes for each LIRG and the molecular gas mass measured from the 12CO =10 line assuming a standard U/LIRG conversion factor of 0.8 (K km s-1 pc2)-1 (Downes & Solomon, 1998).
2.1 The Targets
Arp 55 (catalog ) (UGC 4881, VV 115, IRAS 09126+4432) is one of the least studied LIRGs ( = 4.0 1011 ; Sanders et al. 2003) in the sample of Wilson et al. (2008) (Paper I). The system consists of two nuclei separated by 11′′ (9.3 kpc at = 175 Mpc; 1′′ = 850 pc). A tidal tail is seen in the optical extending from the north-eastern galaxy that is also visible in H (Hattori et al., 2004). Four H emission sources are detected in the tail. The south-western galaxy has compact H emission with a slight extension in the north-south direction. Vardoulaki et al. (2015), using Very Large Array (VLA) radio continuum, classify the north-eastern nucleus as a composite AGN/starburst system and the south-western nucleus as a radio-AGN. The stellar mass, determined from photometry, is 7 1010 (U et al., 2012). The total star formation rate is 60 yr-1 (U et al., 2012) determined using UV and infrared emission. Interferometric observations of 12CO =10 revealed molecular gas in the region containing the two nuclei (Sanders et al., 1988).
NGC 2623 (catalog ) (Arp 243, VV 79, IRAS 08354+2555) is an advanced merger LIRG ( = 3.0 1011 ; Sanders et al. 2003) at a distance of 83 Mpc (1″ = 402 pc). Privon et al. (2013) show via numerical simulations that NGC 2623 is a merger remnant with the two nuclei coalescing roughly 80 Myrs ago. The system has two prominent tidal tails that extend 20–25′′ to the northeast and southwest (Evans et al., 2008). X-ray observations show evidence of a Compton-thick AGN (Maiolino et al., 2003). Imanishi et al. (2009) and Privon et al. (2015) showed that the HCN/HCO+ =1–0 line ratio is above 1, consistent with a system that contains an AGN; however, we do note that the HCN/HCO+ diagnostic is still under debate as starburst and composite systems may have ratios similar to AGN systems (see Privon et al., 2015). The total star formation rate is measured to be 42 yr-1 (U et al., 2012) with a stellar mass of 5.5 1010 (González Delgado et al., 2014). Near and mid-infrared observations reveal a compact nucleus (Scoville et al., 2000; Soifer et al., 2001). Some of the first high-resolution 12CO =10 observations also showed a compact nucleus (Bryant & Scoville, 1999).
| Source | Emission | Observatory | LAS aaThe largest angular scale is recovered determined by the shortest projected baseline: 0.6/dmin | rms | Channel Width | Beam bbThe resolution used for the analysis is bolded. For NGC 2623, we use a compromise angular resolution of 2.5′′. |
|---|---|---|---|---|---|---|
| (arcsec) | (mJy beam-1) | (km s-1) | (arcsec) | |||
| Arp 55 | 12CO =10 | CARMA | 41.8 | 3.0 | 20 | 1.8 1.7 |
| 12CO =21 | SMA | 12 | 12.6 | 30 | 1.0 0.8 | |
| 12CO =32 | SMA | 4.1 | 29 | 25 | 0.9 0.8 | |
| 13CO =10 | CARMA | 43.8 | 1.1 | 100 | 1.7 1.6 | |
| 13CO =21 | SMA | 12.5 | 8.1 | 50 | 3.9 2.5 | |
| 3mm | CARMA | 41.8 | 0.18 | – | 2.6 2.3 | |
| NGC 2623 | 12CO =10 | CARMA | 27.3 | 4.6 | 20 | 2.5 1.7 |
| 12CO =21 | SMA | 11.7 | 21.1 | 20 | 2.1 1.7 | |
| 12CO =32 | SMA | 9.9 | 13.6 | 20 | 2.2 2.0 | |
| 13CO =10 | ALMA | 28.6 | 0.43 | 30 | 2.4 1.9 | |
| 13CO =21 | ALMA | 14.3 | 1.1 | 40 | 3.4 1.4 | |
| 3mm | CARMA | 28.6 | 0.23 | – | 2.9 2.2 |
2.2 ALMA
ALMA observations towards NGC 2623 were conducted during Cycle 2 (Project ID= 2015.1.00804.S; PI: K.Sliwa). The receiver Bands 3 and 6 were tuned to 13CO =10 and = 2-1, respectively. Each observation consisted of four spectral windows with a bandwidth of 1.875 GHz and 960 channels each. The Band 3 data were calibrated using the CASA (McMullin et al., 2007) ALMA pipeline (v4.5.3) and the calibration solutions were checked for any obvious problems. The observations used J0854+2006 as the flux and bandpass calibrators and J0837+2454 as the gain calibrator. The Band 6 observations were manually calibrated using CASA v4.7.0. The data were observed during an array configuration transition and contain baselines up to 6 km; however, the -coverage is poor for the long baselines and we flag all baselines above 200 m after applying the water vapour radiometer and system temperature corrections. The calibration was done in standard fashion using J0854+2006 as the flux and bandpass calibrator and J0830+2410 as the gain calibrator. We estimate a flux calibration uncertainty of 10 and 20 for Bands 3 and 6, respectively.
Each dataset was continuum subtracted in the domain using line-free channels. We image the datasets using CASA v4.7.0 creating datacubes of 30 and 40 km s-1 channel width for 13CO =10 and =2-1, respectively, using a Briggs robust weighting of 0.5. CLEAN boxes were placed around the emission to aid the CLEAN process converge. Integrated intensity maps were created including line emission channels and using a 2 cutoff. Each integrated intensity map was primary beam corrected.
Other lines and continuum present in the ALMA datasets will be discussed in a forthcoming paper (Sliwa et al. in prep.).
2.3 CARMA
Arp 55 was observed in 12CO and 13CO =10 using CARMA in the B, C, and D array
configurations on 15 January 2013, 06 December 2012 and 18 April 2012, respectively.
NGC 2623 was observed in 12CO using CARMA in the C and D array
configurations on 2 April 2012 and 2 May 2012, respectively. We convert the data to
CASA measurement sets for calibration and imaging. We use 3C84 and Mars as
the flux calibrators and 0927+390, 0854+201 and 0920+446 as the gain and bandpass
calibrators. For Mars, we use the ‘Butler-JPL-Horizons 2012’ standard model to compute the flux. Imaging was done in a similar manner to the ALMA observations (see Section 2.2 and Figures 1 and 2).
We combined the LSB and USB line-free spectral windows using a ‘multi-frequency synthesis’ (mfs mode in CASA) approach to image the 2.8 mm continuum. The data were CLEANed down to the 2 level with the help of a clean box around the emission. For Arp 55, we degrade the resolution (see Table 2) to increase the surface brightness sensitivity. We primary-beam corrected the maps (Figure 1, 2) and applied a 2 cutoff to measure the continuum.
We measure the 2.8 mm continuum flux of NGC 2623 and Arp 55 to be 18 4 mJy and 1.9 0.4 mJy, respectively. For Arp 55, the north-eastern nucleus has a flux of 0.8 0.2 mJy and the south-western nucleus has a flux of 1.1 0.2 mJy. See Table 1 for details on the images.
2.4 Submillimeter Array (SMA)
We use the SMA calibrated datasets of 12CO =21 and = 3–2 from Paper I. For
calibration details, see Paper I. Arp 55 was also observed using the very extended (PI: V.
U) and compact (PI: Z. Wang) configurations in 12CO =21. The 13CO =21 line is also observed
simultaneously in the lower sideband. We obtained the raw datasets from the archive
and converted them to CASA measurement sets in order to
calibrate and image the data. Calibration was done using the standard method using
Callisto as the flux calibrator and 0927+390, 0920+446, and 3C84 as the gain and
bandpass calibrators. For Callisto, we use the ‘Butler-JPL-Horizons 2012’ standard model to compute the flux.
Imaging was conducted in a similar manner to that of the ALMA and CARMA datasets (see 2.2). We improve the maps of Paper I by including clean boxes around CO emission in each channel. For 12CO =21 in Arp 55, we image each individual dataset and also a combined one; note that Figure 1 displays the combined dataset image. Note that Paper I did not detect 13CO =21 emission from Arp 55 and NGC 2623. However, the compact configuration observation for Arp 55 detected the 13CO =21 line. The combined dataset of Arp 55 resolves out the emission of 13CO =21; therefore, we image only the compact configuration dataset for 13CO =21 (Figure 1).
For measurements of the 880 m and 1.4 mm continuum, see Paper I.
2.5 James Clerk Maxwell Telescope (JCMT) and Short Spacings
For Arp 55, we used the JCMT to map a 56″ 56″ area in 12CO =21 using the RxA3 receiver (PI: K. Sliwa; M12BC14) on 2012 November 26 and 27. A data
cube spanning -585 to 585 km s-1 was created using the Starlink software
(Currie et al., 2008). Baseline subtraction was performed using line-free channels on
both sides of the 12CO =21 line. We bin the datacube to a velocity resolution of 30 km s-1.
The intrinsic unit of antenna temperature () was converted using a main
beam efficiency () of 0.69 to a main beam temperature (
= /). The unit of is converted to Jy using
a scaling factor of 22.9 Jy K-1. We created an integrated intensity map with a 2 cutoff (0.2 Jy/beam). We measured the total flux of 12CO =21 of Arp 55 to be 410 50 Jy km s-1.
The JCMT 12CO =21 flux measured for Arp 55 is consistent with the total flux measured in the SMA map (Table 2); therefore, we have recovered the flux on all spatial scales for Arp 55 in the 12CO =21 map. The largest angular scale (LAS) to which the 12CO =21 observations are sensitive is 12′′ (Table 1). The 12CO =10 observations are sensitive to even larger scales; therefore, we conclude that those observations have also recovered all the flux. The same cannot be said about the 12CO =32 observations which are sensitive up to 4′′ scales. Papadopoulos et al. (2012) measured the 12CO =32 flux in Arp 55 in a JCMT spectrum to be 775 130 Jy km s-1; therefore, we are missing 70 20 of the 12CO =32 flux. For the analysis, we image all Arp 55 maps with baselines above 30.5 k, the shortest baseline in the 12CO =32 observations, which will ensure that we are analysing the molecular gas on similar scales.
For NGC 2623, Paper I determined that the 12CO =32 SMA map, when compared to the JCMT measured flux, recovered all the flux on all scales. The LAS to which the 12CO =32 observations are sensitive is 10′′ (Table 1). Since the LAS of the 12CO, 13CO =10 and 12CO =21 maps are greater than that for the 12CO =32 observations, we conclude that all the flux is recovered in these maps as well.
| Parameter | Arp 55 | Arp 55NE | Arp 55SW | NGC 2623 | Units |
|---|---|---|---|---|---|
| 12CO =10 | 130 ( 3) [ 20] | 80aaIncludes the flux from the tail and blob. ( 3) [ 20] | 50 ( 2) [ 8] | 127 ( 6) [ 19] | Jy km s-1 |
| 12CO =21 | 400 ( 10) [ 80] | 285 ( 7) [ 57] | 115 ( 4) [ 20 | 290 ( 20) [ 58] | Jy km s-1 |
| 12CO =32 | 215 ( 20) [ 43] | 135 ( 10) [ 27] | 80 ( 9) [ 16] | 650 ( 80) [ 130] | Jy km s-1 |
| 13CO =10 | 3.8 ( 0.3) [ 1.1] | 1.35 ( 0.3) [ 0.4] | 2.45 ( 0.3) [ 0.8] | 3.1 ( 0.3) [ 0.3] | Jy km s-1 |
| 13CO =21 | 17 ( 2) [ 5] | 13 ( 2) [ 4] | 4 ( 2) [ 1] | 11.2 ( 1.5) [ 1.7] | Jy km s-1 |
| 9.4 1.9 | 5.8aaIncludes the flux from the tail and blob. 1 | 3.6 0.7 | 2.1 0.4 | 109 K km s-1 pc2 | |
| bb = 0.8, assuming = 0.8 (K km s-1 pc2)-1 (Downes & Solomon, 1998) | 7.5 1.5 | 4.6aaIncludes the flux from the tail and blob. 0.9 | 2.9 0.6 | 1.6 0.1 | 109 |
3 The 12CO Morphology
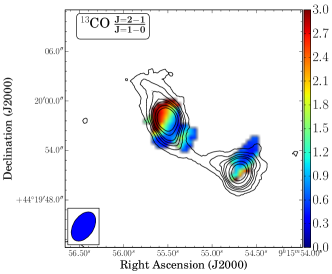
Arp 55 was first observed interferometrically by Sanders et al. (1988) resulting in a 12CO =10 map with a resolution of 9′′ 7′′ and a total flux of 83 Jy km s-1. Our CARMA map has better angular resolution, greater sensitivity and higher total flux recovered. In addition to detecting the two nuclei, we also detect a tail-like feature in the north-eastern galaxy and a blob in the tidal tail (Figure 3). Both regions have active star formation as seen in the H map of Hattori et al. (2004) (Figure 3). The tail and blob have not been detected in 12CO =21, but we believe this to be an issue of sensitivity and not missing flux. Assuming a line ratio of 12CO (2-1)/(1-0) = 1.5 (K units; see Appendix A) for the blob, with the sensitivity of the 12CO =21 map and taking into account the drop off in sensitivity towards the edges of the primary beam, the peak of the blob would be at the 2 level.
The blob has a total flux of 9 Jy km s-1 which translates to a total molecular gas mass of 5.2 ( 108 assuming a conversion factor of 0.8 (K km s-1 pc2)-1 (Downes & Solomon, 1998). While it is unclear whether a U/LIRG-like conversion factor is appropriate for the tidal tail blob, we note that Galactic conversion factor would give a total molecular gas mass 3 109 .
This is an interesting region as it may lead to a tidal dwarf galaxy, a type of small galaxy that forms from material ejected from the disks of colliding spiral galaxies (e.g. Braine et al., 2001, 2000). They are usually found at the ends of long tidal tails, as is the case with Arp 55, and the molecular gas emission peaks near the peak of atomic hydrogen (HI) emission (Braine et al., 2000) suggesting that the molecular gas is formed from the HI. Thomas et al. (2002) observed Arp 55 in HI using the VLA; however, there was no detection over the entire source with a 3 noise-level upper limit to the total HI mass of 8.9 109 assuming a velocity line width of 350 km s-1. A potential tidal dwarf galaxy has also been found in the LIRG VV 114 (Saito et al., 2015).
NGC 2623 was observed in 12CO =10 by Bryant & Scoville (1999) resulting in a map with a resolution of 3.5′′ 2.4′′ with a total flux of 153 Jy km s-1. The flux in our CARMA map is lower than that of Bryant & Scoville (1999); however, we attribute this difference to the calibration uncertainty. The 12CO =10 emission is compact, similar to that of Bryant & Scoville (1999); however, we do detect an off-nuclear concentration of molecular gas (the Glob; Figure 4) to the south-west that is not seen in the map of Bryant & Scoville (1999). We also detect the Glob in the 12CO =32 map, confirming that it is a real feature. The Glob has a flux of 5.2 Jy km s-1 corresponding to a molecular gas mass of 6.9 () 107 . The velocity at the peak position of the Glob is 160 km s-1; using the diameter and dynamical mass of NGC 2623 measured from the CO emission (see Section 5.2 and Table 3), the escape velocity is estimated to be 400 km s-1. This escape velocity indicates that the Glob will not escape the system.
4 Molecular Gas Properties
4.1 Radiative Transfer Modeling
RADEX is a commonly used code that can, as stated in van der Tak et al. (2007), “calculate the intensities of atomic and molecular lines produced in a uniform medium, based on statistical equilibrium calculations involving collisional and radiative processes and including radiation from background sources. Optical depth effects are treated with an escape probability method.” The code can be used to generate model points with the following parameters: kinetic temperature (), column density of a molecular species X per unit line width (NX/V) and volume density of molecular hydrogen (). In combination with a Bayesian likelihood code, we can constrain the most probable set of physical conditions of the molecular gas. We use the code published in Kamenetzky et al. (2014)111https://github.com/jrka/pyradexnest that implements a nested sampling algorithm that focuses on high likelihood regions efficiently constraining the parameters. In addition to the three parameters mentioned above, the flux is permitted to scale uniformly down by an area filling factor ( 1). Please see Kamenetzky et al. (2014) for more details.
To further aid the model fits and prevent unphysical conditions, we implement three priors:
-
1.
The dynamical mass is used as an upper limit to the total mass that can be contained within the beam. This prior helps constrain the column density solution. The dynamical mass is measured using the source diameter deconvolved from the synthesized beam, the full-width half-maximum (FWHM) of the 12CO line profile and assuming a radially decreasing density profile (Wilson & Scoville, 1990, see Table 3).
-
2.
The column length is used to constrain the column and volume densities at the higher and lower end, respectively. We estimate the column length from the deconvolved source diameter, assuming a spherical geometry. While a spherical geometry is likely not correct, this still offers an upper limit to the column length. For Arp 55, since the source does not appear to be edge-on and therefore, the column length is more reminiscent of the disk scale height, we take half of the deconvolved source size because it is very unlikely that the column length is 1.5 kpc.
-
3.
The final prior limit the optical depth, , within the range of [0,100]. The lower limit is due to the fact that carbon monoxide is most likely not a maser ( 0) and the upper limit is recommended by the RADEX documentation.
| Galaxy | Velocity FWHM | Deconvolved Source Diameter | aa = 99V2D(pc) (Wilson & Scoville, 1990) where V is the velocity FWHM and D is the diameter of the region in parsecs. | ,dynbb,dyn = /. is taken from Table 2. For Arp 55NE, we subtract out the luminosity corresponding to the blob. | |
|---|---|---|---|---|---|
| (km s-1) | (arcsec) | (kpc) | (109 ) | ( (K km s-1 pc2)-1) | |
| Arp 55NE | 220 20 | (2.6 0.2) (1.2 0.2) | (2.2 0.2) (1.0 0.2) | 7.2 1.7 | 1.4 0.4 |
| Arp 55SW | 260 20 | (2.0 0.2) (1.3 0.2) | (1.7 0.2) (1.1 0.2) | 9.2 2.1 | 2.6 0.8 |
| NGC 2623 | 290 20 | 1.4 0.1 | 0.56 0.04 | 4.7 0.7 | 2.2 0.5 |
4.1.1 Arp 55
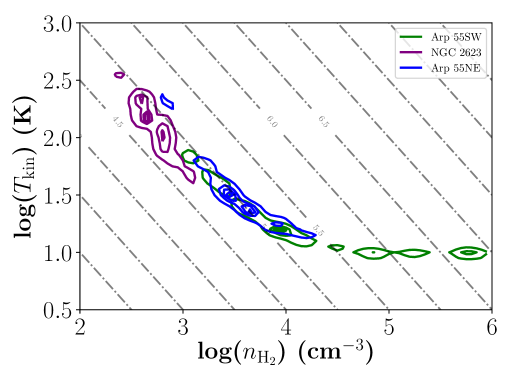
We model all the emission lines (Table 2) from Arp 55 at the 12CO =32 peak intensity position of the two nuclei at the resolution of the 12CO =10 map ( 1.4 kpc). We smooth the angular resolution of the observations using a Gaussian taper during imaging. The native resolution of the 13CO =21 map is coarser than the map of 12CO =10; therefore, we estimate the flux of 13CO =21 at the resolution of 12CO =10 using an average 13CO (2-1/1-0) line ratio of 1.6 (K units; see Appendix A). Using the 13CO line ratio will introduce fewer uncertainties because we assume the two 13CO transitions have similar filling factors. We also implement a 30 uncertainty for 13CO which covers the observed range of 13CO (2-1/1-0) within the regions with 3 detections. Using the 13CO line ratio is appropriate as both 13CO lines likely originate from the same region with similar sizes. The emission from both Arp 55 nuclei is consistent with cold ( 10-20 K), dense ( 10 cm-3) molecular gas (Table 4, Figure 5). The fit is similar to another relatively younger merger, NGC 4038/9 (Schirm et al., 2014). Note we do not model the tidal tail and blob due to the lack of detections of the other emission lines (i.e. 13CO and 12CO =21 and =3-2).
4.1.2 NGC 2623
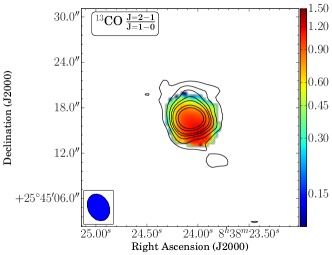
The emission lines from NGC 2623 were modeled at the 12CO =32 peak position at a compromise resolution of 2.5″ ( 1 kpc). As with Arp 55, the 13CO =21 map resolution is too coarse and we estimate the flux at 2.5″ using an average 13CO (2-1/1-0) line ratio of 0.85 (K units; see Appendix A). The emission is consistent with warm ( 110 K), moderately dense ( 103.0 cm-3) molecular gas (Table 4, Figure 5). This best fit has similarities to the fit for Arp 220 on global scales (Rangwala et al., 2011); however, the best fit temperature is twice that for Arp 220.
5 Discussion
5.1 [12CO]/[13CO] Abundance Ratio
Analyses of several local LIRGs and even high redshift starbursts have shown that their [12CO]/[13CO] abundance ratios are unusually high (90; Henkel et al., 2010, 2014; Sliwa et al., 2013, 2014; Papadopoulos et al., 2014; Tunnard et al., 2015) when compared to the Galaxy. In the Galaxy, [12CO]/[13CO] varies radially ranging from 30 near the center to 100 at larger radii (e.g. Langer & Penzias, 1990; Milam et al., 2005). During the merger process, gas is driven towards the nuclear regions and if pristine high [12CO]/[13CO] valued gas is funnelled into the centers, [12CO]/[13CO] can be enhanced in the centers by a factor of 2 (e.g. Casoli et al., 1992; Rupke et al., 2008). This mechanism, if dominant, suggests that the [12CO]/[13CO] value cannot significantly exceed 100. Another mechanism to increase [12CO]/[13CO] is via the enrichment of 12C through stellar nucleosynthesis. The 12C atom is produced in intermediate and high-mass stars via the 3 process that can (for example, with an 8 star) start to enrich the ISM in 107 years. The 13C atom, on the the other hand, is an intermediary product during the CNO cycle that is transformed into 14N; however, a significant amount is lifted to the envelopes of low/intermediate-mass stars during the red giant phase as part of a dredge-up process (Wilson & Matteucci, 1992). This process will start to affect the 13C abundances in the ISM in 109 years. The chemical models of Vigroux et al. (1976) show that the low mass stars start to significantly influence the ISM in 109 years.
NGC 2623 is consistent with this trend with an unusually high [12CO]/[13CO] value ( 250; Table 4). The inflow of pristine gas cannot fully explain this abundance suggesting another mechanism is required such as the stellar nucleosynthesis enrichment. Further testing can be implemented using other isotopologues such as oxygen, where 17O is believed to be produced in low/intermediate mass stars (e.g. Sage et al., 1991; Wilson & Matteucci, 1992) and should be low in abundance while 18O is believed to be mainly produced in massive stars and should be increased in abundance. The simple modeling of Henkel & Mauersberger (1993) show that the abundance ratio of [16O]/[18O] significantly decreases around 5-10 107 Myr after the merger starts. Arp 220 shows an enhanced brightness temperature line ratio of 13CO/C18O 1 (Greve et al., 2009; Matsushita et al., 2009), suggesting an increase in C18O abundance due to stellar nucleosynthesis. We note that normal disk galaxies show 13CO/C18O 6 (Jiménez-Donaire et al., 2017).
Interestingly, Arp 55 does not conform to the trend, with the most probable [12CO]/[13CO] value of 15 – 30, similar to the value at the center of the Galaxy (Langer & Penzias, 1990). Arp 55 is at a relatively earlier merger stage where gas inflow is likely still occurring. The 12CO =10 map shows extended emission (Figure 1) and it may be that not enough of the outer radii high [12CO]/[13CO] valued gas has reached the inner kiloparsec region to drive up the abundance ratio. If such a scenario is plausible, we should see a radial gradient in the abundance ratio; however, higher resolution and more sensitive 13CO observations are required for such an analysis.
Another plausible scenario is fractionation. Carbon isotope exchange is possible via the reaction
| (1) |
as predicted by Watson et al. (1976). The forward reaction dominates in cold environments favoring the formation of 13CO. In hot environments, both the forward and reverse reactions are about equally probable (e.g. Roueff et al., 2015) and will not affect the relative abundance ratio significantly. The RADEX solution suggests that the molecular gas is cold which will favor the conversion of 12CO to 13CO in Arp 55. If this is the dominant mechanism, the [12CO]/[13CO] abundance ratio in Arp 55 is not a good tracer of the carbon isotope ratio, [12C]/[13C] in this system. To test this scenario, other carbon bearing molecular species observations are need such as cyanide (CN; Milam et al., 2005; Henkel et al., 2014).
5.2 CO-to-H2 Conversion Factor:
The factor is important to determine the amount of fuel for star formation in galaxies. Since the first high-resolution observations of LIRGs (e.g. Downes et al., 1993), adopting the Galactic value (4.3 (K km s-1 pc2)-1; see Bolatto et al. 2013 for a review) resulted in molecular gas masses that were equal to or greater than the dynamical masses. Downes & Solomon (1998) found via radiative transfer models that in several LIRGs is on average a factor of 5 lower than the Galactic value, with values ranging from 0.3 to 1.0 (K km s-1 pc2)-1. If the merging galaxies start with a Galactic-like , at some point in the merger process the value will transition into the LIRG value and some young mergers should show intermediate value (i.e. between 1 and 4).
By comparing the 12CO column density (Table 4) with the peak 12CO =10 luminosity we measure for Arp 55NE, Arp 55SW and NGC 2623 to be 0.1, 0.08 and 0.7 (3 10-4/) (K km s-1 pc2)-1, respectively. Surprisingly, Arp 55 shows an enhanced even though it is at an early merger stage; however, the exact merger stage is unknown. It is most likely well after first passage and may be coming in for the second passage. This low value for Arp 55 suggests either that the search for intermediate values must take place in younger mergers near first passage or the transition to LIRG- values is rapid.
The largest uncertainty in these values arises from the assumption of the 12CO abundance relative to H2, = [12CO]/[H2], where we adopt the value of 3 10-4, a value found in warm star forming clouds (e.g Lacy et al., 1994). The value will likely vary from galaxy to galaxy with varying metallicities with literature values ranging from 0.8 - 5 10-4 (e.g. Watson et al., 1985; Frerking et al., 1989; Black et al., 1990; Lacy et al., 1994). We note that Downes & Solomon (1998) assume an value of 8.5 10-5. Future observations of several 12CO and 13CO transitions in giant molecular clouds in different environments are needed to perform a line intensity analysis to measure directly.
We also measure the value using the dynamical mass (Table 3), ,dyn. Since the dynamical mass includes the mass of all matter (i.e. stars, gas, dust, dark matter, etc.), ,dyn is strictly an upper limit to the true value:
| (2) |
The upper limit is still 1.5-3 times lower than the Galactic value. By combining within the analysis resolution and we can also place a lower limit on of 1.2 and 2 10-5 for Arp 55 and NGC 2623, respectively. Our assumption of 3 10-4 is more than an order of magnitude higher than the lower limit.
5.3 Molecular Gas Properties as a Function of Merger Stage
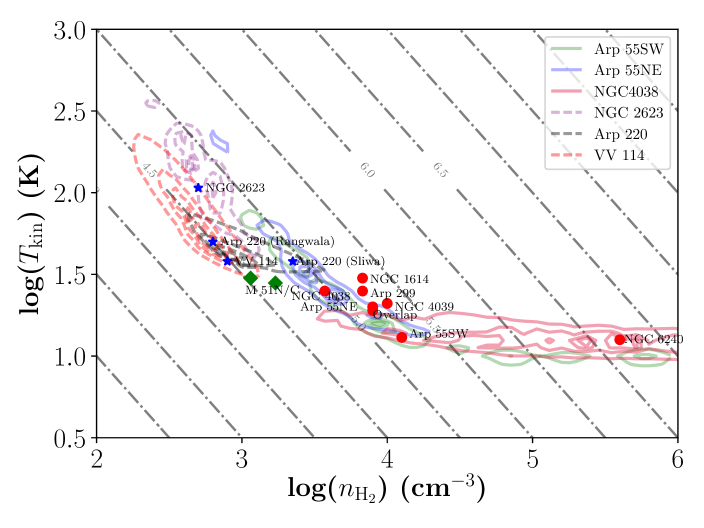
Figure 5 shows a clear difference in molecular gas conditions between NGC 2623, an advanced merger, and Arp 55, an early/intermediate merger. The molecular gas of NGC 2623 is warmer and less dense than that of Arp 55. We plot the most probable versus of Arp 220 (Rangwala et al., 2011, Sliwa Downes 2016 submitted), Arp 299 (Sliwa et al., 2012), VV 114 (Sliwa et al., 2013), NGC 1614 (Sliwa et al., 2014), NGC 6240 (Tunnard et al., 2015), NGC 4038/439 (Schirm et al., 2014) and M51 (Schirm et al. 2016, submitted) along with NGC 2623 and Arp 55 (Figure 6). We include M51 as a reference point. M51 is not a major merger but is an interacting system. For Arp 220 we have two points modeled at different scales (700 pc vs 1.5 kpc). The modelling of data have constrained both a warm and cold component to the molecular gas (e.g. Rangwala et al., 2011; Schirm et al., 2014). We note that our modelling is sensitive to only the cold component. Remarkably, there is a difference in physical conditions (on kiloparsec scales) between advanced mergers like Arp 220, NGC 2623 and VV 114 and early/intermediate mergers like Arp 299, NGC 1614, NGC 4038/39 + overlap and Arp 55: advanced mergers have a warmer and less dense molecular gas component than the early/intermediate mergers. We note that the spatial resolutions of the observations vary for the sources we are comparing from 1-2 kpc, except for NGC 1614 where the spatial resolution was 230 pc. The physical conditions at several positions of NGC 1614 revealed very similar results and once averaged at 1-2 kpc scales should yield a similar result.
In the early phases of the merger process, the molecular gas is funnelled towards the inner kiloparsec regions (e.g. Hopkins et al., 2006; Kewley et al., 2006; Ellison et al., 2008), which should drive the average volume density up. The starburst and/or AGN will warm the molecular gas as the merger progresses. In addition to heating the molecular gas, the massive stars will produce stellar winds that may dissipate some of the molecular gas and thus decrease the volume density. The supernova events produced by the massive stars can also play a role in decreasing the volume density. During the final coalescence, there should be another rapid increase in volume density as the gas mass of two disks merge into one. Arp 220 is very likely on this path.
In Figure 6, we also see that there is a difference in thermal pressure between advanced mergers and early/intermediate stage mergers. The early/intermediate mergers have nearly an order of magnitude higher pressure than the advanced mergers. Work has been done in analyzing the pressure observationally and theoretically in disk galaxies over the last two decades (e.g. Elmegreen, 1993; Blitz & Rosolowsky, 2004, 2006; Leroy et al., 2008). Elmegreen (1989) suggests that supernovae and other local activity affect the local average interstellar pressure by varying the scale height and therefore, the column density of stars that lies within the gas. This may be a likely scenario as the advanced mergers have had more time to form several generations of massive stars with stellar winds that have gone supernova.
| Source | log() | log(P) | log() | log(N) | [12CO]/[13CO] | log(M) | ababfootnotemark: | ||
|---|---|---|---|---|---|---|---|---|---|
| (K) | (cm-3) | (K cm-3) | (cm-2) | () | ( (K km s-1 pc2)-1) | ||||
| Arp 55NE | Mean | 54 | 3.6 | 5.4 | -0.2 | 18.0 | 32 | 8.3 | 0.2 |
| 1 range | 11 – 250 | 2.7 –4.6 | 4.8 – 6.0 | -0.4 – 0.1 | 17.8 – 18.2 | 22 – 50 | 8.1 – 8.4 | 0.1 – 0.2 | |
| Best Fit | 19 | 3.9 | 5.1 | 0 | 17.9 | 24 | 8.2 | 0.1 | |
| Arp 55SW | Median | 36 | 4.0 | 5.5 | -0.3 | 17.8 | 20 | 8.1 | 0.1 |
| 1 range | 8 – 175 | 2.8 – 5.1 | 4.8 – 6.2 | -0.5 – 0.1 | 17.7 – 18.0 | 14- 30 | 8.0 – 8.2 | 0.08 – 0.1 | |
| Best Fit | 13 | 4.1 | 5.2 | -0.1 | 17.8 | 15 | 8.0 | 0.08 | |
| NGC 2623 | Median | 125 | 2.8 | 4.8 | -1.0 | 18.9 | 250 | 8.7 | 0.5 |
| 1 range | 31 – 530 | 2.2 – 3.3 | 4.5 – 5.3 | -1.3 – -0.7 | 18.4 – 19.4 | 85 – 720 | 8.3 – 9.2 | 0.2 – 1.7 | |
| Best Fit | 107 | 2.7 | 4.8 | -1.2 | 18.9 | 267 | 8.8 | 0.7 |
6 Conclusions
In this paper, we have presented new ALMA and CARMA observations for Arp 55 and NGC 2623. We use the new data combined with existing SMA data to perform a non-LTE analysis to constrain the molecular gas physical conditions at about 1-1.5 kpc scales.
-
1.
We detect 13CO =10 and = 2-1 in both Arp 55 and NGC 2623 for the first time.
-
2.
We detect a CO blob in the tidal tail of Arp 55 that has active star formation. This blob has a mass of = 5.2 () 108 and may be forming a tidal dwarf galaxy. More sensitive high-resolution observations of other tracers are needed to confirm this.
-
3.
The molecular gas in both nuclei of Arp 55 is cold ( 10 K) and dense ( 103 cm -3) while the molecular gas in NGC 2623 is warm ( 110 K) and moderately dense (102.7 cm-3).
-
4.
The [12CO]/[13CO] abundance ratio in NGC 2623 is unusually high ( 200) when compared to the center of the Milky Galaxy while Arp 55 shows a more “normal” ratio of 15-30. The [12CO]/[13CO] value found for NGC 2623 follows a trend that has been found in other LIRGs such as VV 114 (Sliwa et al., 2013), NGC 1614 (Sliwa et al., 2014), NGC 6240 (Tunnard et al., 2015), Arp 193 (Papadopoulos et al., 2014) and Mrk 231 (Henkel et al., 2014). The low [12CO]/[13CO] value for Arp 55 may indicate that the inflow of molecular gas has not yet enhanced [12CO]/[13CO] and/or nucleosynthesis has yet to produce enough massive stars that have enriched the ISM in 12C and thus 12CO and/or fractionation plays a larger role in determining the [12CO]/[13CO] abundance ratio due to the cold environment.
-
5.
The conversion factor is measured to be 0.1 and 0.7 () (K km s-1 pc2)-1 for Arp 55 and NGC 2623, respectively. To catch the transition from the Galactic- like to the LIRG-like value, we may need to look at an even younger merger than Arp 55 such as Arp 240 (Privon et al., 2013).
-
6.
We find that, in general, advanced mergers such as NGC 2623 and Arp 220 have a molecular gas component that is warmer and less dense than early/intermediate mergers. There is also a pressure difference with advanced mergers having a lower pressure than early/intermediate stage mergers. Plausible scenarios to explain the pressure difference include mechanisms that can push back on the molecular gas like supernovae and stellar winds or the greater consumption of H2 gas compared to HI. More work on the pressure in U/LIRGs is required.
Appendix A Line Ratios
Line ratios can be used to estimate excitation conditions of the molecular gas in a galaxy.
We create the following integrated brightness temperature (I = TBdV) line ratios:
= ,
= ,
=,
= and
= (Figures 8, 10).
For each line ratio map, we match the angular resolution using a tapering weight during imaging. For Arp 55 we degrade the resolution to that of the 13CO =10 map (see Table 1) and for NGC 2623 we degrade the resolution to 2.5″. For the and line ratio maps, we degrade the 13CO =10 and 12CO =21 map resolutions to match the 13CO =21 resolution for both sources.. We also make a 1 and 2 cutoff in the 13CO and 12CO integrated intensity maps, respectively, when creating the line ratio maps (Figures 8 and 10).
Since the signal-to-noise (SN) ratio for the 13CO observations of Arp 55 is low(6), we apply an additional cutoff to the corresponding 12CO map in order to match the SN ratio (8 and 7 for 12CO =10 and =2-1, respectively). For R10, the majority of the emission lies within regions of 3 detections in 13CO. Towards the edges of the sources, the SN ratio drops and therefore, the uncertainty approaches 50. We can therefore treat edges as upper limits. For R21, a significant number of pixels above the initial cutoff lie in regions below 2 13CO emission and should be perceived as upper limits. We note that this is severe for Arp 55SW and the variation in the R21 line ratio should be taken with caution.
The and line ratios for both Arp 55 and NGC 2623 vary smoothly indicating no extreme changes in the conditions of the molecular gas. The line ratio for Arp 55 is 1 for both nuclei which may suggest that 12CO =10 is optically thin. Indeed, this is consistent with the RADEX solutions for the best fit where = 0.2 - 0.3 for Arp 55. We note that similar line ratios were found for Arp 299 (Sliwa et al., 2012), another early/ intermediate merger stage LIRG.
| Source | |||||||
|---|---|---|---|---|---|---|---|
| Arp 55 NE | 09h15m55s.5 | +44∘19′57″.9 | 1.5 0.4 | 0.4 0.1 | 22 5 | 19 4 | 2.1 0.9 |
| Arp 55 SW | 09h15m54s.7 | +44∘19′51″.5 | 1.3 0.4 | 0.4 0.1 | 13 3 | 25 6 | 1.6 0.6 |
| NGC 2623 | 08h38m24s.1 | +25∘45′16″.53 | 0.8 0.2 | 1.2 0.3 | 27.1 4.9 | 20.1 5.0 | 1.0 0.2 |
Appendix B Velocity Maps
Using the new CARMA 12CO =10 maps, we create velocity field (moment 1) and dispersion (moment 2; = FWHM/2) maps. We only include channels that contain emission above 2. The maps are presented in Figure 11.
References
- Aalto et al. (2017) Aalto, S., Muller, S., Costagliola, F., et al. 2017, ArXiv e-prints, arXiv:1702.05458
- Black et al. (1990) Black, J. H., van Dishoeck, E. F., Willner, S. P., & Woods, R. C. 1990, ApJ, 358, 459
- Blitz & Rosolowsky (2004) Blitz, L., & Rosolowsky, E. 2004, ApJ, 612, L29
- Blitz & Rosolowsky (2006) —. 2006, ApJ, 650, 933
- Bolatto et al. (2013) Bolatto, A. D., Wolfire, M., & Leroy, A. K. 2013, ARA&A, 51, 207
- Braine et al. (2001) Braine, J., Duc, P.-A., Lisenfeld, U., et al. 2001, A&A, 378, 51
- Braine et al. (2000) Braine, J., Lisenfeld, U., Due, P.-A., & Leon, S. 2000, Nature, 403, 867
- Bridge et al. (2010) Bridge, C. R., Carlberg, R. G., & Sullivan, M. 2010, ApJ, 709, 1067
- Bryant & Scoville (1999) Bryant, P. M., & Scoville, N. Z. 1999, AJ, 117, 2632
- Casoli et al. (1992) Casoli, F., Dupraz, C., & Combes, F. 1992, A&A, 264, 55
- Currie et al. (2008) Currie, M. J., Draper, P. W., Berry, D. S., et al. 2008, in Astronomical Society of the Pacific Conference Series, Vol. 394, Astronomical Data Analysis Software and Systems XVII, ed. R. W. Argyle, P. S. Bunclark, & J. R. Lewis, 650
- Downes & Solomon (1998) Downes, D., & Solomon, P. M. 1998, ApJ, 507, 615
- Downes et al. (1993) Downes, D., Solomon, P. M., & Radford, S. J. E. 1993, ApJ, 414, L13
- Ellison et al. (2008) Ellison, S. L., Patton, D. R., Simard, L., & McConnachie, A. W. 2008, AJ, 135, 1877
- Elmegreen (1989) Elmegreen, B. G. 1989, ApJ, 338, 178
- Elmegreen (1993) —. 1993, ApJ, 411, 170
- Evans et al. (2008) Evans, A. S., Vavilkin, T., Pizagno, J., et al. 2008, ApJ, 675, L69
- Frerking et al. (1989) Frerking, M. A., Keene, J., Blake, G. A., & Phillips, T. G. 1989, ApJ, 344, 311
- García-Burillo et al. (2014) García-Burillo, S., Combes, F., Usero, A., et al. 2014, A&A, 567, A125
- González Delgado et al. (2014) González Delgado, R. M., Pérez, E., Cid Fernandes, R., et al. 2014, A&A, 562, A47
- Greve et al. (2009) Greve, T. R., Papadopoulos, P. P., Gao, Y., & Radford, S. J. E. 2009, ApJ, 692, 1432
- Hattori et al. (2004) Hattori, T., Yoshida, M., Ohtani, H., et al. 2004, AJ, 127, 736
- Henkel et al. (2010) Henkel, C., Downes, D., Weiß, A., Riechers, D., & Walter, F. 2010, A&A, 516, A111
- Henkel & Mauersberger (1993) Henkel, C., & Mauersberger, R. 1993, A&A, 274, 730
- Henkel et al. (2014) Henkel, C., Asiri, H., Ao, Y., et al. 2014, A&A, 565, A3
- Hopkins et al. (2006) Hopkins, P. F., Hernquist, L., Cox, T. J., et al. 2006, ApJS, 163, 1
- Hunter (2007) Hunter, J. D. 2007, Computing In Science & Engineering, 9, 90
- Imanishi et al. (2009) Imanishi, M., Nakanishi, K., Tamura, Y., & Peng, C.-H. 2009, AJ, 137, 3581
- Jiménez-Donaire et al. (2017) Jiménez-Donaire, M. J., Cormier, D., Bigiel, F., et al. 2017, ApJ, 836, L29
- Kamenetzky et al. (2014) Kamenetzky, J., Rangwala, N., Glenn, J., Maloney, P. R., & Conley, A. 2014, ApJ, 795, 174
- Kamenetzky et al. (2012) Kamenetzky, J., Glenn, J., Rangwala, N., et al. 2012, ApJ, 753, 70
- Kewley et al. (2006) Kewley, L. J., Geller, M. J., & Barton, E. J. 2006, AJ, 131, 2004
- Krips et al. (2016) Krips, M., Martín, S., Peck, A. B., et al. 2016, ApJ, 821, 112
- Lacy et al. (1994) Lacy, J. H., Knacke, R., Geballe, T. R., & Tokunaga, A. T. 1994, ApJ, 428, L69
- Langer & Penzias (1990) Langer, W. D., & Penzias, A. A. 1990, ApJ, 357, 477
- Leroy et al. (2008) Leroy, A. K., Walter, F., Brinks, E., et al. 2008, AJ, 136, 2782
- Maiolino et al. (2003) Maiolino, R., Comastri, A., Gilli, R., et al. 2003, MNRAS, 344, L59
- Matsushita et al. (2009) Matsushita, S., Iono, D., Petitpas, G. R., et al. 2009, ApJ, 693, 56
- McMullin et al. (2007) McMullin, J. P., Waters, B., Schiebel, D., Young, W., & Golap, K. 2007, in Astronomical Society of the Pacific Conference Series, Vol. 376, Astronomical Data Analysis Software and Systems XVI, ed. R. A. Shaw, F. Hill, & D. J. Bell, 127
- Milam et al. (2005) Milam, S. N., Savage, C., Brewster, M. A., Ziurys, L. M., & Wyckoff, S. 2005, ApJ, 634, 1126
- Panuzzo et al. (2010) Panuzzo, P., Rangwala, N., Rykala, A., et al. 2010, A&A, 518, L37
- Papadopoulos et al. (2012) Papadopoulos, P. P., van der Werf, P. P., Xilouris, E. M., et al. 2012, MNRAS, 426, 2601
- Papadopoulos et al. (2014) Papadopoulos, P. P., Zhang, Z.-Y., Xilouris, E. M., et al. 2014, ApJ, 788, 153
- Pety et al. (2013) Pety, J., Schinnerer, E., Leroy, A. K., et al. 2013, ApJ, 779, 43
- Privon et al. (2013) Privon, G. C., Barnes, J. E., Evans, A. S., et al. 2013, ApJ, 771, 120
- Privon et al. (2015) Privon, G. C., Herrero-Illana, R., Evans, A. S., et al. 2015, ApJ, 814, 39
- Rangwala et al. (2015) Rangwala, N., Maloney, P. R., Wilson, C. D., et al. 2015, ApJ, 806, 17
- Rangwala et al. (2011) Rangwala, N., Maloney, P. R., Glenn, J., et al. 2011, ApJ, 743, 94
- Roueff et al. (2015) Roueff, E., Loison, J. C., & Hickson, K. M. 2015, A&A, 576, A99
- Rupke et al. (2008) Rupke, D. S. N., Veilleux, S., & Baker, A. J. 2008, ApJ, 674, 172
- Sage et al. (1991) Sage, L. J., Henkel, C., & Mauersberger, R. 1991, A&A, 249, 31
- Saito et al. (2015) Saito, T., Iono, D., Yun, M. S., et al. 2015, ApJ, 803, 60
- Saito et al. (2017) Saito, T., Iono, D., Xu, C. K., et al. 2017, ApJ, 835, 174
- Sanders et al. (2003) Sanders, D. B., Mazzarella, J. M., Kim, D.-C., Surace, J. A., & Soifer, B. T. 2003, AJ, 126, 1607
- Sanders et al. (1988) Sanders, D. B., Soifer, B. T., Scoville, N. Z., & Sargent, A. I. 1988, ApJ, 324, L55
- Schinnerer et al. (2013) Schinnerer, E., Meidt, S. E., Pety, J., et al. 2013, ApJ, 779, 42
- Schirm et al. (2014) Schirm, M. R. P., Wilson, C. D., Parkin, T. J., et al. 2014, ApJ, 781, 101
- Scoville et al. (2000) Scoville, N. Z., Evans, A. S., Thompson, R., et al. 2000, AJ, 119, 991
- Sliwa et al. (2014) Sliwa, K., Wilson, C. D., Iono, D., Peck, A., & Matsushita, S. 2014, ApJ, 796, L15
- Sliwa et al. (2012) Sliwa, K., Wilson, C. D., Petitpas, G. R., et al. 2012, ApJ, 753, 46
- Sliwa et al. (2013) Sliwa, K., Wilson, C. D., Krips, M., et al. 2013, ApJ, 777, 126
- Soifer et al. (2001) Soifer, B. T., Neugebauer, G., Matthews, K., et al. 2001, AJ, 122, 1213
- Thomas et al. (2002) Thomas, H. C., Dunne, L., Clemens, M. S., et al. 2002, MNRAS, 329, 747
- Toomre (1977) Toomre, A. 1977, in Evolution of Galaxies and Stellar Populations, ed. B. M. Tinsley & R. B. G. Larson, D. Campbell, 401
- Tunnard et al. (2015) Tunnard, R., Greve, T. R., Garcia-Burillo, S., et al. 2015, ApJ, 815, 114
- U et al. (2012) U, V., Sanders, D. B., Mazzarella, J. M., et al. 2012, ApJS, 203, 9
- Ueda et al. (2014) Ueda, J., Iono, D., Yun, M. S., et al. 2014, ApJS, 214, 1
- van der Tak et al. (2007) van der Tak, F. F. S., Black, J. H., Schöier, F. L., Jansen, D. J., & van Dishoeck, E. F. 2007, A&A, 468, 627
- Vardoulaki et al. (2015) Vardoulaki, E., Charmandaris, V., Murphy, E. J., et al. 2015, A&A, 574, A4
- Vigroux et al. (1976) Vigroux, L., Audouze, J., & Lequeux, J. 1976, A&A, 52, 1
- Watson et al. (1985) Watson, D. M., Genzel, R., Townes, C. H., & Storey, J. W. V. 1985, ApJ, 298, 316
- Watson et al. (1976) Watson, W. D., Anicich, V. G., & Huntress, Jr., W. T. 1976, ApJ, 205, L165
- Wilson & Scoville (1990) Wilson, C. D., & Scoville, N. 1990, ApJ, 363, 435
- Wilson et al. (2008) Wilson, C. D., Petitpas, G. R., Iono, D., et al. 2008, ApJS, 178, 189
- Wilson & Matteucci (1992) Wilson, T. L., & Matteucci, F. 1992, A&A Rev., 4, 1
- Xu et al. (2014) Xu, C. K., Cao, C., Lu, N., et al. 2014, ApJ, 787, 48
- Xu et al. (2015) —. 2015, ApJ, 799, 11