Transition in a numerical model of contact line dynamics and forced dewetting
Abstract
We investigate the transition to a Landau–Levich–Derjaguin film in forced dewetting using a quadtree adaptive solution to the Navier–Stokes equations with surface tension. We use a discretization of the capillary forces near the receding contact line that yields an equilibrium for a specified contact angle called the numerical contact angle. Despite the well-known contact line singularity, dynamic simulations can proceed without any explicit additional numerical procedure. We investigate angles from to and capillary numbers from to where the mesh size is varied in the range of to of the capillary length . To interpret the results, we use Cox’s theory which involves a microscopic distance and a microscopic angle . In the numerical case, the equivalent of is the angle and we find that Cox’s theory also applies. We introduce the scaling factor or gauge function so that and estimate this gauge function by comparing our numerics to Cox’s theory. The comparison provides a direct assessment of the agreement of the numerics with Cox’s theory and reveals a critical feature of the numerical treatment of contact line dynamics: agreement is poor at small angles while it is better at large angles. This scaling factor is shown to depend only on and the viscosity ratio . In the case of small , we use the prediction by Eggers [Phys. Rev. Lett., vol. 93, pp 094502, 2004] of the critical capillary number for the Landau–Levich–Derjaguin forced dewetting transition. We generalize this prediction to large and arbitrary and express the critical capillary number as a function of and . This implies also a prediction of the critical capillary number for the numerical case as a function of and . The theory involves a logarithmically small parameter and is thus of moderate accuracy. The numerical results are however in approximate agreement in the general case, while good agreement is reached in the small and case. An analogy can be drawn between the numerical contact angle condition and a regularization of the Navier–Stokes equation by a partial Navier-slip model. The analogy leads to a value for the numerical length scale proportional to the slip length. Thus the microscopic length found in the simulations is a kind of numerical slip length in the vicinity of the contact line. The knowledge of this microscopic length scale and the associated gauge function can be used to realize grid-independent simulations that could be matched to microscopic physics in the region of validity of Cox’s theory. This version of the paper includes the corrections indicated in [1].
keywords:
Dynamic contact line, Contact angle, Contact line stress singularity, Slip boundary condition, Landau–Levich–Derjaguin film, Forced dewetting, Wetting failure, Cox-Voinov model, Volume-Of-Fluid (VOF), Gerris, Slip length, Navier slip, Partial slip.1 Introduction
Wetting of solids by liquids, in which a liquid displaces another fluid on a solid substrate, is an ubiquitous phenomenon with applications ranging from coating [2] and tear films on the cornea [3] to micro-layer formation in wall boiling [4, 5] and CO2 sequestration [6]. However, despite the abundance of applications, the precise mechanism of wetting is only partially understood. From the numerical modeling point of view, difficulties arise due to the highly multiscale nature of the problem (length scales extending from the macroscopic to the molecular sizes). Another major challenge in numerical simulations is the so-called contact line singularity that arises when a continuum description of moving contact lines is used in combination with a no-slip boundary condition at the liquid-solid interface. Because of this singularity, the continuum description is untenable below a certain scale. Thus a transition to a different, nonsingular physics must occur as the scale is reduced. The most obvious such transition is the appearance of molecular effects at nanometer scales. However a variety of other “microscopic” contact line physics, some of which would “kick-in” at scales much larger than the nanometer, have been considered in the literature. It is difficult to be exhaustive but these involve precursor film models [7], diffuse-interface models [8, 9, 10, 11] and the related issue of evaporation [12], interface formation models [13, 14], and surface roughness [15]. The reader may find references to other mechanisms in review papers [16, 17, 18, 19]. Slip of the contact line is of particular interest as a possible physical mechanism to allow motion of the contact line on the microscopic scale, mostly because it conveniently does not require to change the Navier–Stokes equations, see e.g. [20, 21, 22, 23, 24, 25, 26, 27, 28]. However, numerical simulations involving slip-length modeling are unfeasible in most physical problems since the true slip should be related to molecular interactions between the liquid and the solid substrate [16], which based on experimental measurements lies in the nanometer range [29, 30]. Thus a regularization of the numerics based on the slip length leads to computationally inconvenient large ratios of scales. On the other hand, if no regularization is performed or if the slip length is dependent on grid spacing, the moving contact line solutions become themselves dependent on grid spacing (see e.g. [27, 31, 32]).
This paper pursues several goals. One is to describe the method used in the numerical framework, Gerris [33] to impose the contact angle and the related “banded” advection of the Volume-Of-Fluid method. (Although the contact angle in a version of Gerris has been described in [34, 35], the exact method used in the mainline distribution of the Gerris code has not been described before.) Another goal is to attempt to extend numerically the theory of Eggers and his coworkers [36, 37, 38] for the dewetting transition to the case of finite microscopic angles. One consequence of this analysis applied to the numerical case is a precise description of the behavior of any numerical method in the vicinity of the contact line. Another consequence is to aid models such as those in [27, 39] or [40] that are used to perform grid-independent models.
In this paper we do not attempt to implement a sophisticated dynamic contact angle model, but instead take an existing, simple numerical method already documented in [34, 35] for static cases and apply it “as is” for dynamic simulations. This is a kind of “implicit modeling” approach similar to the implicit subgrid scale modeling frequent in Large Eddy Simulations of turbulence. This approach has the merit of simplicity, and it then remains to assess how this “numerical boundary condition” affects the flow.
We study a specific, complex physical problem: the dewetting transition. In a number of applications, the interface is forced to move along a solid in a manner that can result either in a receding contact line or in the formation of a thin film on the solid. One example of such a flow is the withdrawing-tape experiment whose geometry is illustrated on Fig. 1. A solid substrate is withdrawn on the left from a viscous liquid pool of quiescent liquid. The interface may either sustain a stationary state meniscus, if below a critical capillary number, , or continue to move up the substrate until depositing a thin film to arbitrary heights. The latter is called a Landau–Levich–Derjaguin (LLD) film [41, 42]. This transition can be understood in terms of the imbalance between the surface tension, gravity and viscous forces that leads to the vanishing of the contact line. The analysis of the transition process on a partially wetting substrate is however complicated due to the singularity of the moving contact line. On one hand, Eggers and his coworkers, in a series of papers [36, 37, 38], provided a hydrodynamic prediction, based on the lubrication approximation theory, of the critical capillary number . Cox [23] and Voinov [43] described, on the other hand, how the singularity drove a peculiar curved form of the fluid wedge at small . We use these theories to predict the numerically observed transition. We shall show that 1) the microscopic length is entirely described by a gauge function depending only on the equilibrium contact angle imposed numerically and 2) that the knowledge of this numerical gauge function can be used to mimic the effect of actual subgrid scale microscopic physics. This second point is related to the notion of grid-independent simulations in [27, 39].

The rest of this paper is organized as follows. In Sec. 2, we describe the physical problem and explain our choice of parameters. In Sec. 3, we describe the computational setup and the numerical method for the implementation of the contact angle. In Sec. 4, we report the results of our simulations including the method for determining the critical capillary number . In Sec. 5, we introduce the main new theoretical concept of this paper, the gauge function . We discuss the general theoretical features of the transition and study it in two cases, the small angle, small viscosity ratio case, free-surface case, where Eggers’s results can be applied directly and the more general case where the use of matched asymptotics and Airy functions is replaced by heuristic arguments. In Sec. 6, we discuss the connection with theories where the microscopic angle varies with the capillary number as in the Molecular Kinetic Theory [44]. In Sec. 7, we apply the concepts developed above to describe an improved procedure for obtaining grid-independent computations of problems with dynamic contact lines. Finally, we draw our conclusions in Sec. 8.
2 Problem setup: forced dewetting
We consider a solid plate being withdrawn from a liquid reservoir with a constant velocity . The computational domain is , with fluid 1 occupying and fluid 2 occupying at (see Fig. 1). The viscosity and density of fluid are and , respectively. The capillary number is defined as
where is the viscosity of fluid and the surface tension. We set , where is the capillary length with the gravitational acceleration. The Reynolds number is then defined based on the capillary length as . Thus where the Morton number is
We define a “gravity-wave-damping” number as
Indeed, the wavelength of gravity waves traveling at the same speed as the withdrawing tape is and it can be connected to through . Thus is also the Reynolds number based on the wavelength of gravity waves. It is related to the capillary length Reynolds number by
| (1) |
We use several setups for the simulations, presented in Tab. 1. In Setups A and B, for relatively more efficient computations, we set the ratios of physical properties to moderate values with the viscosity ratio and the density ratio . The other parameters are chosen in the following way. In Setup A, the number is arbitrarily set to . (It is the value corresponding to the arbitrary choices of .) Thus from Eq. (1) the Reynolds number based on varies as
| (2) |
As a result the Reynolds number based on increases as the capillary number decreases. Varying the Reynolds number between (Stokes approximation) and has no effect on the results, however increasing beyond this value introduces significant inertial effects and interface oscillations that modify the conclusions of our investigations. At small , we therefore switch to Setup B, where is free to vary and the Reynolds number based on is fixed to . In a final set of simulations (Setup C), we keep and but let . This allows to bring the simulations somewhat closer to air/water conditions without encountering the numerical problems arising with very large density ratios.
| Setup | ||||
| A | - | 1 | 5 | |
| B | - | 1 | 1 | 5 |
| C | - | 1 | 50 | 5 |
We begin the simulations by considering a flat interface between the two fluids initially at the height . A no-slip boundary condition is prescribed at the substrate (). Symmetry boundary conditions are imposed on the right (), top (), and bottom () boundaries of the domain. We note that we have checked that the results are insensitive to the computational domain size.
In the neighborhood of the contact line, no specific choice of parameters is required except the equilibrium or static contact angle that is specified in the numerical model. It is also expected that the numerical model leads to a solution varying continuously with the withdrawing tape velocity, so that the contact angle tends to the static contact angle as tends to zero. How simulations with a contact angle are performed is described in the next section.
3 Numerical model
We use Gerris [33, 45, 46] to numerically solve the Navier–Stokes, continuity and density equations,
| (3) |
| (4) |
| (5) |
respectively. Here, u is the velocity field, the pressure, , , is the interface curvature, n the normal to the interface (pointing from fluid 1 to fluid 2), the delta function centered at the interface, the body force due to gravity and the unit vector in the -direction, and ( in fluid 1 and in fluid 2) the characteristic function, where . Note that Eq. (5) is equivalent to
| (6) |
which is solved using the Volume-Of-Fluid (VOF) interface capturing method [46, 47, 34, 48]. The Continuous Surface Force (CSF) method is used for the surface tension force with curvature computed using the Height-Function method [46, 48]. Viscous forces are implemented using a partially implicit method described in [49].
It is useful to describe the procedure used near the contact line in the main distribution of the Gerris code, which we used in the computations reported below. First, without giving the full details that can be found in the references, let us outline the procedure used away from the contact line. There, the VOF discretization of Eq. (6) consists in the definition of a variable on each grid point that is equal to the volume fraction of the reference fluid, fluid “1”, in the cell. The VOF method proceeds in two steps, first the reconstruction of the interface followed by its advection. In the first part of the reconstruction step, the interface normal in cell is determined from the values in neighboring cells, using the “Height-Function” method described below (see e.g. [34, 46]) or the “mixed Youngs-centered” (MYC) method (see e.g. [50]), if the former method fails. In the second part of the reconstruction step, the position of a linear segment representing the interface in the cell is determined using elementary geometry (see [50]) from the knowledge of and . Thus the equation of the segment is written
| (7) |
where the scalar characterizes the position of the interface. The knowledge of and is then used in turn in the second, advection step, where the interface is displaced by the fluid velocity field. On Fig. 2, the standard “Lagrangian-Explicit” (see [50]) advection step is represented. It is useful to describe the advection process in some detail. The collocated velocities , defined on cell centers, are used to compute an auxiliary set of velocities and on different cell face centers using a projection method. The determination of the motion of the piece of interface shown on Fig. 2 is identical to the “Lagrangian Explicit” or “CIAM” method [46, 50]. However a recent implementation in Gerris uses a “banded” advection. In this approach, the cell is subdivided in equal bands, the default being as on Fig. 3, and the advection is performed separately in each band. After that, the bands in the cells are aggregated to produce the final volume fraction. This ensures a better representation of shearing or rotating velocity fields, while volume conservation is enforced by the requirement that the average of the horizontal velocity in the bands, for example, on the right side of the cell in Fig. 3 (left panel) to be equal to the face center velocity .

We next present a test case to clearly illustrate the improvement when using the “banded” advection [51]. In this test case, a straight interface is advected by a pure shear flow, at a shear rate of , in a computational domain. The exact solution is simply a rotation of the interface around the center of the domain. We note that both the interface and the velocity field are described exactly by a second-order method. Fig. 4 illustrates the rotation of the straight interface under the shear flow. The green segments are the VOF reconstructed interfaces obtained with and the red segments are when using a “banded” advection method with bands. Fig. 5 illustrates the evolution of the error with time. For , the interface is at degrees and the errors in fluxes cancel out exactly.
 |
 |
| (a) | (b) |
 |
 |
| (c) | (d) |

In order to compute capillary forces, we use the Height-Function method, in which the local height of the interface is computed from summing over a column of cells with
where is the index of the bottom cell in the column and the index of the top cell. When the bottom cell is full () and the top cell is empty (), and there is a single interface in the column, the height approaches the exact interface height to second order [52]. Using finite differences of the local Height-Function then provides the curvature, as well as the interface normals, used to compute the surface tension force by the CSF method (see [46, 48]).
The numerical method given in this paper has often been tested only for regular grids. For example tests of the curvature estimation by the height function method were performed only on circles or spheres where the curvature is uniform. A uniform curvature is naturally associated in these tests to a uniform grid. However, there are some indirect tests, where near a singularity, a range of scales of curvature appear, such as the pinching thread test in [46]. The contact line flow is another such case where the singular flow near the dynamic contact line forces a wide range of curvature. Tests of more complex flows as performed in this paper are also useful to assess the accuracy of capillary force modeling on non-uniform quadtree grids.
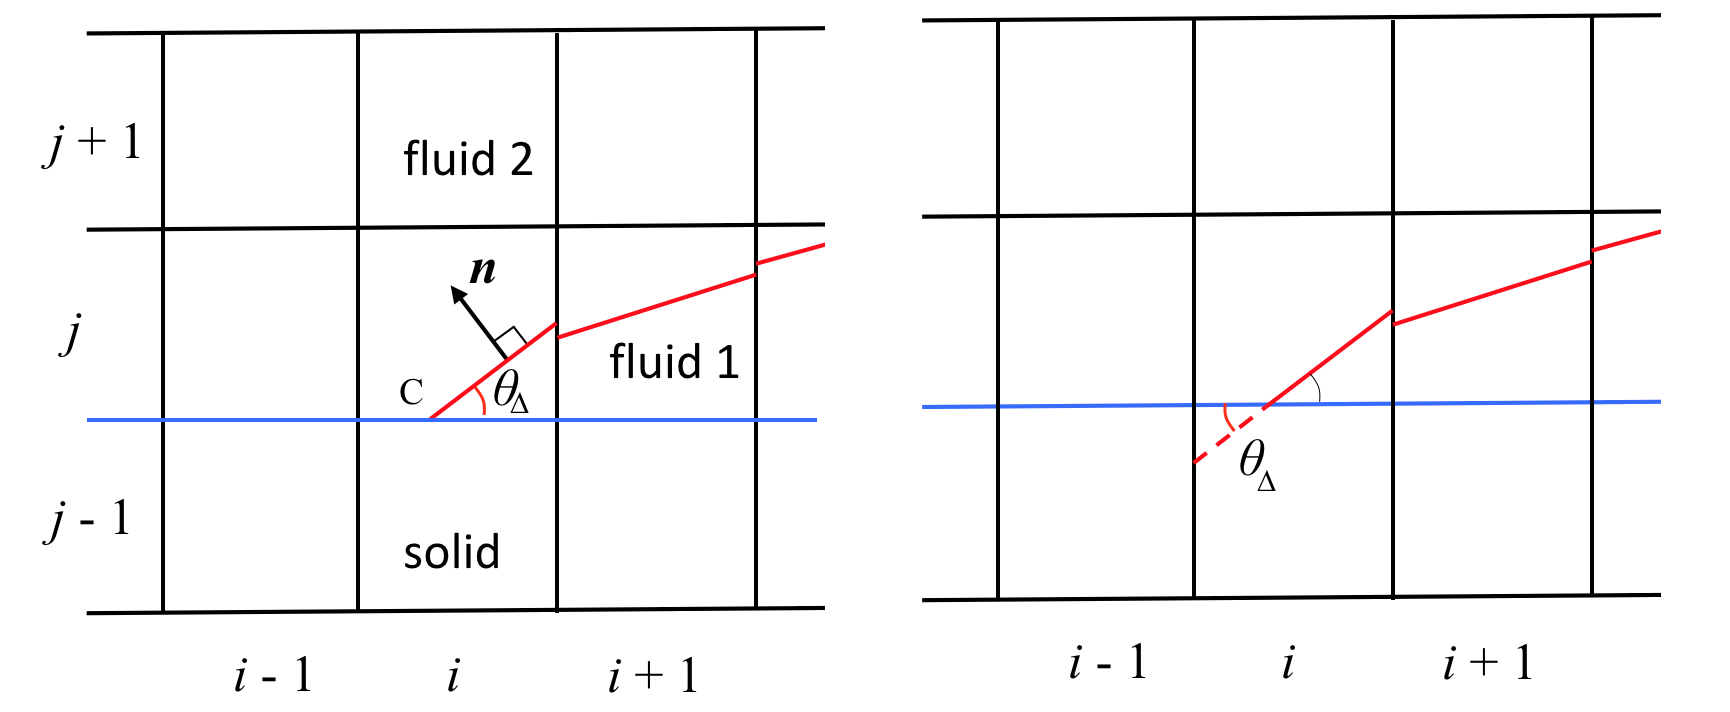
Near the contact line, we consider a cell containing the contact line C as shown on Fig. 6(a). The solid-fluid boundary is located exactly on the lower boundary of this cell. (Other locations for the solid boundary have not been explored by the authors.) For such a computational cell, the normal vector is recovered trivially from the specified contact angle as , . The value of in Eq. (7) is then obtained using elementary geometry. The interface can then be linearly extended into the solid cell as shown by the dashed line on Fig. 6(b). It is assumed there is no other contact line in the immediate neighborhood. The computation of the normal in cell is not immediately possible but this difficulty is easily circumvented by assigning “ghost” values to the cells in the first solid layer .
 |
|
| (a) | (b) |
 |
|
| (c) | (d) |
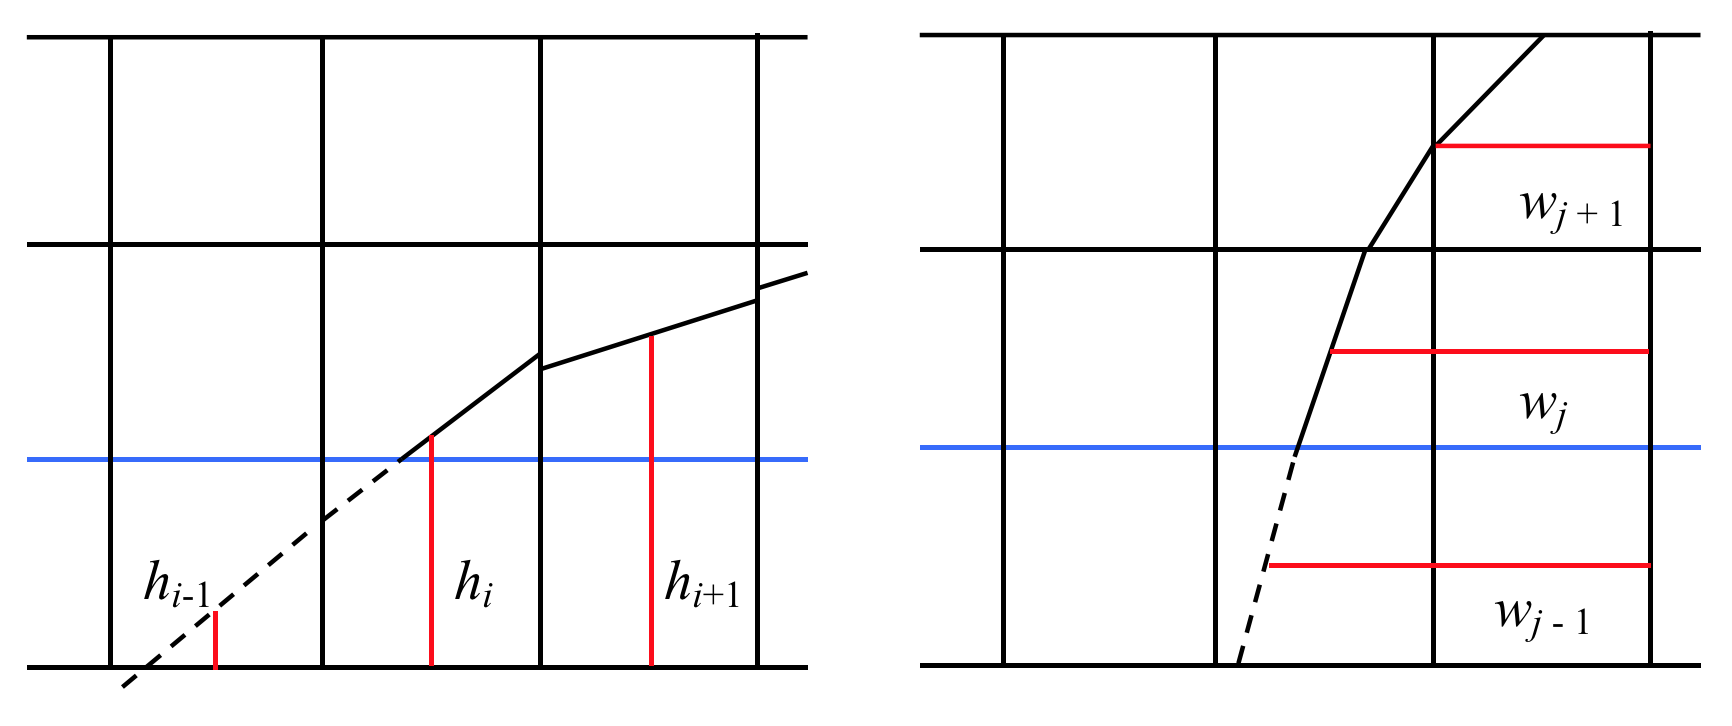
Then as shown on Fig. 6(c), the heights and can be reconstructed in columns and . To construct the height in the column beyond the contact line a first-order extrapolation of the form is used, where is the local grid size.
The heights over the three columns can be used to compute the curvature in the cell containing the contact line C. This is a good approximation when both the interface slope and its curvature are small enough. Alternatively, it is possible to fit a parabolic approximation of the interface through the two heights and and the contact point C of Fig. 6(a) computed from Eq. (7).
For vertical interfaces one uses “widths” instead, as shown on Fig. 6(d). Finally when neither heights nor widths are available, several other strategies are used to compute the curvature, as outlined by Popinet [46], using either a mixture of heights and widths (the so-called mixed-heights method) or if the mixed-heights method fails, a polynomial fit to the mid points of the segments in each cell. These alternative strategies can be adapted to the vicinity of the contact line, provided extrapolations of the volume fraction and slope in cells and are used. It is important to remark that the Height-Function method for curvature (without mixed heights) always provides a curvature for small enough. The critical value of was estimated independently by one of the authors through tests on a large number of random circles showing that the minimum value of at which the Height-Function always works is about .
Once the interface positions and the curvature are computed, there is no special difficulty in computing the velocity field using the standard methods. No special provision is made for the discontinuity of velocities or the divergence of viscous stresses and pressures, which are computed as elsewhere in the domain using finite volumes and finite differences.
We note however that the Gerris code uses the staggered (face) velocities to advect interface pieces, and therefore, in the contact line cell C on Fig. 6, the tangential (face) velocities used for advecting the interface in that cell will not be equal to the solid velocity, since they are defined half-a-cell above the solid boundary which is at on Fig. 6. Intuitively, this allows a kind of effective slip. However the amount of slip is reduced by the banding method described above and shown in Fig. 3.
It is interesting to note that at the scale of the cell the interface and the velocity field are represented in a coarsely averaged manner that is very far from capturing the flow reversal expected inside the fluid 1 wedge (although on scales larger than this flow is well captured). Whether it is possible or desirable to have a more sophisticated discretization approach near the contact line is beyond the scope of this paper.
4 Results: transition to film formation in forced dewetting
We focus on the problem of a partially wetting substrate withdrawn from a liquid reservoir. We find two parameter ranges: first, the stationary regime, for which the contact line motion along the substrate can evolve to a steady state, as , where the nondimensional time is ; second, the unsteady regime for which a steady state solution cannot be found and the contact line height continues to increase, covering the substrate by a film. All the results presented in this section are for Setup A, unless stated otherwise. We begin by presenting various scenarios characterized by different nondimensional grid sizes, , and the imposed contact angle, . Fig. 7 shows the instantaneous contact line height, , from the reference height, , nondimensionalized by . Fig. 7 shows that depending on , different equilibrium configurations can be obtained. Also, it shows that when the contact angle is decreased, the contact line is raised to a new equilibrium height for the large grid sizes while a stationary meniscus cannot be achieved for the smallest grid size. Here we take . We note that for the capillary numbers that we consider (from to ), it is very difficult to have a larger range of grid sizes since one needs to satisfy , where is the thickness of the film at the transition, of the order . We however note that the Gerris code uses quadtree grids (or octree in 3D), that allow to refine the grid where necessary. This is a very useful feature for dynamical contact line problems as it allows to use a very small grid size in the immediate neighborhood of the contact line and a larger grid size elsewhere.
Next, we elaborate on the stationary state results in detail. Figs. 8(a)-(d) show the nondimensional stationary contact line height , where , as a function of the nondimensional mesh size, , for various capillary numbers and for various contact angles, . The results show the grid sizes, , where a stationary meniscus forms and no film is deposited on the substrate, for the range of considered .

 |
 |
| (a) | (b) |
 |
 |
| (c) | (d) |
 |
 |
| (a) | (b) |
More importantly, the results show that the computed height of the contact line is a function of and that for small enough no steady state menisci can be attained when . This lower limit of , for which steady state contact lines can be achieved, gets larger as is increased. The results clearly depend on the chosen value for the smaller mesh size near the contact line, an effect that is expected and will be explained below. This dependence of the results with mesh refinement becomes more marked as is increased or is decreased.
Next we present the results, for which the contact line continues to move upward and a liquid film is then deposited on the substrate. We can understand the onset of film deposition, i.e. the forced dewetting transition, as when the balance between the surface tension and viscous forces close to the contact line region can no longer hold, resulting in wetting failure. (We note that gravity is only involved, asymptotically, in the outermost region.) At the transition, however, we will need to allow the computations to run for a very long time in order to determine when the contact line motion along the wall cannot reach a stationary state. For efficient and accurate determination of the numerical values of the transition , we propose a procedure as follows. Fig. 9(a) shows contact line heights as a function of time for various values of , when and . As shown, for sufficiently small , a stationary meniscus can be reached while for large , the contact line height keeps increasing. We then use the information in Fig. 9(a) to obtain Fig. 9(b). We then pick the transition capillary number, for which the relative velocity of the contact line, , does not go to zero as a function of . This critical capillary number is depicted in red in Figs. 9(a) and (b). Using the procedure above, we can therefore determine with a very good precision.
 |
 |
| (a) | (b) |
Figs. 10(a)-(b) show the contact line height, , as a function of nondimensional time, , for two mesh sizes, , when varying the wall contact angle , for a fixed . As shown, the transition from a stationary meniscus not only depends on , but also on . As illustrated, the transition occurs at a larger for smaller . This observation begs a further exploration of how the critical capillary number depends on the contact angle and the grid size. We study these effects in what follows.
To shed more light on the transition mechanism, we analyze the flow, for both when a stationary meniscus forms and when a steady state contact line cannot be attained. Fig. 11(a) provides an example of a stationary meniscus for , , and (for this set of parameters, ). The inset shows the magnified flow field and the pressure distribution. Fig. 11(b) shows a magnified view of the contact line region and the computational mesh. The fine structure of the flow field and the pressure distribution in the contact line region are illustrated. As shown, large gradients of velocity and pressure necessitate a high mesh resolution around the contact line region. As illustrated, the interface is highly curved close to the contact line, leading to an intensified pressure gradient around that region, while the pressure gradient remains weak outside the vicinity of the contact line, leading to gentle bending of the interface away from the contact line.
 |
 |
| (a) | (b) |
Fig. 12 shows an example of when the contact line cannot attain a steady state, leading to the formation of a film deposited on the substrate, for , , and (for this set of parameters, ). The figure shows a typical evolution of the interface and the transition to the film. Figs. 12(d)-(f) also show the sagging of the interface behind the contact line after the film formation. The insets of Figs. 12(a)-(c) show the magnified flow field and the pressure distribution. Figs. 12(a)-(c) also show a further magnified view of the contact line region and the flow streamlines. The fine structure of the flow field and the pressure distribution in the contact line region are illustrated. The results reveal the strong pressure gradients close to the contact line region; when capillary forces can no longer balance this strong pressure gradient, the consequence is the wetting failure.
![[Uncaptioned image]](/html/1703.07038/assets/x20.png) |
![[Uncaptioned image]](/html/1703.07038/assets/x21.png) |
| (a) | |
![[Uncaptioned image]](/html/1703.07038/assets/x22.png) |
![[Uncaptioned image]](/html/1703.07038/assets/x23.png) |
| (b) | |
![[Uncaptioned image]](/html/1703.07038/assets/x24.png) |
![[Uncaptioned image]](/html/1703.07038/assets/x25.png) |
| (c) |
 |
| (d) |
| (e) |
 |
| (f) |

(a)

(b)

(c)
We now turn our attention to computing the critical capillary number, , of the dewetting transition, as a function of , , and . We carry out a series of simulations when incrementing the capillary number, holding and fixed, until we find . We repeat the procedure for Setups A, B, and C in Tab. 1. We note that the smallest mesh size we choose here is ; such an unprecedented fine grid is only made possible owing to the adaptive mesh refinement capability of the Gerris code, that allows focusing the grid refinement at around the interface and in particular the contact line region while the grid size is free to adapt elsewhere. Fig. 13 presents as a function of for a range of for Setups A, B, and C. The symbols are direct simulation results and the solid lines are drawn to guide the eye through a set of points corresponding to the same . The error bars represent the increment in the capillary number in the procedure of finding . These results illustrate the logarithmic dependence of the dewetting transition on the mesh size for all the ranges of the contact angles that are considered here for various Setups. Moreover, as expected, for large capillary numbers, Setup A and B behave more or less the same. In addition, we show the effect of the viscosity ratio on computed ; in general, lowering the viscosity of fluid 2 results in an increase in compared to when the viscosity of both fluids is matched, with this effect being more prominent at large contact angles. As shown, a decrease in contact angle promotes the dewetting transition. In the next section, we will develop an improved understanding of the onset of this dewetting transition. We study the effects of the contact angle and the grid size on and give the scaling of it with .
5 Hydrodynamic theories of the dynamic contact line and the dewetting transition
5.1 Generalities about the asymptotic description
To interpret our numerical results, we will use a theoretical framework that extends the work in [36, 38]. The theory in [36, 38] is valid for small capillary number and equilibrium contact angles, large viscosity and density ratios, and several specific slip length models. Since our numerical approach is not based on a slip length model, we cannot apply this theory directly. However, as we shall see, it is straightforward to replace the slip length analysis, by an asymptotic matching, with the small length scale behavior, using the theory of Cox [23]. In the general physical case, it is also assumed that any microscopic physics with a sufficiently small length scale can be represented in Cox’s theory.
In the small limit, the problem is analyzed by asymptotic matching of three or four different regions:
1) A region I near the contact line, where microscopic effects dominate in the physical reality and numerical effects dominate in our simulations. The size of that region is the microscopic scale . We make no assumptions about region I except that it is limited in length scales to a microscopic scale that remains much smaller than all other relevant length scales.
2) A region II at length scales large enough that continuum mechanics and the no-slip condition on the wall hold, but close enough to the contact line that a special logarithmically-scaling solution holds, as discussed by Cox in [23]. This region starts at lengths and ends at lengths . In that region, capillary forces are balanced by viscous drag forces. The interface thus bends, and as shown below, it has a curvature proportional to where is the distance to the contact line.
3) An outer region III, where viscous effects are negligible and surface tension balances gravity. This region scales like the capillary length . The solution in region III is the famous static meniscus solution [53]. We define the “apparent contact angle” as the angle seen in meniscus variables that is on scales such that . The meniscus solution quadrature gives the curvature
| (8) |
The general properties of the solution can be seen as follows at small capillary numbers. At the overlap of region I and region II the angle is the microscopic angle noted . It is often assumed that it is the equilibrium contact angle, but this is true only if the microscopic physics in region I are close to equilibrium. It is quite possible to assume that differs from the equilibrium angle in a manner determined by experiments, or by microscopic theories of the physics beyond the scope of this paper. For small capillary numbers, the bending in region II is sufficiently small that the angle changes little from region I to region III and thus . This condition closes the problem and gives in particular the height of the contact line . As the capillary number increases, the curvature and the bending increase in region II. The apparent contact angle decreases below while the height of the contact line increases.
It can thus be hypothesized that the critical condition for dewetting can be expressed as the condition of vanishing apparent contact angle. For a vertical plate, this means that the inner solution in region II matches into the outer solution in the meniscus region III with a vertical slope or yet that at the inflection point, the slope vanishes. Thus a region IV, overlapping regions II and III is found in which the slope is small. This hypothesis is implicit in the works of Derjaguin [42] and Landau and Levich [41] since their assumption of a lubrication theory implies a near-vertical slope in the matching region, the existence of region IV and a zero apparent contact angle. Moreover Landau and Levich [41] have shown that in region IV and at small capillary number, the film thickness behaves as , the famed Landau-Levich film thickness.
This hypothesis of transition at zero apparent contact angle has been considered by Eggers in the small angle case [36, 38], but has not yet been investigated for large angles or when the free-surface model has to be replaced by an interfacial model at non-vanishing viscosity ratio .
The matched asymptotics allowing to connect the regions defined above are valid upon the hypothesis that a parameter is small enough. This parameter is not simply as the Landau-Levich film scaling would seem to imply, but where is the function introduced in [23] and defined below. It can also be shown that at the transition, an equivalent estimate of the small parameter is . This value of is not exceedingly small, which has consequences which will be spelled out below.
5.2 The theory of Cox
We thus focus on the analysis of region II. In this region, the wedge solution of Huh & Scriven is assumed [20]. It is then possible to use it as done by Cox [23] to obtain the variation of pressure in the wedge and thus by Laplace’s law the variation of curvature. After integration, one may obtain the variation of slope. Cox’s solution in his “intermediate region” identified with our region II, from his Eqs. (7.13) and (7.18) is
| (9) |
where is a characteristic scale for microscopic effects, is the equilibrium angle in agreement with our assumption above for the limit, and are defined below, and is the viscosity ratio. is an integration constant that is obtained by matching with region I and thus depends on region I characteristics. Since we actually write the first order of an expansion in small , higher-order terms exist whose form is however unknown to the authors.
Finally the functions and are given by
| (10) |
and
In some specific asymptotic limits, special forms of can be used. For and as in thin liquid film in air situations, it can be shown that
| (11) |
Also, Sheng and Zhou [54] show that when and . In this work, we account for using Eq. (10) directly.
A more convenient notation is to introduce a “microscopic length scale”
| (12) |
as in Voinov [43, 55] so that in the general case
| (13) |
The microscopic length scale encompasses the properties of the microscopic region. Thus the effect of the corresponding small scales can be summarized with two parameters and .
Eq. (9) is very attractive because it provides a universal description giving the dependence of on , to the leading order, without any specification of the microscopic physics or any necessity to calculate the details of the macroscopic flow in the outer region. In this paper, we also claim that it is valid when the concept of “microscopic physics” is replaced by “numerical scheme”; the numerical scheme introducing deviations from the continuum equations at scales of order .
The microscopic length can be obtained in a number of special cases, or by dimensional analysis. Eggers [36] has assumed several slip length models. For the Navier-slip model, and using our notations above,
| (14) |
where is the slip length. Using lubrication theory valid for small slopes or angles, one obtains the equation [56]
| (15) |
where we introduced a variable that measures distance away from the contact line along the direction of the solid surface. We also note that is the local thickness of the film and we use the notation , , etc.. A solution of Eq. (15) can be obtained [57] in the form
| (16) |
where
| (17) |
(Notice that equation (33) of [57] misses the above factor of because of an incorrect derivation from equation (32) of [57]). This can be compared to the solution obtained by Cox in [23]. From Eq. (11) and Eq. (13), using the fact that for small angles and , one obtains
| (18) |
For , the above yields again Eq. (16). Thus the length scale can be written as
| (19) |
where is a gauge function depending on equal, at first order, to
| (20) |
Different slip-length models give different gauge functions . Moreover, alternate models of the microscopic physics beyond slip length, such as Van der Waals forces or phase field, would still result in an expression of the form Eq. (13), with having a dependence on and other microscopic model parameters to be determined.
In the numerical case, the equivalent expression for the microscopic length scale in region II is
| (21) |
where the gauge function may depend on , and the details of the numerical implementation such as the number of shear bands , any specific numerical slip etc. In what follows, for simplicity, we shall drop the “num” subscript and leave the dependence of on the viscosity ratio implicit. Comparing expressions (19) and (21) leads to the relation
| (22) |
which shows that the numerical model can be interpreted as having an effective slip. Using the definition of the numerical gauge function Eq. (21), Cox’s solution (Eq. (9)) can be rewritten in the form
| (23) |
This form is verified numerically in the next Section.
5.3 Numerical verification of Cox’s theory and matched asymptotics
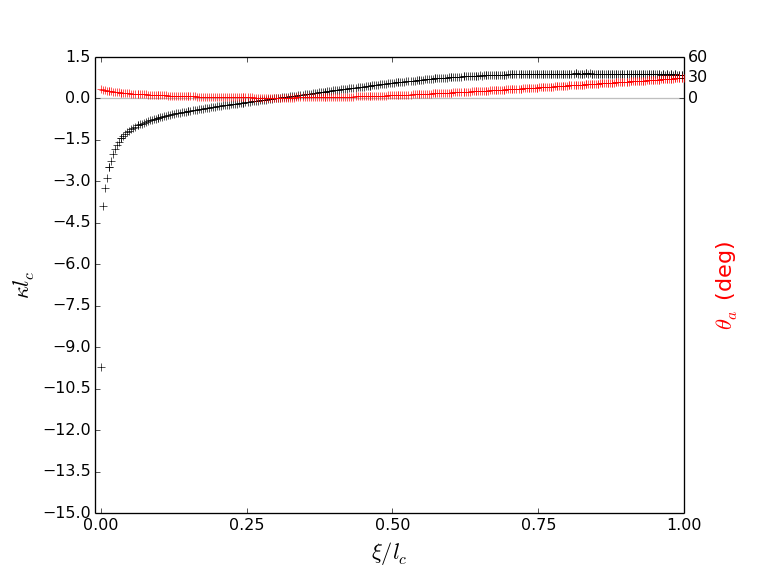
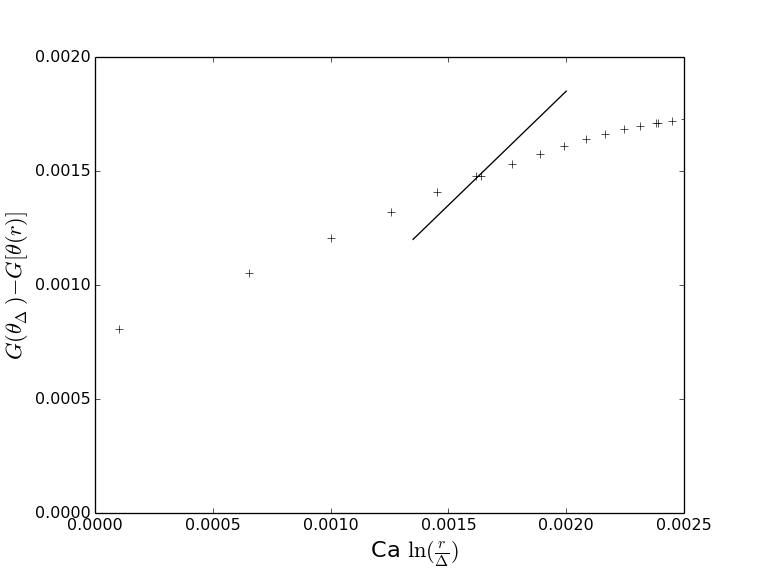
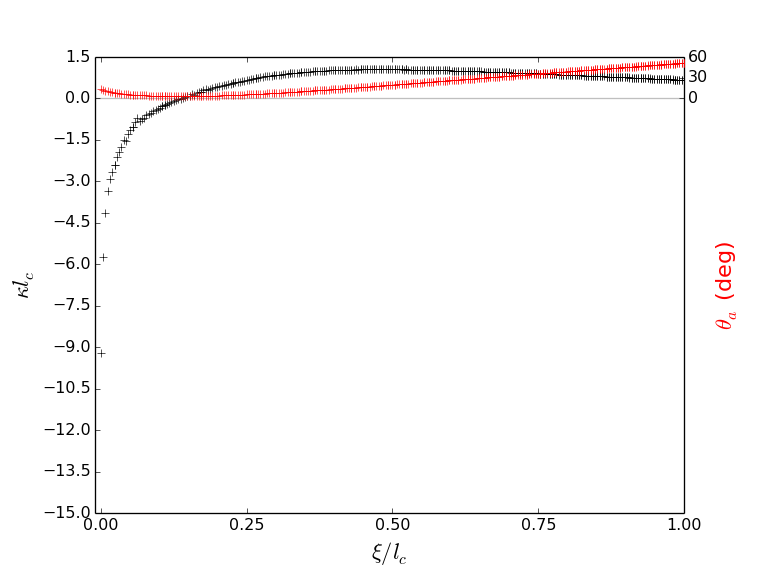
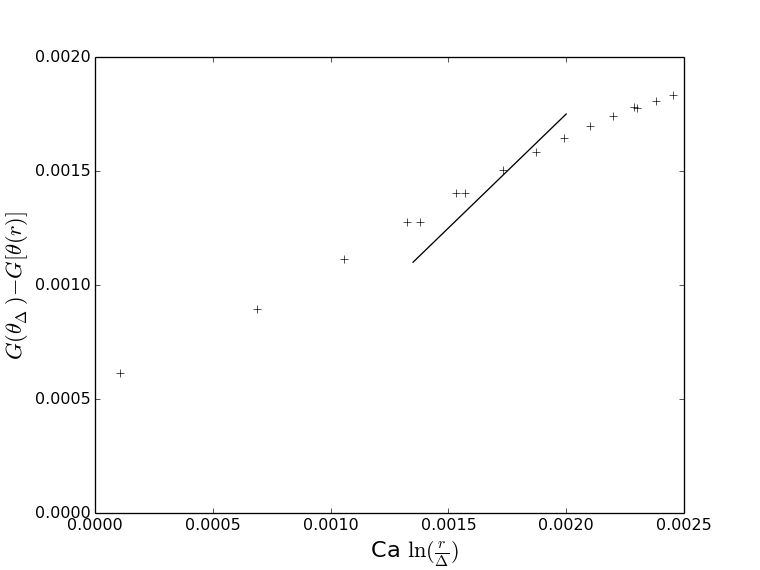
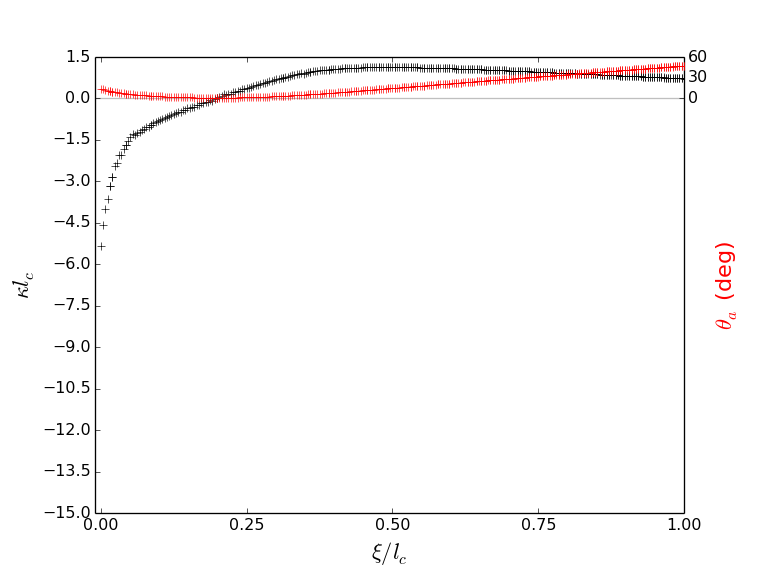
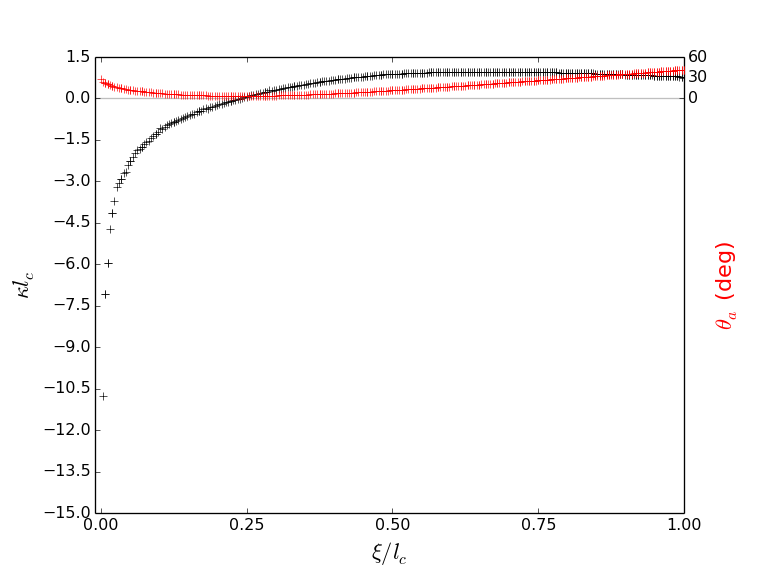
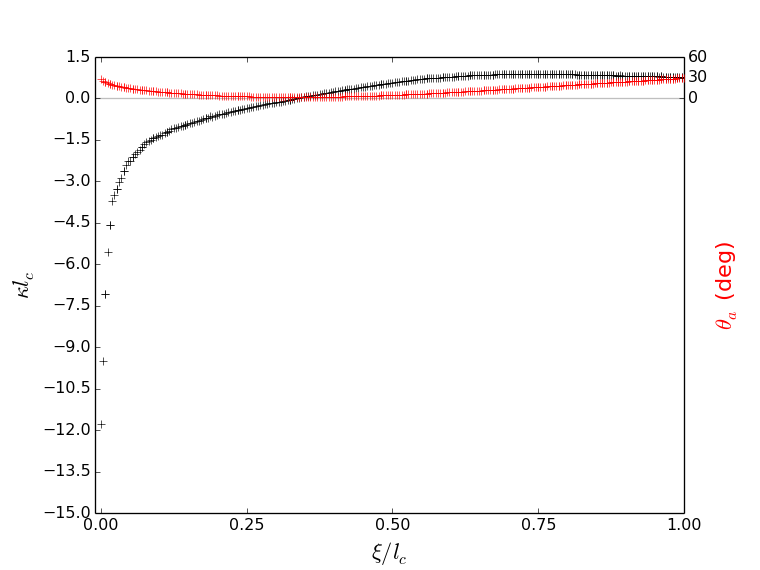
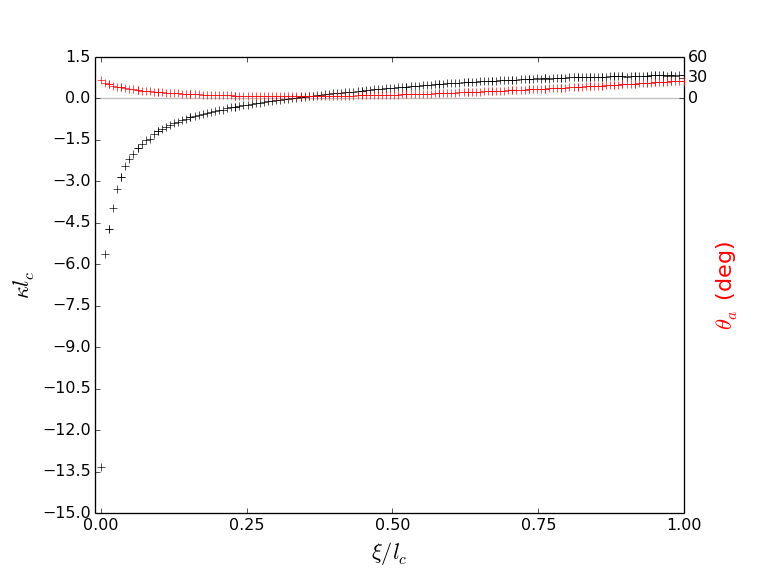
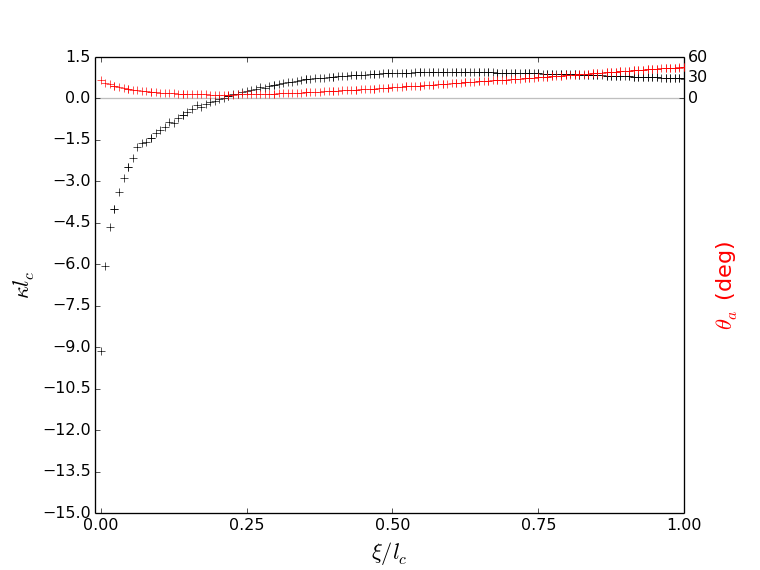
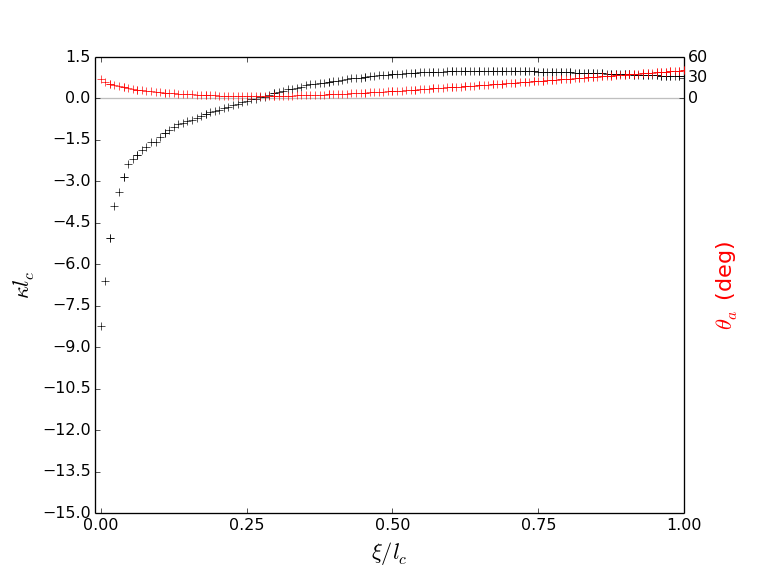
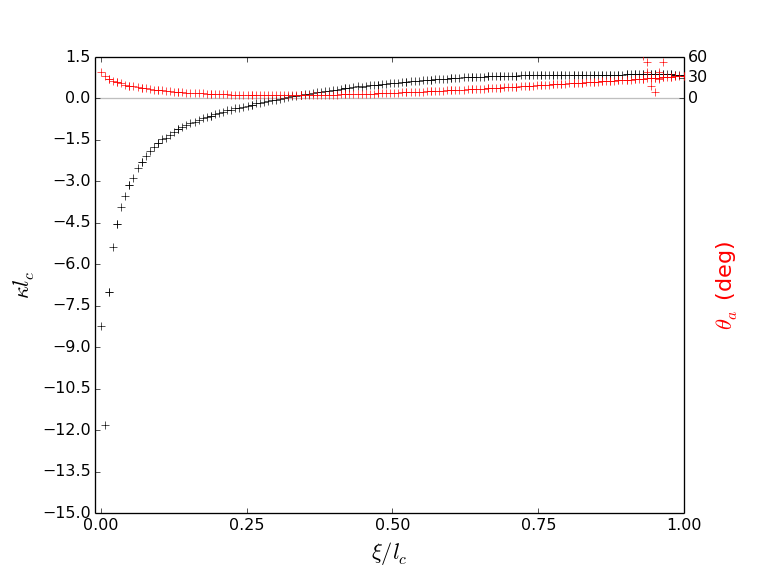
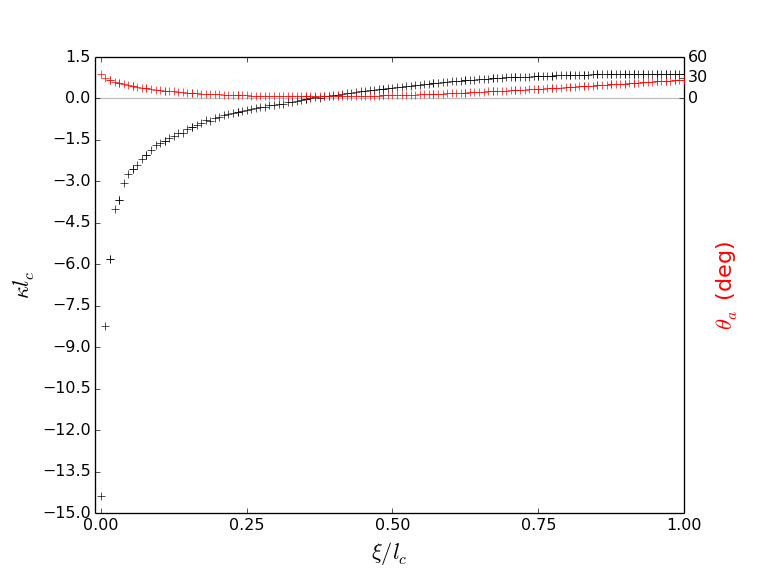
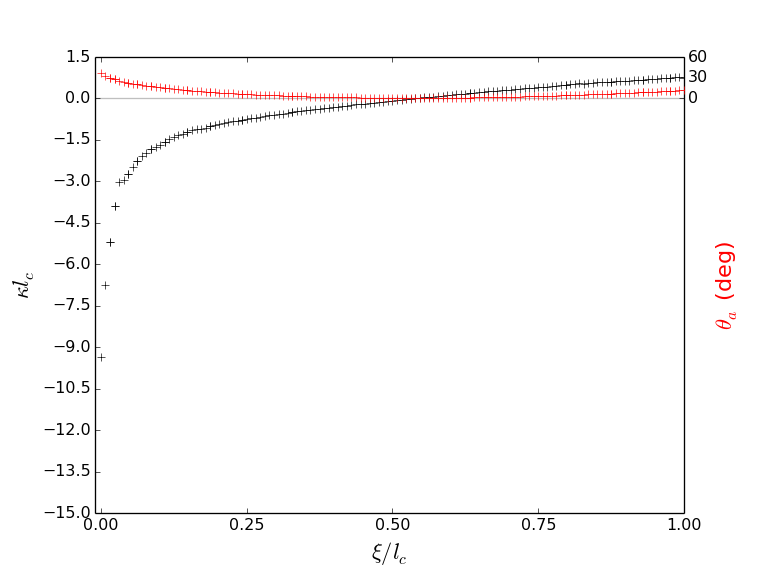
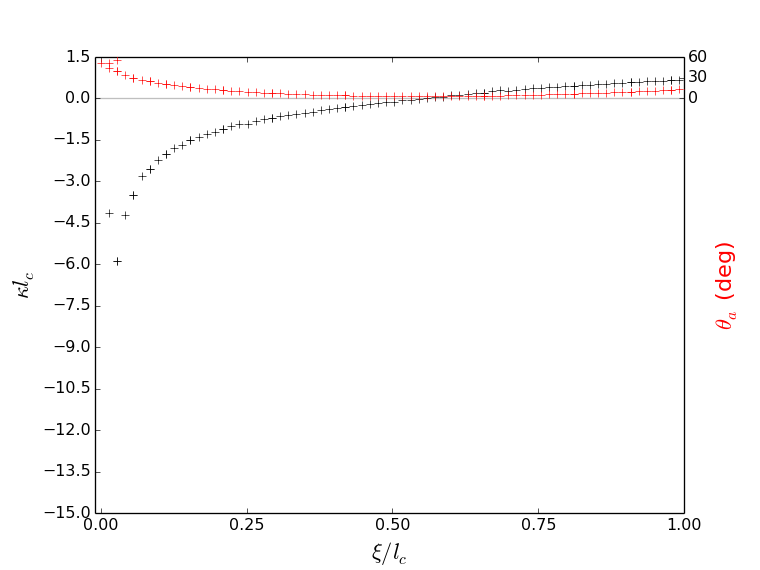
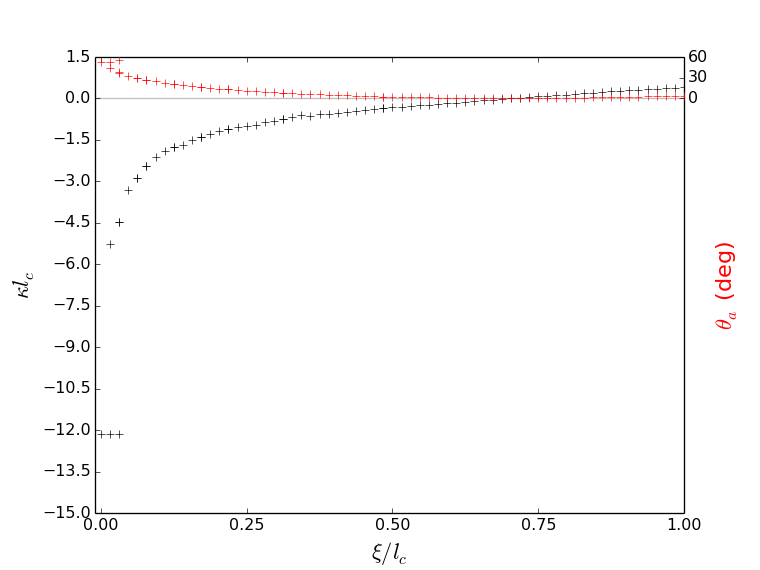
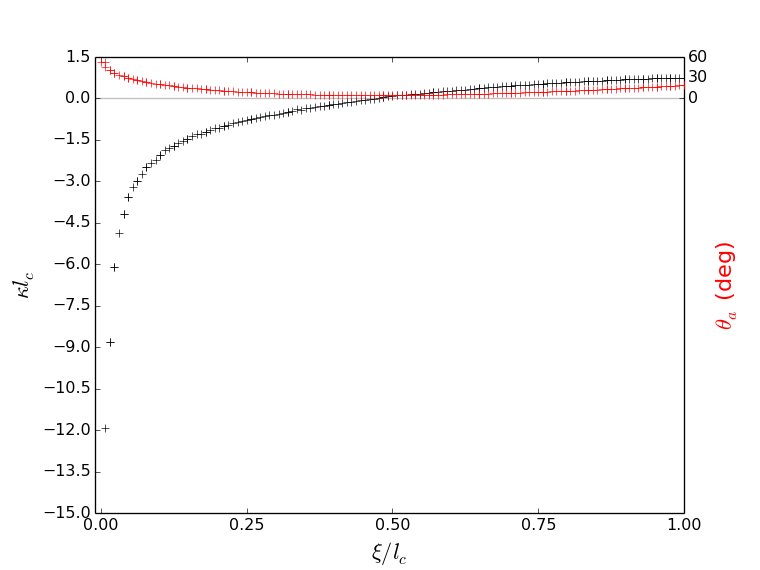
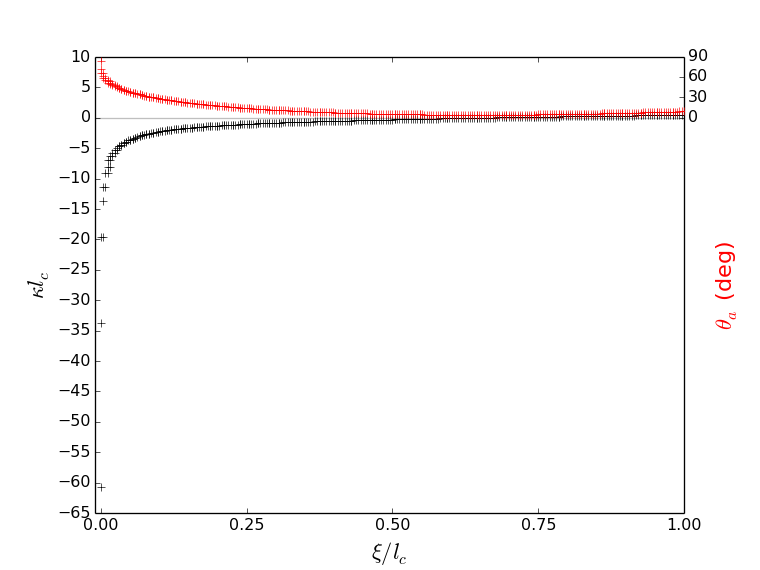
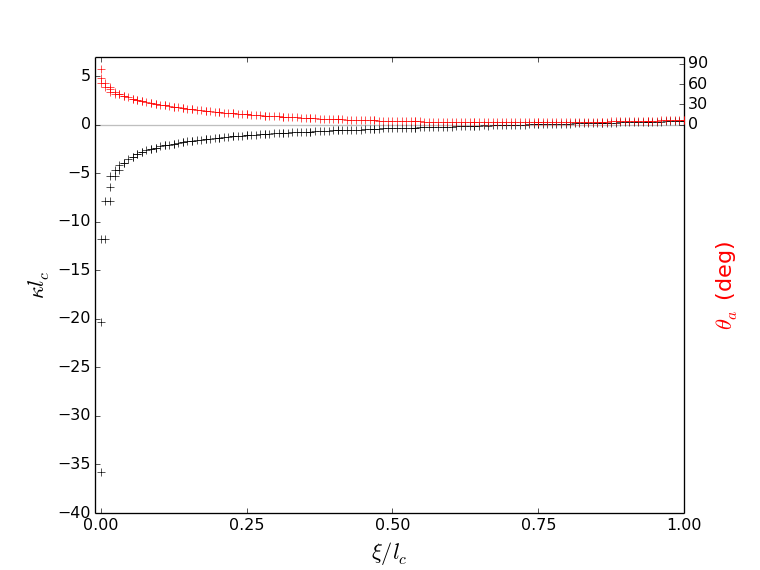
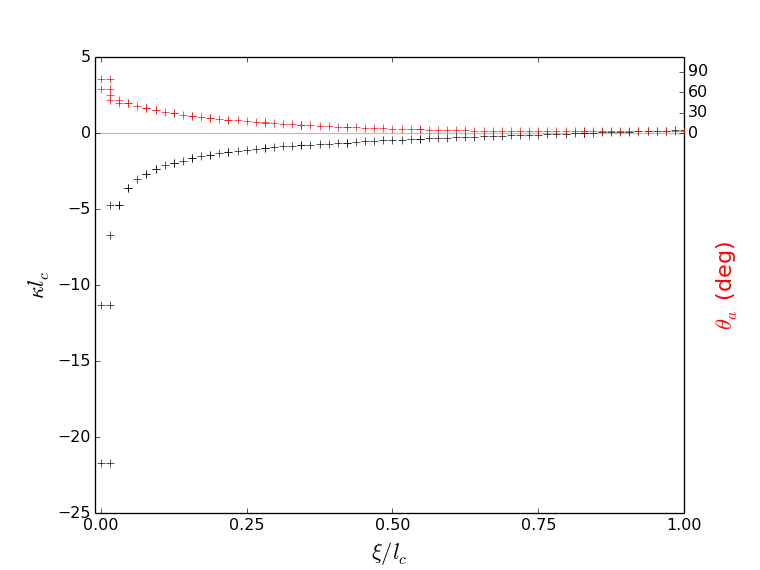
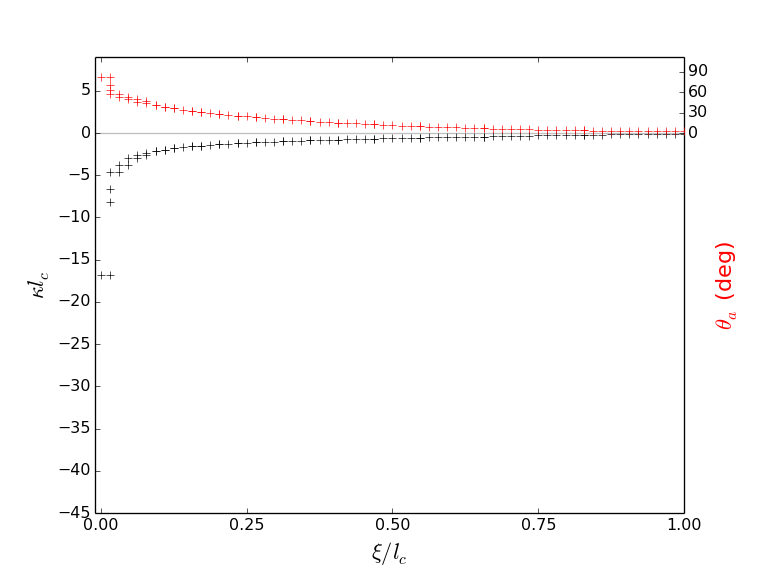
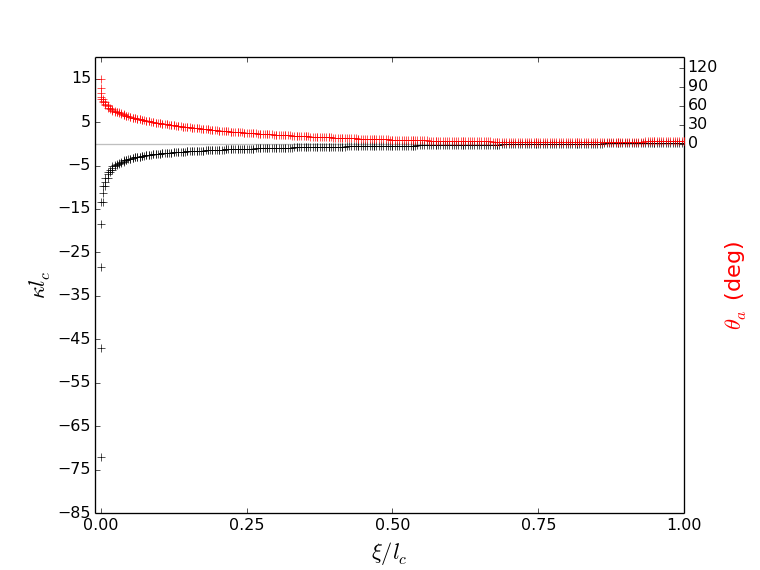
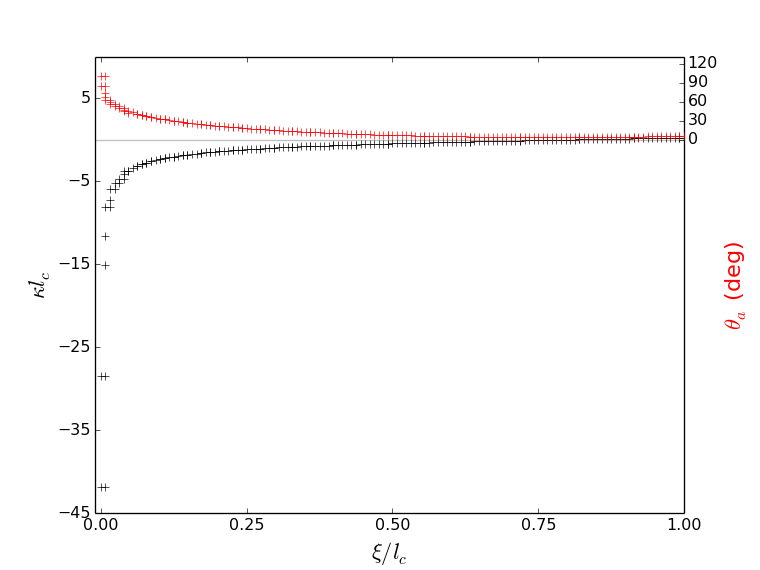
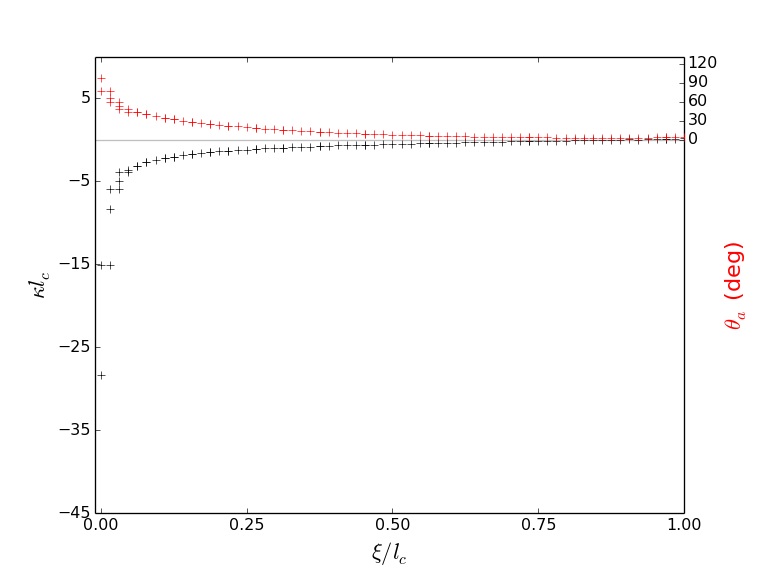
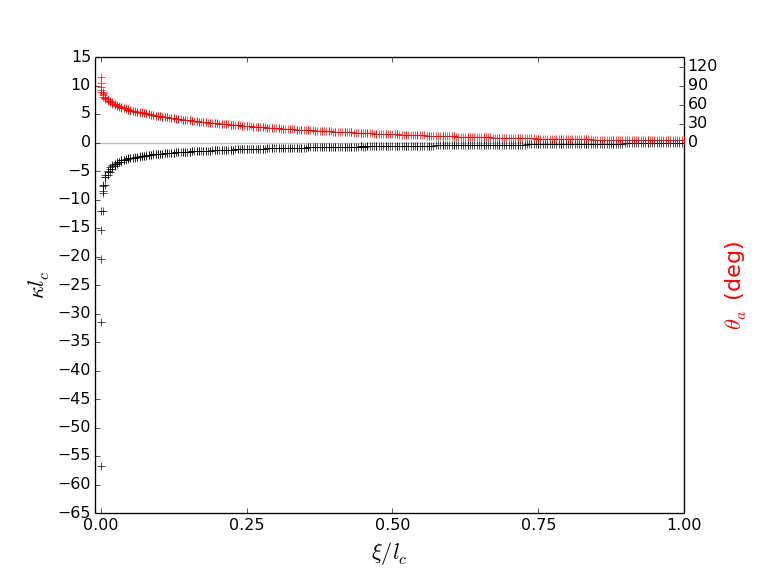
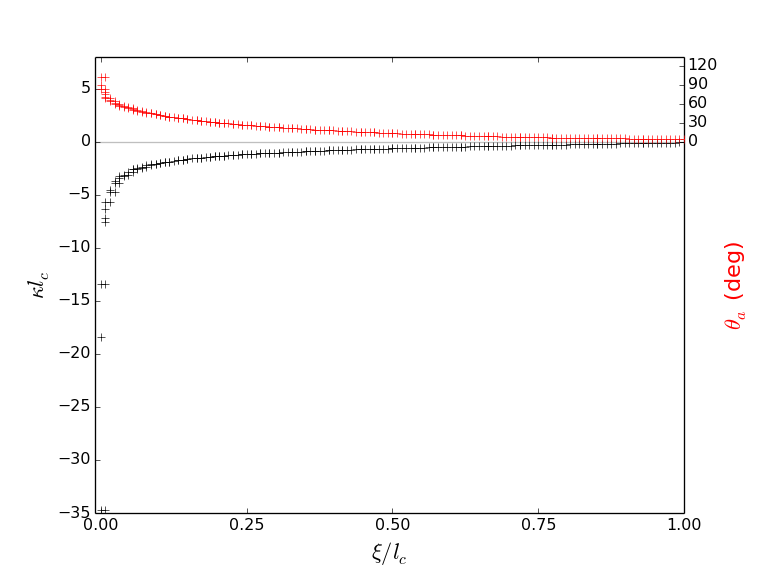
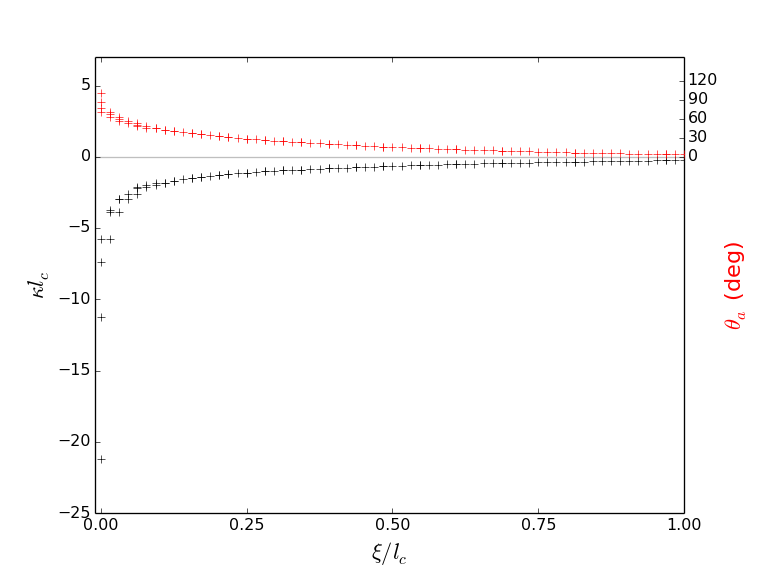
We next present the numerical results of computed curvature and interface shapes, for all the three Setups A, B, and C, and compare the results with the theoretical predictions presented in previous section. We consider and . In what follows, we show that in general, the curvature is negative and higher close to the contact line and it decreases away from the contact to zero, where it then turns and becomes positive to assume the curvature of the meniscus and eventually approaches the zero curvature of the flat film far away from the wall. This means that the curvature effects are more prominent close to the contact line, and that there always exists an inflection point. We show that interface bending becomes significant as we increase the contact angle and/or decrease the mesh size. The divergence of the curvature near the contact line is as expected and discussed in the previous section. We also present the interface apparent slope along with the curvature to enlighten the connection of the interface apparent zero slope with the presence of an inflection point. Indeed, we notice that the angle is near zero at inflection point when the curvature vanishes, as assumed in Sec. 5.1. The interface slope results also confirm that we approach the imposed numerical contact angle, , as we approach the contact line. We nondimensionalize the curvature by and present the results as a function of the vertical height from the contact line, i.e. , (see Fig. 1 for the illustration of the distance ).
 |
 |
| (a) | (b) |
 |
 |
| (c) | (d) |
 |
 |
| (e) | (f) |
 |
 |
| (a) | (b) |
 |
 |
| (c) | (d) |
 |
 |
| (a) | (b) |
 |
 |
| (c) | (d) |
 |
 |
| (e) | (f) |
 |
 |
| (a) | (b) |
 |
 |
| (c) | (d) |
 |
 |
| (e) | (f) |
 |
 |
| (a) | (b) |
 |
 |
| (c) | (d) |
 |
 |
| (e) | (f) |
 |
 |
| (a) | (b) |
 |
 |
| (c) | (d) |
 |
 |
| (e) | (f) |
 |
 |
| (a) | (b) |
 |
 |
| (c) | (d) |
 |
 |
| (e) | (f) |
 |
 |
| (a) | (b) |
 |
 |
| (c) | (d) |
 |
 |
| (e) | (f) |
 |
 |
| (a) | (b) |
 |
 |
| (c) | (d) |
 |
 |
| (e) | (f) |
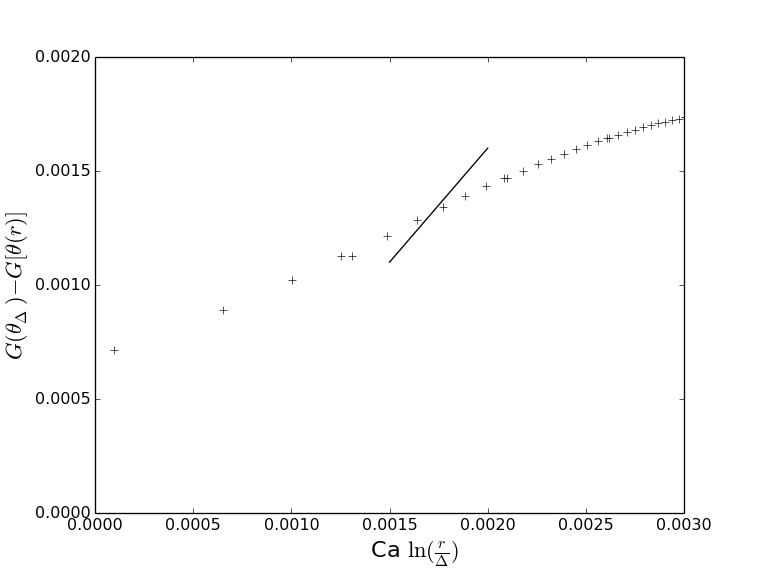
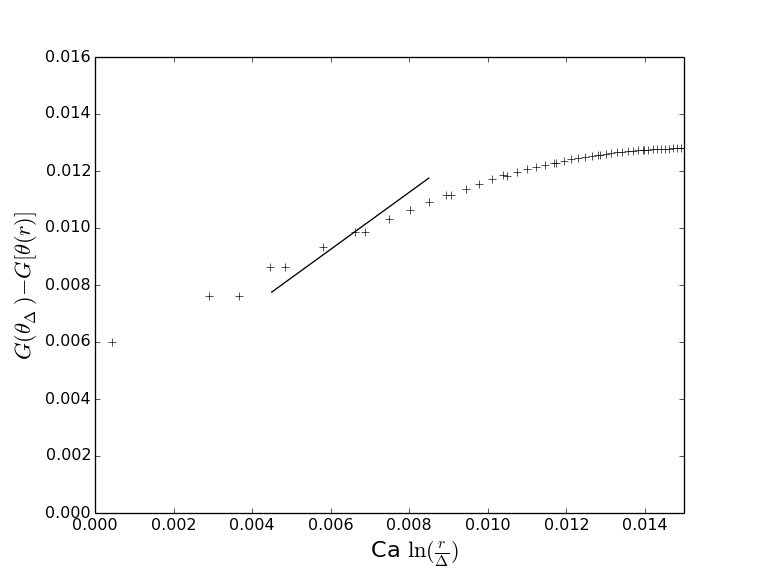
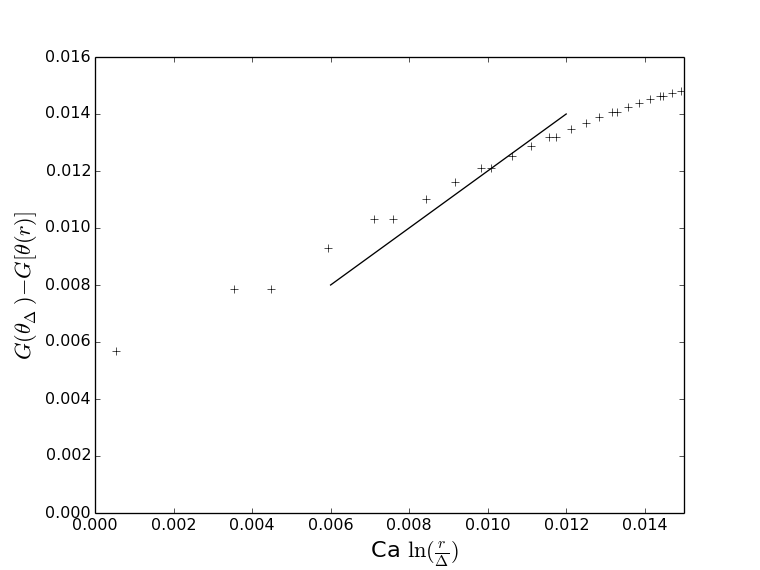
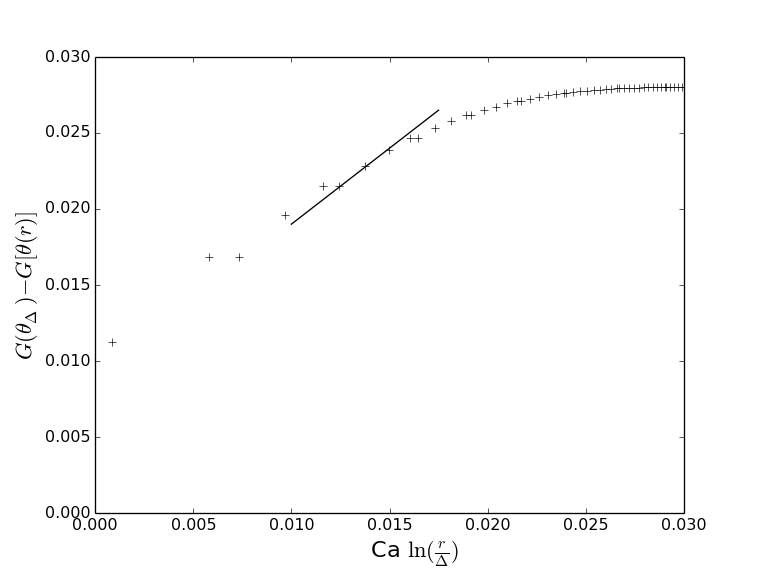
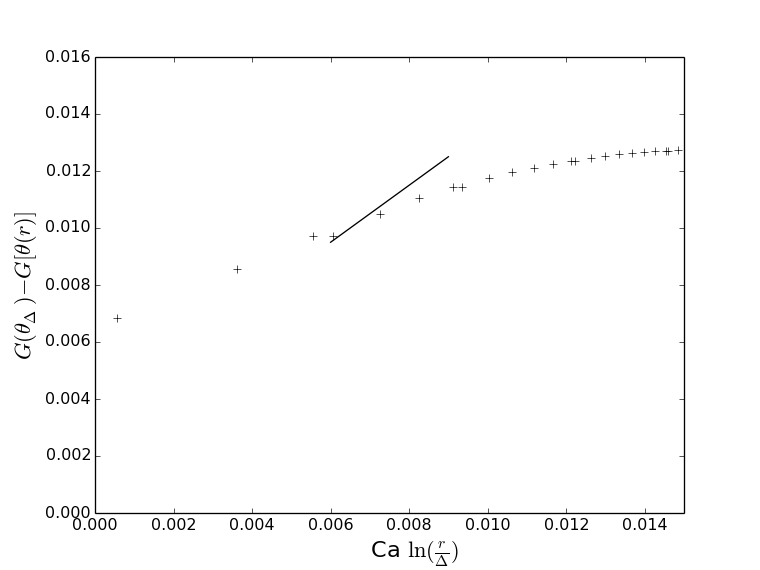
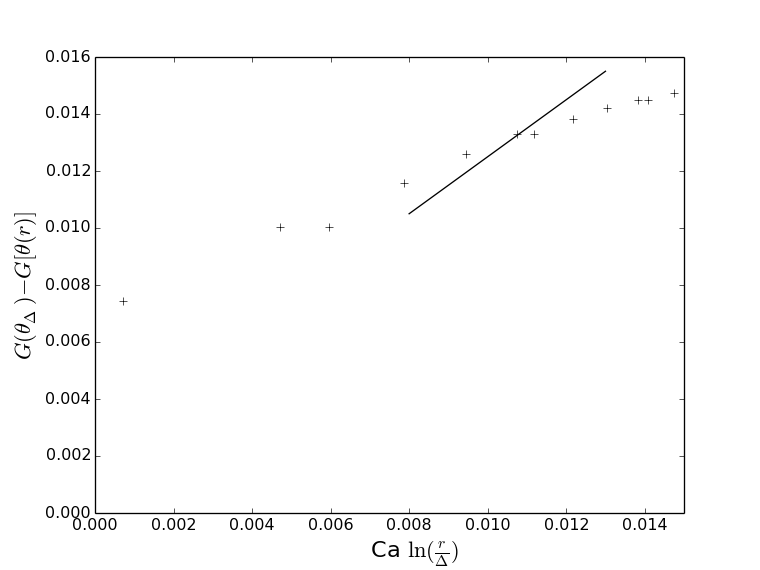
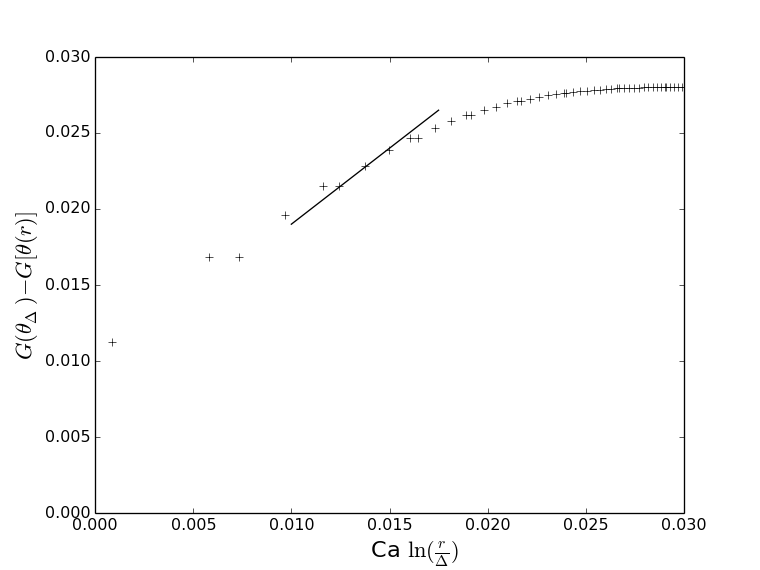
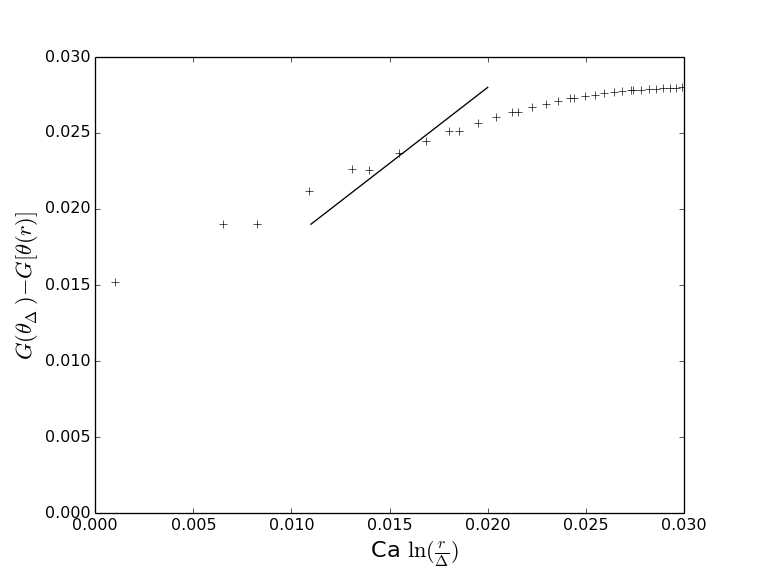
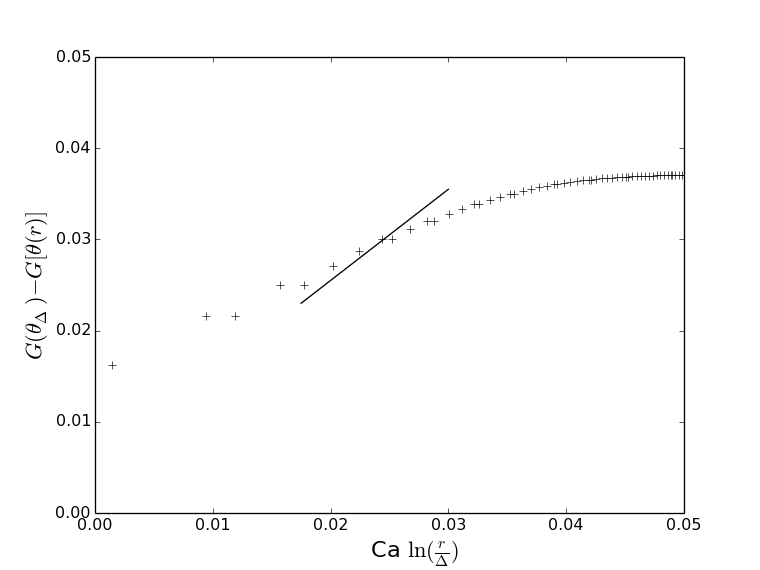
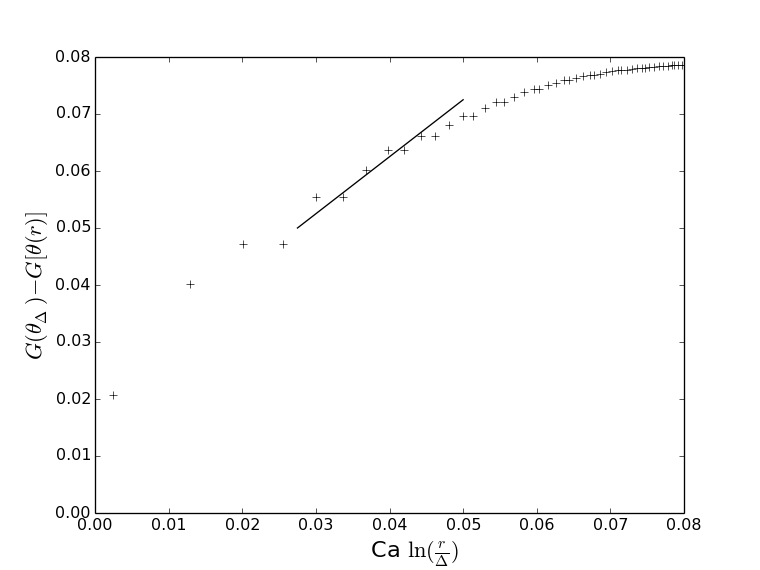
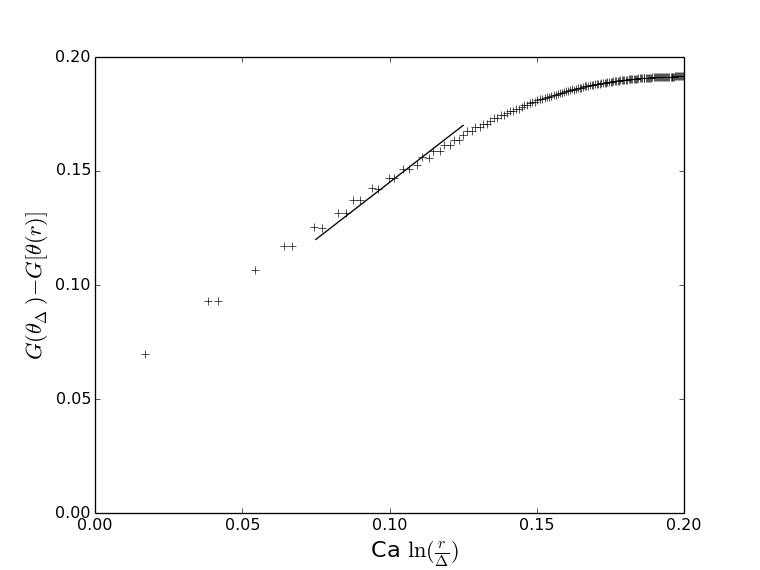
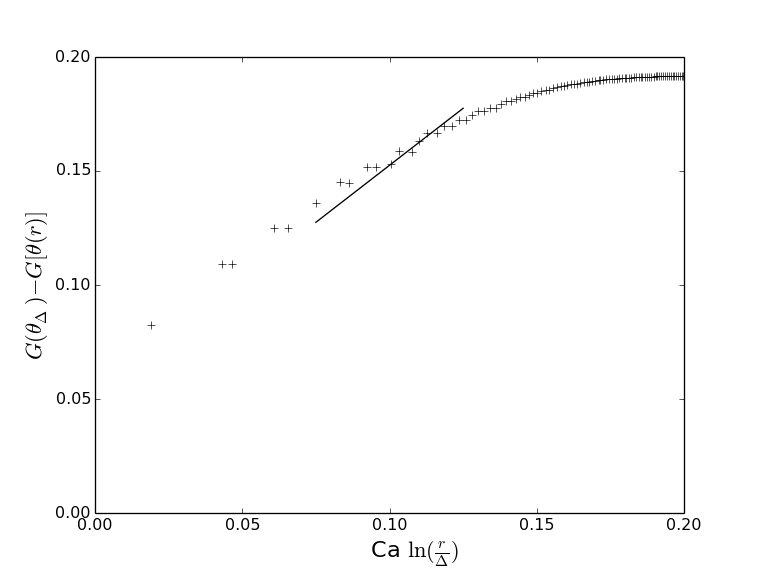
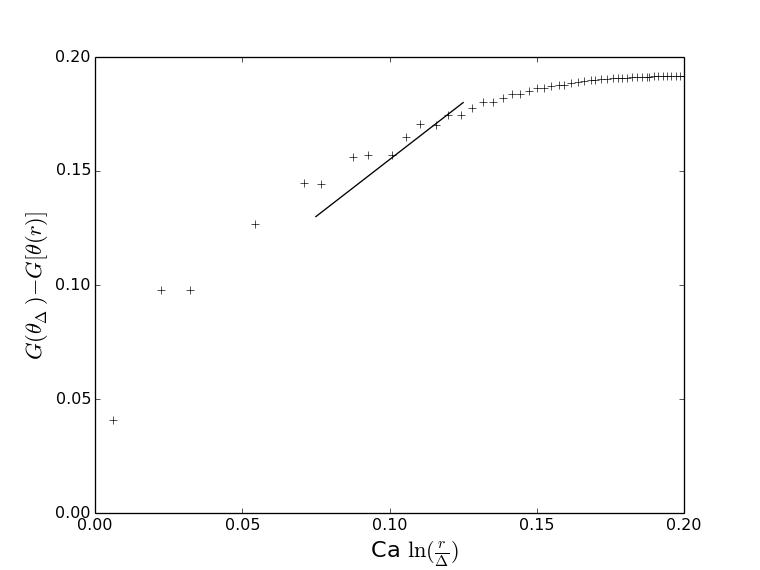
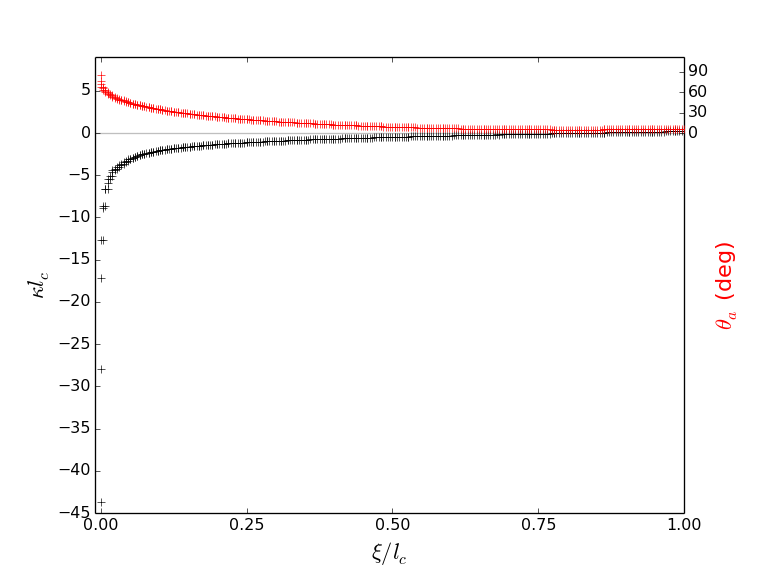
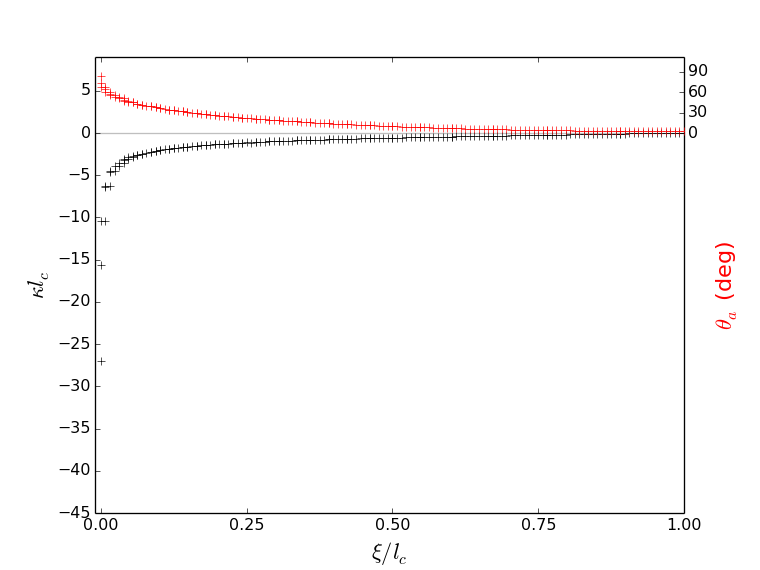
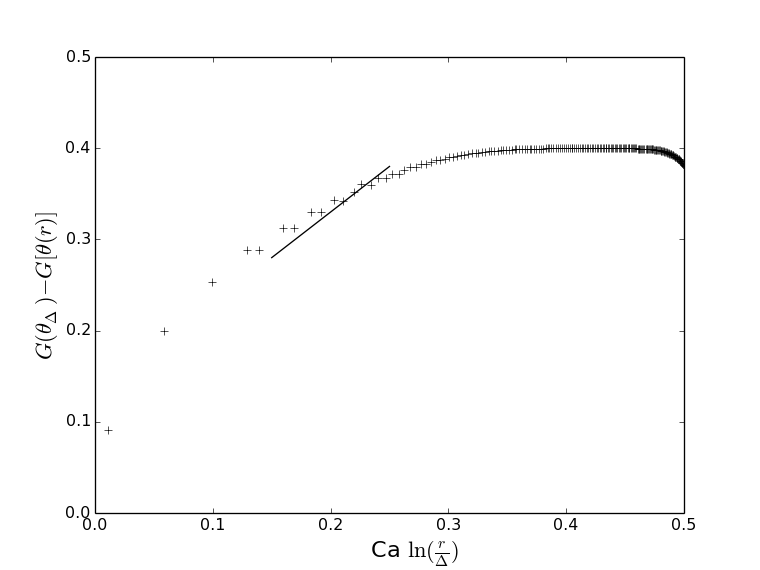
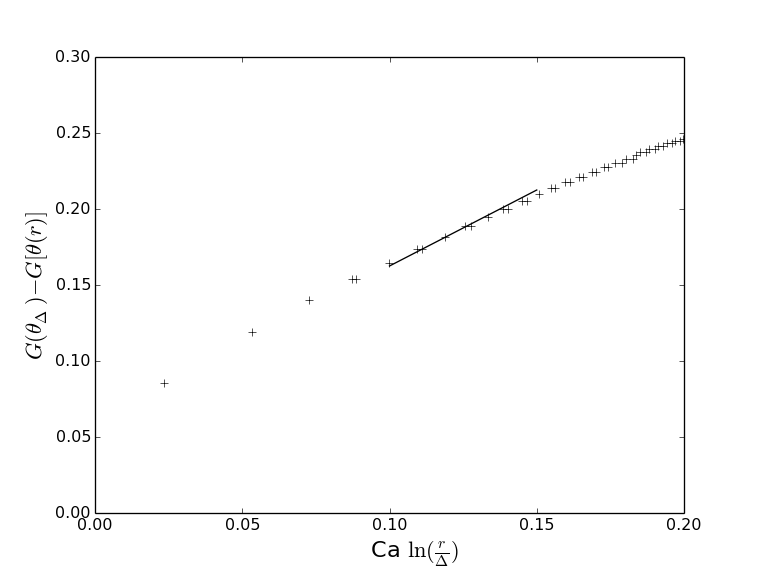
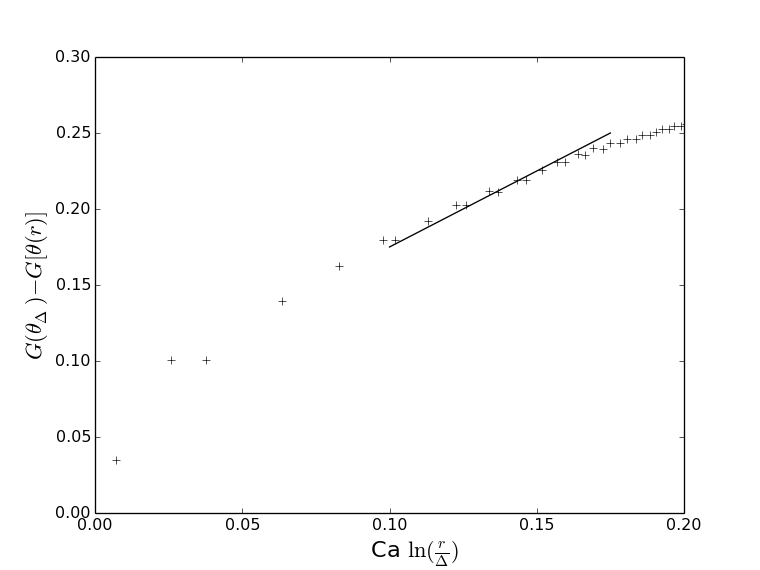
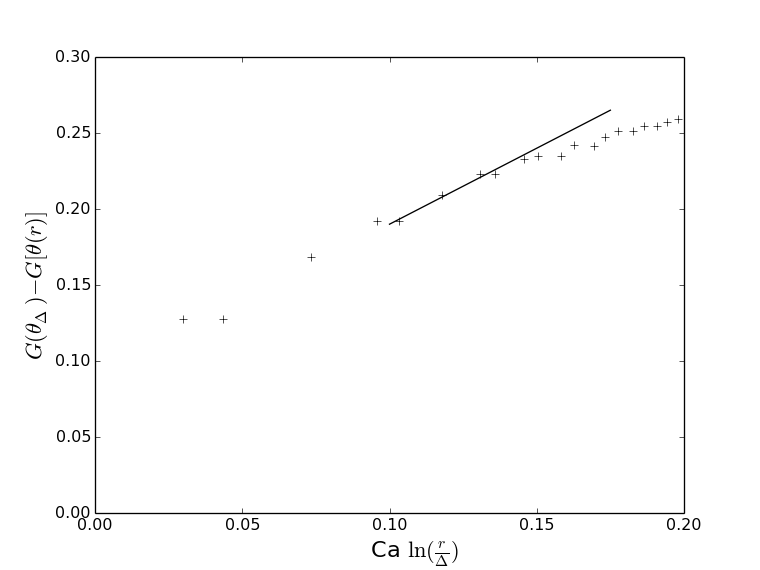
Figs. 14 to 22 depict the curvature plots (black symbols) along with the angle (red symbols) that the interface makes with the substrate as a function of . We find that the maximum curvature is obtained at the contact line and that this maximum curvature increases with decreasing the mesh size. As shown, there is a substantial bending of the interface for ; for example, for , curvature is tending to zero around . However, the maximum curvature does not reach the asymptotic value of when the asymptotic parameter is not small enough. As shown, for small angles, where the smallness of is guaranteed, the maximum curvature approaches . Figs. 14 to Figs. 22 also show that the angle is indeed near zero at inflection point when the curvature vanishes as assumed in Sec. 5.1.
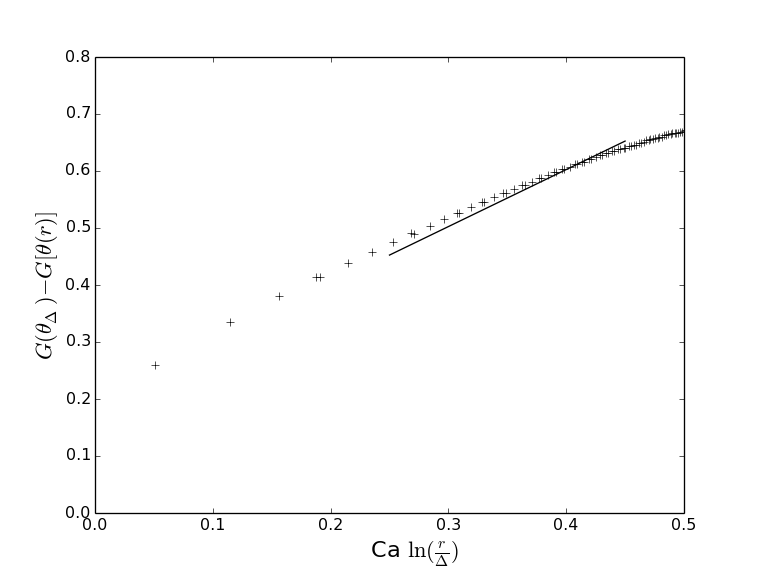
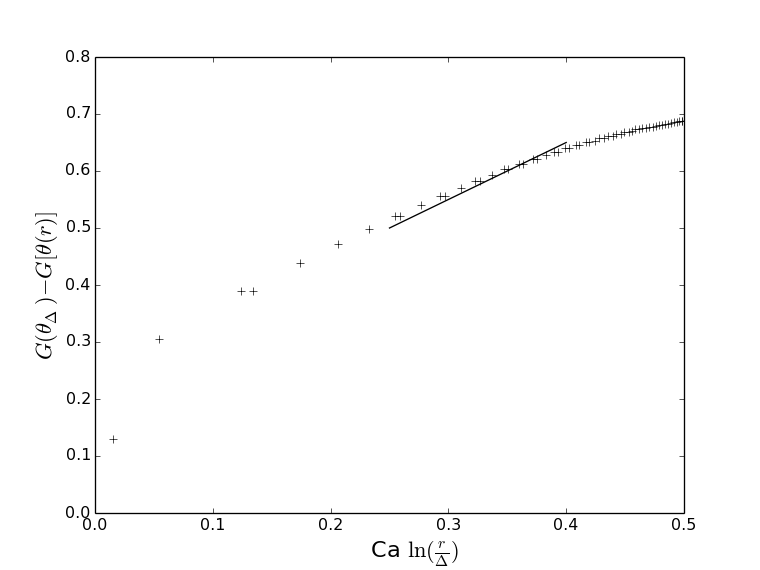
We also compare the computed interface slope close to the contact line region with the prediction of the Cox’s theory by plotting relation (23) on Figs. 14 to 22. We plot the computed (black symbols) versus , using the computed interface slope, , at the distance , where and are the and coordinates of the cell center of an interfacial cell relative to the contact line coordinates. Figs. 14 to 22 also show the comparison of the computed (black symbols) versus with the prediction of Eq. (23) using the best fitted value of (solid lines). However, we also find three to four aberrant grid points at the smallest values of corresponding probably to the limited accuracy of our numerical method at the grid scale near the contact line. Moreover, if the relation (23) from the Cox-Voinov theory were exact, the slope of versus should be unity. In fact, there is a deviation from unity which is largest at small angles ( and ) and smallest at large angles. This is particularly significant since at small angles and small the theory has a simple derivation from lubrication theory and the assumption of a parabolic flow in the thin liquid wedge. A possible explanation is that this theoretical flow is not well approximated by the numerical method. Indeed, for a small angle, there is a large region where there are very few grid points across the thin liquid wedge, with the boundary conditions on the solid and the free surface being imperfectly approximated by the finite volume method and the interpolations used for viscous stresses. This type of fit thus appears to be a good test of the accuracy of the method in the vicinity of the contact line.
The fitting also yields a best value for in the range where Cox’s theory is expected to be asymptotically valid . The expected upper limit will be derived below. We consider the results for and show that the fitted values of are similar and thus approximately independent of when is maintained at criticality. We extend the discussion on these results next.
 |
 |
| (a) | (b) |
 |
 |
| (c) | (d) |
 |
 |
| (e) | (f) |
 |
 |
| (g) | (h) |
 |
|
| (i) |
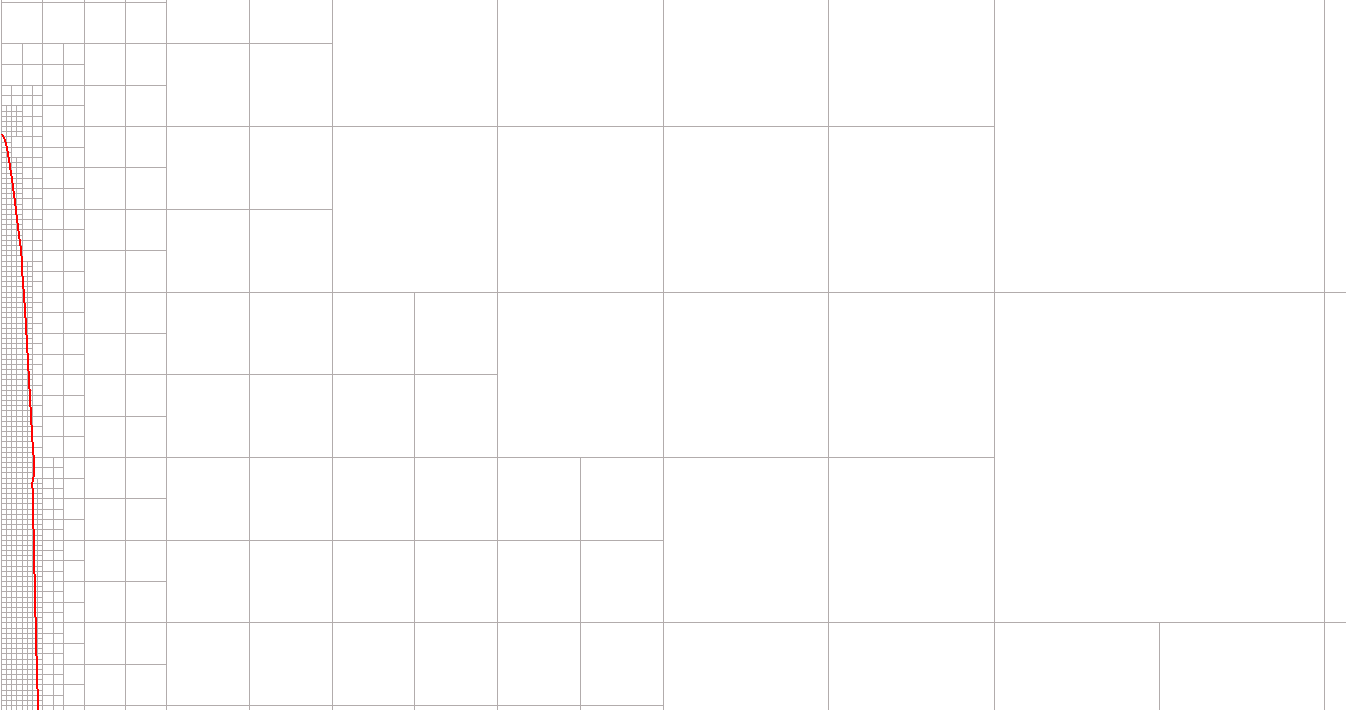
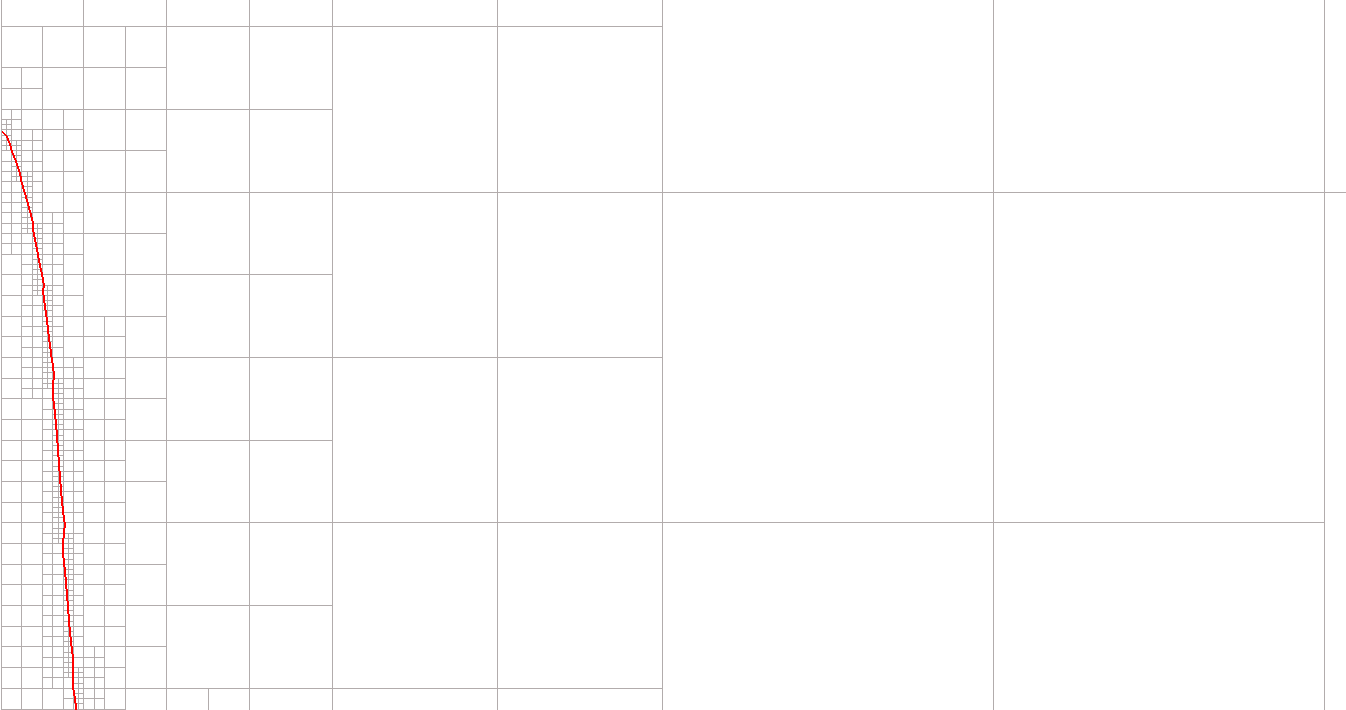
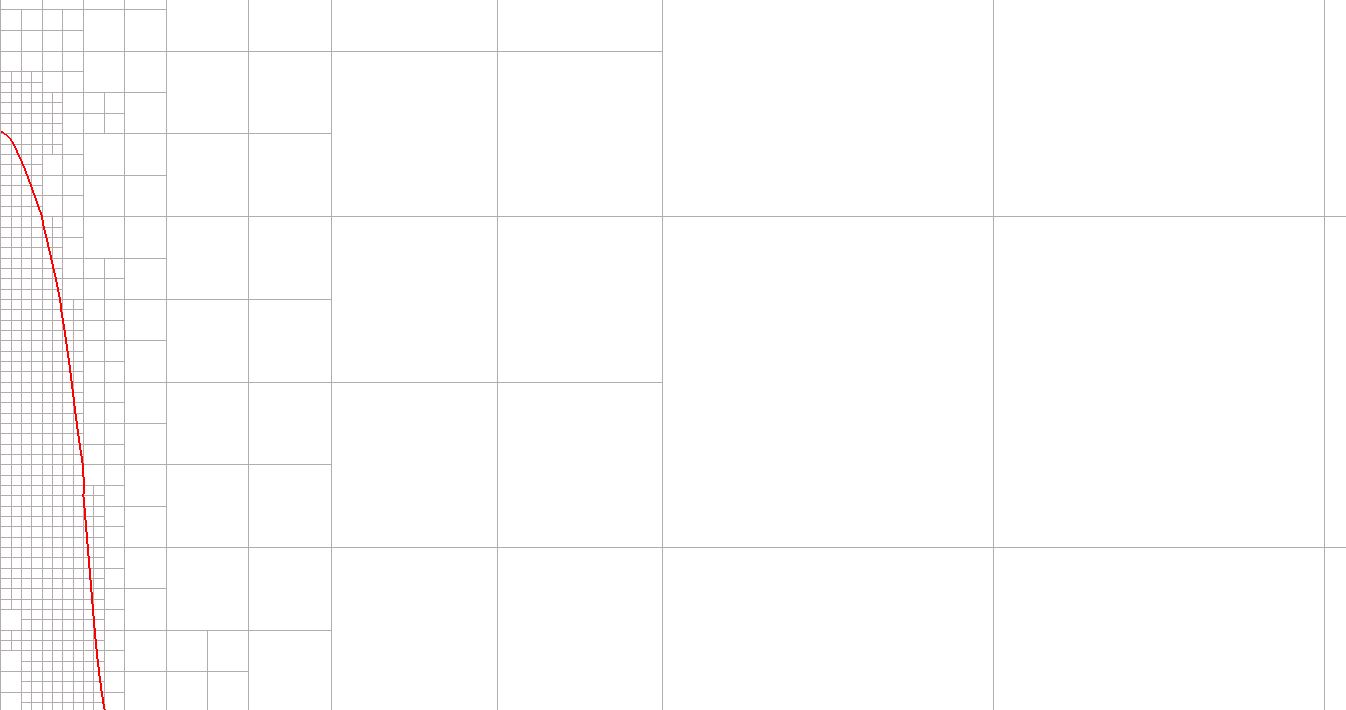
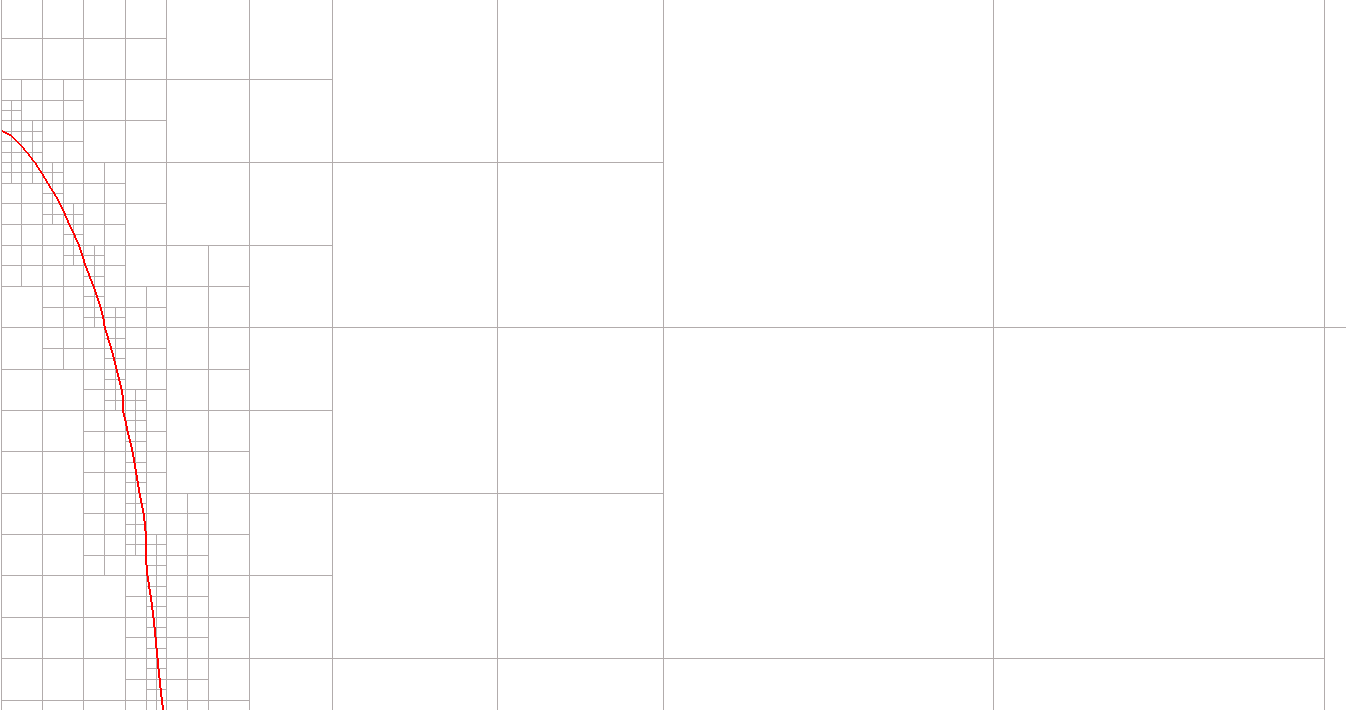
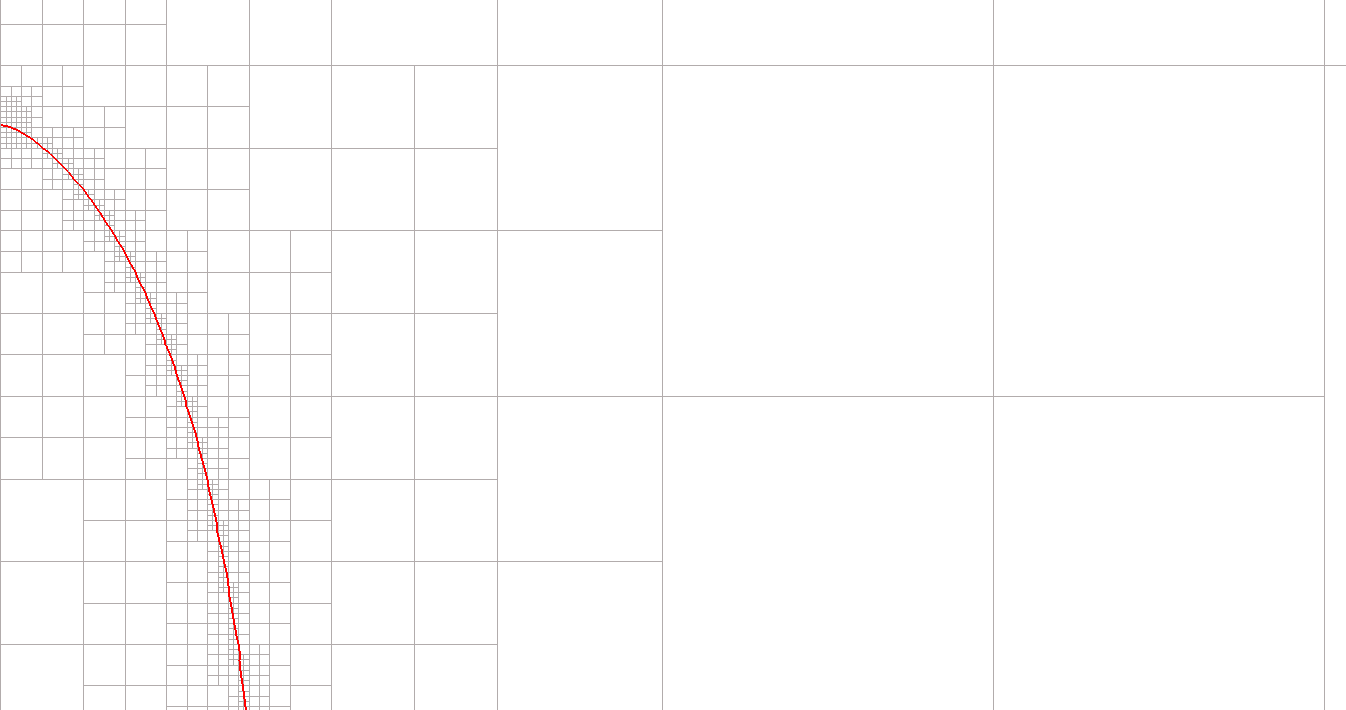
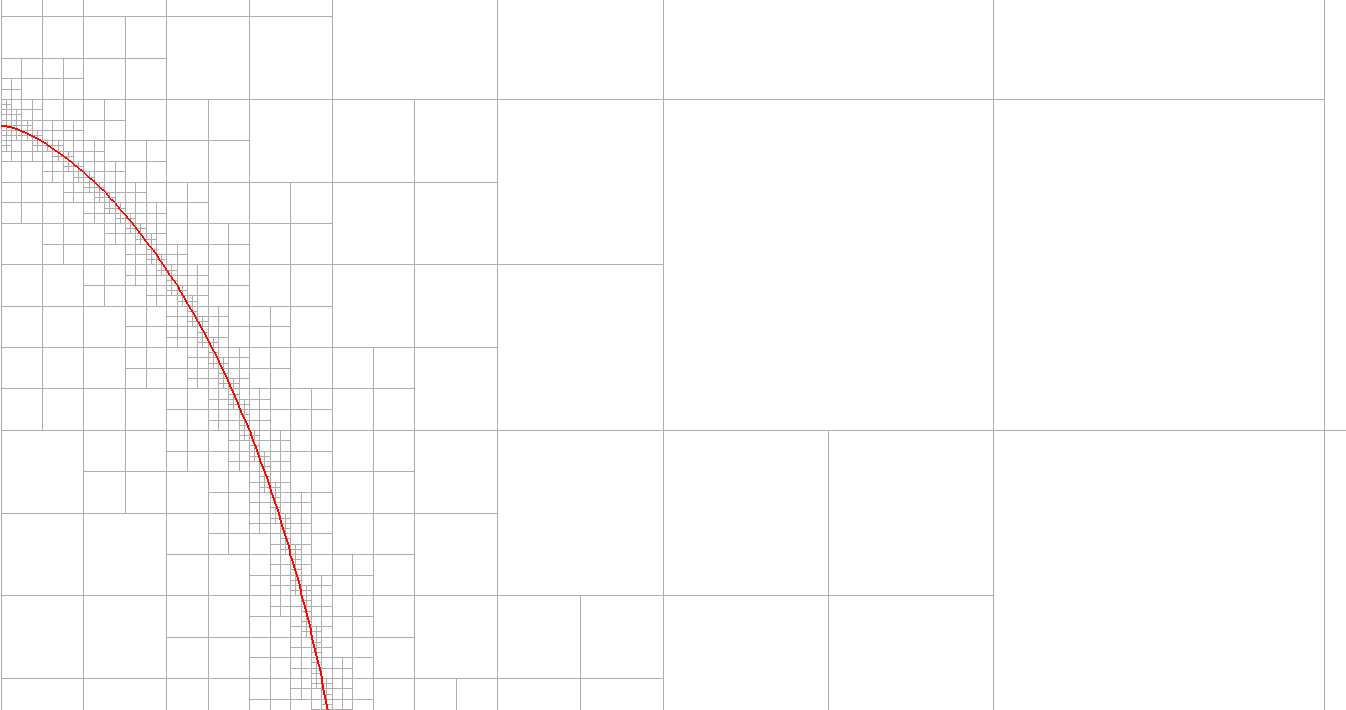
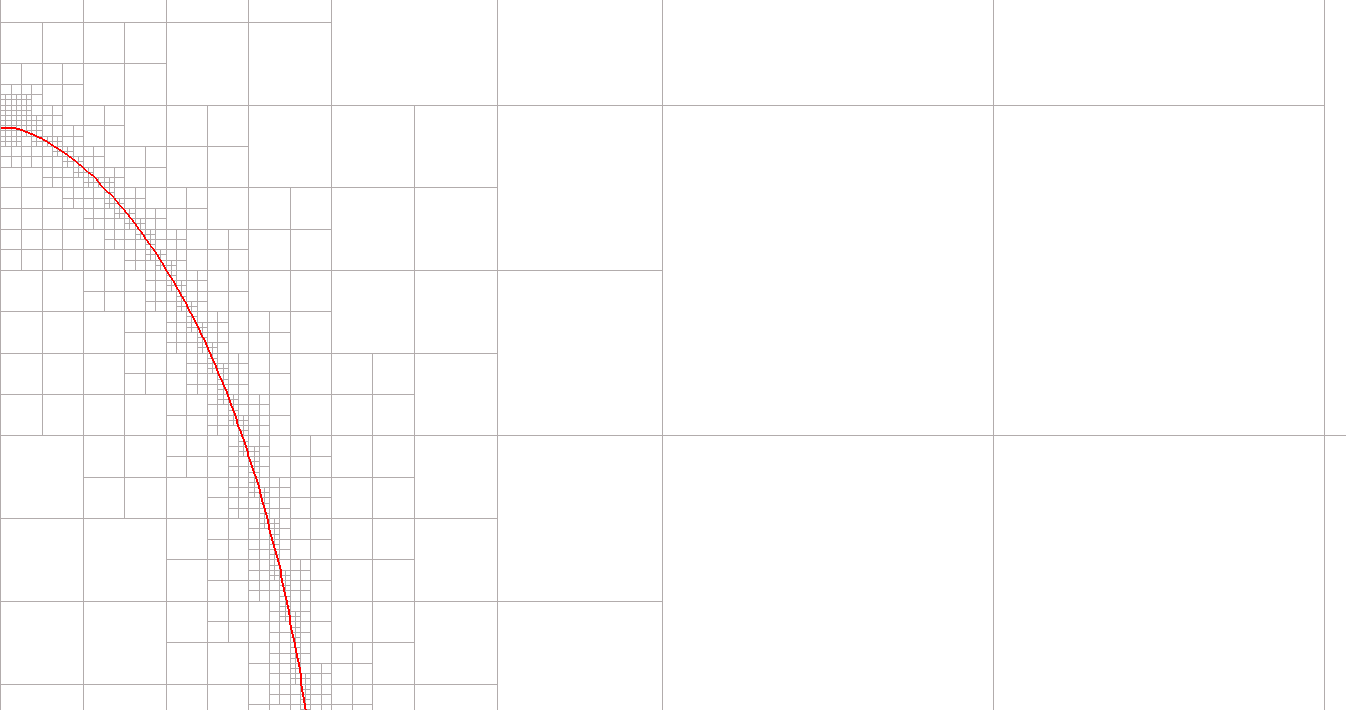
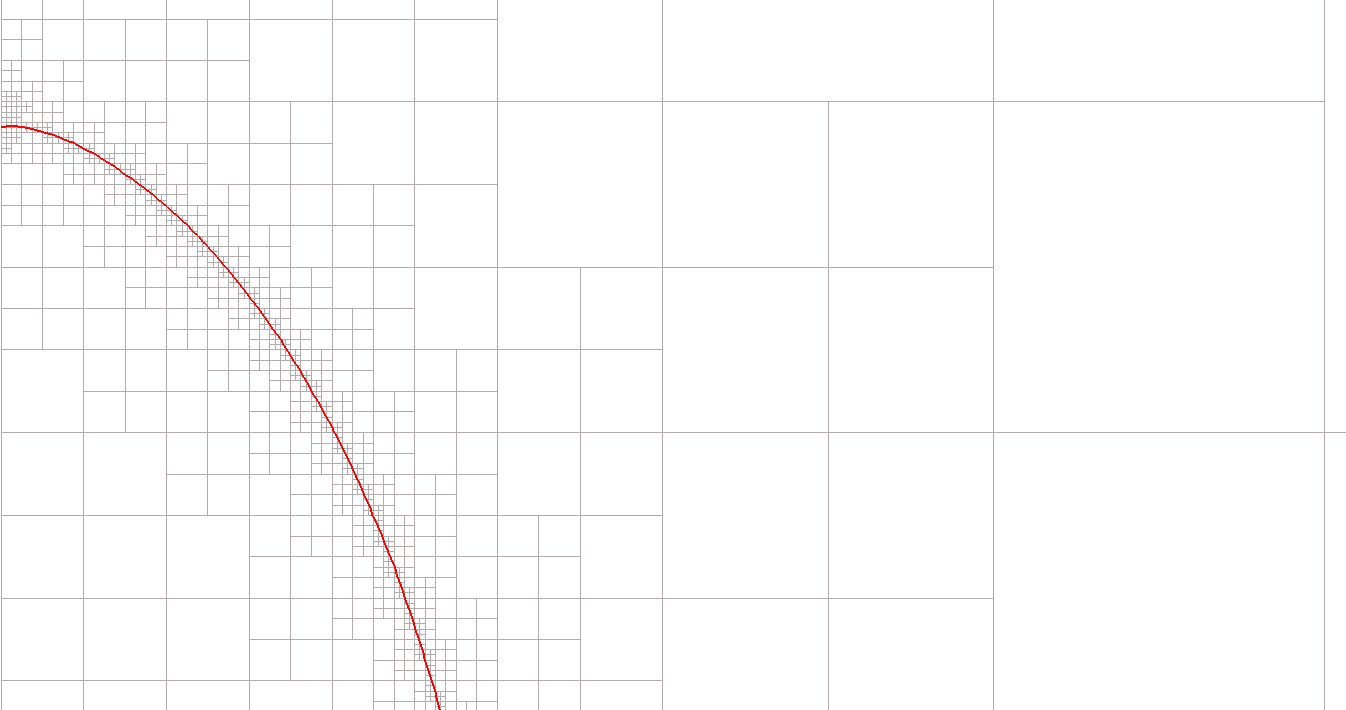
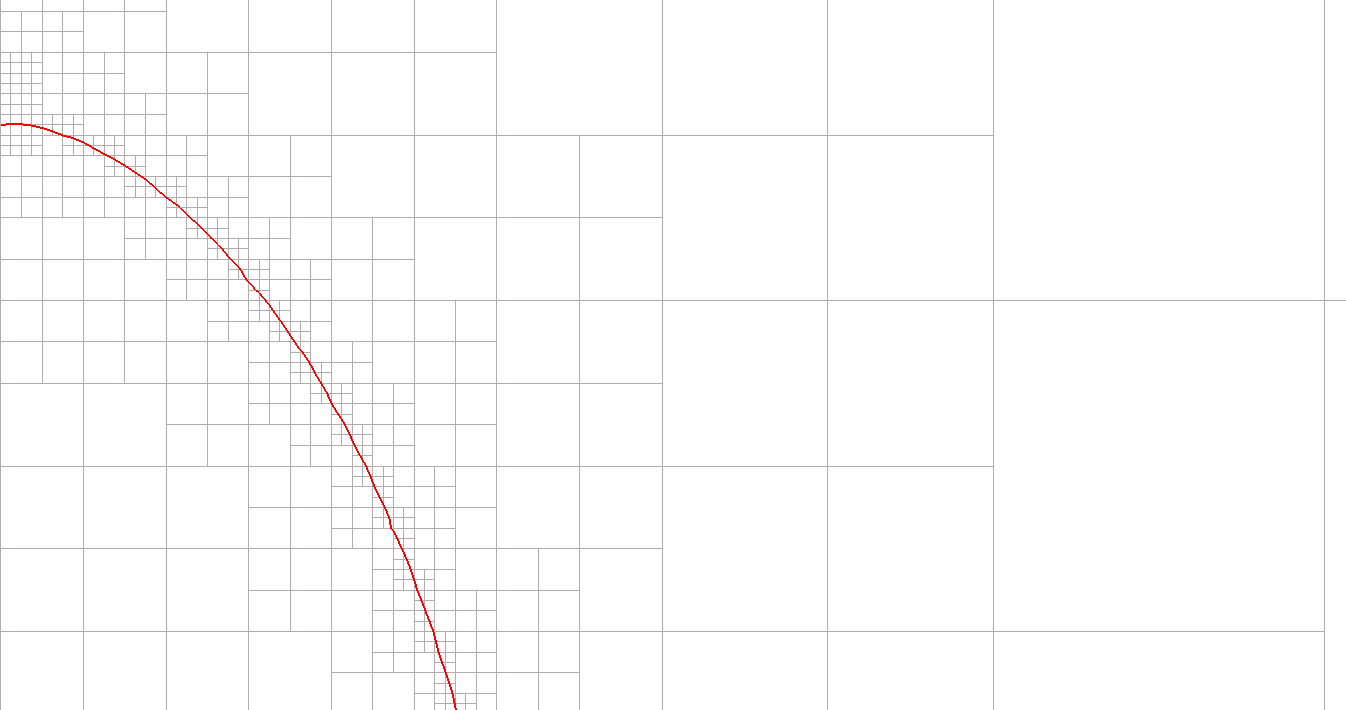
Figs. 23 illustrate the interface profiles corresponding to examples in Figs. 14 to 22. The results show the interface shapes, close to the contact line where , for various cases, demonstrating how the interface profiles vary at the transition. The background mesh depicts the adaptive mesh refinement that is utilized for the simulations. The results show the monotonically increasing film thickness that connects to the flat region of the interface, corresponding to the zero apparent interface angle, that is in turn connected to the static liquid reservoir meniscus (only the film near the contact line is shown here). For , there is a significant bending of the interface, more markedly close to the contact line. This bending of the interface close to the contact line is better captured at higher mesh resolutions. As shown, for , even the smallest grid size appears to be just sufficient, illustrating the challenging computations at smaller angles.
5.4 General case
In the arbitrary angle case or when does not vanish, one cannot use lubrication theory as done in [36]. However we can proceed by assuming a vanishing apparent contact angle at the transition. For a vertical plate, this means that at the inflection point the slope vanishes ( when ). We have indeed confirmed this observation by our numerical results. As shown in Figs. 14 to 22 (b,d,f), for the range of contact angles and mesh sizes considered here, and , the vanishing slope of the interface coincides with the inflection point at the transition, confirming the criteria for the dewetting transition.
Thus there is a region IV of small slope overlapping with region II and III in which the lubrication approximation is valid. However because the slope is not small everywhere in region II the lubrication approximation does not apply there and asymptotic matching is less obvious than in the literature. One possibility would be to use a generalized differential equation also valid for large slopes as done in [58]. A mapping from the equation valid for large slopes in [58] to the lubrication approximation for small slopes has been performed in [59], allowing to reuse the result in [36]; however, for several reasons explained below, we prefer to perform directly a matching from Cox’s theory valid from region II to region IV.
In what follows, we first perform a heuristic derivation of the central relation of our theory, that gives the critical value of the capillary number implicitly as function of the other parameters of the problem. We then compare these results to those of lubrication theory obtained for small angles, and to our numerics for small angles.
The heuristic description starts by determining the scale of and the thickness of the liquid in region III near the inflexion point. Using the Cox-Voinov analysis, the slope is given by Eq. (13) and we write the condition that it vanishes in region IV. Let the inflection point occur at with . The bending occurs over a large distance and the “final phase” of the bending where the slope and the curvature are small occupies almost all of region II. Thus region II “looks like” a very thin wedge seen at scale (paralell to the wall) and (perpendicular to the wall). The meaning of all the geometrical quantities and is summarized on Fig. 24.
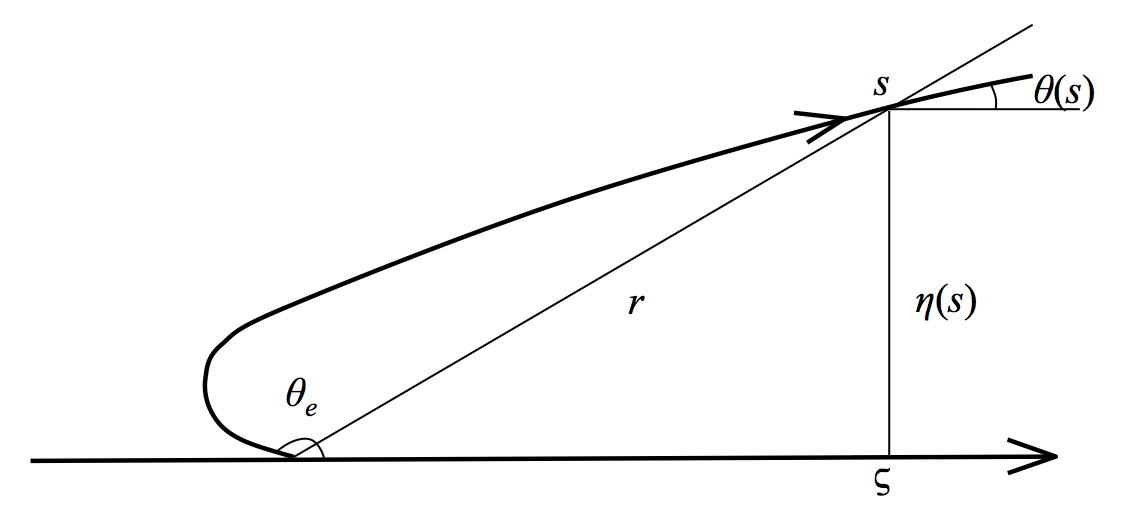
As a result of the thinness, we can approximate in that region. Writing the small slope assumption at in Eq. (13) gives
| (24) |
and is small if is small. The small parameter in the expansion is
| (25) |
This determines the scale of and we now turn to determining the thickness of the liquid in region III near the inflection point. This is not as trivial as it may seem since in addition to the solutions near the inflection point that match the meniscus, there are also solutions with an asymptotically flat interface, as . These solutions have and involve a balance of gravity and viscosity instead of a balance of surface tension and viscosity. A solution may be found trivially by letting Constant in the generalized lubrication equation or in the large slope equation in [58]. It is thus a fixed point solution. The following serves to show that one matches to the correct inflection point solution, not to the fixed point solution. Recalling that is small, it is possible to deduce that the curvature is still small in most of region II thus where is the curvilinear abscissa along the interface. Then
| (26) |
where we have used the fact that , and . After some work it can be shown that this integral behaves as
| (27) |
while by definition
| (28) |
We thus have as expected for the inflection point in the thin film dewetting transition. In region IV, the length scales are thus across the film and parallel to the film. The curvature thus scales as
| (29) |
To match region IV and region III, one should have the curvature of same order as the curvature of the static meniscus. Writing one obtains
| (30) |
Identifying as above
| (31) |
where we have introduced a constant .
In the free surface case when , we may match region III with region IV in a manner similar to the one in [36], as shown in A, to obtain
| (32) |
Or equivalently (see 52)
| (33) |
It is possible that does not differ very much from if in region IV the outer fluid stress is negligible. Indeed in the thin layer the stress scales as while the stress in the outer fluid scales as the much smaller , realizing an approximation of the free surface condition.
We note that expression (33) is equivalent at small angles to the one obtained in [36]. It is also equivalent to the expression obtained in [59] at all angles apart for the fact that we make no hypothesis on the behavior of at large angles, unlike [59] and [58]. Moreover, as we wrote above, we prefer not to obtain our expression through a generalized lubrication equation, but rather through asymptotic matching. We believe that the effect of some models of the microscopic physics, such as the slip length model, in region I, cannot be found for large angles by asymptotic analysis but would require a full solution of the Stokes equation analogous to that of Huh and Scriven [20], but for different boundary conditions.
We also note that at the transition the condition (30) yields , and that we used essentially the same matching argument as Derjaguin [42] and Landau and Levich [41]. This can also be compared to the prediction of Voinov [55] which is similar but with a constant differing from that obtained by asymptotic matching.
Considering now the numerical case, we substitute the numerical expression (21) for the microscopic length scale in the critical matching expression (33) to obtain the central relation of our theory
| (34) |
where we identified with .
It is interesting to investigate explicit expressions for obtained by an asymptotic analysis of Eq. (34). To perform this analysis, we let . This small parameter is of the same order as above but unlike is explicitly defined using the parameters of the problem. To give an order of magnitude for and , if we use, as in the above simulation, a grid size , we obtain . Thus our small parameters is small but not exceedingly so. It is useful to introduce the auxiliary parameter defined as . The parameter will be small for transcendentally small . Otherwise if is considered order 1, solutions of Eq. (34) expand as
| (35) |
At small angles, with the expected scaling , one gets . Moreover the higher order terms in Eq. (35) are small if which is verified even for the smallest and typical values of in our calculations. For Setup B, with , and using the best fit estimate , the first order of expansion of Eq. (35) gives , using all the terms in expansion (35) gives , while a full iterative solution of Eq. (34) yields . For Setup C, in the case , and using the best fit estimate , the first order gives , using all the terms in expansion (35) gives , while a full iterative solution of Eq. (34) yields . Thus in a wide range of parameters, the approximation
| (36) |
is correct within 15% accuracy.
5.5 Comparison with numerics
In our simulations, we measure and specify and . For the two special cases described above, we compare the value of from full simulations to the solutions of the central relation, Eq. (34). The simulations values are in remarkable agreement with the above solutions. For setup B, with , we find numerically compared to the theoretical value . For setup C, in the case , we find numerically compared to the theoretical value .
Alternately, to perform the comparison, Eq. (34) can be inverted to provide an estimate of given the numerical estimate of . The estimate is
| (37) |
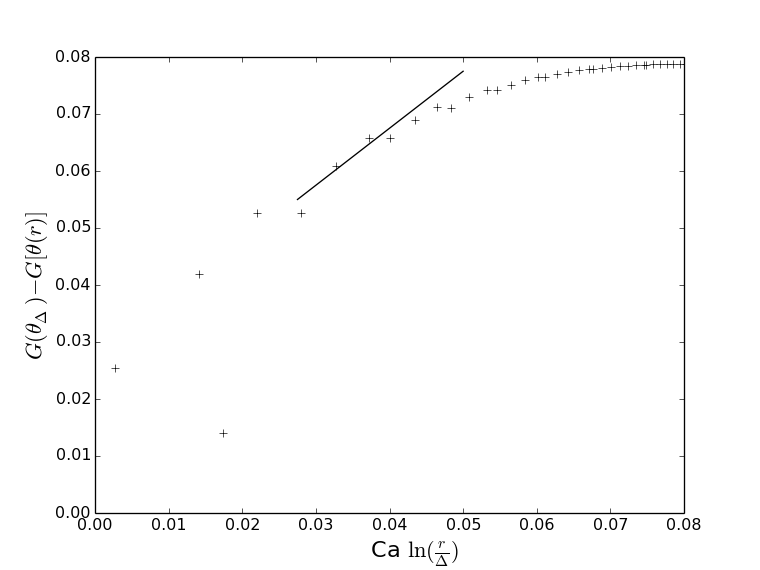
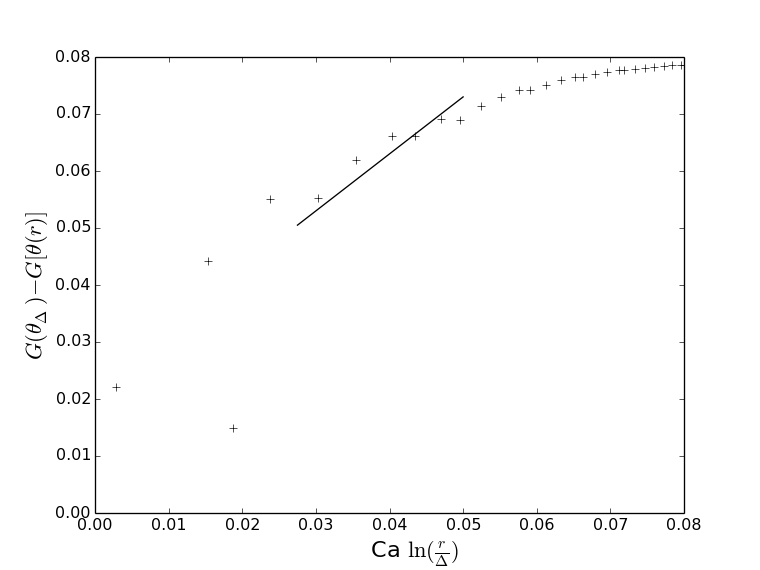
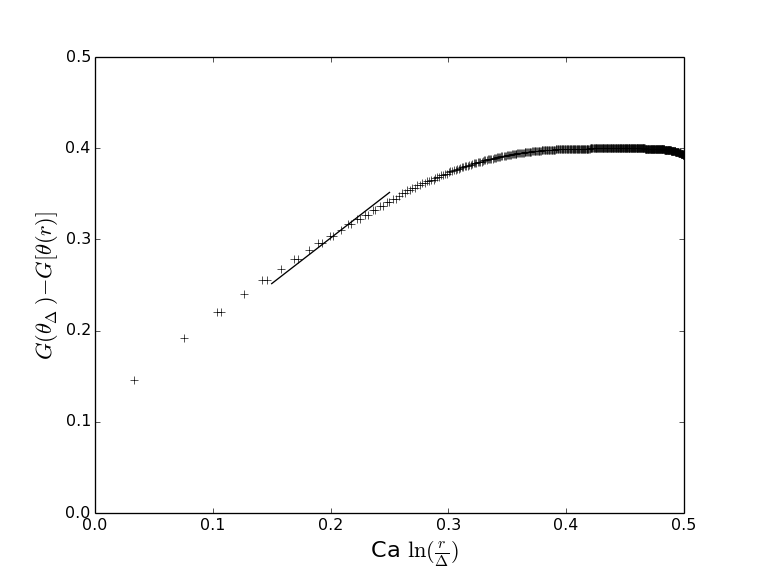
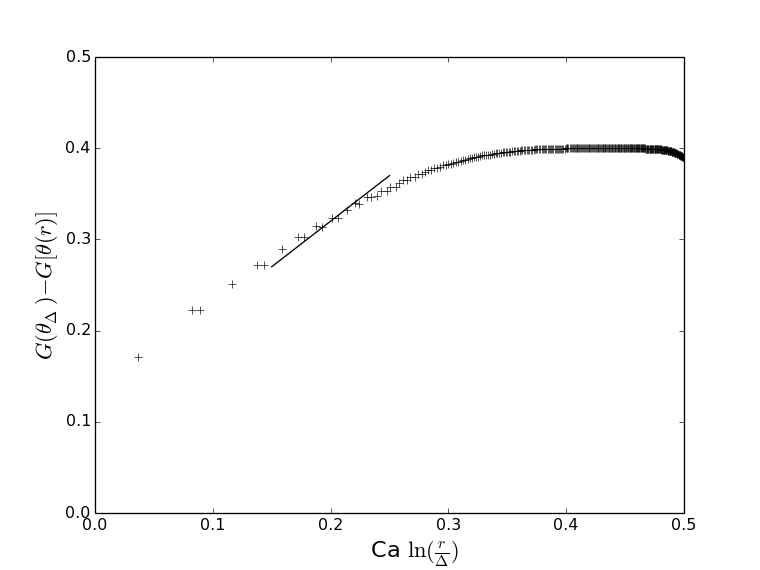
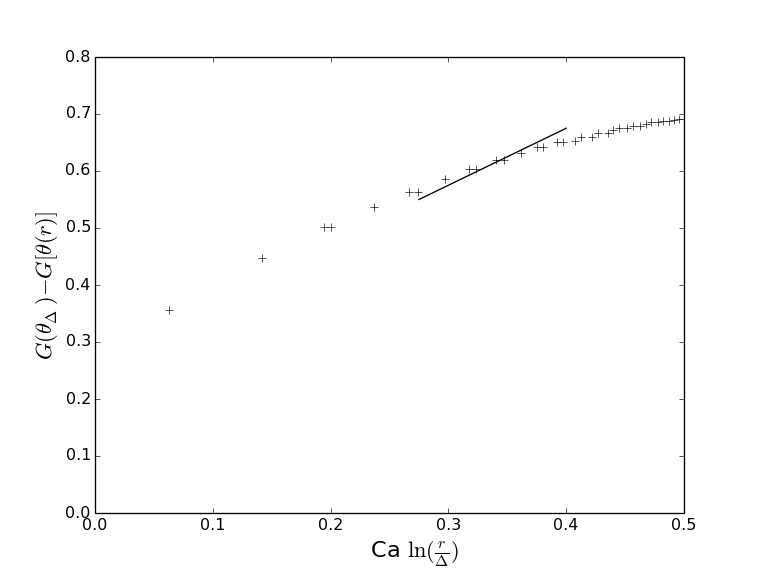
If our theory is valid, the right hand side should not depend on . Moreover if lubrication theory can be used in region IV, as is possibly the case even for , the above expression should yield the gauge function defined in relation with Cox’s analysis and estimated numerically above.
In Fig. 25, we plot the values of the RHS of Eq. (37) for Setups A, B and C, along with the computed values from the best fit of presented in Sec. 5.3 (see Figs. 14 to 22). In the near-free-surface Setup C (), a very clean estimate of the gauge function is obtained at small angles and we find . Numerical results from the direct comparison with Eq. (23) are also in reasonable agreement with the predictions at small angles. Eq. (22) therefore suggests an effective slip length . Thus our numerical model may be viewed as having an effective slip of the order of a grid cell.
In Setups A and B, the plot is more scattered indicating deviations from our theory, which is not surprising given the not-so-small value of the asymptotic parameter. However, a rough proportionality to the angle is observed at small angles. Moreover, for all the Setups, large contact angle data do not follow the linear proportionality to the angle , with the viscosity ratio having a more prominent effect on this deviation at large angles. To shed more light on the behavior of as a function of the mesh size, as well as exemplifying the errors in the computation of , in Fig. 26, we plot versus . The results show some small variations; this is however expected because the error in estimating also depends on , while decreasing the mesh size does not reduce the transition capillary by much.
 |
 |
 |
| (a) | (b) |
 |
 |
| (c) | (d) |
 |
 |
| (e) | (f) |
6 Dynamic inner contact angle
A possible reinterpretation of Cox’s theory is to consider that the inner region angle is not the equilibrium angle but an angle depending on the contact line velocity so that
| (38) |
where dependence on the fluids and solid material properties is implicit. Then Eq. (9) must be rewritten as
| (39) |
and we can proceed as before. We note however that there are two possibilities.
1) The microscopic angle is discontinuous, that is there are two angles, the advancing angle and the receding angle , so that and that for small , for an advancing contact line and for a receding contact line. The conclusion is that the asymptotic analysis is unchanged with replaced by either or .
2) The microscopic angle is continuous so that at first order
| (40) |
with a constant. In this case, and the small assumption, Eq. (39) can be rewritten at first order in in the form of Eq. (9)
| (41) |
the change in microscopic angle with being absorbed into the new integration constant . We note that the relation (40) is in agreement with the Molecular Kinetics Theory (MKT) of Blake and Haynes [44], which states that the contact line is displaced by small random molecular jumps at the surface of the solid due to thermal fluctuations. The average size of these small jumps is determined by the intermolecular interactions between the liquid and solid. The frequency of these random molecular jumps and the average distance of each jump can either be determined empirically or by direct comparison to molecular dynamics simulations. This model postulates that there is an out-of-balance surface tension force, of non-hydrodynamic origin, as a result of the contact line moving on a solid surface. The model then relates the contact line speed to this driving force, resulting in a dynamic contact angle.
The idea of advancing and receding angles is related to the idea of physical roughness of the surface. This may connect to the idea of a discontinuity in the global numerical solution itself. We have conducted tests of the numerical model for advancing menisci for down to , although the dewetting transition itself was studied only for . For very small , the contact line evolves in an irregular manner, with intermittent spikes in velocity akin to the motion on a rough surface. These spikes have a time periodicity of as if the interface was pinned with spatial periodicity equal to the grid size . However, no such irregularity is observed for . Thus we may infer that at least in the range of parameters used in this study , the numerical solution is a continuous function of the contact line position.
7 Consequences for dynamic contact line computations in general
How to conduct realistic simulations of flows including a moving contact line in practice is a difficult problem that has elicited significant research efforts (See [39] for a systematic comparison of some models.) Here we only discuss how our Cox type analysis of numerical models connects with other work on mesh independent simulations. In the computation of a number of problems involving dynamic contact lines, such as droplet spreading, drop impact or drop sliding on inclined plates, the result typically varies with grid resolution because of hydrodynamic effects. One already-suggested approach [39] is to specify numerically the angle
| (42) |
for some that may be function of the capillary number as in Eq. (38), and for some microscopic length . We remind the reader that is the numerically imposed contact angle while is an experimentally measured or determined quantity whose meaning is the contact angle at the microscopic scale . Since and are not necessary equal and not even of the same order of magnitude, we distinguish these two quantities. The loose rationale for expression (42) is that if is the interface angle at distance , then the Cox theory, i.e. Eq. (13), reduces to Eq. (42). A more systematic approach amounts to note that if Eq. (42) is used then in region II of our asymptotic analysis, we have from Eqs. (42) and (21)
| (43) |
The above equation predicts in region II an angle independent of the grid size. If the simulation is sufficiently well resolved and grid independent in the other regions of the domain, then via asymptotic matching of the outer scales with region II, the simulation should also be mesh-independent globally. This most systematic approach differs from the naive interpretation that is the angle at scale by a factor .
The approach in the previous publication by two of the authors [27] is identical to the above one except for an approximation where
| (44) |
valid only in the range defined by Sheng and Zhou [54], that is and . The approach embodied in Eq. (42) is more general, and can be used to define a procedure to perform mesh-independent simulations of realistic problems. (However, predictive simulations of moving contact lines are not possible if a physical model at the microscopic scale, beyond the Navier-Stokes equations, is not available.)
In such a procedure, one of the main issues is whether contact line physics are obtained by experiment or by a reduction to a microscopic theory such as molecular dynamics or phase field.
To develop a strategy for realistic simulations where experiments would be used, the first step would be to perform a series of simulations at varying and for the conditions of the experiments. Obviously, simulations and experiments are not performed near the critical but below it. Comparing the angles observed in the region where the theory is still valid (region II) would cross-validate the numerics, the Cox’s theory, and the experimental reality. This would in turn fix the parameters and that could be used in simulations. This approach is of course made difficult by the fact that there is no evidence so far that a single pair could predict experiments over a range of different flow configurations. Actually the authors of [9] state that “In the literature we have not found a single pair of experiments in different geometries using precisely the same materials.”. This highlights the difficulty of a predictive simulation approach based on experiments. Moreover, it should be noted that the authors of references [60] and [61] claim precisely the opposite, that no inner angle , even a dynamical one depending on the capillary number, can predict the whole range of experiments they have performed or simulated.
Another approach could be based on mesoscale or nanoscale physics, using molecular dynamics or phase field simulations to predict interface shapes, and again attempting to fit the predicted shapes to those predicted by Navier-Stokes simulations performed using Eq. (42) and a pair . The models would have to be simulated up to scales much larger than the nanoscale or the mesoscale so the Cox asymptotics become observable. This could be difficult since in particular the phase field models involve an intrinsic length scale (in the notations of ref. [9]) that may be large enough to preclude the appearance of a “Cox region” such as region II inserted between the mesoscale model scale and the larger scales of the simulation such as the capillary length .
All the above considerations must be subject to the proviso that the Cox region II is really observable. There are several circumstances when that cannot be the case. For both withdrawing or advancing contact angles, above a critical number, a transition occurs to a liquid film or air film solutions, marking the disappearance of region II. These transitions fix an upper limit on for moving contact lines to simply exist. A lower limit for our approach to be applicable is obtained at small capillary numbers. Indeed, the Cox solution is valid only if region II exists, which may be very narrow for small . Indeed region II transitions directly to region III at small for viscous forces of the same order than the hydrostatic pressure gradient which is equivalent to where the capillary length appears. For and the classic capillary length we find m. This distance may become so small that simulations at this scale are not practical and it is preferable to set the grid size at larger scales at which the contact angle is simply the apparent contact angle or the angle of the meniscus solution.
8 Conclusions
We focus on the problem of forced dewetting transition of a partially wetting plate withdrawn from a reservoir using direct numerical simulations.
We compare numerical solutions in the vicinity of the contact line with the theory of Cox and Voinov and point out the existence of a gauge function that corresponds to one of the integration constants in these theories. We find that Cox-Voinov theory is not well verified at small angles pointing to necessary improvements in the numerical treatment of the dynamic contact line. These improvements may be related to the treatment of boundary conditions or to the treatment of viscosity in mixed cells. They should be the focus of future studies on this topic.
Using the gauge function , we provide a numerically-validated approximate correlation for the critical capillary number, , at which the dewetting transition occurs, as a function of the mesh size, , and the numerically-imposed equilibrium contact angle, .
Using the asymptotic hydrodynamic theory of the vicinity of the contact line and matching it to the static theory of menisci, we generalize the hydrodynamic theory of the dewetting transition. We use it to derive an equation for the effect of and on the larger-scale regions of the simulation. The critical capillary number is then predicted by an implicit equation for . This equation contains the unknown gauge function that characterizes the contact line dynamics and is akin to a coefficient that determines the amount of slip. This gauge function is specific to the numerical model used. Our numerical simulations allow to quantify this “numerical slip” and confirm that it varies linearly with the grid size . Of particular interest is the work of Snoeijer in [58] which generalizes the lubrication theory to large angles. The numerical verification of the lubrication equation developed in [58] is topic of our future work.
We suggest a manner in which simulations can be made convergent upon grid refinement, despite the singularity at the contact line. This involves adjusting the numerical contact angle as a function of the grid size. This adaptation of the contact angle involves the numerical gauge function and improves in several ways over the model proposed in [27]. Indeed, it is valid for arbitrary angles and viscosity ratios. However, the microscopic parameters and even more generally the microscopic physics are not known, except for the case treated in this paper of a postulated Navier-slip model. Thus the applicability of the grid-independent model may be limited.
The perspectives of this work are a systematic determination of the gauge function for a range of numerical or physical contact line models used in practice and the verification of the procedure for grid-independent computations in a number of flows. Such grid independent simulations should be performed in conjunction with experiments on contact line dynamics.
Acknowledgements
This research was supported by Electricité de France (EdF), Contract No. 8610-5910129228 (“Advances in Subgrid Models for Subcooled Flow Boiling in Pressurized Water Reactors”) and NSF grant Nos. DMS-1320037 and CBET-1604351. S. A. gratefully acknowledges the support from CNRS for his visit to Institut Jean Le Rond d’Alembert during the preparation of this paper. S. Z. gratefully acknowledges the support from CNRS and MOST (Taiwan) for supporting his visit to NTU during the preparation and writing of this paper.
The authors thank CINES and its team for the grant of computer time and technical assistance on the OCCIGEN supercomputer in the framework of the GENCI allocation x20162b7325. The authors also thank D. Fuster, G. Galliero, C. Josserand, D. Legendre, I. Lunati, A. Malan, H. Tchelepi, M. Abu-Al-Saud and A.-B. Wang for fruitful discussions. S. Z. gratefully acknowledges helpful discussions with Y. Pomeau on contact line modeling, and thanks Jens Eggers for his helpful correspondence about the derivation of equation (37).
Appendix A Matching procedure in the small angle, free-surface case
In the small case, lubrication theory can be used following ref. [36]. We already expressed the first step of that theory when we obtained the slope in the vicinity of the contact line. It was seen that lubrication theory can be used when . The range of validity of the theory is estimated in ref. [57] and for the advancing case to be . This is equivalent for small angles to which is not too small but larger than the value in the numerical case above.
In region IV, the lubrication equation is well known to be the Airy equation [56]
| (45) |
and we assume the scaling
| (46) |
so that the thickness of the film is much smaller than its horizontal extent . Eq. (45) can be solved using Airy functions. The analysis given in [56] is reproduced in B. One finds that for
| (47) |
where is a parameter characterizing the Airy function solution of Eq. (45). Matching Eq. (47) with the Cox’s solution Eq. (18) gives
| (48) |
The matching is performed for small in region IV variables but large in region II variables, . This is consistent with an upper bound on the validity of the Cox’s solution Eq. (13). At the upper end of region IV, for , one can find the curvature as shown in B
| (49) |
Eq. (49) is obtained from the Airy function solution, which is parameterized by both and . The determination of is more subtle [36, 38]. It is seen that expression (49) predicts a range of possible curvatures depending on the value of . The smallest possible curvature obtains when the Airy function assumes its global maximum for . Thus for a given and , a minimum curvature is given by
| (50) |
Indeed if the curvature determined at the lower limit of region III is larger, that is , it is always possible to match with a solution parameterized by some such that and is small enough. However, if curvature , the matching is impossible. Thus the critical is given by
| (51) |
We now eliminate between Eq. (48) and Eq. (51) and use the notation ,
| (52) |
In the slip-length model case, with given by Eq. (19) and given by Eq. (20), we obtain
| (53) |
This is in agreement with Eggers’s result in [36]. Eggers considers the case of a plate inclined with a small slope above the horizontal, while we consider a vertical plate. This does not change the nature of the asymptotics and as already pointed out in ref. [36], the theory transposes as well to the case of a vertical plate (although the full numerical solution is then more difficult to obtain). In the small plate angle case is equal to the curvature of the meniscus solution, while in our case the curvature is given by Eq. (8). There is agreement between Eq. (53) and Eq. (9) of [36] if we take note of the use of dimensionless variables in [36], while we use dimensional variables, and substitute for (using ref. [36] notation for ).
Appendix B Analysis of the Airy equation
We first outline the Airy function solution of Eq. (45) given in [56]. With the transformation , Eq. 45 becomes
| (54) |
This equation can be turned into Airy’s equation for a new variable , that is , upon the substitutions
and
whose solution is
| (55) |
which implies
| (56) |
where and are two arbitrary constants, while is an antiderivative of . After integrating explicitly for , Duffy and Wilson [56] conclude that for and any given , there is a single branch that behaves as desired for the contact line problem, that it grows monotonically from for and for and has for and where is a root of
| (57) |
That single branch cannot go to infinity inside , which implies that is the largest among the countably infinite set of roots of Eq. (57). Thus the solution can be characterized either 1) by the arbitrary pair () or 2) by () and chosen arbitrarily with given by provided there is no larger root of Eq. (57). In what follows, we use the second characterization. It can be verified that
| (58) |
is an antiderivative of and that it satisfies for . Thus the solution given parametrically by Eqs. (56) and (58) starts at for and grows monotonically with for . Expanding the solution for , Duffy and Wilson [56] find that
| (59) |
where . Differentiating, and returning to the original variable , leads to
| (60) |
For , Eq. (56) reduces to
| (61) |
Differentiating twice, one obtains the second derivative. As discussed in Sec. 5, it is possible to equate the curvature with the second derivative since 1) , and 2) the curvature is of the order of and the matching is performed at distances small in the region III variables thus over distances . Over such distances, the curvature of the parabola (Eq. (61)) is close to the curvature at its apex. Reverting to the original variable , we obtain the curvature in the asymptotic range as
| (62) |
References
References
- [1] S. Afkhami, J. Buongiorno, A. Guion, S. Popinet, Y. Saade, R. Scardovelli, S. Zaleski 2018, Corrigendum to transition in a numerical model of contact line dynamics and forced dewetting, Journal of Computational Physics, in print.
- [2] A. A. Darhuber, S. M. Troian, J. M. Davis, S. M. Miller, S. Wagner, Selective dip-coating of chemically micropatterned surfaces, J. Appl. Phys. 88 (2000) 5119.
- [3] L. Li, R. J. Braun, K. L. Maki, W. D. Henshaw, P. E. King-Smith, Tear film dynamics with evaporation, wetting, and time-dependent flux boundary condition on an eye-shaped domain, Phys. Fluids 26 (2014) 052101.
- [4] H. Kim, J. Buongiorno, Detection of liquid-vapor-solid triple contact line in two-phase heat transfer phenomena using high-speed infrared thermometry, Int. J. Multiphase Flow 37 (2011) 166.
- [5] A. Guion, D. Langewisch, J. Buongiorno, Dynamics of the liquid microlayer underneath a vapor bubble growing at a heated wall, Proceedings of the ASME Summer Heat Transfer Conference (2013) 14.
- [6] E. H. Kimbrel, A. L. Herring, R. T. Armstrong, I. Lunati, B. K. Bay, D. Wildenschild, Experimental characterization of nonwetting phase trapping and implications for geologic CO2 sequestration, Int. J. Greenh. Gas Con. 42 (2015) 1.
- [7] K. Mahady, S. Afkhami, L. Kondic, A volume of fluid method for simulating fluid/fluid interfaces in contact with solid boundaries, J. Comp. Phys. 294 (2015) 243.
- [8] H. Ding, P. D. M. Spelt, Wetting condition in diffuse interface simulations of contact line motion, Phys. Rev. E 75 (2007) 046708.
- [9] P. Yue, J. J. Feng, Wall energy relaxation in the Cahn–Hilliard model for moving contact lines, Phys. Fluids 23 (2011) 012106.
- [10] P. Seppecher, Moving contact lines in the Cahn-Hilliard theory, Int. J. Eng. Sci. 34 (1996) 977.
- [11] L. M. Pismen, Y. Pomeau, Disjoining potential and spreading of thin liquid layers in the diffuse-interface model coupled to hydrodynamics, Phys. Rev. E 62 (2) (2000) 2480.
- [12] Y. Pomeau, Contact line moving on a solid, Eur. Phys. J. Spec. Top. 197 (2011) 15.
- [13] Y. Shikhmurzaev, Moving contact lines in liquid/liquid/solid systems, J. Fluid Mech. 334 (1997) 211.
- [14] J. Sprittles, Y. Shikhmurzaev, Finite element simulation of dynamic wetting flows as an interface formation process, J. Comput. Phys. 233 (2013) 34.
- [15] L. M. Hocking, A moving fluid interface on a rough surface, J. Fluid Mech. 76 (1976) 801.
- [16] T. D. Blake, The physics of moving wetting lines, J. Colloid Interface Sci. 299 (2006) 1.
- [17] D. Bonn, J. Eggers, J. Indekeu, J. Meunier, E. Rolley, Wetting and spreading, Rev. Mod. Phys. 81 (2009) 739.
- [18] J. H. Snoeijer, B. Andreotti, Moving contact lines: Scales, regimes, and dynamical transitions, Annu. Rev. Fluid Mech. 45 (2013) 269.
- [19] Y. Sui, H. Ding, P. D. M. Spelt, Numerical simulations of flows with moving contact lines, Annu. Rev. Fluid Mech. 46 (2014) 97.
- [20] C. Huh, L. E. Scriven, Hydrodynamic model of steady movement of a solid/liquid/fluid contact line, J. Colloid Interface Sci. 35 (1971) 85.
- [21] H. P. Greenspan, On the motion of a small viscous droplet that wets a surface, J. Fluid Mech. 84 (1978) 125.
- [22] E. B. Dussan V., On the spreading of liquids on solid surfaces: Static and dynamic contact lines, Annu. Rev. Fluid Mech. 11 (1979) 317.
- [23] R. G. Cox, The dynamics of the spreading of liquids on a solid surface. Part 1. Viscous flow, J. Fluid Mech. 168 (1986) 169.
- [24] M. Renardy, Y. Renardy, J. Li, Numerical simulation of moving contact line problems using a volume-of-fluid method, J. Comput. Phys. 171 (2001) 243.
- [25] P. D. Spelt, A level-set approach for simulations of flows with multiple moving contact lines with hysteresis, J. Comput. Phys. 207 (2005) 389.
- [26] O. Devauchelle, C. Josserand, S. Zaleski, Forced dewetting on porous media, J. Fluid Mech. 574 (2007) 343.
- [27] S. Afkhami, S. Zaleski, M. Bussmann, A mesh-dependent model for applying dynamic contact angles to VOF simulations, J. Comput. Phys. 228 (2009) 5370.
- [28] S. Manservisi, R. Scardovelli, A variational approach to the contact angle dynamics of spreading droplets, Comput. Fluids 38 (2009) 406.
- [29] P. Joseph, P. Tabeling, Direct measurement of the apparent slip length, Phys. Rev. E 71 (2005) 035303.
- [30] E. Lauga, M. Brenner, H. Stone, Microfluidics: The No-Slip Boundary Condition, Springer Berlin Heidelberg, 2007, Ch. 15, pp. 1219–1240.
- [31] J. A. Moriarty, L. W. Schwartz, Effective slip in numerical calculations of moving-contact-line problems, J. Eng. Math. 26 (1992) 81.
- [32] O. Weinstein, L. M. Pismen, Scale dependence of contact line computations, Math. Model. Nat. Phenom. 3 (2008) 98.
- [33] S. Popinet, The Gerris flow solver, http://gfs.sourceforge.net/, 1.3.2 (2012).
- [34] S. Afkhami, M. Bussmann, Height functions for applying contact angles to 2D VOF simulations, Int. J. Numer. Meth. Fluids 57 (2008) 453.
- [35] S. Afkhami, M. Bussmann, Height functions for applying contact angles to 3D VOF simulations, Int. J. Numer. Meth. Fluids 61 (2009) 827.
- [36] J. Eggers, Hydrodynamic theory of forced dewetting, Phys. Rev. Lett. 93 (2004) 094502.
- [37] J. Eggers, Contact line motion for partially wetting fluids, Phys. Rev. E 72 (2005) 061605.
- [38] T. S. Chan, J. H. Snoeijer, J. Eggers, Theory of the forced wetting transition, Phys. Fluids 24 (2012) 072104.
- [39] D. Legendre, M. Maglio, Comparison between numerical models for the simulation of moving contact lines, Comput. Fluids 113 (2015) 2.
- [40] M. O. Abu-Al-Saud, C. Soulaine, A. Riaz, H. A. Tchelepi, Level-set method for accurate modeling of two-phase immiscible flow with moving contact lines, arXiv preprint arXiv:1708.04771 (2017).
- [41] L. D. Landau, B. V. Levich, Dragging of a liquid by a moving plate, Acta Physicochim. URSS 17 (1942) 42.
- [42] B. V. Derjaguin, On the thickness of a layer of liquid remaining on the walls of vessels after their emptying, and the theory of the application of photoemulsion after coating on the cine film, Acta Physicochim. URSS 20 (1943) 349.
- [43] O. Voinov, Hydrodynamics of wetting, Fluid Dynamics 11 (1976) 714.
- [44] T. D. Blake, J. M. Haynes, Kinetics of liquid/liquid displacement, J. Colloid Interface Sci. 30 (1969) 421.
- [45] S. Popinet, Gerris: a tree-based adaptive solver for the incompressible Euler equations in complex geometries, J. Comput. Phys. 190 (2003) 572.
- [46] S. Popinet, An accurate adaptive solver for surface-tension-driven interfacial flows, J. Comput. Phys. 228 (2009) 5838.
- [47] R. Scardovelli, S. Zaleski, Direct numerical simulation of free-surface and interfacial flow, Annu. Rev. Fluid Mech. 31 (1999) 567.
- [48] S. Popinet, Numerical models of surface tension, Ann. Rev. Fluid Mech. 50 (2018) 49.
- [49] P. Y. Lagrée, L. Staron, S. Popinet, The granular column collapse as a continuum: validity of a two-dimensional Navier–Stokes model with a (I)-rheology, J. Fluid Mech. 686 (2011) 378.
- [50] G. Tryggvason, R. Scardovelli, S. Zaleski, Direct Numerical Simulations of Gas-Liquid Multiphase Flows, Cambridge University Press, 2011.
- [51] S. Popinet, Rotation of a straight interface, http://gerris.dalembert.upmc.fr/gerris/tests/tests/rotate.html.
- [52] G. Bornia, A. Cervone, S. Manservisi, R. Scardovelli, S. Zaleski, On the properties and limitations of the height function method in two-dimensional cartesian geometry, J. Comp. Phys. 230 (2011) 851.
- [53] L. Landau, E. Lifshitz, Fluid Mechanics, Permagon Press, Oxford, 1987.
- [54] P. Sheng, M. Zhou, Immiscible-fluid displacement: Contact-line dynamics and the velocity-dependent capillary pressure, Phys. Rev. A 45 (1992) 5694.
- [55] O. Voinov, Wetting: Inverse dynamic problem and equations for microscopic parameters, J. Colloid Interface Sci. 226 (2000) 5.
- [56] B. Duffy, S. Wilson, A third-order differential equation arising in thin-film flows and relevant to tanner’s law, App. Math. Lett. 10 (1997) 63.
- [57] J. Eggers, Existence of receding and advancing contact lines, Phys. Fluids 17 (2005) 082106.
- [58] J. H. Snoeijer, Free-surface flows with large slope: Beyond lubrication theory, Phys. Fluids 18 (2006) 021701.
- [59] J. Qin, P. Gao, Asymptotic theory of fluid entrainment in dip coating, J. Fluid Mech. (2018) 1026.
- [60] T. Blake, M. Bracke, Y. Shikhmurzaev, Experimental evidence of nonlocal hydrodynamic influence on the dynamic contact angle, Phys. Fluids 11 (1999) 1995.
- [61] M. Wilson, J. Summers, Y. Shikhmurzaev, A. Clarke, T. Blake, Nonlocal hydrodynamic influence on the dynamic contact angle: Slip models versus experiment, Phys. Rev. E 73 (2006) 041606.