FERMILAB-PUB-17-079-E Published in Phys. Rev. D. as DOI:10.1103/PhysRevD.95.112004
The D0 Collaboration111with visitors from aAugustana College, Sioux Falls, SD 57197, USA, bThe University of Liverpool, Liverpool L69 3BX, UK, cDeutshes Elektronen-Synchrotron (DESY), Notkestrasse 85, Germany, dCONACyT, M-03940 Mexico City, Mexico, eSLAC, Menlo Park, CA 94025, USA, fUniversity College London, London WC1E 6BT, UK, gCentro de Investigacion en Computacion - IPN, CP 07738 Mexico City, Mexico, hUniversidade Estadual Paulista, São Paulo, SP 01140, Brazil, iKarlsruher Institut für Technologie (KIT) - Steinbuch Centre for Computing (SCC), D-76128 Karlsruhe, Germany, jOffice of Science, U.S. Department of Energy, Washington, D.C. 20585, USA, kAmerican Association for the Advancement of Science, Washington, D.C. 20005, USA, lKiev Institute for Nuclear Research (KINR), Kyiv 03680, Ukraine, mUniversity of Maryland, College Park, MD 20742, USA, nEuropean Orgnaization for Nuclear Research (CERN), CH-1211 Geneva, Switzerland, oPurdue University, West Lafayette, IN 47907, USA, and pInstitute of Physics, Belgrade, Belgrade, Serbia. ‡Deceased.
Combination of D0 measurements of the top quark mass
Abstract
We present a combination of measurements of the top quark mass by the D0 experiment in the lepton+jets and dilepton channels. We use all the data collected in Run I (1992–1996) at and Run II (2001–2011) at of the Tevatron collider, corresponding to integrated luminosities of 0.1 and 9.7 , respectively. The combined result is: = = .
pacs:
14.65.Ha, 13.85.Ni, 13.85.Qk, 12.15.FfI Introduction
The top quark is the heaviest known elementary particle with a mass approximately twice that of the electroweak vector bosons, and factor of 1.4 larger than that of the more recently discovered Higgs boson Aad et al. (2015). Within the standard model (SM), this large mass arises from a large Yukawa coupling () to the Higgs field. Consequently, loops involving the top quark contribute significantly to electroweak quantum corrections, and therefore a precise measurement of the top quark mass, , provides a means to test the consistency of the SM. Furthermore, the precise values of both the mass of the Higgs boson and the Yukawa coupling of the top quark may play a critical role in the history and stability of the universe (see e.g., Ref. Degrassi et al. (2012)).
The top quark was discovered in 1995 by the CDF and D0 experiments during Run I (1992–1996) of the Fermilab Tevatron collider at Abe et al. (1995); Abachi et al. (1995). Run II (2001–2011) at followed, providing a factor of more top-antitop quark pairs than Run I, and far more precise measurements of . Using events produced in the D0 detector Abachi et al. (1994); Abazov et al. (2006); Abolins et al. (2008); Angstadt et al. (2010), we have measured in different decay channels Abbott et al. (1998, 1999); Abazov et al. (2004, 2016a, 2016b, 2014, 2015) using the full integrated luminosity of Run I () and Run II (). This article reports the combination of these direct top quark mass measurements.
Direct measurements of the top quark mass have also been performed by the CDF experiment (see e.g. Ref. Aaltonen et al. (2012a)) at the Tevatron, and by the ATLAS (see e.g. Ref. Aaboud et al. (2016)) and CMS (see e.g. Ref. Khachatryan et al. (2016)) experiments at the CERN LHC. In 2012, the Tevatron experiments combined their measurements in Ref. Aaltonen et al. (2012b) with the result . In 2014, a preliminary combination of ATLAS, CDF, CMS, and D0 measurements Aad et al. (2014a) yielded . Both combinations are by now outdated as they do not include the latest and more precise measurements, in particular, the final D0 Run II measurements discussed in this article.
The top quark mass is a fundamental free parameter of the SM. However, its definition depends on the scheme of theoretical calculations used for the perturbative expansion in quantum chromodynamics (QCD). The inputs to the combination presented in this article are the direct measurements calibrated using Monte Carlo (MC) simulations. Hence, the measured mass corresponds to the MC mass parameter. However, because of the presence of long range effects in QCD, the relationship between the MC mass and other mass definitions, such as the pole mass or the mass in the modified minimal subtraction () scheme, is not well established and has been subject to debate for many years (see e.g., Ref. Juste et al. (2014) and references therein). A recent work obtains a difference of +0.6 GeV between the MC mass and the pole mass in the context of an simulation with an uncertainty of 0.3 GeV Butenschoen et al. (2016). Further studies are needed to produce a similar estimate in the context of production.
In Ref. Abazov et al. (2016c), we extracted the pole mass of the top quark from the measured cross section Langenfeld et al. (2009). However, due to the ambiguity between the MC and pole mass, the difficulty of properly assessing correlations between systematic uncertainties, and the large uncertainty of the pole mass measurement, the latter is not part of the combination presented in this article.
This article is structured as follows: we first summarize the input measurements; we subsequently present the combination of Run II dilepton measurements, which provides one of the inputs to the D0 combination; we then discuss the different uncertainty categories and their correlations, and conclude with the final combined result.
II Decay channels and input measurements
| Period | Channel | () | Method | () | Reference |
|---|---|---|---|---|---|
| Run I | Combination of matrix weighting and neutrino weighting | Abbott et al. (1998, 1999) | |||
| Run I | Matrix element | Abazov et al. (2004) | |||
| Run II | Neutrino weighting | Abazov et al. (2016a) | |||
| Run II | Matrix element | Abazov et al. (2016b) | |||
| Run II | Matrix element | Abazov et al. (2014, 2015) |
To measure the top quark mass, we use events and assume that the top and antitop quark masses are equal Abazov et al. (2011); Aaltonen et al. (2013); Aad et al. (2014b); Chatrchyan et al. (2017). Within the SM, the top quark decays into a boson and a quark almost 100% of the time. Different channels arise from the possible decays of the pair of bosons:
-
i.
The “dilepton” channel () corresponds to events ( of the total) where both bosons decay into electrons or muons. This channel is quite free from background but has a small yield. The background is mainly due to +jets production, but also receives contributions from diboson (, , ), +jets, and multijet production.
-
ii.
The “lepton+jets” channel () corresponds to events ( of the total) where one boson decays into and the other into an electron or a muon and a neutrino. This channel has a moderate yield and a background arising from +jets production, +jets production, and multijet processes.
-
iii.
The “all jets” channel ( of the total) has events in which both bosons decay to that evolve into jets. The yield is high, but the background from multijet production is very large.
-
iv.
The “tau channel” ( of the total) arises from events in which at least one of the bosons decays into . As the decays are difficult to distinguish from QCD jets, it is not exploited for the top quark mass measurement. However, the decays provide contributions to the and channels.
The high mass of the top quark means that the decay products tend to have high transverse momenta () relative to the beam axis and large angular separations. Reconstructing and identifying events requires reconstruction and identification of high electrons, muons, and jets, and the measurement of the imbalance in transverse momentum in each event () due to escaping neutrinos. In addition, identifying jets is an effective way of improving the purity of the selections. Good momentum resolution is required for all these objects, and the jet energy scale (JES) has to be known with high precision. In the Run II measurements, the uncertainty in the JES is reduced by performing an in situ calibration, which exploits the decay by requiring the mass of the corresponding dijet system to be consistent with the mass of the boson (). This calibration, determined using light-quark jets (including charm jets), is applied to jets of all flavors associated with decay. It is then propagated to the Run II measurements.
The input measurements of for the presented combination are shown in Table 1, and consist of measurements performed during Run I and Run II in the and channels using the full data sets. D0 also measured the top quark mass using the “all jets” channel in Run I Abazov et al. (2005); however, this measurement is not considered in the combination because its uncertainty is large and some subcomponents of the systematic uncertainty are not available. Just as in Run I, two mass measurements were performed in Run II using a neutrino weighting Abazov et al. (2016a) technique (NW) and a matrix element method (ME) Abazov et al. (2016b). We discuss their combination in the following section.
To combine the measurements, we use the Best Linear Unbiased Estimate (BLUE) Valassi (2003), assuming Gaussian uncertainties, both for the Run II and the final D0 combinations.
III Combination of Run II dilepton measurements
In the channel, the presence of two undetected neutrinos with high makes it impossible to fully reconstruct the kinematics of the final state. To overcome this problem, we use two methods in Run II. The NW measurement Abazov et al. (2016a) is based on a weight function for each event which is computed by comparing the – and – components of the observed and the hypothesized components of the neutrinos, integrating over the neutrino pseudorapidities Not . The maximum weight value indicates the most likely value of in that event. The first and second moments of this function are retained as the event-by-event variables sensitive to . Their distributions in MC events are used to form two-dimensional templates that depend upon the value of . The templates are compared to the data to extract . The ME Abazov et al. (2016b) measurement uses per-event probability densities, based on the reconstructed kinematic information, obtained by integrating over the differential cross sections for the processes contributing to the observed events, using leading order matrix elements for the production process and accounting for detector resolution. The unmeasured neutrino momentum components are integrated out in this computation. The probability densities from all data events are combined to form a likelihood as a function of , which is then maximized to determine .
III.1 Statistical uncertainties and correlation
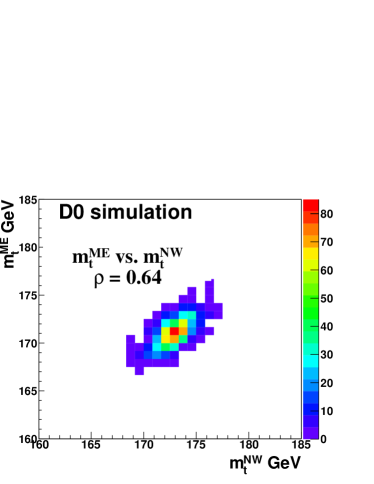
The statistical uncertainties of the individual NW and ME measurements are given in Table 2. Both measurements are carried out using the same full D0 Run II data set, and similar selection criteria. Approximately 90% of the selected events are common to both analyses, and the measurements are therefore statistically correlated. We use an ensemble testing method to estimate these correlations. In the first step, we generate 1000 ensembles of simulated background and signal events with mass =172.5 GeV that pass the criteria of either the NW or the ME selection (see Refs. Abazov et al. (2016a) and Abazov et al. (2016b) for the detailed descriptions of the selections). Each ensemble is generated with the same number of events as observed in data, using the expected signal and background fractions, separately for the , , and channels. The ME and NW ensembles are then obtained using the individual and slightly more restrictive selection criteria from each analysis, and is extracted following each of the analysis methods. From the two-dimensional distribution of the measured masses shown in Fig 1, we obtain a statistical correlation of between the two sets of measurements.
III.2 Systematic uncertainties in channel
The different contributions to the systematic uncertainty considered in the NW and ME measurements are reported in Table 2. The sources of uncertainty are listed in the following and briefly described when the naming is not self-explanatory. More detailed descriptions are given in Refs. Abazov et al. (2016a) and Abazov et al. (2016b), and in Sec. IV for the signal modeling uncertainties.
- In situ light-jet calibration:
-
The statistical uncertainty of the JES calibration, determined in the measurement using light-quark jets, and propagated to the measurements.
- Response to , , and jets:
-
The part of the JES uncertainty that originates from differences in detector response among , light-quark, and gluon jets.
- Model for jets:
-
The part of the JES uncertainty that originates from uncertainties specific to the modeling of jets. This includes the dependence on semileptonic branching fractions and modeling of quark fragmentation.
- Light-jet response:
-
The part of the JES uncertainty that affects all jets and includes the dependence of the calibration upon jet energy and pseudorapidity, and the effect of the out-of-cone calorimeter showering correction.
- Jet energy resolution
- Jet identification efficiency
- Multiple interaction model:
-
The systematic uncertainty that arises from modeling the distribution of the number of interactions per Tevatron bunch crossing.
- tag modeling:
-
The uncertainty related to the modeling of the tagging efficiency for , , and light-flavor jets in MC simulation relative to data.
- Electron energy resolution
- Muon momentum resolution
- Lepton momentum scale:
-
The uncertainty arising from the calibration of electron energy and muon momentum scales.
- Trigger efficiency:
-
The uncertainties in the estimation of lepton-based trigger efficiencies.
- Higher-order corrections:
- Initial and final state radiation:
-
The uncertainty due to the modeling of initial and final state gluon radiation.
- Hadronization and underlying events:
-
The uncertainty associated with the modeling of hadronization and the underlying event, estimated from the difference between different hadronization models.
- Color reconnection:
-
The uncertainty due to the model of color reconnection.
- PDF:
-
The uncertainty from the choice of parton density functions.
- Transverse momentum of system:
-
The uncertainty in the modeling of the distribution of the of the system.
- Yield of vector boson + heavy flavor:
-
The uncertainty associated with the production cross section for + and + relative to +jets events.
- Background from simulation:
-
The systematic uncertainty on the MC background, which includes the uncertainty from detector effects and the theoretical cross section. It does not include the uncertainties on the ratios of + and + to +jets cross sections, which belong to the previous category.
- Background based on data:
-
The uncertainties from the modeling of the multijet and +jets backgrounds estimated using data.
- Template statistics:
-
In the NW measurement, this uncertainty arises from the statistical fluctuations of individual bins in signal and background templates. In the ME measurement, there is no such uncertainty as there is no template used to fit the data.
- Calibration method:
-
The calibration for both ME and NW measurements is determined using an ensemble testing method. We generate pseudo-experiments with the same number of events as observed in data, using MC events for signal and both MC and data-based samples for backgrounds. Ensembles at different top quark mass hypotheses are generated to determine a linear relation between the uncorrected measurement and the actual MC mass, i.e., to determine slope and offset parameters. The uncertainty in the calibration method arises from the uncertainty in the slope and offset parameters due to the limited size of the MC and data-based samples.
All systematic uncertainties are considered as fully correlated between ME and NW except for the calibration method uncertainty, as the calibrations were performed using almost independent event samples.
The differences between the ME and NW uncertainties reported in Table 2 are consistent with the expected statistical fluctuations in the various estimates. The fluctuations are 0.05–0.10 , depending on the source, and their overall contributions are well below the total uncertainties. They therefore have a negligible impact on the overall uncertainties in the individual measurements and their combination.
| Run II | Run II | Run II | |
| ME | NW | combination | |
| top quark mass | 173.93 | 173.32 | 173.50 |
| In situ light-jet calibration | 0.46 | 0.47 | 0.47 |
| Response to , , and jets | 0.30 | 0.27 | 0.28 |
| Model for jets | 0.21 | 0.10 | 0.13 |
| Light-jet response | 0.20 | 0.36 | 0.31 |
| Jet energy resolution | 0.15 | 0.12 | 0.13 |
| Jet identification efficiency | 0.08 | 0.03 | 0.04 |
| Multiple interaction model | 0.10 | 0.06 | 0.07 |
| tag modeling | 0.28 | 0.19 | 0.22 |
| Electron energy resolution | 0.16 | 0.01 | 0.05 |
| Muon momentum resolution | 0.10 | 0.03 | 0.05 |
| Lepton momentum scale | 0.10 | 0.01 | 0.04 |
| Trigger efficiency | 0.06 | 0.06 | 0.06 |
| Higher-order corrections | 0.16 | 0.33 | 0.28 |
| Initial and final state radiation | 0.16 | 0.15 | 0.15 |
| Hadronization and underlying event | 0.31 | 0.11 | 0.17 |
| Color reconnection | 0.15 | 0.22 | 0.20 |
| 0.20 | 0.08 | 0.11 | |
| Transverse momentum of system | 0.03 | 0.07 | 0.06 |
| Yield of vector boson + heavy flavor | 0.06 | 0.04 | 0.05 |
| Background from simulation | 0.06 | 0.01 | 0.02 |
| Background based on data | 0.07 | 0.00 | 0.02 |
| Template statistics | n/a | 0.18 | 0.13 |
| Calibration method | 0.03 | 0.07 | 0.05 |
| Systematic uncertainty | 0.88 | 0.85 | 0.84 |
| Statistical uncertainty | 1.61 | 1.36 | 1.31 |
| Total uncertainty | 1.84 | 1.61 | 1.56 |
III.3 combination
To obtain the ME and NW combination through the BLUE method we use the correlations and uncertainties discussed in Sec. III.1 and Sec. III.2.
The result of the BLUE combination is . The breakdown of uncertainties is given in Table 2. The weights for the NW and ME measurements are 71% and 29%, respectively. The NW and ME measurements agree with a of 0.2 for one degree of freedom, corresponding to a probability of 65%. As a test of stability, we change the statistical correlation between the two methods from 0.50 to 0.70 to conservatively cover the range of systematic and statistical uncertainty in its determination. The resulting changes by less than 0.04 .
This combination of the Run II measurements is used as an input to the overall combination discussed in the next sections.
IV Uncertainty categories in the overall combination
For the overall combination, the systematic uncertainties are grouped into sources of same or similar origin to form uncertainty categories. We employ categories similar to those used in the Tevatron top quark mass combination Aaltonen et al. (2012b) and use the same naming scheme.
- In situ light-jet calibration:
-
The part of the JES uncertainty that originates from the in situ calibration procedure using light-quark jets. This uncertainty has a statistical origin. For the Run II measurement, the uncertainty from transferring the calibration to the dilepton event topology is included in the light-jet response category described below.
- Response to , , and jets:
-
As described in Sec. III.2.
- Model for jets:
-
As described in Sec. III.2.
- Light-jet response:
-
The part of the JES uncertainty that includes calibrations of the absolute energy-dependent response and the relative -dependent response, and, for Run II, the out-of-cone calorimeter showering correction. This uncertainty applies to jets of any flavor.
- Out-of-cone correction:
-
The part of the JES uncertainty that originates from modeling of uncertainties associated with light-quark fragmentation and out-of-cone calorimeter showering corrections in Run I measurements. For Run II measurements, it is included in the light-jet response category.
- Offset:
-
This includes the uncertainty arising from uranium noise in the D0 calorimeter and from the corrections to the JES due to multiple interactions. While such uncertainties were sizable in Run I, the shorter integration time in the calorimeter electronics and the in situ JES calibration make them negligible in Run II.
- Jet modeling:
-
The systematic uncertainties arising from uncertainties in jet resolution and identification.
- Multiple interactions model:
-
As described in Sec. III.2.
- tag modeling:
-
As described in Sec. III.2.
- Lepton modeling:
-
The uncertainties in the modeling of the scale and resolution of lepton , which were taken to be negligible in Run I.
- Signal modeling:
-
The systematic uncertainties arising from event modeling, which are correlated across all measurements. This includes the sources described below. In Run I, the breakdown into the first four items could not be performed, because the MC generators used at that time did not have the same flexibility as the more modern generators. Instead, the overall signal modeling uncertainty was estimated by changing the main parameters of a MC generator or comparing results from two different generators.
-
i.
The uncertainty associated with the modeling of initial and final state radiation, obtained by changing the renormalization scale in the scale-setting procedure relative to its default, as suggested in Ref. Cooper et al. (2012). Studies of data indicate that a range of variation between factors of and 2 of this scale covers the mismodeling Abazov et al. (2015).
- ii.
-
iii.
The systematic uncertainty arising from a change in the phenomenological description of color reconnection (CR) among final state partons Skands and Wicke (2007). It is obtained from the difference between event samples generated using PYTHIA Sjostrand et al. (2006) with the Perugia 2011 tune and using PYTHIA with the Perugia 2011NOCR tune Skands (2010).
- iv.
-
v.
The uncertainty associated with the choice of PDF used to generate the MC events. It is estimated in Run II by changing the 20 eigenvalues of the CTEQ6.1M PDF Nadolsky et al. (2008) within their uncertainties. In Run I, it was obtained by comparing CTEQ3M Lai et al. (1995) with MRSA Martin et al. (1994) for , and CTEQ4M Lai et al. (1997) with CTEQ5L Lai et al. (2000) for events.
-
i.
- Background from theory:
-
This systematic uncertainty on background originating from theory takes into account the uncertainty in modeling the background sources. It is correlated among all measurements in the same channel, and includes uncertainties on background composition, normalization, and distributions.
- Background based on data:
-
This includes uncertainties associated with the modeling of multijet background in the channel, and multijet and +jets backgrounds in the channel, which are estimated using data. This also includes the effects of trigger uncertainties determined from the data.
- Calibration method:
-
The uncertainty arising from any source specific to a particular fitting method, includes effects such as the finite number of MC events available to calibrate each method.
Table 3 summarizes the input measurements and their corresponding statistical and systematic uncertainties.
V Correlations
The following correlations are used to combine the measurements:
-
i.
The uncertainties listed as ‘statistical uncertainty’, ‘calibration method’, and ‘background based on data’ are taken to be uncorrelated among the measurements.
-
ii.
The uncertainties in the ‘in situ light-jet calibration’ category are taken to be correlated among the Run II measurements since the measurement uses the JES calibration determined in the channel.
-
iii.
The uncertainties in ‘response to , , and jets’, ‘jet modeling’, ‘ tag modeling’, ‘multiple interaction model’, and ‘lepton modeling’ are taken to be 100% correlated among Run II measurements.
-
iv.
The uncertainties in ‘out-of-cone correction’ and ‘offset’ categories are taken to be 100% correlated among Run I measurements.
-
v.
The uncertainties in ‘model for jets’ and ‘signal modeling’ categories are taken to be 100% correlated among all measurements.
-
vi.
The uncertainties in ‘light-jet response’ are taken to be 100% correlated among the Run I and the Run II measurements, but uncorrelated between Run I and Run II.
-
vii.
The uncertainties in ‘background from theory’ are taken to be 100% correlated among all measurements in the same channel.
A summary of the correlations among the different systematic categories is shown in Table 4. Using the inputs from Table 3 and the correlations specified in Table 4, we obtain an overall matrix of correlation coefficients in Table 5.
| D0 Run I | D0 Run II | ||||
| 0.1 | 0.1 | 9.7 | 9.7 | ||
| top quark mass | 180.10 | 168.40 | 174.98 | 173.50 | |
| In situ light-jet calibration | n/a | n/a | 0.41 | 0.47 | |
| Response to , , and jets | n/e | n/e | 0.16 | 0.28 | |
| Model for jets | 0.71 | 0.71 | 0.09 | 0.13 | |
| Light-jet response | 2.53 | 1.12 | 0.21 | 0.31 | |
| Out-of-cone correction | 2.00 | 2.00 | n/a | n/a | |
| Offset | 1.30 | 1.30 | n/a | n/a | |
| Jet modeling | n/e | n/e | 0.07 | 0.14 | |
| Multiple interaction model | n/e | n/e | 0.06 | 0.07 | |
| tag modeling | n/e | n/e | 0.10 | 0.22 | |
| Lepton modeling | n/e | n/e | 0.01 | 0.08 | |
| Signal modeling | 1.10 | 1.80 | 0.35 | 0.43 | |
| Background from theory | 1.00 | 1.10 | 0.06 | 0.05 | |
| Background based on data | n/e | n/e | 0.09 | 0.06 | |
| Calibration method | 0.58 | 1.14 | 0.07 | 0.14 | |
| Systematic uncertainty | 3.89 | 3.63 | 0.63 | 0.84 | |
| Statistical uncertainty | 3.60 | 12.30 | 0.41 | 1.31 | |
| Total uncertainty | 5.30 | 12.83 | 0.76 | 1.56 | |
| D0 Run I | D0 Run II | |||
| In situ light-jet calibration | n/a | n/a | ||
| response to , , and jets | n/a | n/a | ||
| Model for jets | ||||
| Light-jet response | ||||
| Out-of-cone correction | n/a | n/a | ||
| Offset | n/a | n/a | ||
| Jet modeling | n/a | n/a | ||
| Multiple interactions model | n/a | n/a | ||
| tag modeling | n/a | n/a | ||
| Lepton modeling | n/a | n/a | ||
| Signal modeling | ||||
| Background from theory | ||||
| Background based on data | n/a | n/a | 0 | 0 |
| Calibration method | 0 | 0 | 0 | 0 |
| Statistical | 0 | 0 | 0 | 0 |
| Run I, | Run I, | Run II, | Run II, | |
|---|---|---|---|---|
| Run I, | 1.00 | |||
| Run I, | 0.16 | 1.00 | ||
| Run II, | 0.13 | 0.07 | 1.00 | |
| Run II, | 0.07 | 0.05 | 0.43 | 1.00 |
VI Results
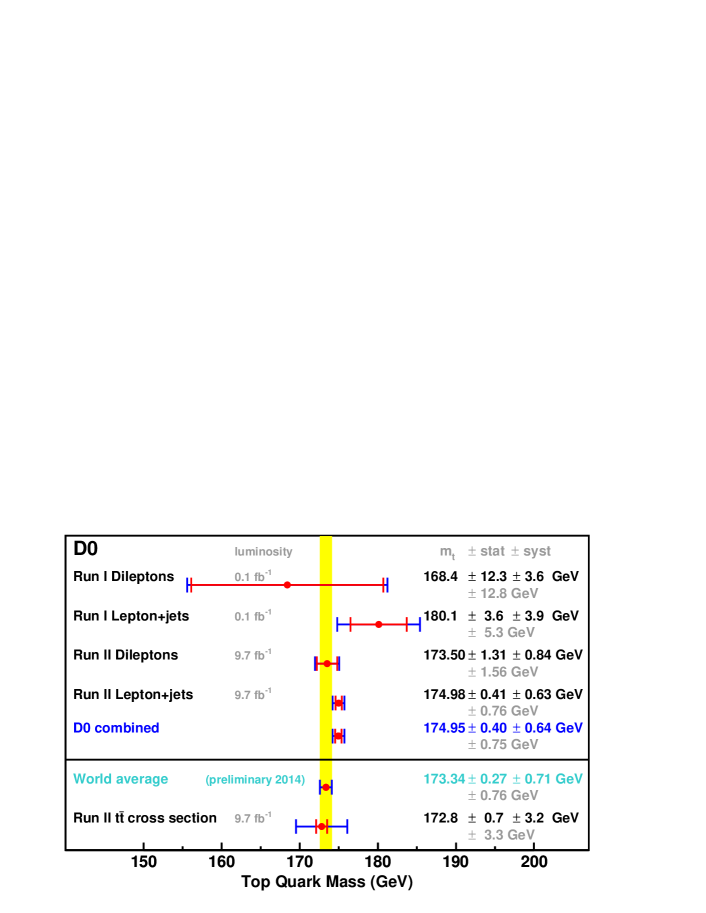
We combine the D0 input measurements of Table 3 using the BLUE method. The BLUE combination has a of 2.5 for 3 degrees of freedom, corresponding to a probability of 47%. The pulls and weights for each of the inputs obtained from the BLUE method are listed in Table 6. Here, the pull associated to each input value with uncertainty is calculated as , where is the uncertainty in the combination, and indicates the degree of agreement of the input with the combined value. The weight given to the input measurement is , where is the covariance matrix of the input measurements, and is a normalization term ensuring . The covariance matrix expressed in terms of the correlation coefficients between the measurements (with the convention ) is: , where is the Kronecker . At first order in the correlation coefficients, its inverse is given by , so that the weight can be written as , being a normalization term. This expression shows that the weight for the Run I measurement is negative mainly because the correlation with the Run II measurement (0.07) is larger than the ratio of their uncertainties (0.76/12.7).
| D0 Run I | D0 Run II | |||
|---|---|---|---|---|
| Pull | 0.98 | 0.51 | 0.63 | 1.06 |
| Weight | 0.002 | 0.003 | 0.964 | 0.035 |
The resulting combined value for the top quark mass is
Adding the statistical and systematic uncertainties in quadrature yields a total uncertainty of , corresponding to a relative precision of 0.43% on the top quark mass. The breakdown of the uncertainties is shown in Table 7. The dominant sources of uncertainty are the statistical uncertainty, the JES calibration, which has statistical origin, and the modeling of the signal. The total statistical and systematic uncertainties are reduced relative to the published D0 and CDF combination Aaltonen et al. (2012b) due primarily to the latest and most accurate D0 analysis Abazov et al. (2014, 2015). As a test of stability, we vary the correlation of the dominant source of uncertainties, ‘signal modeling’, from 100% to 0%, first between Run I and Run II measurements, and in a second check between all measurements. The combined value of does not change by more than 50 MeV, while the uncertainty changes by no more than 20 MeV. This is due to the fact that the Run II measurement dominates the combination with a weight of 96%. Thus, the combination is not sensitive to the detailed description of the correlation of systematic uncertainties. Due to a much smaller total uncertainty resulting in the large weight for the measurement, the improvement in the combined uncertainty relative to the individual uncertainty is smaller than 10 MeV.
| D0 combined values () | ||
| top quark mass | 174.95 | |
| In situ light-jet calibration | 0.41 | |
| Response to , , and jets | 0.16 | |
| Model for jets | 0.09 | |
| Light-jet response | 0.21 | |
| Out-of-cone correction | ||
| Offset | ||
| Jet modeling | 0.07 | |
| Multiple interaction model | 0.06 | |
| tag modeling | 0.10 | |
| Lepton modeling | 0.01 | |
| Signal modeling | 0.35 | |
| Background from theory | 0.06 | |
| Background based on data | 0.09 | |
| Calibration method | 0.07 | |
| Systematic uncertainty | 0.64 | |
| Statistical uncertainty | 0.40 | |
| Total uncertainty | 0.75 |
VII Summary
We have presented the combination of the measurements of the top quark mass in all D0 data. Taking into account the statistical and systematic uncertainties and their correlations, we find a combined average of . This measurement with, a relative precision of 0.43%, constitutes the legacy Run I and Run II measurement of the top quark mass in the D0 experiment.
VIII Acknowledgments
We thank the staffs at Fermilab and collaborating institutions, and acknowledge support from the Department of Energy and National Science Foundation (United States of America); Alternative Energies and Atomic Energy Commission and National Center for Scientific Research/National Institute of Nuclear and Particle Physics (France); Ministry of Education and Science of the Russian Federation, National Research Center “Kurchatov Institute” of the Russian Federation, and Russian Foundation for Basic Research (Russia); National Council for the Development of Science and Technology and Carlos Chagas Filho Foundation for the Support of Research in the State of Rio de Janeiro (Brazil); Department of Atomic Energy and Department of Science and Technology (India); Administrative Department of Science, Technology and Innovation (Colombia); National Council of Science and Technology (Mexico); National Research Foundation of Korea (Korea); Foundation for Fundamental Research on Matter (The Netherlands); Science and Technology Facilities Council and The Royal Society (United Kingdom); Ministry of Education, Youth and Sports (Czech Republic); Bundesministerium für Bildung und Forschung (Federal Ministry of Education and Research) and Deutsche Forschungsgemeinschaft (German Research Foundation) (Germany); Science Foundation Ireland (Ireland); Swedish Research Council (Sweden); China Academy of Sciences and National Natural Science Foundation of China (China); and Ministry of Education and Science of Ukraine (Ukraine).
References
- Aad et al. (2015) G. Aad et al. (ATLAS and CMS Collaborations), Combined Measurement of the Higgs Boson Mass in Collisions at and 8 TeV with the ATLAS and CMS Experiments, Phys. Rev. Lett. 114, 191803 (2015).
- Degrassi et al. (2012) G. Degrassi, S. Di Vita, J. Elias-Miro, J. R. Espinosa, G. F. Giudice, G. Isidori, and A. Strumia, Higgs mass and vacuum stability in the Standard Model at NNLO, J. High Energy Phys. 08, 098 (2012).
- Abe et al. (1995) F. Abe et al. (CDF Collaboration), Observation of top quark production in collisions, Phys. Rev. Lett. 74, 2626 (1995).
- Abachi et al. (1995) S. Abachi et al. (D0 Collaboration), Observation of the top quark, Phys. Rev. Lett. 74, 2632 (1995).
- Abachi et al. (1994) S. Abachi et al. (D0 Collaboration), The D0 detector, Nucl. Instrum. Methods Phys. Res., Sect. A 338, 185 (1994).
- Abazov et al. (2006) V. M. Abazov et al. (D0 Collaboration), The upgraded D0 detector, Nucl. Instrum. Methods Phys. Res., Sect. A 565, 463 (2006).
- Abolins et al. (2008) M. Abolins et al., Design and implementation of the new D0 level-1 calorimeter trigger, Nucl. Instrum. Methods Phys. Res., Sect. A 584, 75 (2008).
- Angstadt et al. (2010) R. Angstadt et al. (D0 Collaboration), The layer 0 inner silicon detector of the D0 experiment, Nucl. Instrum. Methods Phys. Res., Sect. A 622, 298 (2010).
- Abbott et al. (1998) B. Abbott et al. (D0 Collaboration), Measurement of the top quark mass using dilepton events, Phys. Rev. Lett. 80, 2063 (1998).
- Abbott et al. (1999) B. Abbott et al. (D0 Collaboration), Measurement of the top quark mass in the dilepton channel, Phys. Rev. D 60, 052001 (1999).
- Abazov et al. (2004) V. M. Abazov et al. (D0 Collaboration), A precision measurement of the mass of the top quark, Nature 429, 638 (2004).
- Abazov et al. (2016a) V. M. Abazov et al. (D0 Collaboration), Precise measurement of the top quark mass in dilepton decays using optimized neutrino weighting, Phys. Lett. B 752, 18 (2016a).
- Abazov et al. (2016b) V. M. Abazov et al. (D0 Collaboration), Measurement of the Top Quark Mass Using the Matrix Element Technique in Dilepton Final States, Phys. Rev. D 94, 032004 (2016b).
- Abazov et al. (2014) V. M. Abazov et al. (D0 Collaboration), Precision measurement of the top-quark mass in lepton+jets final states, Phys. Rev. Lett. 113, 032002 (2014).
- Abazov et al. (2015) V. M. Abazov et al. (D0 Collaboration), Precision measurement of the top-quark mass in leptonjets final states, Phys. Rev. D 91, 112003 (2015).
- Aaltonen et al. (2012a) T. Aaltonen et al. (CDF Collaboration), Precision Top-Quark Mass Measurements at CDF, Phys. Rev. Lett. 109, 152003 (2012a).
- Aaboud et al. (2016) M. Aaboud et al. (ATLAS Collaboration), Measurement of the top quark mass in the dilepton channel from TeV ATLAS data, Phys. Lett. B 761, 350 (2016).
- Khachatryan et al. (2016) V. Khachatryan et al. (CMS Collaboration), Measurement of the top quark mass using proton-proton data at = 7 and 8 TeV, Phys. Rev. D 93, 072004 (2016).
- Aaltonen et al. (2012b) T. Aaltonen et al. (CDF and D0 Collaborations), Combination of the top-quark mass measurements from the Tevatron collider, Phys. Rev. D 86, 092003 (2012b).
- Aad et al. (2014a) G. Aad et al. (ATLAS, CDF, CMS, and D0 Collaborations), First combination of Tevatron and LHC measurements of the top-quark mass (2014a), eprint arXiv:1403.4427.
- Juste et al. (2014) A. Juste, S. Mantry, A. Mitov, A. Penin, P. Skands, E. Varnes, M. Vos, and S. Wimpenny, Determination of the top quark mass circa 2013: methods, subtleties, perspectives, Eur. Phys. J. C 74, 3119 (2014).
- Butenschoen et al. (2016) M. Butenschoen, B. Dehnadi, A. H. Hoang, V. Mateu, M. Preisser, and I. W. Stewart, Top Quark Mass Calibration for Monte Carlo Event Generators, Phys. Rev. Lett. 117, 232001 (2016).
- Abazov et al. (2016c) V. M. Abazov et al. (D0 Collaboration), Measurement of the inclusive production cross section in collisions at TeV and determination of the top quark pole mass, Phys. Rev. D 94, 092004 (2016c).
- Langenfeld et al. (2009) U. Langenfeld, S. Moch, and P. Uwer, Measuring the running top-quark mass, Phys. Rev. D 80, 054009 (2009).
- Abazov et al. (2011) V. M. Abazov et al. (D0 Collaboration), Direct measurement of the mass difference between top and antitop quarks, Phys. Rev. D 84, 052005 (2011).
- Aaltonen et al. (2013) T. Aaltonen et al. (CDF Collaboration), Measurement of the mass difference between top and antitop quarks, Phys. Rev. D 87, 052013 (2013).
- Aad et al. (2014b) G. Aad et al. (ATLAS Collaboration), Measurement of the mass difference between top and anti-top quarks in pp collisions at TeV using the ATLAS detector, Phys. Lett. B 728, 363 (2014b).
- Chatrchyan et al. (2017) S. Chatrchyan et al. (CMS Collaboration), Measurement of the mass difference between top quark and antiquark in pp collisions at TeV, Phys. Lett. B 770, 50 (2017).
- Abazov et al. (2005) V. M. Abazov et al. (D0 Collaboration), Measurement of the top quark mass in all-jet events, Phys. Lett. B 606, 25 (2005).
- Valassi (2003) A. Valassi, Combining correlated measurements of several different physical quantities, Nucl. Instrum. Methods Phys. Res., Sect. A 500, 391 (2003).
- (31) The D0 coordinate system is right-handed, with the -axis pointing in the direction of the Tevatron proton beam and the -axis pointing upwards. The pseudorapidity is defined as , where is the polar angle relative to -axis.
- Frixione and Webber (2002) S. Frixione and B. R. Webber, Matching NLO QCD computations and parton shower simulations, J. High Energy Phys. 06, 029 (2002).
- Mangano et al. (2003) M. L. Mangano, F. Piccinini, A. D. Polosa, M. Moretti, and R. Pittau, ALPGEN, a generator for hard multiparton processes in hadronic collisions, J. High Energy Phys. 07, 001 (2003).
- Cooper et al. (2012) B. Cooper, J. Katzy, M. L. Mangano, A. Messina, L. Mijovic, and P. Skands, Importance of a consistent choice of alpha(s) in the matching of AlpGen and Pythia, Eur. Phys. J. C 72, 2078 (2012).
- Marchesini et al. (1992) G. Marchesini, B. R. Webber, G. Abbiendi, I. G. Knowles, M. H. Seymour, and L. Stanco, HERWIG: A Monte Carlo event generator for simulating hadron emission reactions with interfering gluons. Version 5.1 - April 1991, Comput. Phys. Commun. 67, 465 (1992).
- Corcella et al. (2001) G. Corcella, I. G. Knowles, G. Marchesini, S. Moretti, K. Odagiri, P. Richardson, M. H. Seymour, and B. R. Webber, HERWIG 6: an event generator for hadron emission reactions with interfering gluons (including supersymmetric processes), J. High Energy Phys. 01, 010 (2001).
- Skands and Wicke (2007) P. Z. Skands and D. Wicke, Non-perturbative QCD effects and the top mass at the Tevatron, Eur. Phys. J. C 52, 133 (2007).
- Sjostrand et al. (2006) T. Sjostrand, S. Mrenna, and P. Z. Skands, PYTHIA 6.4 physics and manual, J. High Energy Phys. 05, 026 (2006).
- Skands (2010) P. Z. Skands, Tuning Monte Carlo Generators: The Perugia Tunes, Phys. Rev. D 82, 074018 (2010).
- Nadolsky et al. (2008) P. M. Nadolsky, H.-L. Lai, Q.-H. Cao, J. Huston, J. Pumplin, D. Stump, W.-K. Tung, and C. P. Yuan, Implications of CTEQ global analysis for collider observables, Phys. Rev. D 78, 013004 (2008).
- Lai et al. (1995) H. L. Lai, J. Botts, J. Huston, J. G. Morfin, J. F. Owens, J.-W. Qiu, W. K. Tung, and H. Weerts, Global QCD analysis and the CTEQ parton distributions, Phys. Rev. D 51, 4763 (1995).
- Martin et al. (1994) A. D. Martin, W. J. Stirling, and R. G. Roberts, Parton distributions of the proton, Phys. Rev. D 50, 6734 (1994).
- Lai et al. (1997) H. L. Lai, J. Huston, S. Kuhlmann, F. I. Olness, J. F. Owens, D. E. Soper, W. K. Tung, and H. Weerts, Improved parton distributions from global analysis of recent deep inelastic scattering and inclusive jet data, Phys. Rev. D 55, 1280 (1997).
- Lai et al. (2000) H. L. Lai, J. Huston, S. Kuhlmann, J. Morfin, F. I. Olness, J. F. Owens, J. Pumplin, and W. K. Tung (CTEQ), Global QCD analysis of parton structure of the nucleon: CTEQ5 parton distributions, Eur. Phys. J. C 12, 375 (2000).