NGC 1980 is not a foreground population of Orion: Spectroscopic survey of young stars with low extinction in Orion A
Abstract
We perform a spectroscopic survey of the foreground population in Orion A with MMT/Hectospec. We use these data, along with archival spectroscopic data and photometric data, to derive spectral types, extinction values, and masses for 691 stars. Using the Spitzer Space Telescope data, we characterize the disk properties of these sources. We identify 37 new transition disk (TD) objects, one globally depleted disk candidate, and 7 probable young debris disks. We discover an object with a mass less than 0.018–0.030 , which harbors a flaring disk. Using the H emission line, we characterize the accretion activity of the sources with disks, and confirm that fraction of accreting TDs is lower than that of optically thick disks (467% versus 739%, respectively). Using kinematic data from the Sloan Digital Sky Survey and APOGEE INfrared Spectroscopy of Young Nebulous Clusters program (IN-SYNC), we confirm that the foreground population shows similar kinematics to their local molecular clouds and other young stars in the same regions. Using the isochronal ages, we find that the foreground population has a median age around 1–2 Myr, which is similar to the one of other young stars in Orion A. Therefore, our results argue against the presence of a large and old foreground cluster in front of Orion A.
Subject headings:
accretion, accretion disks — planetary systems: protoplanetary disks — stars: pre-main sequenceI. Introduction
The Orion complex is the most active star-forming region in the solar neighborhood. The age range (1–10 Myr), the diversity of local environments, and the distance (414 pc, Menten et al., 2007) of this complex make it an ideal laboratory to study challenging questions in star formation, e.g., star formation history, initial mass function, disk evolution (see e.g. Hillenbrand, 1997; Hernández et al., 2007b, a; Fang et al., 2009; Lee & Chen, 2009; Hernández et al., 2010; Hsu et al., 2012, 2013; Fang et al., 2013a; Hernández et al., 2014).
The entire Orion complex shows evidence for multiple star formation episodes, and the current, most active star formation is located in Orion A and B. Orion A, located in the southern part, consists of the most massive cluster in this region, the Orion nebula cluster, and several medium-size clusters, e.g., OMC 2, OMC 3, and Lynds 1641 (L1641). In L1641, about half of the young stellar objects (YSOs) are formed in isolation and others are formed in small aggregates (Fang et al., 2013a). Orion B is in the northern part of Orion and comprised of four clusters NGC 2023, 2024, 2068, and 2071. There is also a large population of off-cloud stellar groups aged 3-30 Myr, including the Orion OB1a and 1B associations (Briceño et al., 2005, 2007). The understanding of star formation in the Orion complex was further complicated by the discovery of a foreground population aged 4–5 Myr to Orion A (Alves & Bouy, 2012; Bouy et al., 2014). This presumably older population is centered on NGC 1980 ( Ori), and extends northward to Orion nebula cluster and NGC 1981, and eastward to L1641, thus contaminating the young populations in these regions.
In Alves & Bouy (2012), the foreground population was proposed by searching for the stars with low or no extinction in the field of Orion A. The surface densities of this population show a well-defined peak coinciding with NGC 1980, and several less distinct peaks around other star-forming regions in Orion A (Alves & Bouy, 2012; Bouy et al., 2014). In vs. color-color diagram, the stars in the population show near-infrared colors consistent with B- to M-type stars (Alves & Bouy, 2012). Therefore, Alves & Bouy (2012) propose that the NGC 1980 cluster is a foreground population seen in projection against the Orion A cloud. Alves & Bouy (2012) estimate the age of the NGC 1980 cluster on the basis of the median spectral energy distribution (SED) and the age of a massive star, Ori, which is 4–5 Myr. However, the previous studies are all based only on photometric data, and lacks spectroscopic follow-up. In this work, we provide a spectroscopic study of the putative foreground population, and address the issue of its age and other properties. Our results suggest that NGC 1980 is actually associated with the Orion A cloud and has an age similar to other star-forming regions in Orion A. We organized the paper as follows: in 2 we will describe our observations and data reduction, in 3 we will delineate our data analysis, we will present our results in 4, followed by a discussion in 5, and we will summarize our results in 6.
II. Observations and data reduction
II.1. Spectroscopic observations
| RA | DEC | Exposure | |||
| (J2000) | (J2000) | Obj | sky | ||
| Config. | Obs-date (UT) | (h:m:s) | (d:m:s) | (minutes) | (minutes) |
| 1 | 2016 Feb 4 | 05:33:54.6 | 06:01:19 | 315 | 115 |
| 2 | 2016 Feb 4 | 05:35:51.5 | 05:48:52 | 315 | 115 |
| 3 | 2016 Feb 6 | 05:35:15.9 | 04:32:58 | 315 | 115 |
| 4 | 2016 Feb 8 | 05:35:32.2 | 05:22:39 | 315 | 115 |
II.1.1 Target selection
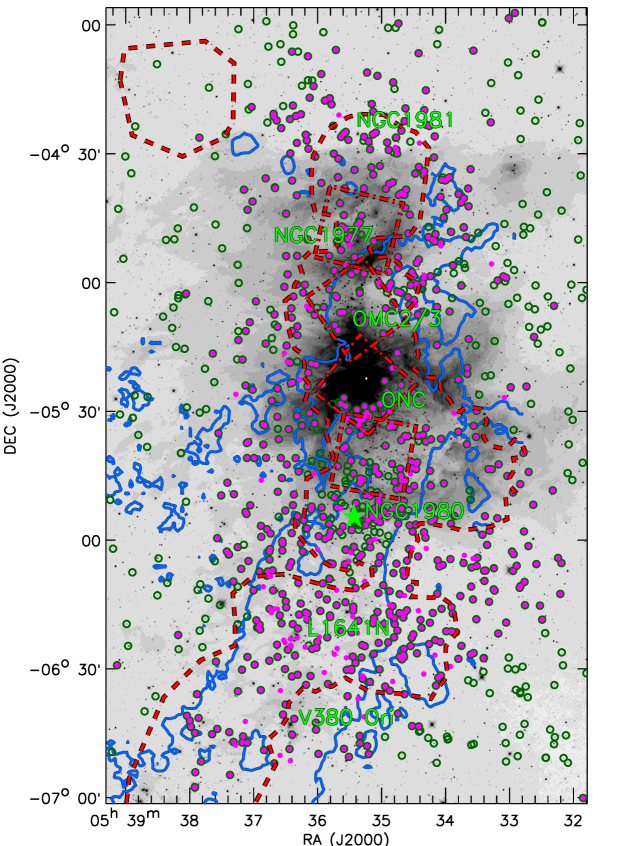
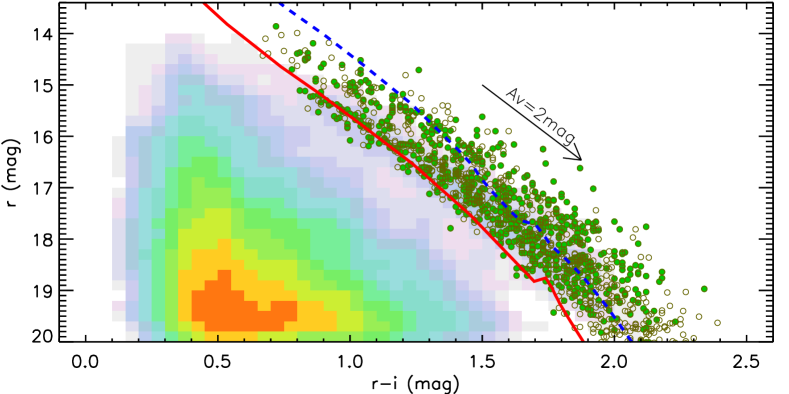
Bouy et al. (2014) lists 1895 sources with probability more than 99% of being members of NGC 1980. These stars are distributed over several tens of square degrees with the stellar surface densities peaking around the Orion molecular cloud. Our targets for the spectroscopic study of NGC 1980 are selected from Bouy et al. (2014), and are limited to the vicinity of the Orion cloud. In Fig. 1, we show the regions we studied. In this area, there are 1,275 sources with probabilities more than 99% of being memebers of NGC 1980. Hereafter, these sources are considered to be high-confidence cluster members. We search for the available spectral types for these high-confidence cluster members in the literature (Hillenbrand, 1997; Rebull et al., 2000; Rebull, 2001; Hillenbrand et al., 2013; Fang et al., 2009, 2013a; Hsu et al., 2012), and in our unpublished data from our previously spectroscopic survey with MMT/Hectospec and WHT/AF2 (Fang, M., et al. 2017, in preparation). We obtain spectral types for 330 sources from published literature, and for 172 sources from our unpublished datasets. Due to limited observing time, we only selected a subsample of high-confidence cluster members for spectroscopic observations with MMT/Hectospec. In Fig. 2, we show the color-magnitude diagram for high-confidence cluster members, as well for sources with known spectral types and stars we selected for the MMT/Hectospec observations. We calculate the 3 Myr isochrone in the color-magnitude diagram for the pre-main-sequence (PMS) stellar evolutionary models of Baraffe et al. (2015), using the BT-Settl model atmospheres (Allard et al., 2011), with solar abundances from Asplund et al. (2009) 111A discussion on the BT-Settl models with two types of solar abundances (Asplund et al., 2009; Caffau et al., 2011) can be found in Sect. III.3.. As a comparison, we show the isochrone in Fig. 2, assuming a distance 414 pc (Menten et al., 2007). Most of our targets are located above this isochrone, indicating that they are younger than 3 Myr. However, the ages of our targets could be older, if they lie much closer than Orion A. If we assume an age of 4–5 Myr for our targets as suggested in Alves & Bouy (2012), they should be located at 210 pc to match their position in the color-magnitude diagram (see Fig. 2). However, Alves & Bouy (2012) argue that the distances of these sources would not be substantially different from the ones in Orion, and might be around 400 pc, since they show similar kinematics to the Orion A molecular cloud. Therefore, the ages and the distance for these sources assumed in Alves & Bouy (2012) are inconsistent.
II.1.2 Spectroscopic observations and data reduction
We performed a low-resolution spectroscopic survey of the stellar population in NGC 1980 with the Hectospec multi-object spectrograph, capable of taking a maximum of 300 spectra simultaneously. We used the 270 groove mm-1 grating and obtained spectra in the 3700–9000 range with a spectral resolution of 5 . The targets are selected from Bouy et al. (2014), and have probabilities 99% as members of NGC 1980. Our 300 sources are distributed at 4 pointings. The data were taken in February, 2016. Table 1 lists the observational logs.
We use standard IRAF routines to reduce the Hectospec data according to standard procedures. We perform flat-field correction and extract the spectra using dome flats with the IRAF task dofibers in the package specred. The wavelength solution for Hectospec is obtained with HeNeAr comparison spectra, using the IRAF task identify and reidentify in the package specred. We calibrate the spectra with a wavelength solution constructed using the IRAF task dispcor under the package specred. For each pointing, we took 3 exposures for the science targets, and one exposure for the sky by shifting the telescope by 5 arcseconds. We extracted the spectra for each exposure. Finally, we obtained the spectra for each target and the corresponding sky spectra close to this target. We subtracted the sky from the spectra of each target, and combined the sky-subtracted spectra into one final spectrum.
II.2. Photometric data
The photometric data used in this work are mainly from Bouy et al. (2014), in which they combine the photometric data from the Sloan Digital Sky Survey (SDSS, York et al., 2000), CTIO/DECam, the Two-Micron All Sky Survey (2MASS, Skrutskie et al., 2006), the UKIRT Infrared Deep Sky Survey (UKIDSS, Lawrence et al., 2007), and the AAVSO Photometric All-Sky Survey (APASS, Henden et al., 2016), and present a catalog with photometry in the bands. The photometric data from CTIO/DECam are in bands, and have been calibrated in flux by cross-matching the common stars in the SDSS DR9 catalog in bands, and in the UKIDSS catalog in band (see Bouy et al., 2014). We complement them with the Spitzer data from Megeath et al. (2012), and Wide-field Infrared Survey Explorer (WISE, Wright et al., 2010). These infrared data is used to characterize the circumstellar disks.
II.3. X-ray data
Low-mass young stars usually present strong magnetic activity, and show two to three orders of magnitude brighter X-ray emission than the field population (Feigelson & Montmerle, 1999; Feigelson et al., 2007). Thus X-ray data can be used to distinguish young stars from field stars in star-forming regions, particularly diskless (Class III) stellar population (Feigelson et al., 2007). Part of the region studied here has been observed by the X-ray space telescopes XMM-Newton and Chandra. The sky coverage of the XMM (Proposal IDs: 004956, 008994, 009300, 011259, 011266, 013453, 040657, 050356, 060590, and 069020) and Chandra (Proposal IDs: 01200704, 03200289, and 04200331) observations are shown in Fig. 1. The X-ray data will be used to characterize the youth of our sources.
III. Data analysis
III.1. Spectral classification
The spectral types of young stars are usually obtained by classifying their observed spectra. This is typically done by building a relation between the strength of spectral features and the spectral types of dwarf stars, and apply them to the young stars (Hillenbrand, 1997; Hernández et al., 2004). Uncertainties on the spectral classification can be several subclasses depending on the spectral features and/or ranges used for the determination. One typical example is TW Hya, of which spectral type range from K6 to M2.5 (de la Reza et al., 1989; Torres et al., 2006; Pecaut & Mamajek, 2013; Vacca & Sandell, 2011; Herczeg & Hillenbrand, 2014). Pecaut & Mamajek (2013) recently studied a sample of young stars in nearby groups: the Cha cluster, the TW Hydra Association, the Pic Moving Group, and the Tucana-Horologium Association. We found that the spectral types in Pecaut & Mamajek (2013) for the same stars are typically one subclass different from those in the literature. Though it is not clear which classification results are more accurate, we decide to classify our stars based on the same criteria as those in Pecaut & Mamajek (2013).
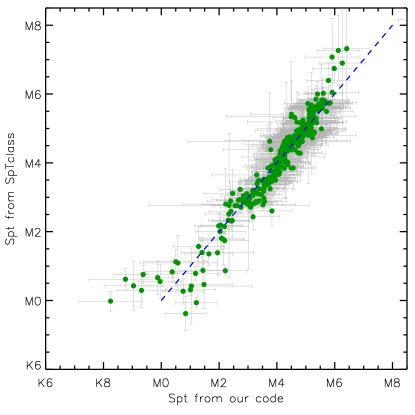
We select X-Shooter spectra for 85 young stars from ESO Phase 3 spectral data archive. Among them, 27 young stars in the Cha cluster and the TW Hydra Association have been spectrally classified by Pecaut & Mamajek (2013). We use these spectra as the templates to classify the other sources with X-Shooter spectra. Using these X-Shooter spectra, we construct new relations between the strengths of spectral features and spectral types for young stars in the range of K2-M9.5 (See the detailed description in Appendix A). The new relations should be consistent with the classification criteria from Pecaut & Mamajek (2013). Thus, the conversion from spectral types to effective temperatures, intrinsic colors, and bolometric corrections for young populations in Pecaut & Mamajek (2013) can be used for other young stars with spectral types classified based on our relations. In this work, we use these relations to classify the spectra from Hectospec. In Fig. 3, we compare the spectral types from our relations and from the SPTCLASS code (Hernández et al., 2004). It can be noted that both spectral types are consistent with each other given the uncertanty within the range of M0–M6. When the spectral types are later than M6 or earlier than M0, our relations give about one subclass ealier spectral type than SPTCLASS.
III.2. YSO selection criteria
The targets in this work are obtained from a sample of candidate pre-main sequence (PMS) stars selected from different sets of color-magnitude diagrams by Bouy et al. (2014). Some of them could be interlopers from main-sequence (MS) stars or giants. In this section, we will clarify our criteria to remove the contaminators in our sample.
III.2.1 Spectral features
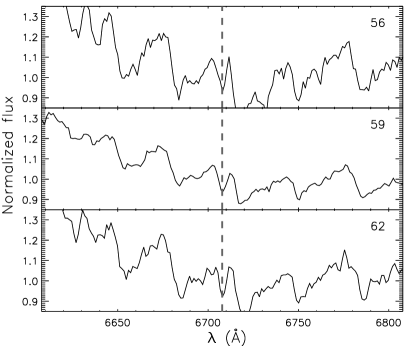
The youth of the stars can be characterized using several indicators. The typical one is the Li I absorption line at 6708 Å. In Fig. 4, we show the examples of Li I 6708Å detections for 3 sources with MMT/Hectospec. Among the 752 sources in our sample, there are 444 sources for which we have obtained spectra. Among them, 295 stars show Li I 6708Å absorption, 11 do not show clear Li I 6708Å absorption, and others have spectra too noisy for Li I 6708Å to be identified. An additional 152 stars are found to show Li I absorption in Hsu et al. (2012). In total, a group of 447 stars in our sample are identified as young stars based on the Li I 6708Å absorption. In Table LABEL:Tab:spt, we list the equivalent width (EW) of the Li I 6708Å absorption for those stars. The typical uncertainty of the Li I 6708Å EWs is around 0.1–0.2Å.
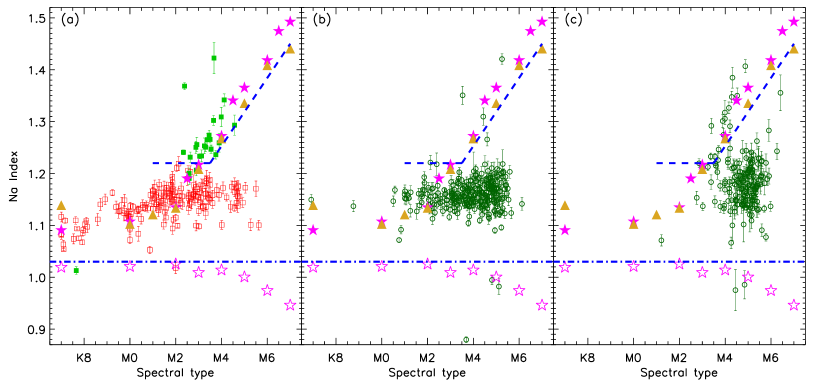
The strength of the Na I doublets at 8183 and 8195 Å has proved to be a good indicator for stellar surface gravitiy for M-type stars (Lawson et al., 2009). MS stars usually show strong Na I doublets, and giants present very weak ones. The PMS stars show the strengths of the Na I doublets between the main sequence stars and giants. In this work, we will use the as a second indicator to select the PMS stars. We calculate the strength of the Na I doublets at 8183 and 8195 Å as , where and are fluxes between 8135 and 8155 Å, and between 8180 and 8200 Å, respectively. We also calculate the for the MS stars and giants using the spectra for MS stars and giants from Danks & Dennefeld (1994) and Covey et al. (2007), respectively. To clarify the criteria for the selection of PMS stars, we use a well-studied sample of the PMS stars in L1641 (Fang et al., 2013a). In Fig. 5(a), we show the for PMS stars and MS stars identified in L1641. In the figure, we also show the expected values for MS stars and giants, which are derived from the spectra for MS stars and giants in the IRTF spectral library (Rayner et al., 2009), and the SDSS spectral templates for MS stars (Covey et al., 2007). We note that using to separate the MS and PMS stars only works for the M-type stars, which is consistent with the findings of Lawson et al. (2009). According to the distribution of the MS stars, PMS stars, and giants in Fig. 5(a), we draw the boundaries for selecting PMS stars described as follows: For spectral types between M1 and M3.5, , and for spectral types between M3.5 and M7, , where Sptnum is a number corresponding to a spectral type with 70 for M0, 75 for M5, and etc. As a comparison, in Fig. 5(b) we show the PMS stars, identified with the Li I 6708Å absorption, in this work. As expected most sources are at the PMS boundary but six of them are not. We have checked their spectra. For three of those stars, which show the values simiar to giants, the fringe patterns on their spectra can explain lower values. The other three stars with large Index(NI) values show clear Li absorption as well as strong Na I doublets at 8183 and 8195 Å. A detailed discussion of these sources is presented in Sect. IV.1. In Fig. 5(c), we show the stars without estimated Li I 6708Å EW due to their noisy spectra. For these stars, we characterize their youth using , in combination of X-ray emission and infrared excess emission.
III.2.2 X-ray emission and Infrared excess emission
In the field shown in Fig. 1, we extracted 3,688 XMM X-ray sources from the third XMM Serendipitous Source Catalogue (Rosen et al., 2015), and 1616 Chandra X-ray sources from Getman et al. (2005). We matched the X-ray sources to our sources using 1′′ tolerance, and found 171 counterparts for our targets. We note that there are more than 100 targets with X-ray sources within radii of 1–3′′. We visually check the 2MASS images, and consider those as conterparts to the X-ray sources if there is only one source within 1–3′′ from X-ray source. In this way, we found 107 counterparts in our sample for the X-ray sources. In total, we have 267 sources with X-ray emission from the XMM observations, and an additional 11 sources with X-ray emission from Chandra observations. There are two main contaminators to the YSO catalog selected based on the X-ray data: extragalactic sources and nearby foreground stars. Since we have spectra for each source, extragalactic contaminators can be excluded.
The foreground nearby main-sequence stars can show detectable X-ray emission. We used the tool, Flux Limits from Images from XMM-Newton (FLIX)222FLIX is a on-line tool provided by the XMM-Newton Survey Science Center (see http://www.ledas.ac.uk/flix/flix3). It provides robust estimates of the X-ray upper limit to a given point in the sky where there are no sources detected in the 3XMMi catalog., to estimate the 5- upper limit of the 0.2–2 keV X-ray luminosity in the studied field. We note that the 5- upper limits vary from region to region with a typical value several 1029 erg s-1 at the vicinity of Orion. The typical X-ray luminosity of field main-sequence stars is several erg s-1 for solar-type to M-type main sequence stars (Güdel, 2004). According to the 5- upper limit of the 0.2–2 keV X-ray luminosity in the XMM survey of Orion estimated with FLIX, the XMM observations can detect the field main-sequence stars within the distance50 pc. Based on the Besançon model of stellar population synthesis of the Galaxy (Robin et al., 2003), we expect only field main-sequence stars within a distance of 50 pc in the direction of Orion, suggesting that the fraction of contaminators from foreground stars in our YSO catalog, selected from X-ray emission, is negligible.
We also use infrared excess to identify the young stars. A detailed description of characterizing the disk properties of our sample is presented in Sect. III.5.
III.3. Intrinsic colors of young stars
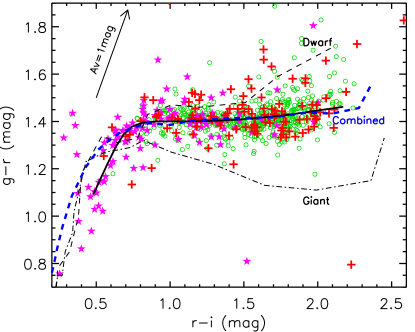
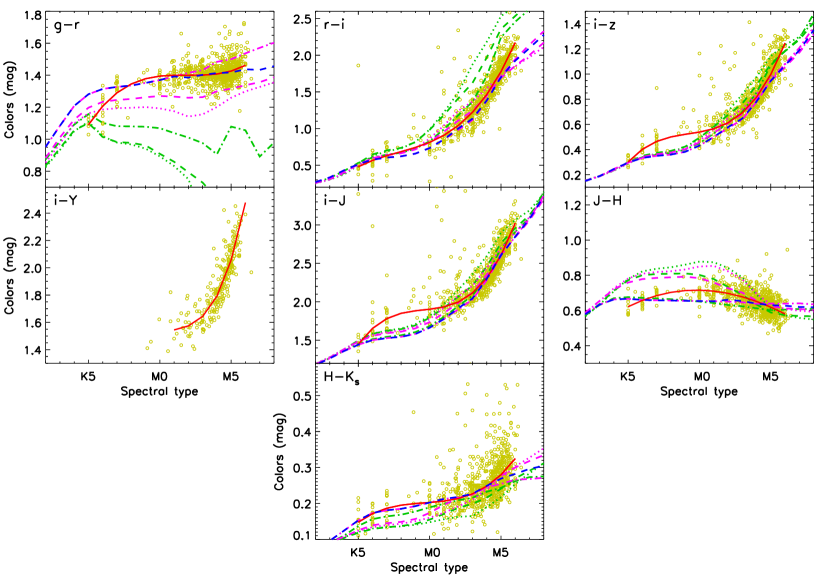
The extinction of young stars can be determined by comparing the observed colors with the intrinsic colors expected from their spectral types. In Fig. 6, we show the color-color diagram for our sources. In the figure, we also show the young stars with low extinction () in Orion OB1, Ori, and L1641 (Briceño et al., 2005, 2007; Downes et al., 2014, 2015; Hernández et al., 2014; Fang et al., 2013a). Their colors are dereddend using the extinction law from Schlafly & Finkbeiner (2011), a total to selective extinction value typical of interstellar medium dust (), and the extinction values in the literature. These young stars in other regions show colors similar to our sources, indicating that the majority of our sources in this work have low or no extinction. As a comparison, in Fig. 6 we also show the empirical colors for dwarfs and giants (Covey et al., 2007). We note that there is a shift between the observed colors and the empirical colors for the dwarfs (thin dark dashed line) and giants (thin dark dash-dotted line). In order to derive the extinction properly, we need to construct intrinsic colors for our sources. We use the sources with negligible extinction shown in Fig. 6, and extract their -band photometric data from SDSS, -band photometric data from 2MASS. The Y-band photometry is only available for the sources in Orion A, and come from Bouy et al. (2014). In Fig. 7, we show their colors vs. their spectral types. We fit the relations between them using 3-order polynomial functions. In Table 2, we list the empirical colors for young stars with spectral types ranged from K5 to M6 from the fitting.
We calculate the synthetic colors using two sets of BT-Settl atmospheric models (Allard et al., 2011, 2012): one with the solar abundances (AGSS2009) from Asplund et al. (2009), and the other with the solar abundances (CIFIST2011) from Caffau et al. (2011). Fig. 7 shows the synthetic , , , , , and colors from these models with surface gravity log g=3.5, 4.0, and 5.0. While both sets of models are consistent with each other in , , , and colors, the models with the AGSS2009 abundances show the and colors, which are more consistent with the observations than the ones with the CIFIST2011 abundances. To reproduce the observed colors, we construct a set of BT-Settl atmospheric models with the AGSS2009 abundances and using different log g values for different spectral types: log g=5.0 for the spectral types earlier than M1, log g=4.8 for spectral types between M1 and M3, log g=4.6 for spectral types between M3 and M6, and log g=4.5 for spectral types later than M6. The synthetic colors from this set of models are shown in Fig. 6 and 7, and can better fit the observations than using the atmospheric models with one log g value. Table 3 lists the synthetic colors and bolometric correction in band from this set of models. In the table, the conversions from the spectral types to effective temperatures are from Pecaut & Mamajek (2013) for stars earlier than M4 and from Herczeg & Hillenbrand (2014) for stars later than M4. In Table 3, we also list the -band bolometric correction Pecaut & Mamajek (2013, P13), and the ones from Herczeg & Hillenbrand (2015, H15). Our bolometric corrections are consistent with those in the literature.
| Teff | ||||||||
|---|---|---|---|---|---|---|---|---|
| Spt | (K) | (mag) | (mag) | (mag) | (mag) | (mag) | (mag) | (mag) |
| K5 | 4140 | 1.09 | 0.48 | 0.30 | 1.45 | 0.62 | 0.15 | |
| K6 | 4020 | 1.21 | 0.57 | 0.40 | 1.65 | 0.66 | 0.17 | |
| K7 | 3970 | 1.29 | 0.63 | 0.46 | 1.78 | 0.68 | 0.19 | |
| K8 | 3940 | 1.35 | 0.69 | 0.50 | 1.85 | 0.70 | 0.20 | |
| K9 | 3880 | 1.38 | 0.74 | 0.52 | 1.88 | 0.71 | 0.20 | |
| M0 | 3770 | 1.39 | 0.81 | 0.54 | 1.90 | 0.72 | 0.20 | |
| M1 | 3630 | 1.40 | 0.91 | 0.57 | 1.54 | 1.93 | 0.71 | 0.21 |
| M2 | 3490 | 1.40 | 1.04 | 0.61 | 1.57 | 2.00 | 0.70 | 0.21 |
| M3 | 3360 | 1.40 | 1.22 | 0.69 | 1.64 | 2.11 | 0.68 | 0.23 |
| M4 | 3160 | 1.41 | 1.46 | 0.82 | 1.79 | 2.31 | 0.65 | 0.25 |
| M5 | 2980 | 1.43 | 1.78 | 1.00 | 2.06 | 2.60 | 0.62 | 0.28 |
| M6 | 2860 | 1.46 | 2.17 | 1.25 | 2.48 | 3.02 | 0.58 | 0.32 |
| This work | P03 | H04, H05 | ||||||||||||
|---|---|---|---|---|---|---|---|---|---|---|---|---|---|---|
| Teff | Teff | BCJ | Teff | BCJ | ||||||||||
| (K) | (mag) | (mag) | (mag) | (mag) | (mag) | (mag) | (mag) | (K) | (mag) | (K) | (mag) | |||
| F0 | 7280 | 0.15 | -0.03 | -0.08 | 0.57 | 0.15 | 0.02 | 0.60 | 7280 | 0.57 | … | … | ||
| F1 | 6990 | 0.21 | -0.01 | -0.06 | 0.62 | 0.18 | 0.02 | 0.70 | 6990 | 0.68 | … | … | ||
| F2 | 6710 | 0.26 | 0.02 | -0.04 | 0.67 | 0.21 | 0.02 | 0.79 | 6710 | 0.75 | … | … | ||
| F3 | 6660 | 0.27 | 0.02 | -0.04 | 0.68 | 0.22 | 0.02 | 0.80 | 6660 | 0.76 | … | … | ||
| F4 | 6590 | 0.29 | 0.03 | -0.03 | 0.69 | 0.23 | 0.03 | 0.83 | 6590 | 0.79 | … | … | ||
| F5 | 6420 | 0.33 | 0.05 | -0.02 | 0.72 | 0.25 | 0.03 | 0.89 | 6420 | 0.85 | 6600 | 0.79 | ||
| F6 | 6250 | 0.37 | 0.06 | -0.01 | 0.76 | 0.27 | 0.03 | 0.94 | 6250 | 0.91 | … | … | ||
| F7 | 6140 | 0.41 | 0.08 | 0.00 | 0.78 | 0.29 | 0.04 | 0.98 | 6140 | 0.95 | … | … | ||
| F8 | 6100 | 0.42 | 0.08 | 0.01 | 0.79 | 0.29 | 0.04 | 1.00 | 6100 | 0.96 | 6130 | 0.95 | ||
| F9 | 6090 | 0.42 | 0.08 | 0.01 | 0.79 | 0.30 | 0.04 | 1.00 | 6090 | 0.97 | … | … | ||
| G0 | 6050 | 0.43 | 0.08 | 0.01 | 0.80 | 0.30 | 0.04 | 1.01 | 6050 | 0.98 | 5930 | 1.02 | ||
| G1 | 5970 | 0.45 | 0.09 | 0.02 | 0.81 | 0.31 | 0.04 | 1.04 | 5970 | 1.00 | … | … | ||
| G2 | 5870 | 0.49 | 0.10 | 0.03 | 0.84 | 0.33 | 0.04 | 1.08 | 5870 | 1.03 | 5690 | 1.10 | ||
| G3 | 5740 | 0.53 | 0.12 | 0.04 | 0.87 | 0.35 | 0.05 | 1.12 | 5740 | 1.08 | … | … | ||
| G4 | 5620 | 0.57 | 0.13 | 0.05 | 0.90 | 0.37 | 0.05 | 1.16 | 5620 | 1.12 | … | … | ||
| G5 | 5500 | 0.61 | 0.15 | 0.06 | 0.94 | 0.40 | 0.05 | 1.20 | 5500 | 1.16 | 5430 | 1.18 | ||
| G6 | 5390 | 0.65 | 0.16 | 0.07 | 0.97 | 0.42 | 0.06 | 1.23 | 5390 | 1.19 | … | … | ||
| G7 | 5290 | 0.69 | 0.17 | 0.08 | 1.00 | 0.44 | 0.06 | 1.27 | 5290 | 1.23 | … | … | ||
| G8 | 5210 | 0.72 | 0.18 | 0.09 | 1.02 | 0.46 | 0.06 | 1.29 | 5210 | 1.25 | 5180 | 1.26 | ||
| G9 | 5120 | 0.76 | 0.20 | 0.10 | 1.05 | 0.48 | 0.07 | 1.32 | 5120 | 1.27 | … | … | ||
| K0 | 5030 | 0.80 | 0.22 | 0.11 | 1.08 | 0.50 | 0.07 | 1.34 | 5030 | 1.30 | 4870 | 1.36 | ||
| K1 | 4920 | 0.87 | 0.24 | 0.13 | 1.12 | 0.53 | 0.08 | 1.38 | 4920 | 1.34 | … | … | ||
| K2 | 4760 | 0.95 | 0.27 | 0.15 | 1.18 | 0.58 | 0.08 | 1.42 | 4760 | 1.40 | 4710 | 1.41 | ||
| K3 | 4550 | 1.08 | 0.33 | 0.19 | 1.26 | 0.63 | 0.10 | 1.48 | 4550 | 1.44 | … | … | ||
| K4 | 4330 | 1.21 | 0.43 | 0.24 | 1.36 | 0.66 | 0.12 | 1.54 | 4330 | 1.52 | … | … | ||
| K5 | 4140 | 1.28 | 0.51 | 0.30 | 1.44 | 0.67 | 0.15 | 1.58 | 4140 | 1.58 | 4210 | 1.56 | ||
| K6 | 4020 | 1.31 | 0.58 | 0.33 | 1.50 | 0.66 | 0.17 | 1.61 | 4020 | 1.61 | … | … | ||
| K7 | 3970 | 1.33 | 0.60 | 0.35 | 1.53 | 0.66 | 0.18 | 1.63 | 3970 | 1.63 | 4020 | 1.62 | ||
| K8 | 3940 | 1.34 | 0.62 | 0.36 | 1.54 | 0.66 | 0.18 | 1.63 | 3940 | 1.63 | … | … | ||
| K9 | 3880 | 1.35 | 0.66 | 0.38 | 1.58 | 0.65 | 0.19 | 1.65 | 3880 | 1.66 | … | … | ||
| M0 | 3770 | 1.37 | 0.73 | 0.43 | 1.66 | 0.65 | 0.20 | 1.69 | 3770 | 1.69 | 3900 | 1.66 | ||
| M1 | 3630 | 1.39 | 0.85 | 0.50 | 1.78 | 0.65 | 0.21 | 1.73 | 3630 | 1.74 | 3720 | 1.73 | ||
| M2 | 3490 | 1.39 | 1.00 | 0.58 | 1.92 | 0.66 | 0.22 | 1.78 | 3490 | 1.80 | 3560 | 1.78 | ||
| M3 | 3360 | 1.40 | 1.14 | 0.65 | 2.04 | 0.65 | 0.23 | 1.82 | 3360 | 1.84 | 3410 | 1.84 | ||
| M4 | 3160 | 1.41 | 1.38 | 0.78 | 2.30 | 0.64 | 0.25 | 1.88 | 3160 | 1.91 | 3190 | 1.93 | ||
| M5 | 2980 | 1.42 | 1.70 | 0.95 | 2.61 | 0.63 | 0.27 | 1.95 | 2880 | 2.01 | 2980 | 1.99 | ||
| M6 | 2860 | 1.44 | 1.93 | 1.07 | 2.85 | 0.63 | 0.28 | 1.98 | … | … | 2860 | 2.03 | ||
| M7 | 2770 | 1.43 | 2.10 | 1.19 | 3.08 | 0.62 | 0.30 | 2.02 | … | … | 2770 | 2.06 | ||
| M8 | 2670 | 1.46 | 2.28 | 1.35 | 3.37 | 0.62 | 0.30 | 2.05 | … | … | 2670 | … | ||
| M9 | 2570 | 1.55 | 2.36 | 1.60 | 3.77 | 0.57 | 0.33 | 2.11 | … | … | 2570 | … | ||
III.4. Determining stellar properties
We derive the extinction for our sources using the empirical colors listed in Table 2 for the ones with spectral types earlier than M6, and the synthetic colors in Table 3 for those with spectral types later than M6. Using the intrinsic colors of , , , , we derive mean visual extinctions () for individual sources employing the extinction law from Schlafly & Finkbeiner (2011) and a total to selective extinction ratio typical of interstellar medium dust (). We converted the spectral types to effective temperatures using the relation in Table 3, and derive the stellar luminosities for our sources using the -band bolometric correction for the corresponding spectral types calculated in this work. The stellar luminosities () are then calculated as follows:
where is the the bolometric correction in band, is the dereddened apparent magnitude in band, is the distance in the unit of pc, is the bolometric magnitude of the Sun. Here we take (Mamajek, 2012).
III.5. Characterizing disk properties
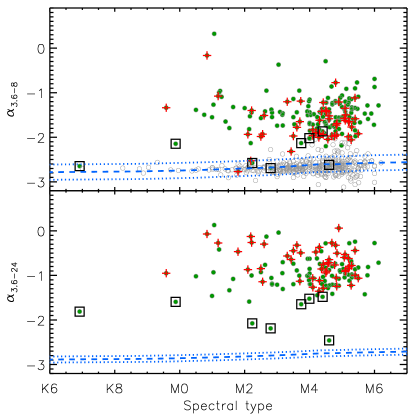
We characterize the disk properties by comparing the model atmosperes from the BT-Settl models with the observed spectral energy distributions. The typical way is to compare the infrared spectral slopes with the expected slopes at the same wavelength ranges from purely photospheric emissions (Luhman et al., 2008). The infrared spectral slopes, defined as , are calculated with the dereddened photometry in each band. We compute two sets of infrared spectral slopes, and , corresponding to the spectral range of [3.6] to [8.0] and [3.6] to [24], respectively. Table LABEL:Tab:spt lists the two infrared spectral slopes of the sources with detection in the corresponding infrared bands. In Fig. 8, we show the infrared spectral slopes, and versus the spectral types, for our sources. As a comparison, we calculate the spectral slopes (see Fig. 8) of the BT-Settl atmospheric models (Allard et al., 2012), assuming a 10% uncertainty in Spitzer photometry. Stars with the infrared spectral slopes steeper than the slopes of photospheric emissions are considered to be diskless. For sources with shallower infrared spectral slopes, we visually examine their SEDs. The sources that show infrared excess at more than 3 confidence level are considered to have disks. A total of 185 sources belong to the disk population. In addition, there are 119 sources without detection in all the four IRAC bands. We visually compare their SEDs, constructed from the available Spitzer and WISE photometric data, to their photospheric emission. Among the 119 sources, 9 sources show infrared excess at more than 3 confidence level, and are considered to have disks. In Table LABEL:Tab:spt, we list the disk property of each source.
The young stars can be grouped into weak-line T Tauri stars (WTTS) or classical T Tauri stars (CTTS) based on their H . WTTSs have stopped accretion, and show weak and narrow H emission line in the spectra, while CTTSs are still accreting, and present strong and broad H emission lines. We divide the YSOs into WTTS or CTTS using the criteria described in Fang et al. (2009), in which a star is classified as a CTTS if (H) Å for K0–K3 stars, (H)5 Å for K4 stars, (H) Å for K5–K7 stars, (H) Å for M0–M1 stars, (H) Å for M2 stars, (H) Å for M3–M4 stars, (H) Å for M5–M6 stars, and (H) Å for M7–M8 stars. Table LABEL:Tab:spt list the H of each source and its accretion property. However, we must stress that using (H) to distinguish WTTSs and CTTSs can fail to distinguish some stars that have low accretion rates, strong chromospheric activity, sky contamination, or self-absorptions of the H line.
IV. results
IV.1. A census of PMS stars
We identify PMS stars mainly based on the Li I 6708Å absorption. With this criterion, a sample of 447 stars are classified as PMS stars. For others without estimate of the EWs of Li I 6708Å absorption line, we use the to select the PMS stars as described in Sect. III.2.1, which works for stars with spectral types later than M1. With this criterion, an additional 164 stars are classified as PMS stars. We also include 64 additional stars which show X-ray emission, and 27 additional stars with infrared excess emission. A total of 691 sources are classified as PMS stars according to the above criteria. Table LABEL:Tab:spt list these stars, as well as the criteria to classify them as the PMS stars.
We use the to assess the contamination in our PMS sample from young field stars which may show weak Li I 6708Å absorption line. In our sample, there are 447 sources with estimated EWs of Li I 6708Å absorption line, and 63% of them (283/447) have the in Table LABEL:Tab:spt. As noted in Sect. III.2.1, there are three sources, ID 156, 438, 572 in Table LABEL:Tab:spt, that are located outside the PMS boundary in Fig. 5(b) and show similar to the field dwarfs. However, for two sources, ID 156 and 438, the strengths of their Li I 6708Å absorption lines are consistent with other young stars in Orion (see, e.g., Fang et al., 2013a). Hence, it is unclear why they show the strong Na I doublets. For the source 572, its Li I 6708Å absorption line is weak (0.2), and could be a young field dwarf. Therefore, we expect that the contamination in our sample from the field dwarfs is not significant.
IV.2. Stellar properties
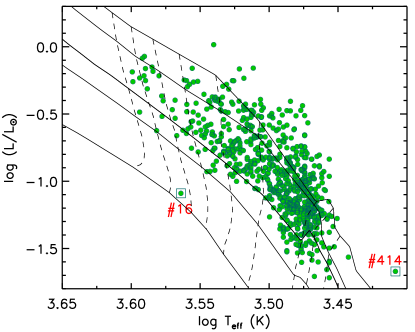
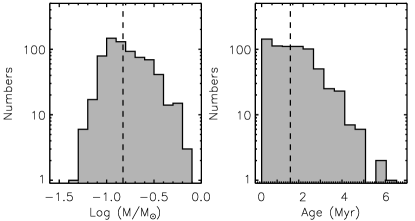
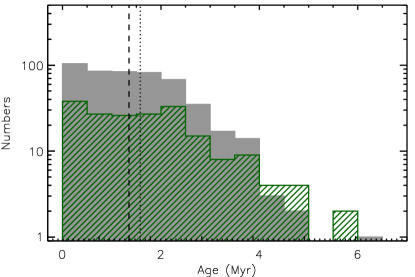
We derive the extinction of individual sources in the way described in Section III.4. The typical uncertainty for our measurements is around 0.3 mag, estimated from the sources without extinction in our sample. The resulting visual extinctions are listed in Table LABEL:Tab:spt. With the derived effective temperatures and bolometric luminosities using the method described in Sect. III.4, assuming a distance of 414 pc, we place the stars in the H-R diagram in Fig. 9. Most of our sources lie between the 0.1 and 3 Myr isochrones. We use a distinct symbol (open square symbols) for an “exotic” object that is apparently subluminous and a extremely low-mass object (see Section IV.3.1 and Section IV.3.2). We derive the masses and ages of the stars using the PMS evolutionary tracks from Baraffe et al. (2015). For the stars above the youngest isochrone (0.5 Myr) from the evolutionary models, their masses are estimated using the 0.5 Myr isochrone since the low-mass stars are evolving vertically in H-R diagram during the first several Mys. In Table LABEL:Tab:spt, we list the stellar masses and ages of the stars. Seventeen objects in our sample have masses less than 0.075 , and are brown dwarfs. Among them, the source 414 has the minimum mass (0.018 ). In Fig. 10, we show the mass and age distributions of our sample. The median mass and age of our sample is 0.15 and 1.4 Myr, respectively. In Fig. 11, we show the age distributions of the young stars with and without disks. Both populations show a similar age distribution with most of stars younger than 2.5 Myr. The median ages of the two populations are 1.3, and 1.6 Myr for diskless and disk populations, respectively.
We must stress that the stellar ages derived from the H-R diagram are dependent on the distance that we use. Here, we assume that the foreground population is associated with the Orion molecular cloud, and use the same distance (414 pc) as Orion, which is supported by the fact that the foreground population and the Orion molecular cloud show similar kinematics (see Sect V.1).
IV.3. Disk properties
IV.3.1 A subluminous object
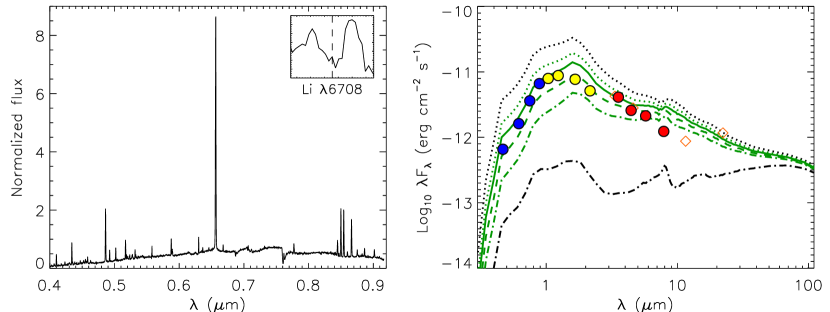
In the H-R diagram (see Fig. 9), one source (ID 16 in Table LABEL:Tab:spt) appears to be subluminous compared with others with the similar spectral type. In its spectrum, we detect Li I 6708Å absorption line, indicating that it is a PMS star. The isochrone age of this object is 23 Myr. However, its optical spectrum show numerous strong emission lines. Among them (see the left panel in Fig. 12), the H are the strongest one with the EW of . Such strong emission lines in the spectrum of Source 16 indicate that it should be much younger than its isochronal age (23 Myr). Its SED shows the strong infrared excess emission (see the right panel in Fig. 12), suggesting that it is surrounded by a disk. Similar young stars have been discovered in our previous spectroscopic surveys in Orion (Fang et al., 2009, 2013a), and also found in other regions, e.g., the Lupus 3 dark cloud, Taurus, and Cha (Comerón et al., 2003; White & Hillenbrand, 2004; Fang et al., 2013b). One promising hypothesis for these exotic objects is that they are harboring disks with high inclinations, and the light seen mainly comes from photons scattered off the disk surface, and is therefore much reduced. The optical emission lines may arise in outflows or disk winds with emitting areas much larger than the central star, which allows at least part of the line fluxes to reach us relatively unattenuated. We employ the radiative transfer code RADMC-3D (Dullemond, 2012) to model the SED of Source 16. We set the stellar effective temperature to 3,664 K (M0.8) and stellar radius 1.3 , corresponding to a PMS star with mass 0.4 and an age 2 Myr (Baraffe et al., 2015). We set the outer disk radius () to 100 AU, and assume a pressure scale height () that varies as a power law with the radius (), . We vary the disk mass () from , 5, 1, 5, to , the inner disk radius () from 0.1, 0.2, 0.3, to 0.4 AU, (: the pressure scale height at ) from 0.1, 0.2, to 0.3, and disk inclinations from 60∘ to 83∘. We find that the SED of Source 16 can be reproduced by a model with parameters =0.1, =–1, and =0.1–0.4 AU, and an inclination 79–82∘ (see Fig. 12 for a representative model). A lower or higher disk inclination can lead to significantly over-predicted or under-predicted fluxes at short wavelengths, respectively (see Fig. 12).
The prominent emission lines in the spectrum of ID 16 include Balmer lines, He I lines at 5876 Å and 6678 Å, [O I] lines at 5577 Å and 6300 Å, Ca II infrared triplet (8498, 8542, 8662 Å), as well as many other lines. Such a spectrum rich in emission lines is similar to the one of EX Lup, an M0-type young star and the prototype of EXor variable star (Sicilia-Aguilar et al., 2015a). A detailed identification of all the lines and a comparison of ID 16 to EX Lup would require spectra with high spectral resolution. If the underluminosity of ID 16 is due to the occultation and scattering of photospheric emission by a highly inclined disk, we would expect that the EWs of the accretion-related lines are simialr to the ones typical to T Tauri stars since they are formed in the magnetospheric infall flows, which are close to the stellar surface and should be similarly occulted. We notice that the source shows the normal He I 6678 Å line, but 4 times higher EWs of He I 5876 Å line, and 10 times higher EWs of Ca II infrared triplet, compared with other CTTSs in Orion(see e.g. Fang et al., 2009). Both He I emission lines and Ca II infrared triplet are related to accretion activities. The large EWs of these lines could be explained if ID 16 is actively accreting. The spectrum of ID 16 also shows [O I] lines at 5577 Å and 6300 Å with which are also 10 times higher than the ones typical to T Tauri stars (Simon et al., 2016). However, these [O I] lines could be contaminated by telluric [O I] emission lines since our spectral resolution is low. In the spectrum of ID 16 we did not clearly detect the the [S II] emission lines at 6716 Å and 6731 Å, but may see two peaks near them. The [S II] lines are thought to arise in jets emerging from accreting YSOs. New spectral data with high spectral resolution and signal-to-noise ratio is needed to identify them explicitly. Here, we must stress that the source ID 16 could be also a young star with a distance much larger than Orion. In this case, we do not need a highly inclined disk to reproduce its SED, and the distance of ID 16 could be 1 kpc, if its age is around 1 Myr.
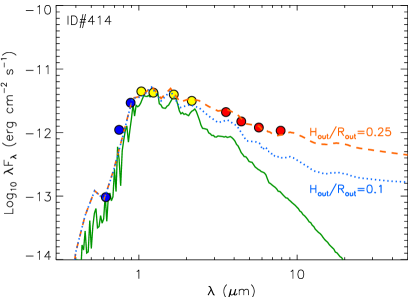
IV.3.2 A disk around an extremely low-mass object
In our sample, Source 414 has the latest spectral type. Its spectral type in this work is M91, which is consistent with the one (M8) in Hillenbrand et al. (2013) given the uncertainties. In the H-R diagram, this object is above the youngest PMS isochrone (0.5 Myr) from Baraffe et al. (2015). Assuming a 0.5 Myr isochrone, the mass of a source with a spectral type M8–M9 is around 0.018-0.030 . However, the mass of 0.018-0.030 should be considered as the upper limit for Source 414, since the effective temperatures of young extremely low-mass objects decrease during their evolution (Baraffe et al., 2015). In Figure 13 we show the SED of this object. Its SED shows infrared excess emission in all four IRAC bands, suggesting that it possesses a disk. We employ the radiative transfer code RADMC-3D to model the SED of the source 414. We set the stellar effective temperature to 2,570 K (M9) and the stellar radius to 0.84 , and a disk mass to 1, and the inner edge to the dust sublimation radius, set to 50 AU, and assume . We vary () from , 5, 1, 5, to , from 0.1, 0.15, 0.2, 0.25,to 0.3, and and disk inclinations from 0∘ to 80∘. We find that a flaring disk model with =0.25–0.3, =5–1 and an disk inclination 50∘ can reproduce the SED of Source 414. In Fig. 13, we compare the model SED with 0.25 (a flaring disk model) with the one with 0.1 (a flat disk model). Both flat and flared disks have been found around brown dwarfs (Apai et al., 2005; Pascucci et al., 2009).
IV.3.3 Evolved disks
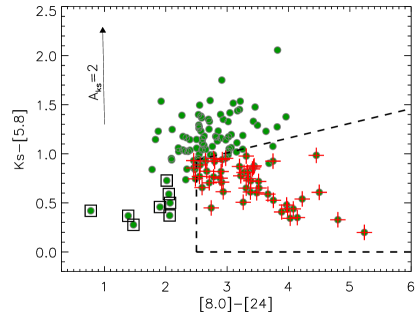
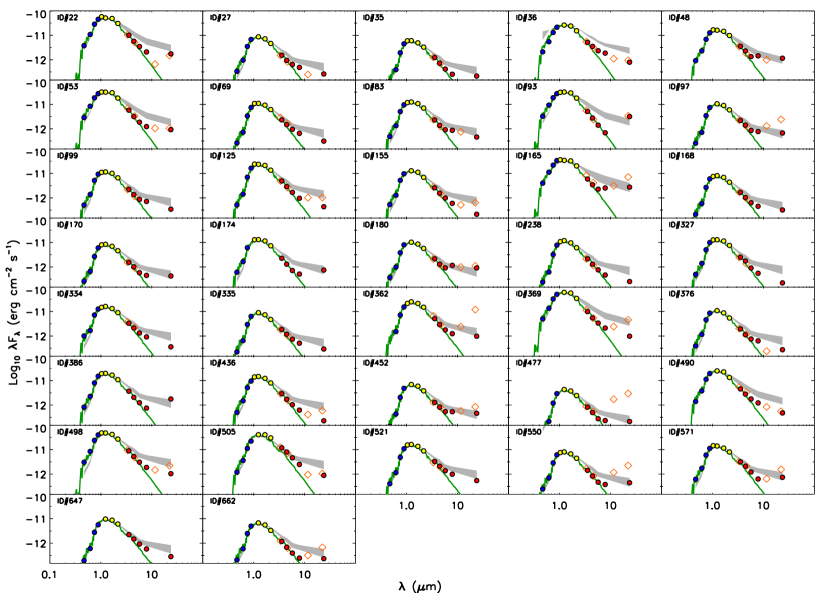
In our sample, 689 sources have infrared photometry in at least three IRAC or WISE bands and can be classified to be diskless or harboring disks. Among them, 72% (495/689) are diskless, and the rest are disk sources. Among the disk population, we select transition disk (TD) candidates based on colors as shown in Fig. 14: [8.0][24]2.5 and [5.8]0.56([8.0][24])0.15. For individual candidates, we compare their SEDs with their model photospheric emissions, as well as the median SEDs of L1641 CTTSs (Fang et al., 2013a), corresponding to their spectral types. A total of 49 sources are confirmed as TD objects which show very weak or no infrared excess at near-infrared wavelengths and shorter IRAC bands, but strong excess emission at mid-infrared and longer wavelength. Among them, twelve TDs have already been described in the literarure (Fang et al., 2013a; Kim et al., 2013). In Fig. 15, we show the SEDs of the 37 new TDs in this work.
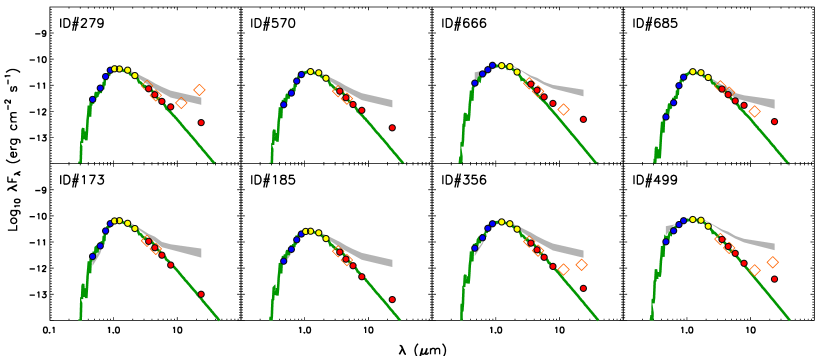
In our sample, we also found 8 sources which are detected in 24 m, and show much weaker infrared excess emission than a typical TD. Their infrared spectral slopes and colors are smaller than other sources (see Fig. 8 and 14). In Fig. 16, we show the SEDs of those sources. Among these sources, one object (ID 666) shows the depleted infrared excess emission through the four IRAC band to 24 m, and thus could be a globally depleted disk candidate, which can be produced when disks are deficient in small dust grains (Currie et al., 2009; Sicilia-Aguilar et al., 2011). In contrast to Source 666, the SEDs of the objects 279, 570, and 685 start to show the infrared excess emission from 8 m, while the others show infrared excess only at 24 m. The weak infrared excess emission of the seven sources indicate that their inner disks have been more strongly dissipated than a typical TD in the same region. Without the data at far infrared bands, it is unknown if these sources are TDs with a big inner hole, or young debris disks. Actually, we also found two similar sources in L1641 (Fang et al., 2009, 2013a), one of which shows strong excess emission at 70 and 160 m (Source 069001 in Stutz et al., 2013), suggesting that this object is a TD with a big inner hole. Similar objects have been found in the Tr 37 cluster (Sicilia-Aguilar et al., 2013, 2015b).
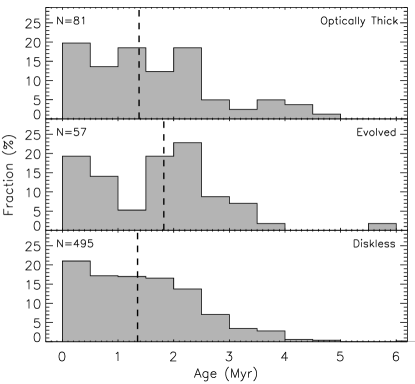
In
we show the age distributions of the three populations. The median ages of the sources with optically thick disks(), evolved disks, and without disks are 1.4 Myr, 1.8 Myr, and 1.4 Myr, respectively. We note that the median age of the evolved disk systems is slightly larger than the other two populations. However, since each population shows a very broad distribution, the difference among their median ages is not significant.
IV.3.4 Accretion in disks at different evolutionary stages
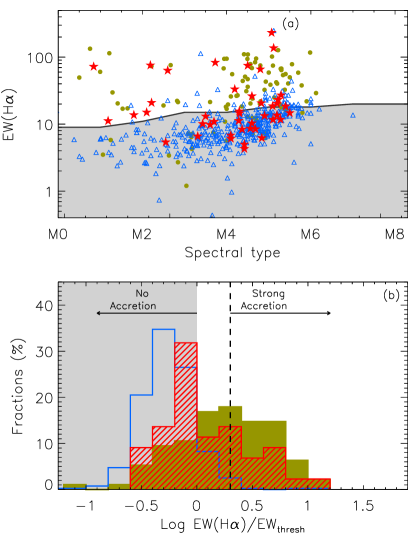
In Fig. 19(a), we compare the H s for sources with TDs, optically thick disks(), or without disks. It can be noted that the YSOs with optically thick disks usually present strong H emission, while diskless YSOs show weak H emission. However, for TDs, about half of TDs show no accretion, while a small fraction of them show strong accretion. In Fig. 19(b), we display the distribution of logarithmic ratio between the observed H and the threshold for the three populations shown in Fig. 19(a). Here, threshold is the one used to classify the YSOs into CTTSs or WTTSs, and is the spectral type dependent (see Sect. III.5). According to these thresholds, 739% of YSOs with optically thick disks are accreting, while only 467% of TDs are accretors. If we define “strong accretion” sources to have H s greater than twice the thresholds, % of TDs belong to this group. For the YSOs with optically thick disks, this fraction is 4510%. The accretion properties among the different types of disks are consistent with our previous studies (Fang et al., 2009, 2013a; Sicilia-Aguilar et al., 2010, 2013). For the eight evolved disks shown in Fig. 16, seven of them have estimates of H . Six of them show no accretion, and one (499) shows H which is just above the threshold to be classified as a CTTS. Therefore, the fraction of accretors among these sources should be less than 14%, suggesting these objects are much more evolved than TDs.
V. Discussion
V.1. Is the foreground population associated with the Orion A cloud?
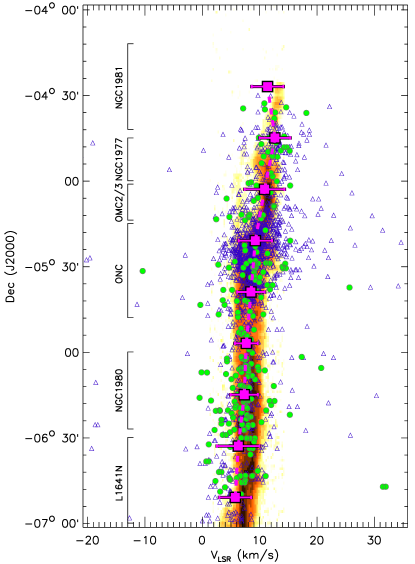
Tobin et al. (2009) performed a kinematic survey of 1,613 stars which span from NGC 1977 to L1641N. Their study suggests that the kinematics of young stars are consistent with the ones of their local clouds. Using the kinematic data from Tobin et al. (2009), Alves & Bouy (2012) show that the velocity dispersion of young stars near NGC 1980 is much smaller than those in other parts of Orion, though their kinematics are consistent with the gas. Therefore, they concluded that NGC 1980 is a distinct population from others. In this work, we use a better dataset to re-visit this issue. Our data are collected from the SDSS APOGEE INfrared Spectroscopy of Young Nebulous Clusters program (IN-SYNC) survey of the Orion A molecular cloud (see detailed description in Da Rio et al., 2016). In the region studied here, we find more than 2,200 sources, which have been observed with SDSS and have velocity uncertainties less than 0.5 km s-1. The size of this sample is much larger than the one (287 sources) with the same accuracy from Tobin et al. (2009). Among the APOGEE sample, more than 1,650 sources can be classified as young stars from the X-ray emission or infrared excess emission. In this dataset, we find 280 sources in the foreground population. In Fig. 20 (left), we show their radial velocity data as well as the ones of the other young stars in Orion A. As a comparison, we also show the PV diagrams for the gas emission in Orion A cloud. We do not find any significant difference between the kinematics of the foreground population, other young stars, and the gas material in Orion, which confirms the previous result in Tobin et al. (2009). Futhermore, we derive the velocity dispersions of all the young stars in Fig. 20 (left) as did in Tobin et al. (2009). However, we do not find significant difference between the the velocity dispersions of young stars at the different locations of Orion A. Therefore, our study suggests that the foreground population, as other young stars in this region, are associated with the Orion A cloud. Here, we must stress that the kinematic study is only based on the radial velocities of the stars, and can be improved in the future with their proper motions from Gaia
V.2. Is the foreground population older than other regions in Orion A?
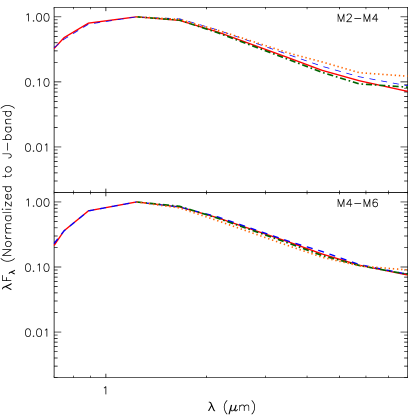
As shown in Fig. 10 (right), the median age of the foreground population with spectroscopic data is around 1.4 Myr, which is younger than the age (4–5 Myr) proposed by Alves & Bouy (2012) for this population. In the previous work, the age is deduced based on two arguments: (1) the age of Ori, (2) the median SED of the disk population in NGC 1980. Gies & Bolton (1986) revealed that Ori is eccentric binary (O9 III+B1 III), and proposed that it could be formed as a result of binary-binary encounter that ejected the two runaways (AE Aur, Col), which is confirmed by Hoogerwerf et al. (2000) using the data supplemented with the available radial velocities. The trapezium cluster is the most likely parent for the three sources. Therefore it is still unclear if the Ori is related to the foreground population, and therefore uncertain to use the age of Ori as the one of the whole foreground population. When comparing the shapes of SEDs, Alves & Bouy (2012) normalized the SEDs of different regions to the -band flux. We note there are systematic differences between the SEDs of these regions at wavelength shorter than -band, which may suggest that the extinctions of different regions have not been corrected when they constructed the SEDs. We estimate how the extinction affects the spectral slopes. For = 5, the dereddened spectral slope between -band and Spitzer 8 m band can be 0.5 less than the observed spectral slopes. In Fig. 21, we compare the median SED of class II sources in this work with those in Orion nebula cluster (ONC, 1 Myr), L1641 ( 1.5 Myr), and Ori (3 Myr), using the data from the literature (Hillenbrand, 1997; Da Rio et al., 2010; Megeath et al., 2012; Fang et al., 2009, 2013a; Hernández et al., 2007a, 2014). These regions have been extensively surveyed with spectroscopy, which provides a reliable estimate of extinction for each source. In this work, most of sources are mid-M spectral types. Therefore, we only include the M-type stars for constructing the median SEDs. We divide the sources into two groups according to their spectral types: M2–M4 and M4–M6, since the luminosity of central stars can affect the infrared spectral slopes. For individual sources, their SEDs are first extinction-corrected before combination. The extinction law is from Schlafly & Finkbeiner (2011) for the SDSS bands adopting a total to selective extinction value typical of interstellar medium dust (), Rieke & Lebofsky (1985) for the 2MASS bands, and Flaherty et al. (2007) for the Spitzer bands. Figure 21 show the median SEDs of different clusters. After correcting the extinction, we do not see any significant difference between the foreground population and other regions in Orion, especially for the M4-M6 group. The low disk fraction (28%) of this population may indicate that this population may be older than its median isochronal age according to the relation between disk fractions and ages (Haisch et al., 2001; Sicilia-Aguilar et al., 2006; Hernández et al., 2007a; Fang et al., 2012, 2013b). However, this population is mostly likely biased against sources with hot inner disks, those showing -band excess emission, since their sample selection criteria select stars with or colors similar to the intrinsic photospheric colors (Alves & Bouy, 2012; Bouy et al., 2014). The typical fraction of sources with hot inner disks is 40%–50% for a young population with an age of 1–2 Myr (Hillenbrand, 2005; Yasui et al., 2010). The low disk fraction (28%) of our sample is most likely due to the exclusion of sources with hot inner disks.
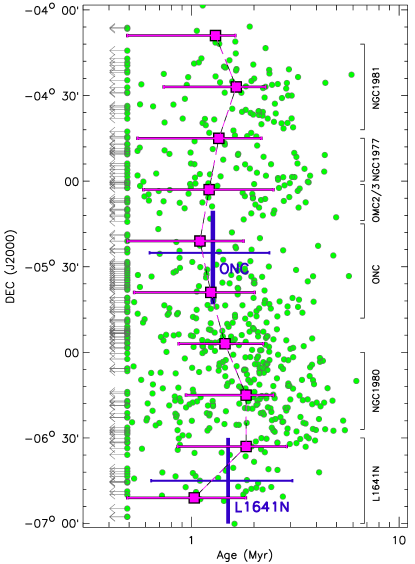
In Fig. 20 (right), we show the ages of sources in the foreground population vs. their declination. In different declinations, the ages of the stars all show large age spread with ages ranged from 0.5 Myr to 6 Myr. We divide the sources into different groups according to their declination, and derive the median ages. In the figure, we show these median ages as well as the bars which show the ranges including 50% of sources near the median ages. The median ages of the foreground population in the whole region are all around 1–2 Myr, and clearly younger than the age (4–5 Myr) proposed in Alves & Bouy (2012). Along the declination, though it is not statistically significant, the median ages of different regions seem to show a slight gradient, and the median ages of the stars around NGC 1980 are slightly older (1.8 Myr) than other regions, which is consistent with the result in Da Rio et al. (2016). As a comparison, we show the median ages of ONC (1.3 Myr) and L1641N (1.5 Myr). For both regions, we re-estimate their ages using the same PMS evolutionary tracks from Baraffe et al. (2015) as we did for the foreground population. The effective temperature and luminosity of each star in ONC is collected from Da Rio et al. (2010), and those in L1641N are from Fang et al. (2013a). In addition, we only include the sources with spectral types between K7–M6, which is range of spectral types for the foreground population in this work. As shown in Fig. 20 (right), the median ages (1–2 Myr) of the foreground population are consistent with the ones of ONC and L1641N.
V.3. Is the foreground population from one cluster?
In Alves & Bouy (2012) and Bouy et al. (2014), they proposed that the foreground population in Orion is from one cluster and centered on NGC 1980. However, as discussed in the above two sections, we can see that the kinematics of the foreground population are consistent with their local clouds and other young stars in the same regions. In Fig. 20 (left), the gradient in the kinematics of Orion A cloud can be clearly shown in the kinematics of the foreground population, which is a strong evidence that the foreground population is associated with the local clouds instead of being one cluster. Furthermore, we may see an age gradient along the declination, and the median age of the sources near NGC 1980 is slightly higher than others. Such age gradient should not be seen if the foreground population are from the same cluster. Therefore, our results argue against the presence of an old, large foreground cluster in front of Orion A. We propose that the foreground population seen in Alves & Bouy (2012) and Bouy et al. (2014) is a combination of young stars with low or no extinction in NGC 1980 and other regions in Orion A.
VI. Summary
We performed a spectroscopic survey of the foreground population in Orion A with MMT/Hectospec. We combine the Hectospec data with optical and infrared photometric data to estimate the stellar effective temperatures, luminosities, and extinction values of individual sources, and derive masses and ages of individual sources by their placement in the H-R diagram. The disk properties of individual sources are characterized using Spitzer and WISE data, and their accretion properties are characterized using the H line. We also use archival APOGEE radial velocity data to study the kinematics of the foreground population and other young stars in the Orion A cloud. The main results are summarized as follows.
-
1.
We present a catalog of 691 young stars including their spectral types, line of sight extinction, stellar masses and ages, disk properties, and accretion properties.
-
2.
We find one new subluminous object in our spectroscopic sample, and explain it as a star with a nearly edge-on disk.
-
3.
We discovered an object with extremely low mass (0.018–0.030 ). The SED modeling indicates this object possesses a flaring disk.
-
4.
We identify 37 new transition disk objects, one globally depleted disk candidate, and 7 young debris disk candidates. We investigate the accretion properties of YSOs with disks in our sample based on H . We find that the fraction of accretors among transition disks is much lower than among the YSOs with optically-thick disks (467% versus 739%, respectively), which confirm our previous results in L1641.
-
5.
We confirm that the kinematics of the foreground population is consistent with their local clouds and other young stars in the same regions in Orion A. The median age of the foreground population is also similar to those of other young stars in Orion A. Therefore, our results suggest that the foreground population is associated with Orion A, and prove that it is not a distinct large and old (4–5 Myr) cluster in front of Orion A.
References
- Alcalá et al. (2014) Alcalá, J. M., et al. 2014, A&A, 561, A2
- Allard et al. (2011) Allard, F., Homeier, D., & Freytag, B. 2011, in Astronomical Society of the Pacific Conference Series, Vol. 448, 16th Cambridge Workshop on Cool Stars, Stellar Systems, and the Sun, ed. C. Johns-Krull, M. K. Browning, & A. A. West, 91
- Allard et al. (2012) Allard, F., Homeier, D., & Freytag, B. 2012, Philosophical Transactions of the Royal Society of London Series A, 370, 2765
- Alves & Bouy (2012) Alves, J., & Bouy, H. 2012, A&A, 547, A97
- Apai et al. (2005) Apai, D., Pascucci, I., Bouwman, J., Natta, A., Henning, T., & Dullemond, C. P. 2005, Science, 310, 834
- Asplund et al. (2009) Asplund, M., Grevesse, N., Sauval, A. J., & Scott, P. 2009, ARA&A, 47, 481
- Bally et al. (1987) Bally, J., Stark, A. A., Wilson, R. W., & Langer, W. D. 1987, ApJ, 312, L45
- Baraffe et al. (2015) Baraffe, I., Homeier, D., Allard, F., & Chabrier, G. 2015, A&A, 577, A42
- Bouy et al. (2014) Bouy, H., Alves, J., Bertin, E., Sarro, L. M., & Barrado, D. 2014, A&A, 564, A29
- Briceño et al. (2005) Briceño, C., Calvet, N., Hernández, J., Vivas, A. K., Hartmann, L., Downes, J. J., & Berlind, P. 2005, AJ, 129, 907
- Briceño et al. (2007) Briceño, C., Hartmann, L., Hernández, J., Calvet, N., Vivas, A. K., Furesz, G., & Szentgyorgyi, A. 2007, ApJ, 661, 1119
- Caffau et al. (2011) Caffau, E., Ludwig, H.-G., Steffen, M., Freytag, B., & Bonifacio, P. 2011, Sol. Phys., 268, 255
- Cieza et al. (2007) Cieza, L., et al. 2007, ApJ, 667, 308
- Cieza et al. (2010) Cieza, L. A., et al. 2010, ApJ, 712, 925
- Cohen & Kuhi (1979) Cohen, M., & Kuhi, L. V. 1979, ApJS, 41, 743
- Comerón et al. (2003) Comerón, F., Fernández, M., Baraffe, I., Neuhäuser, R., & Kaas, A. A. 2003, A&A, 406, 1001
- Comerón et al. (2000) Comerón, F., Neuhäuser, R., & Kaas, A. A. 2000, A&A, 359, 269
- Comerón et al. (2009) Comerón, F., Spezzi, L., & López Martí, B. 2009, A&A, 500, 1045
- Covey et al. (2007) Covey, K. R., et al. 2007, AJ, 134, 2398
- Covino et al. (1997) Covino, E., Alcala, J. M., Allain, S., Bouvier, J., Terranegra, L., & Krautter, J. 1997, A&A, 328, 187
- Currie et al. (2009) Currie, T., Lada, C. J., Plavchan, P., Robitaille, T. P., Irwin, J., & Kenyon, S. J. 2009, ApJ, 698, 1
- Da Rio et al. (2010) Da Rio, N., Robberto, M., Soderblom, D. R., Panagia, N., Hillenbrand, L. A., Palla, F., & Stassun, K. G. 2010, ApJ, 722, 1092
- Da Rio et al. (2016) Da Rio, N., et al. 2016, ApJ, 818, 59
- Danks & Dennefeld (1994) Danks, A. C., & Dennefeld, M. 1994, PASP, 106, 382
- de la Reza et al. (1989) de la Reza, R., Torres, C. A. O., Quast, G., Castilho, B. V., & Vieira, G. L. 1989, ApJ, 343, L61
- Donati et al. (2011) Donati, J.-F., et al. 2011, MNRAS, 417, 1747
- Downes et al. (2014) Downes, J. J., et al. 2014, MNRAS, 444, 1793
- Downes et al. (2015) —. 2015, MNRAS, 450, 3490
- Dullemond (2012) Dullemond, C. P. 2012, RADMC-3D: A multi-purpose radiative transfer tool, Astrophysics Source Code Library
- Fang et al. (2013a) Fang, M., Kim, J. S., van Boekel, R., Sicilia-Aguilar, A., Henning, T., & Flaherty, K. 2013a, ApJS, 207, 5
- Fang et al. (2013b) Fang, M., van Boekel, R., Bouwman, J., Henning, T., Lawson, W. A., & Sicilia-Aguilar, A. 2013b, A&A, 549, A15
- Fang et al. (2009) Fang, M., van Boekel, R., Wang, W., Carmona, A., Sicilia-Aguilar, A., & Henning, T. 2009, A&A, 504, 461
- Fang et al. (2012) Fang, M., et al. 2012, A&A, 539, A119
- Feigelson et al. (2007) Feigelson, E., Townsley, L., Güdel, M., & Stassun, K. 2007, Protostars and Planets V, 313
- Feigelson & Montmerle (1999) Feigelson, E. D., & Montmerle, T. 1999, ARA&A, 37, 363
- Fernández et al. (2008) Fernández, D., Figueras, F., & Torra, J. 2008, A&A, 480, 735
- Flaherty et al. (2007) Flaherty, K. M., Pipher, J. L., Megeath, S. T., Winston, E. M., Gutermuth, R. A., Muzerolle, J., Allen, L. E., & Fazio, G. G. 2007, ApJ, 663, 1069
- Getman et al. (2005) Getman, K. V., et al. 2005, ApJS, 160, 319
- Gies & Bolton (1986) Gies, D. R., & Bolton, C. T. 1986, ApJS, 61, 419
- Güdel (2004) Güdel, M. 2004, A&A Rev., 12, 71
- Haisch et al. (2001) Haisch, Jr., K. E., Lada, E. A., & Lada, C. J. 2001, ApJ, 553, L153
- Henden et al. (2016) Henden, A. A., Templeton, M., Terrell, D., Smith, T. C., Levine, S., & Welch, D. 2016, VizieR Online Data Catalog, 2336
- Herbig & Bell (1988) Herbig, G. H., & Bell, K. R. 1988, Third Catalog of Emission-Line Stars of the Orion Population : 3 : 1988
- Herczeg & Hillenbrand (2008) Herczeg, G. J., & Hillenbrand, L. A. 2008, ApJ, 681, 594
- Herczeg & Hillenbrand (2014) —. 2014, ApJ, 786, 97
- Herczeg & Hillenbrand (2015) —. 2015, ApJ, 808, 23
- Hernández et al. (2004) Hernández, J., Calvet, N., Briceño, C., Hartmann, L., & Berlind, P. 2004, AJ, 127, 1682
- Hernández et al. (2010) Hernández, J., Morales-Calderon, M., Calvet, N., Hartmann, L., Muzerolle, J., Gutermuth, R., Luhman, K. L., & Stauffer, J. 2010, ApJ, 722, 1226
- Hernández et al. (2007a) Hernández, J., et al. 2007a, ApJ, 662, 1067
- Hernández et al. (2007b) —. 2007b, ApJ, 671, 1784
- Hernández et al. (2014) —. 2014, ApJ, 794, 36
- Hillenbrand (1997) Hillenbrand, L. A. 1997, AJ, 113, 1733
- Hillenbrand (2005) —. 2005, ArXiv Astrophysics e-prints
- Hillenbrand et al. (2013) Hillenbrand, L. A., Hoffer, A. S., & Herczeg, G. J. 2013, AJ, 146, 85
- Hoogerwerf et al. (2000) Hoogerwerf, R., de Bruijne, J. H. J., & de Zeeuw, P. T. 2000, ApJ, 544, L133
- Hsu et al. (2012) Hsu, W.-H., Hartmann, L., Allen, L., Hernández, J., Megeath, S. T., Mosby, G., Tobin, J. J., & Espaillat, C. 2012, ApJ, 752, 59
- Hsu et al. (2013) Hsu, W.-H., Hartmann, L., Allen, L., Hernández, J., Megeath, S. T., Tobin, J. J., & Ingleby, L. 2013, ApJ, 764, 114
- Hughes et al. (1994) Hughes, J., Hartigan, P., Krautter, J., & Kelemen, J. 1994, AJ, 108, 1071
- Ingleby et al. (2013) Ingleby, L., et al. 2013, ApJ, 767, 112
- Kim et al. (2013) Kim, K. H., et al. 2013, ApJ, 769, 149
- Krautter et al. (1997) Krautter, J., Wichmann, R., Schmitt, J. H. M. M., Alcala, J. M., Neuhauser, R., & Terranegra, L. 1997, A&AS, 123, 329
- Lawrence et al. (2007) Lawrence, A., et al. 2007, MNRAS, 379, 1599
- Lawson et al. (2009) Lawson, W. A., Lyo, A., & Bessell, M. S. 2009, MNRAS, 400, L29
- Lee & Chen (2009) Lee, H.-T., & Chen, W. P. 2009, ApJ, 694, 1423
- Looper et al. (2007) Looper, D. L., Burgasser, A. J., Kirkpatrick, J. D., & Swift, B. J. 2007, ApJ, 669, L97
- Looper et al. (2010) Looper, D. L., et al. 2010, ApJ, 714, 45
- Luhman (2004) Luhman, K. L. 2004, ApJ, 602, 816
- Luhman & Steeghs (2004) Luhman, K. L., & Steeghs, D. 2004, ApJ, 609, 917
- Luhman et al. (2008) Luhman, K. L., et al. 2008, ApJ, 675, 1375
- Lyo et al. (2004) Lyo, A.-R., Lawson, W. A., & Bessell, M. S. 2004, MNRAS, 355, 363
- Mamajek (2012) Mamajek, E. E. 2012, ApJ, 754, L20
- Mamajek et al. (1999) Mamajek, E. E., Lawson, W. A., & Feigelson, E. D. 1999, ApJ, 516, L77
- Manara et al. (2014) Manara, C. F., Testi, L., Natta, A., Rosotti, G., Benisty, M., Ercolano, B., & Ricci, L. 2014, ArXiv e-prints
- Manara et al. (2013) Manara, C. F., et al. 2013, A&A, 551, A107
- Megeath et al. (2012) Megeath, S. T., et al. 2012, AJ, 144, 192
- Menten et al. (2007) Menten, K. M., Reid, M. J., Forbrich, J., & Brunthaler, A. 2007, A&A, 474, 515
- Mohanty et al. (2005) Mohanty, S., Jayawardhana, R., & Basri, G. 2005, ApJ, 626, 498
- Muzerolle et al. (2005) Muzerolle, J., Luhman, K. L., Briceño, C., Hartmann, L., & Calvet, N. 2005, ApJ, 625, 906
- Nguyen et al. (2012) Nguyen, D. C., Brandeker, A., van Kerkwijk, M. H., & Jayawardhana, R. 2012, ApJ, 745, 119
- Oliveira et al. (2009) Oliveira, I., et al. 2009, ApJ, 691, 672
- Pascucci et al. (2009) Pascucci, I., Apai, D., Luhman, K., Henning, T., Bouwman, J., Meyer, M. R., Lahuis, F., & Natta, A. 2009, ApJ, 696, 143
- Pecaut & Mamajek (2013) Pecaut, M. J., & Mamajek, E. E. 2013, ApJS, 208, 9
- Rayner et al. (2009) Rayner, J. T., Cushing, M. C., & Vacca, W. D. 2009, ApJS, 185, 289
- Rebull (2001) Rebull, L. M. 2001, AJ, 121, 1676
- Rebull et al. (2000) Rebull, L. M., Hillenbrand, L. A., Strom, S. E., Duncan, D. K., Patten, B. M., Pavlovsky, C. M., Makidon, R., & Adams, M. T. 2000, AJ, 119, 3026
- Riaz et al. (2006) Riaz, B., Gizis, J. E., & Harvin, J. 2006, AJ, 132, 866
- Rieke & Lebofsky (1985) Rieke, G. H., & Lebofsky, M. J. 1985, ApJ, 288, 618
- Rigliaco et al. (2012) Rigliaco, E., Natta, A., Testi, L., Randich, S., Alcalà, J. M., Covino, E., & Stelzer, B. 2012, A&A, 548, A56
- Robin et al. (2003) Robin, A. C., Reylé, C., Derrière, S., & Picaud, S. 2003, A&A, 409, 523
- Romero et al. (2012) Romero, G. A., Schreiber, M. R., Cieza, L. A., Rebassa-Mansergas, A., Merín, B., Smith Castelli, A. V., Allen, L. E., & Morrell, N. 2012, ApJ, 749, 79
- Rosen et al. (2015) Rosen, S. R., et al. 2015, ArXiv e-prints
- Sacco et al. (2008) Sacco, G. G., Franciosini, E., Randich, S., & Pallavicini, R. 2008, A&A, 488, 167
- Schlafly & Finkbeiner (2011) Schlafly, E. F., & Finkbeiner, D. P. 2011, ApJ, 737, 103
- Sicilia-Aguilar et al. (2015a) Sicilia-Aguilar, A., Fang, M., Roccatagliata, V., Collier Cameron, A., Kóspál, Á., Henning, T., Ábrahám, P., & Sipos, N. 2015a, A&A, 580, A82
- Sicilia-Aguilar et al. (2011) Sicilia-Aguilar, A., Henning, T., Dullemond, C. P., Patel, N., Juhász, A., Bouwman, J., & Sturm, B. 2011, ApJ, 742, 39
- Sicilia-Aguilar et al. (2010) Sicilia-Aguilar, A., Henning, T., & Hartmann, L. W. 2010, ApJ, 710, 597
- Sicilia-Aguilar et al. (2013) Sicilia-Aguilar, A., Kim, J. S., Sobolev, A., Getman, K., Henning, T., & Fang, M. 2013, A&A, 559, A3
- Sicilia-Aguilar et al. (2006) Sicilia-Aguilar, A., et al. 2006, ApJ, 638, 897
- Sicilia-Aguilar et al. (2015b) —. 2015b, A&A, 573, A19
- Simon et al. (2016) Simon, M. N., Pascucci, I., Edwards, S., Feng, W., Gorti, U., Hollenbach, D., Rigliaco, E., & Keane, J. T. 2016, ApJ, 831, 169
- Skrutskie et al. (2006) Skrutskie, M. F., et al. 2006, AJ, 131, 1163
- Stelzer et al. (2013) Stelzer, B., et al. 2013, A&A, 558, A141
- Stutz et al. (2013) Stutz, A. M., et al. 2013, ApJ, 767, 36
- Teixeira et al. (2008) Teixeira, R., Ducourant, C., Chauvin, G., Krone-Martins, A., Song, I., & Zuckerman, B. 2008, A&A, 489, 825
- Tobin et al. (2009) Tobin, J. J., Hartmann, L., Furesz, G., Mateo, M., & Megeath, S. T. 2009, ApJ, 697, 1103
- Torres et al. (2006) Torres, C. A. O., Quast, G. R., da Silva, L., de La Reza, R., Melo, C. H. F., & Sterzik, M. 2006, A&A, 460, 695
- Torres et al. (2003) Torres, G., Guenther, E. W., Marschall, L. A., Neuhäuser, R., Latham, D. W., & Stefanik, R. P. 2003, AJ, 125, 825
- Vacca & Sandell (2011) Vacca, W. D., & Sandell, G. 2011, ApJ, 732, 8
- Wahhaj et al. (2010) Wahhaj, Z., et al. 2010, ApJ, 724, 835
- Webb et al. (1999) Webb, R. A., Zuckerman, B., Platais, I., Patience, J., White, R. J., Schwartz, M. J., & McCarthy, C. 1999, ApJ, 512, L63
- White et al. (2007) White, R. J., Gabor, J. M., & Hillenbrand, L. A. 2007, AJ, 133, 2524
- White & Ghez (2001) White, R. J., & Ghez, A. M. 2001, ApJ, 556, 265
- White & Hillenbrand (2004) White, R. J., & Hillenbrand, L. A. 2004, ApJ, 616, 998
- Wilking et al. (2005) Wilking, B. A., Meyer, M. R., Robinson, J. G., & Greene, T. P. 2005, AJ, 130, 1733
- Wright et al. (2010) Wright, E. L., et al. 2010, AJ, 140, 1868
- Yasui et al. (2010) Yasui, C., Kobayashi, N., Tokunaga, A. T., Saito, M., & Tokoku, C. 2010, ApJ, 723, L113
- York et al. (2000) York, D. G., et al. 2000, AJ, 120, 1579
Appendix A Spectral classification of young stars
In Table LABEL:Tab:source, we list the young stars with X-Shooter spectra. These sources are mainly from the Cha cluster, the TW Hydra Association, the Lupus star-forming region, the Ori cluster, and the Cha I star-forming region. We extract the spectra of these sources from the X-Shooter phase III data archive. In Fig 22, we show the example of spectra in our sample with spectral types from K2 to M9.5. In the figure, there is an obvious variation in the spectral type with the spectral type, which is mainly due to an change in the strength of molecular lines including the TiO, VO, and CaH bands. Thus these features can be used to do spectral classification.

We use the spectral features and define the indices of individual features in a similar way as do in the spectral classification code “SPTCLASS” (Hernández et al., 2004). The index of each spectral feature is calculated by defining the central wavelengths of the feature band (FB), blue continuum band (BCB), and red continuum band (RCB). The continuum flux () at the central wavelengths () of a FB is calculated as.
| (A1) |
Where and are the central wavelengths of BCB and RCB, respectively, and and are the flux of BCB and RCB, respectively. and are the average fluxes over the widths of BCB and RCB. The index of a FB is calculated as:
| (A2) |
Where is the width of the FB, is the average flux over the width of the FB. We calculated the indices for 22 FBs. In Table 4, we list these features including , , , , and the widths of the BCBs and RCBs. In Fig. 23 and 24, we show the relations between the indices of individual spectral features and the spectral types. We fit these relations using polynomial functions, , where is spectral-type number, and the numbers 0–19 are corresponding to K0 to M9. The results are listed in Table 4. To fully cover the range of spectral types, we have included some sources with low accretion rates. For these sources, their spectral features at wavelengths longer than 5500 Å are used for the fitting, to avoid the possible accretion-related veiling in the blue part of the optical spectra.
| RA | DEC | Adopted | EWHα | AV | ||||||||
|---|---|---|---|---|---|---|---|---|---|---|---|---|
| ID | Name | (J2000) | (J2000) | Spt | Ref | Spt | Ref | (Å) | Accreting | (mag) | Ref | |
| 1 | RECX 1 | 08 36 56.24 | 78 56 45.7 | K4, K5, K6, K7 | 1, 2, 3, 8 | K5 | 3 | 1.2 | N | 0 | ||
| 2 | RECX 5 | 08 42 27.088 | 78 57 47.93 | M3.8, M4 | 2, 3, 8 | M4 | 3 | 12.9 | N | 0 | ||
| 3 | RECX 6 | 08 42 38.770 | 78 54 42.75 | M2, M3 | 2, 3, 8, 9 | M3 | 3 | 4.8 | N | 0 | ||
| 4 | RECX 7 | 8 43 07.239 | 79 04 52.49 | K3, K4, K5, K6.9 | 2, 3, 8, 10 | K5 | 3 | 1.0 | N | 0 | ||
| 5 | RECX 9 | 08 44 16.41 | 78 59 08.04 | M4, M4.5 | 2, 3, 8 | M4.5 | 3 | 12.4 | N | 0 | ||
| 6 | RECX 10 | 08 44 31.90 | 78 46 31.2 | K7, K9, M0.3, M1 | 2, 3, 8, 9 | K9 | 3 | 1.7 | N | 0 | ||
| 7 | RECX 11 | 08 47 01.63 | 78 59 34.37 | K5, K5.5, K6.5 | 2, 3, 8 | K5 | 3 | 8.9 | 0.007 | Y | 0 | 28 |
| 8 | RECX 12 | 08 47 56.766 | 78 54 53.19 | M2, M3.2, M3.25 | 2, 3, 8, 9 | M3.25 | 3 | 8.1 | N | 0 | ||
| 9 | RECX 17 | 08 38 51.50 | 79 16 13.7 | M5, M5.25, M5.75 | 2, 3, 8 | M5.25 | 3 | 12.1 | N | 0 | ||
| 10 | RECX 18 | 08 36 10.73 | 79 08 18.4 | M5.5 | 2, 3, 8 | M5.5 | 3 | 12.5 | N | 0 | ||
| 11 | TWA 2A | 11 09 13.80 | 30 01 39.9 | M1.5, M2 | 3, 4, 5 | M2 | 3 | 2.5 | N | 0 | ||
| 12 | TWA 7 | 10 42 30.064 | 33 40 16.62 | M2, M3 | 3, 6 | M3 | 3 | 5.2 | N | 0 | ||
| 13 | TWA 8A | 11 32 41.25 | 26 51 55.9 | M2, M3 | 3, 6, 7 | M3 | 3 | 8.8 | N | 0 | ||
| 14 | TWA 8B | 11 32 41.16 | 26 52 09.0 | M5, M5.5 | 3, 7 | M5.5 | 3 | 17.2 | N | 0 | ||
| 15 | TWA 9A | 11 48 24.223 | 37 28 49.15 | K5, K7 | 3, 7 | K7 | 3 | 1.7 | N | 0 | ||
| 16 | TWA 9B | 11 48 23.73 | 37 28 48.5 | M1, M3.5 | 3, 4 | M3.5 | 3 | 5.4 | N | 0 | ||
| 17 | TWA 13A | 11 21 17.24 | 34 46 45.5 | M1 | 3, 6 | M1 | 3 | 8.4 | N | 0 | ||
| 18 | TWA 13B | 11 21 17.24 | 34 46 45.5 | M1 | 3, 6 | M1 | 3 | 2.0 | N | 0 | ||
| 19 | TWA 22 | 10 17 26.89 | 53 54 26.5 | M5 | 3 | M5 | 3 | 13.0 | N | 0 | ||
| 20 | TWA 25 | 12 15 30.72 | 39 48 42.6 | K9, M0 | 3, 4 | K9 | 3 | 3.0 | N | 0.4 | ||
| 21 | TWA 26 | 11 39 51.140 | 31 59 21.50 | M8 | 3, 6 | M8 | 3 | 12.3 | N | 0 | ||
| 22 | TWA 27 | 12 07 33.467 | 39 32 54.00 | M8 | 3, 6 | M8 | 3 | 194.4 | 0.003 | Y | 0 | 43 |
| 23 | TWA 28 | 11 02 09.833 | 34 30 35.53 | M8.5 | 3, 13 | M8.5 | 3 | 101.4 | 0.0093 | Y | 0 | 43 |
| 24 | TWA 29 | 12 45 14.16 | 44 29 07.7 | M9.5 | 3, 4, 12 | M9.5 | 3 | 10.6 | N | 0 | ||
| 25 | TWA 30A | 11 32 18.314 | 30 19 51.85 | M5 | 3, 18 | M5 | 3 | 6.6 | N | 0 | ||
| 26 | V4046 sgr | 18 14 10.466 | 32 47 34.50 | K4, K5 | 3, 17 | K4 | 3 | 44.0 | 0.096 | Y | 0 | 42 |
| 27 | RECX 4 | 08 42 23.77 | 79 04 03.0 | M0, M1.3, M1.75 | 2, 3, 8 | M1.3 | 2 | 4.2 | N | 0 | ||
| 28 | TWA 3A | 11 10 27.81 | 37 31 53.2 | M3, M4 | 5, 6 | M4 | 5 | 9.8 | N | 0 | ||
| 29 | TWA 3B | 11 10 27.88 | 37 31 52.0 | M3.5, M4 | 5, 6 | M4 | 5 | 6.2 | N | 0 | ||
| 30 | TWA 6 | 10 18 28.700 | 31 50 02.85 | K7, M0 | 4, 11 | K7 | 11 | 4.5 | N | 0 | ||
| 31 | TWA 14 | 11 13 26.221 | 45 23 42.74 | M0, M0.5 | 4, 11 | M0 | 11 | 6.1 | N | 0 | ||
| 32 | TWA 15A | 12 34 20.65 | 48 15 13.50 | M2 | 6 | M3 | this work | 12.8 | N | 0 | ||
| 33 | TWA 15B | 12 34 20.47 | 48 15 19.50 | M2 | 6 | M3 | this work | 9.5 | N | 0 | ||
| 34 | Sz 74 | 15 48 05.228 | 35 15 52.83 | M1.5, M3.5 | 14, 15 | M3.5 | 14 | 22.8 | 0.030 | Y | 1.5 | 14 |
| 35 | Sz 84 | 15 58 02.53 | 37 36 02.7 | M5, M5.5 | 14, 15 | M4.5 | this work | 113.2 | 0.021 | Y | 0.8 | 25 |
| 36 | Sz 91 | 16 07 11.592 | 39 03 47.54 | M0.5, M1, M1.5 | 14, 15, 16 | M1 | 14 | 139.6 | 0.051 | Y | 1.2 | 14 |
| 37 | Sz 94 | 16 07 49.596 | 39 04 28.79 | M4 | 4, 15 | M3.5 | this work | 6.4 | N | 0.0 | ||
| 38 | Sz 97 | 16 08 21.803 | 39 04 21.48 | M3, M4 | 14, 15 | M4 | 14 | 38.6 | 0.007 | Y | 0 | 14 |
| 39 | Sz 100 | 16 08 25.764 | 39 06 01.19 | M5, M5.5 | 14, 15 | M5.5 | 14 | 45.1 | 0.006 | Y | 0 | 14 |
| 40 | Sz 104 | 16 08 30.815 | 39 05 48.87 | M5, | 14, 15 | M5 | 14 | 34.1 | 0.006 | Y | 0 | 14 |
| 41 | Sz 107 | 16 08 41.799 | 39 01 37.02 | M5.5, M5.75 | 4, 19 | M5.5 | 4 | 12.8 | N | 0 | ||
| 42 | Sz 111 | 16 08 54.687 | 39 37 43.11 | M1, M1.5 | 14, 15 | M0 | this work | 79.7 | 0.019 | Y | 0.7 | 14 |
| 43 | Sz 112 | 16 08 55.530 | 39 02 33.95 | M4, M5, M6 | 14, 15, 19 | M5 | 14 | 17.4 | N | 0 | ||
| 44 | Sz 114 | 16 09 01.850 | 39 05 12.42 | M4, M4.8, M5.5 | 14, 15, 20 | M4.8 | 14 | 94.4 | 0.010 | Y | 0 | 14 |
| 45 | Sz 115 | 16 09 06.214 | 39 08 51.86 | M4, M4.5 | 14, 15 | M4.5 | 14 | 10.9 | N | 0 | ||
| 46 | Sz 121 | 16 10 12.199 | 39 21 18.11 | M3, M4 | 4, 15, 24 | M4 | 24 | 7.8 | N | 0 | ||
| 47 | Sz 122 | 16 10 16.424 | 39 08 05.07 | M2 | 4, 15, 24 | M2 | 4 | 6.9 | N | 0 | ||
| 48 | SO 587 | 05 38 34.04 | 02 36 37.3 | M3.5, M4.5 | 21, 22 | M4.5 | 22 | 16.3 | N | 0 | ||
| 49 | SO 641 | 05 38 38.57 | 02 41 55.8 | M5 | 4, 22 | M5 | 22 | 8.7 | N | 0 | ||
| 50 | SO 797 | 05 38 54.91 | 02 28 58.19 | M4, M4.5 | 4, 22 | M4.5 | 22 | 7.7 | N | 0 | ||
| 51 | SO 879 | 05 39 05.42 | 02 32 30.34 | K5, K7 | 4, 21, 24 | K7 | 24 | 2.2 | N | 0 | ||
| 52 | SO 925 | 05 39 11.41 | 02 33 32.8 | M5.5 | 4, 22 | M5.5 | 22 | 9.6 | N | 0 | ||
| 53 | SO 999 | 05 39 20.25 | 02:38 25.8 | M5.5 | 4, 22 | M5.5 | 22 | 11.0 | N | 0 | ||
| 54 | Par-Lup3-1 | 16 08 16.03 | 39 03 04.29 | M6.5, M7.5 | 23, 24 | M6.5 | 24 | 17.6 | N | 0 | ||
| 55 | Par-Lup3-2 | 16 08 35.78 | 39 03 47.91 | M5, M6 | 23, 24 | M5 | 24 | 5.5 | N | 0 | ||
| 56 | Par-Lup3-3 | 16 08 49.40 | 39 05 39.2 | M4, M4.5 | 14, 23 | M3.5 | this work | 28.2 | N | 3.5 | ||
| 57 | SST-Lup3-1 | 16 11 59.798 | 38 23 38.34 | M5 | 14 | M5 | 14 | 44.4 | 0.004 | Y | 0 | 14 |
| 58 | Lup706 | 16 08 37.30 | 39 23 10.8 | M7.75 | 14 | M7.75 | 14 | 222.5 | 0.005 | Y | 0 | 14 |
| 59 | Lup604s | 16 08 00.20 | 39 02 59.7 | M5.25 | 14 | M5.25 | 14 | 16.7 | N | 0 | ||
| 60 | Lup818s | 16 09 56.29 | 38 59 51.7 | M6 | 14 | M6 | 14 | 52.3 | 0.003 | Y | 0 | 14 |
| 61 | CrA75 | 19 02 22.1 | 36 55 40.9 | K2 | 25 | K2 | 25 | 1.3 | N | 0.3 | ||
| 62 | ISO-217 | 11 09 52.15 | 76 39 12.8 | M6.25 | 26 | M6.25 | 26 | 125.2 | 0.007 | Y | 2.6 | 41 |
| 63 | AKC2006-19 | 15 44 57.90 | 34 23 39.5 | M5 | 14 | M5 | 14 | 29.8 | 0.005 | Y | 0 | 14 |
| 64 | 2MASSJ16085953-3856275 | 16 08 59.53 | 38 56 27.6 | M8.5 | 14 | M8.5 | 14 | 111.5 | 0.003 | Y | 0 | 14 |
| 65 | SSTc2d160901.4-392512 | 16 09 01.40 | 39 25 11.9 | M4 | 14, 19 | M3 | this work | 42.7 | 0.007 | Y | 0.8 | 14 |
| 66 | Cha H 1 | 11 07 16.68 | 77 35 53.2 | M7.5, M7.75 | 26, 27 | M7.75 | 26 | 125.9 | N | 0 | 40 | |
| 67 | Ass-Cha-T-2-51 | 11 12 24.415 | 76 37 06.41 | K3.5, K4 | 10, 26 | K3.5 | 26 | 2.9 | N | 0 | ||
| 68 | LkCa 15 | 04 39 17.796 | +22 21 03.48 | K2, K5 | 25, 29, 30 | K5 | 29 | 28.3 | 0.066 | Y | 0.6 | 25 |
| 69 | CS Cha | 11 02 24.912 | 77 33 35.72 | K2, K4, K5, K6 | 6, 25, 26, 31 | K5 | 31 | 29.5 | 0.069 | Y | 0.3 | 25 |
| 70 | CHXR 22E | 11 07 13.300 | 77 43 49.88 | M3.5, M4 | 25, 26 | M4 | 25 | 6.4 | N | 3.4 | ||
| 71 | Sz 18 | 11 07 19.154 | 76 03 04.85 | M2, M2.5 | 25, 26 | M2 | 25 | 25.0 | 0.048 | Y | 0.6 | 25 |
| 72 | Sz 27 | 11 08 39.051 | 77 16 04.24 | K7, K8 | 25, 26, 29 | K7 | 25 | 58.7 | 0.076 | Y | 2.8 | 25 |
| 73 | RX J16153255 | 16 15 20.231 | 32 55 05.10 | K5, K7 | 25, 32, 33 | K5 | 32 | 35.6 | 0.056 | Y | 0 | 25 |
| 74 | Oph 22 | 16 22 45.40 | 24 31 23 | M3 | 25, 34 | M3 | 25 | 5.0 | N | 1.4 | ||
| 75 | Oph 24 | 16 25 06.91 | 23 50 50.3 | M0, M3 | 25, 34 | M2 | this work | 5.1 | N | 0 | ||
| 76 | ISO-Oph196 | 16 28 16.51 | 24 36 57.9 | M4.5, M5.5 | 25, 35 | M5 | this work | 106.8 | 0.062 | Y | 2.0 | 25 |
| 77 | Ser 29 | 18 29 11.50 | 00 20 38.6 | M0, M2 | 25, 36 | M2 | 25 | 13.9 | 0.004 | Y | 2.9 | 25 |
| 78 | Ser 34 | 18 29 44.11 | 00 33 56.0 | M0, M1 | 25, 36 | M1.5 | this work | 13.6 | 0.008 | Y | 2.3 | 25 |
| 79 | RX J1842.93532 | 18 42 57.95 | 35 32 42.7 | K2 | 25, 37 | K2 | 37 | 32.9 | 0.056 | Y | 1.7 | 25 |
| 80 | RX J1852.33700 | 18 52 17.29 | 37 00 11.9 | K2, K3 | 25, 37 | K3 | 37 | 44.8 | 0.051 | Y | 1.6 | 25 |
| 81 | LkH 330 | 03 45 48. | 29 32 24 11.9 | G3, G4 | 25, 38 | G4 | 25 | 15.8 | 0.024 | Y | 2.9 | 25 |
| 82 | SR 21 | 16 27 10.28 | 24 19 12.7 | G4 | 25 | G4 | 25 | 1.3 | 0.017 | Y | 5.2 | 25 |
| 83 | T21 | 11 06 15.4 | 77 21 56.9 | G5 | 25, 26, 29 | G5 | 25 | 0.5 | N | 3.9 | ||
| 84 | IC348-127 | 03 45 07.9 | 32 04 01.8 | G4 | 25, 39 | G4 | 25 | 2.8 | N | 6.2 | ||
| 85 | Cha H 9 | 11 07 18.608 | 77 32 51.66 | M5.5 | 30 | M5.5 | 30 | 20.1 | N | 5.0 | 40 |
a The reference for the available spectral types of individual sources, b The reference for the adopted spectral type, c The reference for the accretion luminosity.
References: 1. Covino et al. (1997), 2. Lyo et al. (2004), 3. Pecaut & Mamajek (2013), 4. Manara et al. (2013), 5. Riaz et al. (2006), 6. Torres et al. (2006), 7. Webb et al. (1999), 8. Luhman & Steeghs (2004), 9. Mamajek et al. (1999), 10. Covino et al. (1997), 11. Torres et al. (2003), 12. Looper et al. (2007), 13. Teixeira et al. (2008), 14. Alcalá et al. (2014), 15. Hughes et al. (1994), 16. Romero et al. (2012), 17. Fernández et al. (2008), 18. Looper et al. (2010), 19. Romero et al. (2012), 20. Comerón et al. (2009), 21. Sacco et al. (2008), 22. Rigliaco et al. (2012), 23. Comerón et al. (2003), 24. Stelzer et al. (2013), 25. Manara et al. (2014), 26.Luhman (2004), 27. Comerón et al. (2000), 28. Ingleby et al. (2013), 29. Nguyen et al. (2012), 30. White & Ghez (2001), 31. Herbig & Bell (1988), 32. Wahhaj et al. (2010), 33. Krautter et al. (1997), 34. Cieza et al. (2010), 35. Wilking et al. (2005), 36. Oliveira et al. (2009), 37. White et al. (2007), 38. Cohen & Kuhi (1979), 39. Cieza et al. (2007), 40. Mohanty et al. (2005), 41. Muzerolle et al. (2005), 42. Donati et al. (2011), 43. Herczeg & Hillenbrand (2008)
| Center | Width | Width | Width | Spt | Index | ||||||||||
|---|---|---|---|---|---|---|---|---|---|---|---|---|---|---|---|
| Index | Feature | (Å) | (Å) | (Å) | (Å) | (Å) | (Å) | Range | Range | ||||||
| 1 | VO | 7810 | 110 | 7570 | 25 | 8140 | 20 | M0–M8 | 11.51 to 66.23 | 5.44607 | 0.507010 | 1.06971 | 8.91401 | 0 | 0 |
| 2 | VO | 7450 | 40 | 7540 | 20 | 7540 | 20 | M3–M9.5 | 2.97 to 13.62 | 7.40348 | 2.63063 | 0.284250 | 1.12802 | 0 | 0 |
| 3 | VO | 7920 | 110 | 7562 | 20 | 8130 | 20 | M2–M9.5 | 13.31 to 71.70 | 8.56015 | 0.310141 | 3.77074 | 1.51972 | 4.95808 | 0 |
| 4 | VO | 8500 | 110 | 8408 | 10 | 8840 | 10 | M3–M9 | 12.60 to 61.72 | 9.46791 | 0.377978 | 8.78991 | 8.24764 | 0 | 0 |
| 5 | VO | 8675 | 150 | 8408 | 12 | 8840 | 10 | M4–M9.5 | 13.54 to 58.77 | 10.0762 | 0.410874 | 1.03032 | 1.00317 | 0 | 0 |
| 6 | VO | 8880 | 35 | 8850 | 10 | 9045 | 10 | M3–M9 | 2.87 to 11.90 | 8.62001 | 2.16112 | 0.256581 | 1.24604 | 0 | 0 |
| 7 | TiO | 7108 | 30 | 7040 | 15 | 7326 | 15 | K7–M6 | 2.37 to 18.62 | 3.61125 | 1.62902 | 8.76069 | 1.92530 | 0 | 0 |
| 8 | TiO | 6255 | 45 | 6112 | 15 | 6525 | 15 | K4–M5 | 4.52 to 25.74 | 9.61363 | 4.82202 | 0.522211 | 3.05772 | 8.68462 | 9.40336 |
| 9 | TiO | 4812 | 18 | 4742 | 10 | 4938 | 15 | K7–M6 | 0.01 to 10.68 | 6.98046 | 2.31755 | 0.250489 | 1.05380 | 0 | 0 |
| 10 | TiO | 5225 | 75 | 4940 | 15 | 5415 | 15 | K4–M5 | 8.65 to 20.53 | 5.56706 | 0.852030 | 4.54304 | 1.85754 | 0 | 0 |
| 11 | CaH | 6964 | 22 | 6533 | 10 | 7032 | 10 | K6–M4 | 0.78 to 4.76 | 3.19107 | 3.86115 | 0.334198 | 0 | 0 | 0 |
| 12 | CaH | 6840 | 30 | 6533 | 10 | 7032 | 10 | K6–M5 | 3.04 to 15.68 | 1.23510 | 1.83375 | 9.31380 | 2.05201 | 0 | 0 |
| 13 | TiO | 4975 | 40 | 4940 | 15 | 5385 | 15 | K5–M6 | 2.53 to 20.70 | 5.00123 | 5.58890 | 0.783747 | 5.93566 | 2.27083 | 3.46253 |
| 14 | TiO | 7070 | 30 | 7045 | 10 | 7385 | 15 | K4–M5 | 1.90 to 13.59 | 8.50191 | 9.52190 | 1.87384 | 0.188538 | 9.13227 | 1.69261 |
| 15 | TiO | 5950 | 60 | 5810 | 20 | 6080 | 30 | K6–M8.5 | 1.88 to 29.18 | 3.54680 | 1.43835 | 7.45602 | 1.44120 | 0 | 0 |
| 16 | TiO | 6800 | 50 | 6530 | 15 | 7020 | 30 | K4–M5 | 2.80 to 26.72 | 2.75493 | 3.21562 | 0.336413 | 1.91640 | 5.29676 | 5.61103 |
| 17 | TiO | 7150 | 50 | 7045 | 15 | 7400 | 20 | K7–M5 | 7.14 to 33.44 | 2.22419 | 0.788315 | 1.79554 | 1.73645 | 0 | 0 |
| 18 | TiO | 7220 | 50 | 7045 | 15 | 7315 | 15 | K4–M5 | 3.53 to 23.97 | 5.94651 | 3.86310 | 0.351318 | 1.70392 | 4.04817 | 3.68664 |
| 19 | TiO | 6330 | 100 | 6080 | 15 | 6458 | 30 | K4–M2 | 3.02 to 14.76 | 6.93018 | 5.45853 | 0.741166 | 4.67135 | 1.06148 | 0 |
| 20 | TiO | 7250 | 150 | 7045 | 15 | 7531 | 50 | K6–M5 | 16.44 to 72.03 | 3.22166 | 0.716094 | 1.03322 | 5.41808 | 0 | 0 |
| 21 | TiO | 6713 | 100 | 6530 | 20 | 6940 | 30 | K8–M6 | 7.82 to 55.73 | 4.18776 | 0.573689 | 1.17938 | 9.51566 | 0 | 0 |
| 22 | TiO | 5487 | 76 | 5385 | 10 | 5385 | 10 | K4–M5 | 1.90 to 24.91 | 6.28645 | 1.09733 | 5.51680 | 7.34970 | 2.72954 | 6.52506 |
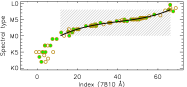
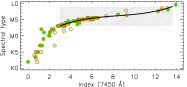
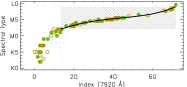
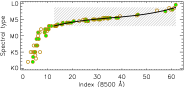
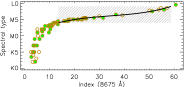
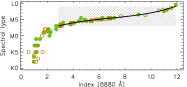
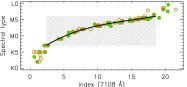
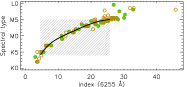
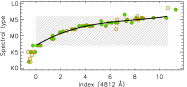
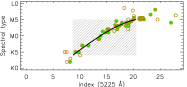
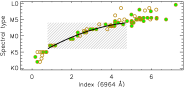
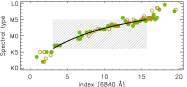
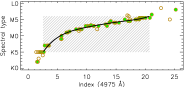
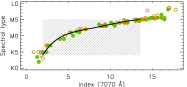
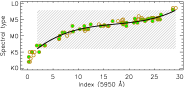
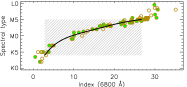
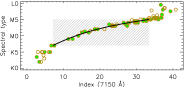
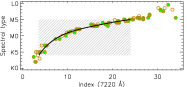
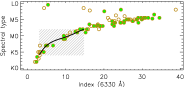
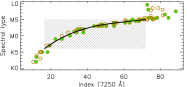
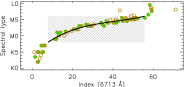
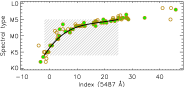
| RA | DEC | Lum | Av | Mass | Age | |||||||||
|---|---|---|---|---|---|---|---|---|---|---|---|---|---|---|
| (J2000) | (J2000) | Spt | () | (mag) | () | Myr | (Å) | (Å) | TTSaafootnotemark: | Diskbbfootnotemark: | Criteriaccfootnotemark: | |||
| 1 | 05 31 50.98 | 07 00 05.7 | K8.7 | 0.610 | 0.2 | 0.58 | 1.5 | 0.71 | W | N | Li | |||
| 2 | 05 32 11.59 | 06 05 22.2 | M4.8 | 0.076 | 0.0 | 0.12 | 1.4 | … | W | N | Na | |||
| 3 | 05 32 12.63 | 06 12 34.6 | M5.3 | 0.059 | 0.0 | 0.096 | 1.5 | … | W | N | Na | |||
| 4 | 05 32 14.78 | 06 04 11.2 | M4.0 | 0.096 | 0.0 | 0.18 | 2.0 | … | W | N | Na | |||
| 5 | 05 32 19.82 | 05 48 27.0 | M4.1 | 0.320 | 0.0 | 0.18 | 0.33 | W | N | Li, Na | ||||
| 6 | 05 32 29.64 | 06 18 34.8 | M6.4 | 0.053 | 0.0 | 0.065 | … | C | ? | Na | ||||
| 7 | 05 32 31.67 | 06 15 18.5 | M4.7 | 0.063 | 0.0 | 0.13 | 2.1 | 0.32 | W | N | Li, Na | |||
| 8 | 05 32 35.04 | 06 05 37.3 | M3.6 | 0.696 | 0.0 | 0.21 | … | W | N | Na | ||||
| 9 | 05 32 37.49 | 05 12 41.3 | K8.2 | 0.327 | 0.1 | 0.67 | 4.8 | 0.84 | W | Y | Li, IRE | |||
| 10 | 05 32 38.05 | 05 51 48.4 | M3.0 | 0.562 | 0.0 | 0.26 | 0.54 | W | N | Li, Na | ||||
| 11 | 05 32 42.38 | 05 44 09.8 | M5.0 | 0.119 | 0.0 | 0.12 | 0.59 | -2.71 | W | N | Li, Na | |||
| 12 | 05 32 42.55 | 06 01 25.8 | M3.8 | 0.107 | 0.0 | 0.20 | 2.0 | 0.22 | W | N | Li, Na | |||
| 13 | 05 32 44.54 | 05 24 15.2 | M5.0 | 0.045 | 0.2 | 0.099 | 2.5 | … | -1.55 | … | Y | IRE | ||
| 14 | 05 32 46.74 | 05 58 02.0 | M1.4 | 0.381 | 0.3 | 0.37 | 1.2 | … | -1.65 | C | Y | IRE | ||
| 15 | 05 32 47.31 | 05 39 42.7 | M1.3 | 0.328 | 0.2 | 0.39 | 1.5 | 0.62 | -1.09 | C | Y | Li, X, IRE | ||
| 16 | 05 32 49.93 | 06 10 45.6 | M0.8 | 0.082 | 0.9 | 0.55 | 22.9? | 0.55 | -1.50 | C | Y | Li, IRE | ||
| 17 | 05 32 50.69 | 06 11 09.3 | M3.0 | 0.109 | 0.1 | 0.28 | 3.6 | 0.40 | -2.88 | W | N | Li | ||
| 18 | 05 32 53.52 | 06 06 01.1 | M3.6 | 0.144 | 0.2 | 0.21 | 1.6 | 0.40 | -2.73 | W | N | Li | ||
| 19 | 05 32 56.30 | 06 03 18.9 | M1.5 | 0.166 | 0.0 | 0.40 | 4.0 | 0.50 | -2.75 | W | N | Li | ||
| 20 | 05 32 57.01 | 05 48 56.1 | M5.4 | 0.087 | 0.1 | 0.10 | 0.43 | -2.89 | W | N | Li, Na, X | |||
| 21 | 05 32 57.92 | 06 02 43.0 | M2.6 | 0.167 | 0.0 | 0.30 | 2.3 | 0.30 | -2.68 | W | N | Li | ||
| 22 | 05 32 59.25 | 05 24 26.1 | M2.5 | 0.375 | 0.3 | 0.30 | 0.9 | … | -1.98 | -0.85 | … | TD | IRE | |
| 23 | 05 33 01.36 | 03 58 28.4 | K9.4 | 0.658 | 0.0 | 0.53 | 1.1 | 0.57 | W | N | Li | |||
| 24 | 05 33 02.38 | 05 45 06.2 | M4.0 | 0.167 | 0.0 | 0.18 | 1.0 | … | -2.72 | W | N | Na, X | ||
| 25 | 05 33 03.31 | 06 19 15.1 | M4.7 | 0.059 | 0.0 | 0.13 | 2.3 | … | W | N | Na | |||
| 26 | 05 33 03.59 | 04 58 55.9 | M5.0 | 0.047 | 0.2 | 0.098 | 2.3 | 0.54 | -1.54 | -0.86 | C | Y | Li, Na, IRE | |
| 27 | 05 33 06.23 | 04 58 35.9 | M4.4 | 0.054 | 0.1 | 0.15 | 3.0 | … | -1.42 | -0.85 | W | TD | Na, IRE | |
| 28 | 05 33 10.52 | 05 42 24.5 | M2.8 | 0.485 | 0.0 | 0.27 | 0.5 | 0.40 | -1.38 | -1.06 | C | Y | Li, Na, X, IRE | |
| 29 | 05 33 10.73 | 06 21 48.3 | M4.9 | 0.056 | 0.0 | 0.11 | 2.2 | … | W | N | Na | |||
| 30 | 05 33 11.59 | 04 59 32.7 | M0.5 | 0.294 | 0.0 | 0.47 | 2.6 | 0.35 | -2.74 | W | N | Li | ||
| 31 | 05 33 11.70 | 05 54 57.0 | M4.6 | 0.064 | 0.0 | 0.14 | 2.2 | 0.55 | W | N | Li, Na, X | |||
| 32 | 05 33 14.16 | 06 11 48.9 | M2.6 | 0.163 | 0.0 | 0.30 | 2.4 | 0.30 | -2.66 | W | N | Li | ||
| 33 | 05 33 14.83 | 06 06 35.8 | M5.3 | 0.105 | 0.0 | 0.11 | 0.48 | -2.73 | W | N | Li, Na | |||
| 34 | 05 33 16.95 | 05 43 33.1 | M5.4 | 0.060 | 0.0 | 0.095 | 1.3 | 0.24 | W | N | Li, Na, X | |||
| 35 | 05 33 17.28 | 04 55 41.8 | M5.2 | 0.036 | 0.1 | 0.087 | 3.4 | … | -1.99 | -0.84 | W | TD | Na, IRE | |
| 36 | 05 33 18.14 | 04 22 43.3 | K9.6 | 0.238 | 0.7 | 0.60 | 5.8 | … | -1.34 | -0.95 | C | TD | IRE | |
| 37 | 05 33 18.92 | 05 57 50.7 | M4.7 | 0.039 | 0.0 | 0.12 | 3.4 | 0.65 | -2.58 | W | N | Li, Na | ||
| 38 | 05 33 19.34 | 06 14 25.6 | M4.6 | 0.127 | 0.0 | 0.14 | 0.6 | 0.30 | -2.63 | W | N | Li | ||
| 39 | 05 33 20.04 | 05 43 30.7 | M4.4 | 0.087 | 0.0 | 0.15 | 1.7 | … | W | N | Na, X | |||
| 40 | 05 33 22.58 | 05 32 40.1 | M4.0 | 0.149 | 0.0 | 0.18 | 1.1 | 0.35 | W | N | Li, Na | |||
| 41 | 05 33 22.64 | 06 07 09.8 | M1.8 | 0.225 | 0.1 | 0.35 | 2.1 | 0.40 | -2.60 | W | N | Li | ||
| 42 | 05 33 23.30 | 05 54 28.2 | M4.0 | 0.123 | 0.0 | 0.18 | 1.5 | … | -2.57 | W | N | Na, X | ||
| 43 | 05 33 23.71 | 06 09 33.6 | K9.0 | 0.488 | 0.0 | 0.58 | 2.0 | 0.50 | -2.67 | W | N | Li | ||
| 44 | 05 33 24.42 | 06 27 35.3 | M3.2 | 0.686 | 0.0 | 0.24 | 0.40 | W | N | Li, Na | ||||
| 45 | 05 33 25.65 | 05 58 47.5 | M4.6 | 0.047 | 0.1 | 0.13 | 2.9 | … | W | N | Na | |||
| 46 | 05 33 30.21 | 06 04 09.6 | M0 | 0.397 | 0.4 | 0.51 | 2.0 | 0.47 | -2.74 | W | N | Li | ||
| 47 | 05 33 31.00 | 06 06 05.6 | M3.4 | 0.151 | 0.1 | 0.23 | 1.7 | 0.50 | -2.66 | W | N | Li | ||
| 48 | 05 33 31.20 | 05 29 57.7 | M3.7 | 0.109 | 0.3 | 0.21 | 2.1 | 0.46 | -1.19 | -0.49 | C | TD | Li, Na, IRE | |
| 49 | 05 33 31.25 | 06 18 29.6 | M4.7 | 0.066 | 0.0 | 0.12 | 2.0 | … | -2.89 | W | N | Na | ||
| 50 | 05 33 33.78 | 06 26 22.1 | M4.2 | 0.239 | 0.0 | 0.17 | 0.30 | -2.64 | W | N | Li | |||
| 51 | 05 33 33.90 | 05 33 26.4 | M3.2 | 0.334 | 0.0 | 0.25 | 0.7 | 0.41 | -1.50 | -0.95 | W | Y | Li, Na, X, IRE | |
| 52 | 05 33 34.37 | 06 04 20.0 | M5.9 | 0.022 | 0.0 | 0.060 | 3.6 | … | -1.47 | C | Y | IRE | ||
| 53 | 05 33 34.40 | 06 13 52.7 | M2.1 | 0.223 | 0.1 | 0.33 | 1.9 | 0.50 | -1.94 | -0.87 | C | TD | Li, IRE | |
| 54 | 05 33 35.81 | 06 06 25.8 | M3.9 | 0.151 | 0.1 | 0.19 | 1.3 | 0.50 | -2.54 | W | N | Li | ||
| 55 | 05 33 36.10 | 06 10 52.4 | M5.6 | 0.050 | 0.1 | 0.084 | 1.4 | … | -2.63 | W | N | Na | ||
| 56 | 05 33 36.52 | 06 26 42.4 | M3.1 | 0.123 | 0.0 | 0.27 | 2.8 | 0.30 | -2.73 | W | N | Li | ||
| 57 | 05 33 37.02 | 04 33 38.3 | M3.8 | 0.338 | 0.0 | 0.19 | 0.45 | -2.71 | W | N | Li, Na | |||
| 58 | 05 33 38.56 | 05 13 12.5 | M3.5 | 0.200 | 0.0 | 0.22 | 1.2 | … | -1.14 | -0.74 | … | Y | IRE | |
| 59 | 05 33 38.81 | 04 42 16.8 | M5.4 | 0.060 | 0.1 | 0.096 | 1.3 | … | -2.74 | W | N | Na | ||
| 60 | 05 33 39.17 | 04 38 07.3 | M5.0 | 0.100 | 0.0 | 0.12 | 0.66 | -2.79 | W | N | Li, Na | |||
| 61 | 05 33 39.81 | 05 21 20.7 | M5.4 | 0.070 | 0.0 | 0.10 | 0.6 | … | … | N | Na | |||
| 62 | 05 33 40.21 | 05 37 43.4 | M4.7 | 0.075 | 0.0 | 0.13 | 1.6 | … | W | N | Na, X | |||
| 63 | 05 33 41.28 | 04 49 25.8 | M3.5 | 0.313 | 0.0 | 0.21 | 0.5 | 0.39 | -2.66 | W | N | Li, Na | ||
| 64 | 05 33 43.19 | 04 47 14.3 | M4.2 | 0.113 | 0.0 | 0.16 | 1.4 | 0.25 | -1.55 | -1.44 | C | Y | Li, Na, IRE | |
| 65 | 05 33 43.19 | 04 40 24.6 | M4.3 | 0.122 | 0.0 | 0.16 | 1.1 | 0.60 | -2.65 | W | N | Li, Na | ||
| 66 | 05 33 43.25 | 06 05 23.5 | M3.4 | 0.130 | 0.0 | 0.24 | 2.1 | 0.60 | -2.70 | W | N | Li | ||
| 67 | 05 33 43.35 | 04 47 09.2 | M4.5 | 0.262 | 0.0 | 0.15 | 0.43 | -2.62 | W | N | Li, Na | |||
| 68 | 05 33 45.18 | 06 24 41.2 | M4.6 | 0.040 | 0.3 | 0.13 | 3.3 | 0.30 | -2.49 | W | N | Li | ||
| 69 | 05 33 45.58 | 05 00 46.1 | M5.4 | 0.064 | 0.0 | 0.097 | 1.1 | … | -1.59 | -1.00 | … | TD | Na, IRE | |
| 70 | 05 33 46.25 | 06 13 04.8 | M4.9 | 0.090 | 0.0 | 0.12 | 0.9 | 0.80 | -2.65 | W | N | Li | ||
| 71 | 05 33 48.07 | 06 27 42.4 | M3.7 | 0.087 | 0.2 | 0.21 | 2.9 | 0.60 | -2.63 | W | N | Li | ||
| 72 | 05 33 48.18 | 04 39 27.4 | M3.0 | 0.389 | 0.2 | 0.26 | 0.7 | 0.53 | -2.73 | W | N | Li, Na | ||
| 73 | 05 33 48.23 | 05 34 47.2 | M4.0 | 0.102 | 0.0 | 0.19 | 1.9 | … | -2.42 | … | N | Na, X | ||
| 74 | 05 33 48.34 | 05 22 39.4 | M3.4 | 0.236 | 0.0 | 0.23 | 1.1 | 0.45 | W | N | Li, Na | |||
| 75 | 05 33 50.32 | 06 21 30.9 | M1.0 | 0.562 | 0.0 | 0.39 | 0.8 | 0.40 | -2.68 | W | N | Li, X | ||
| 76 | 05 33 51.88 | 05 54 25.8 | M2.3 | 0.198 | 0.0 | 0.31 | 2.0 | 0.32 | -2.68 | W | N | Li, Na, X | ||
| 77 | 05 33 52.11 | 05 30 28.5 | M3.8 | 0.300 | 0.0 | 0.19 | 0.57 | -2.73 | W | N | Li, Na, X | |||
| 78 | 05 33 53.41 | 06 17 10.2 | M3.4 | 0.146 | 0.0 | 0.23 | 1.8 | 0.40 | -2.71 | W | N | Li, X | ||
| 79 | 05 33 54.50 | 06 15 41.3 | M4.6 | 0.073 | 0.0 | 0.14 | 1.9 | 0.60 | -2.74 | W | N | Li | ||
| 80 | 05 33 54.59 | 06 21 18.7 | M4.8 | 0.094 | 0.2 | 0.13 | 1.0 | 0.50 | -1.86 | W | Y | Li, IRE | ||
| 81 | 05 33 55.10 | 05 56 13.8 | M5.2 | 0.071 | 0.1 | 0.11 | 1.1 | … | -2.90 | W | N | Na, X | ||
| 82 | 05 33 55.54 | 06 29 28.6 | M4.7 | 0.038 | 0.2 | 0.12 | 3.3 | … | -2.75 | W | N | Na | ||
| 83 | 05 33 56.39 | 04 35 30.0 | M4.4 | 0.076 | 0.0 | 0.15 | 2.0 | … | -1.22 | -0.75 | W | TD | Na, IRE | |
| 84 | 05 33 56.54 | 05 06 47.7 | M3.0 | 0.560 | 0.0 | 0.26 | 0.47 | -2.84 | W | N | Li, Na | |||
| 85 | 05 33 57.90 | 04 35 43.8 | M5.0 | 0.063 | 0.1 | 0.11 | 1.6 | 0.59 | -2.75 | W | N | Li, Na | ||
| 86 | 05 33 59.45 | 06 21 18.2 | M4.1 | 0.087 | 0.3 | 0.17 | 2.1 | 0.30 | -1.72 | C | Y | Li, IRE | ||
| 87 | 05 33 59.46 | 04 43 04.6 | M1.0 | 0.330 | 0.1 | 0.41 | 1.7 | 0.57 | -2.68 | W | N | Li, Na | ||
| 88 | 05 34 00.42 | 04 36 15.0 | M4.9 | 0.184 | 0.0 | 0.13 | 0.27 | -2.63 | W | N | Li, Na | |||
| 89 | 05 34 01.72 | 05 46 51.4 | M1.5 | 0.311 | 0.1 | 0.37 | 1.5 | … | -2.91 | … | N | X | ||
| 90 | 05 34 02.03 | 04 44 53.7 | M4.6 | 0.140 | 0.0 | 0.15 | 0.39 | -1.46 | -1.28 | C | Y | Li, Na, IRE | ||
| 91 | 05 34 02.85 | 06 05 50.9 | M4.7 | 0.048 | 0.0 | 0.12 | 2.7 | 0.70 | -2.44 | W | N | Li | ||
| 92 | 05 34 03.83 | 06 16 04.5 | M2.2 | 0.407 | 0.0 | 0.31 | 0.8 | 0.40 | -2.69 | W | N | Li, X | ||
| 93 | 05 34 03.84 | 04 36 06.2 | M2.2 | 0.218 | 0.0 | 0.32 | 1.9 | 0.45 | -2.53 | -0.13 | C | TD | Li, Na, IRE | |
| 94 | 05 34 04.40 | 05 36 26.4 | M5.3 | 0.088 | 0.1 | 0.11 | … | -2.93 | W | N | Na, X | |||
| 95 | 05 34 04.47 | 06 31 37.9 | M4.0 | 0.078 | 0.6 | 0.18 | 2.6 | … | -2.03 | W | Y | IRE | ||
| 96 | 05 34 04.70 | 04 51 31.0 | M4.9 | 0.040 | 1.6 | 0.10 | 2.8 | 0.49 | -1.81 | W | Y | Li, Na, IRE | ||
| 97 | 05 34 04.71 | 04 50 49.6 | M5.1 | 0.062 | 0.0 | 0.10 | 1.5 | 0.50 | -1.35 | -0.53 | C | TD | Li, Na, IRE | |
| 98 | 05 34 04.95 | 06 23 47.0 | M4.0 | 0.146 | 0.2 | 0.18 | 1.2 | 0.20 | -1.70 | W | Y | Li, IRE | ||
| 99 | 05 34 05.02 | 04 40 03.4 | M4.5 | 0.069 | 0.0 | 0.14 | 2.1 | … | -1.42 | -0.90 | … | TD | Na, IRE | |
| 100 | 05 34 05.99 | 06 06 11.7 | M4.6 | 0.062 | 0.0 | 0.13 | 2.2 | 0.60 | -1.37 | -0.88 | C | Y | Li, IRE | |
| 101 | 05 34 06.96 | 06 32 07.9 | M3.0 | 0.126 | 0.1 | 0.27 | 2.8 | 0.32 | -0.37 | -0.04 | W | Y | Li, Na, X, IRE | |
| 102 | 05 34 07.52 | 06 04 46.4 | M2.6 | 0.256 | 0.0 | 0.29 | 1.3 | 0.70 | -2.75 | W | N | Li | ||
| 103 | 05 34 07.94 | 06 12 34.0 | M4.0 | 0.054 | 0.5 | 0.18 | 3.9 | 0.50 | -1.44 | -0.96 | C | Y | Li, IRE | |
| 104 | 05 34 08.22 | 05 05 44.5 | M5.0 | 0.083 | 0.3 | 0.12 | 1.0 | 0.47 | -2.47 | W | N | Li, Na | ||
| 105 | 05 34 08.89 | 05 01 42.1 | M3.4 | 0.343 | 0.0 | 0.23 | 0.5 | 0.34 | -2.78 | W | N | Li, Na | ||
| 106 | 05 34 09.07 | 06 33 56.7 | M4.6 | 0.068 | 0.0 | 0.14 | 2.1 | 0.55 | -2.59 | W | N | Li, Na | ||
| 107 | 05 34 09.71 | 04 48 46.4 | M4.5 | 0.101 | 0.0 | 0.14 | 1.2 | 0.53 | -2.64 | W | N | Li, Na | ||
| 108 | 05 34 09.85 | 06 23 22.0 | M3.1 | 0.134 | 0.0 | 0.27 | 2.5 | … | -2.74 | W | N | X | ||
| 109 | 05 34 10.06 | 06 26 50.6 | M4.9 | 0.031 | 0.4 | 0.097 | 3.7 | 0.30 | -2.64 | W | N | Li | ||
| 110 | 05 34 10.44 | 04 25 58.9 | M4.3 | 0.066 | 0.0 | 0.16 | 2.5 | … | -2.57 | W | N | Na | ||
| 111 | 05 34 10.47 | 04 50 27.5 | M4.4 | 0.093 | 0.0 | 0.16 | 1.6 | 0.43 | -1.46 | -0.46 | C | Y | Li, Na, IRE | |
| 112 | 05 34 11.15 | 04 30 53.7 | M4.8 | 0.044 | 0.2 | 0.11 | 2.7 | … | -1.55 | C | Y | Na, IRE | ||
| 113 | 05 34 11.95 | 05 52 22.0 | M5.6 | 0.092 | 0.0 | 0.098 | … | -2.55 | W | N | Na, X | |||
| 114 | 05 34 12.06 | 06 17 02.4 | M5.0 | 0.110 | 0.2 | 0.12 | … | -2.66 | W | N | X | |||
| 115 | 05 34 12.21 | 04 50 07.3 | M0.8 | 0.240 | 2.7 | 0.45 | 3.1 | 0.29 | -0.16 | -0.07 | C | TD | Li, IRE | |
| 116 | 05 34 13.46 | 05 55 41.8 | M3.2 | 0.252 | 0.1 | 0.25 | 1.1 | 0.38 | -1.74 | -1.31 | W | Y | Li, Na, IRE | |
| 117 | 05 34 13.87 | 05 36 35.4 | M4.7 | 0.176 | 0.1 | 0.14 | 0.46 | -2.58 | W | N | Li, Na | |||
| 118 | 05 34 14.09 | 05 47 21.9 | M3.5 | 0.127 | 0.0 | 0.23 | 2.0 | … | … | N | X | |||
| 119 | 05 34 14.38 | 04 58 33.7 | M3.6 | 0.089 | 0.0 | 0.22 | 3.0 | 0.44 | -2.85 | W | N | Li, Na | ||
| 120 | 05 34 14.75 | 06 19 18.2 | M2.8 | 0.325 | 0.0 | 0.28 | 0.9 | 0.40 | -2.68 | W | N | Li, X | ||
| 121 | 05 34 14.79 | 05 43 56.0 | M4.3 | 0.062 | 0.1 | 0.16 | 2.7 | 0.48 | W | N | Li, Na, X | |||
| 122 | 05 34 14.71 | 05 53 07.6 | M4.5 | 0.105 | 0.0 | 0.15 | 1.2 | … | -1.66 | -1.12 | C | Y | Na, X, IRE | |
| 123 | 05 34 15.50 | 04 23 34.1 | M5.7 | 0.057 | 0.0 | 0.088 | 0.9 | … | -2.60 | W | N | Na | ||
| 124 | 05 34 15.62 | 06 24 16.8 | M4.0 | 0.076 | 0.7 | 0.18 | 2.7 | … | -2.68 | W | N | X | ||
| 125 | 05 34 16.35 | 04 49 27.2 | M5.3 | 0.147 | 0.3 | 0.11 | 0.27 | -2.06 | -1.22 | W | TD | Li, Na, IRE | ||
| 126 | 05 34 18.12 | 04 23 18.4 | M5.2 | 0.068 | 0.0 | 0.11 | 1.2 | … | -2.61 | W | N | Na | ||
| 127 | 05 34 18.22 | 06 02 00.2 | M4.9 | 0.032 | 0.4 | 0.098 | 3.6 | … | -1.56 | -1.07 | C | Y | IRE | |
| 128 | 05 34 18.53 | 05 34 00.2 | K8.2 | 0.587 | 0.4 | 0.61 | 1.7 | … | -2.69 | … | N | X | ||
| 129 | 05 34 18.67 | 05 37 08.2 | M4.7 | 0.125 | 0.6 | 0.14 | 0.33 | -1.94 | -1.01 | C | Y | Li, Na, X, IRE | ||
| 130 | 05 34 18.73 | 04 15 15.9 | M5.0 | 0.065 | 0.0 | 0.11 | 1.5 | 0.69 | -2.69 | W | N | Li, Na | ||
| 131 | 05 34 18.89 | 05 59 29.9 | M4.8 | 0.084 | 0.0 | 0.13 | 1.2 | 0.45 | -2.65 | W | N | Li, Na | ||
| 132 | 05 34 20.26 | 05 58 15.6 | M4.4 | 0.204 | 0.0 | 0.16 | 0.40 | -2.66 | W | N | Li, Na | |||
| 133 | 05 34 20.27 | 04 19 52.0 | M3.8 | 0.152 | 0.0 | 0.20 | 1.4 | … | -2.72 | W | N | Na | ||
| 134 | 05 34 20.32 | 04 34 03.4 | M4.3 | 0.245 | 0.0 | 0.17 | 0.40 | -2.74 | W | N | Li, Na | |||
| 135 | 05 34 20.39 | 04 58 20.4 | M4.7 | 0.085 | 0.0 | 0.13 | 1.3 | … | -2.17 | W | N | Na | ||
| 136 | 05 34 20.43 | 06 31 15.1 | M5.1 | 0.056 | 0.6 | 0.10 | 1.9 | … | -1.20 | -0.96 | C | Y | IRE | |
| 137 | 05 34 20.69 | 04 35 01.9 | M3.5 | 0.141 | 0.0 | 0.22 | 1.8 | … | -1.55 | -1.20 | … | Y | IRE | |
| 138 | 05 34 20.88 | 05 06 50.1 | M4.9 | 0.100 | 0.0 | 0.13 | 0.5 | 0.39 | -2.63 | W | N | Li, Na | ||
| 139 | 05 34 21.24 | 05 35 34.8 | M4.7 | 0.129 | 0.0 | 0.14 | 0.49 | -2.57 | W | N | Li, Na | |||
| 140 | 05 34 21.56 | 05 00 13.0 | M5.1 | 0.035 | 0.0 | 0.092 | 3.5 | … | … | N | Na | |||
| 141 | 05 34 22.57 | 06 20 29.3 | M4.5 | 0.138 | 0.0 | 0.15 | 0.6 | 0.30 | -2.75 | W | N | Li, X | ||
| 142 | 05 34 23.61 | 06 18 38.9 | M2.6 | 0.288 | 0.1 | 0.29 | 1.1 | 0.50 | -2.69 | W | N | Li, X | ||
| 143 | 05 34 24.77 | 04 27 33.2 | M5.1 | 0.047 | 0.3 | 0.097 | 2.4 | … | -1.38 | -1.04 | C | Y | Na, IRE | |
| 144 | 05 34 25.11 | 06 43 27.5 | M0.9 | 0.567 | 0.0 | 0.40 | 0.8 | 0.40 | -2.73 | W | N | Li | ||
| 145 | 05 34 25.26 | 04 54 39.8 | M4.9 | 0.366 | 0.0 | 0.12 | 0.33 | -2.60 | W | N | Li, Na | |||
| 146 | 05 34 25.28 | 04 33 06.1 | M3.5 | 0.314 | 0.0 | 0.22 | 0.5 | 0.40 | -2.76 | W | N | Li, Na, X | ||
| 147 | 05 34 25.53 | 06 16 31.0 | M4.9 | 0.040 | 0.7 | 0.10 | 2.8 | … | -1.64 | -1.23 | W | Y | IRE | |
| 148 | 05 34 25.53 | 04 06 37.7 | M2.7 | 0.527 | 0.0 | 0.27 | 0.40 | -2.68 | W | N | Li, Na | |||
| 149 | 05 34 25.79 | 05 35 46.6 | M4.8 | 0.065 | 0.0 | 0.12 | 1.9 | 0.60 | W | N | Li, Na, X | |||
| 150 | 05 34 25.89 | 06 03 52.0 | M4.7 | 0.087 | 0.0 | 0.13 | 1.3 | 0.40 | -2.56 | W | N | Li | ||
| 151 | 05 34 26.07 | 05 07 33.3 | M4.9 | 0.167 | 0.0 | 0.12 | 0.52 | -2.72 | W | N | Li, Na | |||
| 152 | 05 34 26.51 | 05 01 00.9 | M2.0 | 0.387 | 0.0 | 0.33 | 1.0 | 0.39 | -2.73 | W | N | Li, Na, X | ||
| 153 | 05 34 26.76 | 05 41 57.4 | M3.7 | 0.178 | 0.0 | 0.20 | 1.2 | 0.51 | -0.95 | -1.01 | W | Y | Li, Na, IRE | |
| 154 | 05 34 26.76 | 05 01 17.8 | M4.1 | 0.306 | 0.0 | 0.18 | 0.40 | -2.70 | W | N | Li, Na | |||
| 155 | 05 34 26.84 | 06 26 25.8 | M4.1 | 0.085 | 0.3 | 0.17 | 2.2 | 0.30 | -1.83 | -1.27 | W | TD | Li, IRE | |
| 156 | 05 34 27.12 | 05 16 48.8 | M5.3 | 0.079 | 0.0 | 0.11 | 0.5 | 0.57 | W | N | Li | |||
| 157 | 05 34 27.31 | 04 55 28.6 | K8.9 | 0.561 | 0.5 | 0.58 | 1.6 | 0.36 | -2.80 | W | N | Li | ||
| 158 | 05 34 27.43 | 05 00 26.3 | M4.4 | 0.044 | 0.3 | 0.14 | 3.6 | … | -1.54 | -1.03 | C | Y | Na, IRE | |
| 159 | 05 34 27.81 | 05 42 10.1 | M2.2 | 0.176 | 0.0 | 0.33 | 2.6 | 0.36 | -2.13 | W | Y | Li, Na, X | ||
| 160 | 05 34 27.84 | 05 43 31.5 | M3.9 | 0.214 | 0.0 | 0.19 | 0.7 | 0.32 | -2.77 | W | N | Li, Na, X | ||
| 161 | 05 34 27.86 | 05 56 28.2 | M4.3 | 0.104 | 0.0 | 0.16 | 1.5 | 0.28 | -2.85 | … | N | Li, Na | ||
| 162 | 05 34 28.08 | 05 05 21.9 | M6.1 | 0.055 | 0.3 | 0.076 | 0.6 | 0.73 | -1.29 | -0.71 | C | Y | Li, Na, IRE | |
| 163 | 05 34 28.68 | 04 34 39.6 | M3.1 | 0.198 | 0.0 | 0.26 | 1.5 | 0.46 | -2.66 | W | N | Li, Na, X | ||
| 164 | 05 34 29.60 | 05 04 28.9 | M5.1 | 0.058 | 0.3 | 0.100 | 1.7 | … | -2.53 | … | N | Na | ||
| 165 | 05 34 29.60 | 05 47 24.7 | M1.2 | 0.254 | 0.2 | 0.41 | 2.4 | 0.49 | -1.08 | -0.27 | C | TD | Li, Na, IRE | |
| 166 | 05 34 29.86 | 05 04 05.4 | M3.0 | 0.186 | 0.0 | 0.27 | 1.7 | 0.30 | -2.66 | W | N | Li, Na, X | ||
| 167 | 05 34 30.21 | 04 58 30.4 | M3.8 | 0.263 | 0.0 | 0.19 | 0.37 | -2.63 | W | N | Li, Na | |||
| 168 | 05 34 30.23 | 04 58 37.9 | M5.2 | 0.047 | 0.0 | 0.092 | 2.5 | 0.66 | -1.65 | -0.79 | C | TD | Li, Na, IRE | |
| 169 | 05 34 30.25 | 06 22 01.1 | M3.3 | 0.298 | 0.2 | 0.24 | 0.8 | 0.40 | -2.73 | W | N | Li, X | ||
| 170 | 05 34 30.96 | 05 58 03.7 | M5.1 | 0.049 | 0.0 | 0.098 | 2.2 | … | -1.57 | -0.60 | C | TD | Na, IRE | |
| 171 | 05 34 31.45 | 06 43 22.6 | M3.7 | 0.217 | 0.1 | 0.20 | 1.0 | 0.40 | -2.69 | W | N | Li | ||
| 172 | 05 34 31.79 | 04 57 37.4 | M5.5 | 0.063 | 0.1 | 0.095 | 1.0 | … | -2.87 | W | N | Na | ||
| 173 | 05 34 31.81 | 06 22 49.8 | M4.6 | 0.394 | 0.0 | 0.14 | 0.10 | -2.62 | -2.46 | W | DB | Li, Na, X, IRE | ||
| 174 | 05 34 32.23 | 05 41 48.5 | M4.2 | 0.082 | 0.1 | 0.17 | 2.1 | 0.46, 0.42 | -1.89 | -0.48 | C | TD | Li, Na, IRE | |
| 175 | 05 34 32.76 | 04 58 46.8 | M5.3 | 0.072 | 0.0 | 0.10 | 0.9 | 0.51 | -1.14 | -0.68 | C | Y | Li, Na, IRE | |
| 176 | 05 34 32.87 | 06 24 44.0 | M4.8 | 0.068 | 0.0 | 0.12 | 1.7 | 0.60 | -2.58 | W | N | Li, X | ||
| 177 | 05 34 32.91 | 05 00 40.4 | M3.8 | 0.375 | 0.0 | 0.20 | 0.44 | -2.75 | W | N | Li, Na, X | |||
| 178 | 05 34 33.02 | 05 44 39.7 | M4.3 | 0.080 | 1.9 | 0.16 | 2.1 | … | -1.71 | C | Y | Na, IRE | ||
| 179 | 05 34 33.26 | 05 07 26.7 | M4.8 | 0.033 | 0.6 | 0.10 | 3.4 | 0.68 | W | N | Li | |||
| 180 | 05 34 33.61 | 06 11 19.5 | M4.8 | 0.061 | 0.0 | 0.12 | 2.1 | 0.70 | -0.78 | -0.32 | C | TD | Li, IRE | |
| 181 | 05 34 33.70 | 04 44 15.0 | M4.8 | 0.068 | 0.0 | 0.12 | 1.7 | 0.39 | W | N | Li, Na | |||
| 182 | 05 34 33.87 | 05 56 38.1 | M4.3 | 0.202 | 0.0 | 0.16 | 0.56 | -2.70 | W | N | Li, Na, X | |||
| 183 | 05 34 33.96 | 05 48 25.0 | M4.8 | 0.111 | 0.0 | 0.13 | 0.37 | -1.19 | C | Y | Na, X, IRE | |||
| 184 | 05 34 34.17 | 05 05 17.0 | M4.0 | 0.115 | 0.1 | 0.18 | 1.7 | 0.38 | -1.30 | -1.02 | W | Y | Li, Na, X, IRE | |
| 185 | 05 34 34.26 | 06 02 09.7 | M2.8 | 0.176 | 0.1 | 0.28 | 2.0 | 0.40 | -2.69 | -2.19 | W | DB | Li, IRE | |
| 186 | 05 34 35.12 | 04 48 35.9 | M5.4 | 0.105 | 0.0 | 0.10 | … | -1.85 | W | Y | Na, IRE | |||
| 187 | 05 34 35.46 | 05 03 26.8 | M5.1 | 0.043 | 0.2 | 0.092 | 2.9 | … | -2.63 | W | N | Na, X | ||
| 188 | 05 34 35.68 | 05 35 52.1 | M3.7 | 0.119 | 0.0 | 0.21 | 2.0 | 0.39, 0.53 | -2.70 | W | N | Li, Na, X | ||
| 189 | 05 34 36.25 | 06 04 51.5 | M3.2 | 0.184 | 0.1 | 0.25 | 1.5 | 0.30 | -2.58 | W | N | Li, X | ||
| 190 | 05 34 36.31 | 06 16 24.4 | M4.8 | 0.059 | 0.4 | 0.12 | 2.1 | … | -1.66 | -1.22 | C | Y | IRE | |
| 191 | 05 34 37.45 | 05 54 26.9 | M5.6 | 0.049 | 0.0 | 0.082 | 1.3 | … | -2.88 | … | N | Na | ||
| 192 | 05 34 37.78 | 04 19 28.1 | M5.0 | 0.095 | 0.0 | 0.12 | … | -2.67 | W | N | Na | |||
| 193 | 05 34 37.87 | 04 42 38.5 | M5.7 | 0.098 | 0.0 | 0.095 | … | W | N | Na | ||||
| 194 | 05 34 37.95 | 05 46 10.6 | M4.6 | 0.049 | 0.0 | 0.13 | 2.8 | 0.30 | … | N | Na | |||
| 195 | 05 34 38.19 | 05 35 49.6 | M4.9 | 0.073 | 0.0 | 0.12 | 1.4 | 0.37 | -2.35 | … | N | Na, X | ||
| 196 | 05 34 38.56 | 05 47 35.1 | K9.3 | 0.708 | 0.4 | 0.53 | 1.0 | 1.08 | -2.56 | W | N | Li, X | ||
| 197 | 05 34 38.59 | 06 35 56.4 | M3.2 | 0.193 | 0.1 | 0.25 | 1.4 | 0.30 | -2.71 | W | N | Li | ||
| 198 | 05 34 38.61 | 04 22 26.2 | M5.9 | 0.052 | 0.0 | 0.079 | 0.7 | … | -2.53 | W | N | Na | ||
| 199 | 05 34 38.75 | 06 08 22.9 | M3.7 | 0.162 | 0.1 | 0.20 | 1.4 | 0.50 | -2.70 | W | N | Li | ||
| 200 | 05 34 38.79 | 04 39 37.1 | M4.4 | 0.057 | 0.2 | 0.14 | 2.7 | … | -1.91 | … | Y | IRE | ||
| 201 | 05 34 39.09 | 06 27 21.2 | M1.8 | 0.211 | 0.0 | 0.36 | 2.4 | 0.15 | -2.85 | W | N | Li, Na, X | ||
| 202 | 05 34 39.12 | 06 17 11.7 | M3.8 | 0.192 | 0.0 | 0.19 | 1.0 | … | -2.69 | W | N | X | ||
| 203 | 05 34 39.20 | 06 25 24.2 | M3.9 | 0.127 | 0.0 | 0.19 | 1.6 | 0.51 | -2.81 | W | N | Li, Na | ||
| 204 | 05 34 39.24 | 05 50 56.6 | M5.2 | 0.103 | 0.0 | 0.11 | 0.36 | … | N | Na | ||||
| 205 | 05 34 39.68 | 06 18 06.3 | M4.6 | 0.070 | 0.0 | 0.14 | 2.0 | 0.60 | -2.75 | W | N | Li, X | ||
| 206 | 05 34 39.71 | 06 07 13.3 | M3.5 | 0.299 | 0.0 | 0.22 | 0.6 | 0.40 | -2.67 | W | N | Li | ||
| 207 | 05 34 41.00 | 05 48 04.9 | M5.0 | 0.084 | 0.0 | 0.12 | 0.9 | 0.33 | … | N | Na | |||
| 208 | 05 34 41.03 | 06 27 50.7 | M1.4 | 0.232 | 0.0 | 0.39 | 2.5 | 0.30 | -2.71 | W | N | Li, X | ||
| 209 | 05 34 41.11 | 05 47 39.4 | M4.3 | 0.099 | 0.0 | 0.16 | 1.6 | 0.35 | -1.83 | … | Y | Na, X | ||
| 210 | 05 34 41.18 | 05 46 11.6 | M2.7 | 0.329 | 0.0 | 0.29 | 0.9 | 0.47 | -0.95 | -0.13 | C | Y | Li, Na, X, IRE | |
| 211 | 05 34 41.26 | 05 52 45.6 | M4.8 | 0.059 | 0.0 | 0.12 | 2.1 | 0.35 | W | N | Li, Na | |||
| 212 | 05 34 41.43 | 04 39 13.8 | M3.0 | 0.154 | 0.3 | 0.27 | 2.2 | … | -1.74 | -1.21 | … | Y | IRE | |
| 213 | 05 34 41.60 | 04 24 39.3 | M5.6 | 0.128 | 0.0 | 0.097 | … | -2.73 | W | N | Na | |||
| 214 | 05 34 41.63 | 05 23 57.5 | M5.0 | 0.126 | 0.3 | 0.12 | 0.34 | … | N | X | ||||
| 215 | 05 34 41.73 | 05 36 48.8 | M5.5 | 0.064 | 0.0 | 0.096 | 1.0 | … | -1.36 | … | Y | Na, X, IRE | ||
| 216 | 05 34 41.99 | 05 45 00.6 | M5.2 | 0.112 | 0.2 | 0.11 | 0.17 | -1.13 | -0.28 | C | Y | Li, Na, IRE | ||
| 217 | 05 34 42.04 | 05 02 24.9 | M4.4 | 0.065 | 0.1 | 0.15 | 2.5 | 0.16 | -2.29 | W | N | Li, Na, X | ||
| 218 | 05 34 42.44 | 05 43 25.5 | M4.2 | 0.127 | 0.8 | 0.16 | 1.2 | … | -1.80 | -0.62 | C | Y | Na, IRE | |
| 219 | 05 34 43.12 | 06 12 38.9 | M1.8 | 0.254 | 0.0 | 0.35 | 1.8 | 0.50 | -2.76 | W | N | Li, X | ||
| 220 | 05 34 43.16 | 06 27 14.6 | M4.8 | 0.182 | 0.0 | 0.13 | 0.40 | -1.22 | -0.74 | C | Y | Li, Na, X, IRE | ||
| 221 | 05 34 43.29 | 06 17 03.6 | M1.9 | 0.345 | 0.2 | 0.34 | 1.2 | 0.41 | -2.74 | W | N | Li, Na, X | ||
| 222 | 05 34 43.98 | 04 39 38.5 | M5.2 | 0.071 | 0.0 | 0.11 | 1.0 | 0.22 | -1.55 | -1.12 | C | Y | Li, Na, IRE | |
| 223 | 05 34 44.45 | 05 56 14.9 | M4.0 | 0.135 | 0.0 | 0.18 | 1.3 | … | -2.67 | … | N | X | ||
| 224 | 05 34 44.75 | 06 40 29.4 | M4.8 | 0.074 | 0.3 | 0.12 | 1.5 | 0.50 | -2.68 | W | N | Li | ||
| 225 | 05 34 44.77 | 04 56 40.8 | M2.2 | 0.121 | 0.5 | 0.35 | 4.8 | 0.07 | -1.44 | -1.00 | C | Y | Li, Na, IRE | |
| 226 | 05 34 44.78 | 04 54 05.1 | M5.3 | 0.056 | 0.3 | 0.095 | 1.9 | … | C | Y | Na, IRE | |||
| 227 | 05 34 45.15 | 06 21 07.3 | M1.6 | 0.240 | 0.1 | 0.37 | 2.1 | 0.45 | -2.73 | W | N | Li, Na, X | ||
| 228 | 05 34 45.46 | 05 02 07.9 | M2.5 | 0.342 | 0.0 | 0.30 | 1.0 | 0.47 | -2.68 | W | N | Li, Na, X | ||
| 229 | 05 34 45.51 | 05 54 20.4 | M4.0 | 0.091 | 0.2 | 0.18 | 2.1 | 0.46 | -2.58 | W | N | Li, Na, X | ||
| 230 | 05 34 45.61 | 04 30 00.7 | M4.5 | 0.051 | 0.0 | 0.14 | 2.8 | … | W | N | Na | |||
| 231 | 05 34 45.90 | 05 48 12.3 | M3.8 | 0.119 | 0.0 | 0.19 | 1.8 | 0.54 | … | N | Li, Na, X | |||
| 232 | 05 34 46.34 | 04 29 02.9 | M4.0 | 0.115 | 0.0 | 0.18 | 1.7 | 0.29 | -2.57 | W | N | Li, Na | ||
| 233 | 05 34 46.45 | 04 26 15.9 | M3.5 | 0.109 | 0.0 | 0.22 | 2.4 | … | -2.80 | W | N | Na | ||
| 234 | 05 34 46.96 | 05 52 20.4 | M5.1 | 0.093 | 0.0 | 0.12 | 0.28 | … | N | Li, Na | ||||
| 235 | 05 34 47.52 | 05 46 30.1 | M3.2 | 0.395 | 0.0 | 0.24 | 0.5 | 0.51, 0.51 | -2.77 | W | N | Li, Na, X | ||
| 236 | 05 34 47.66 | 06 19 40.1 | M2.5 | 0.227 | 0.4 | 0.30 | 1.6 | 0.60 | -1.57 | -0.93 | C | Y | Li, IRE | |
| 237 | 05 34 48.11 | 06 18 11.6 | M2.9 | 0.113 | 0.0 | 0.29 | 3.7 | 0.30 | -2.79 | W | N | Li, X | ||
| 238 | 05 34 48.32 | 06 22 42.8 | M5.5 | 0.071 | 0.1 | 0.099 | 0.30 | -1.92 | -1.06 | W | TD | Li, X, IRE | ||
| 239 | 05 34 48.44 | 04 50 51.4 | M1.2 | 0.177 | 1.3 | 0.43 | 4.3 | … | -0.99 | -0.42 | C | Y | Na, IRE | |
| 240 | 05 34 48.82 | 05 33 33.1 | M3.9 | 0.104 | 0.3 | 0.19 | 1.9 | 0.44 | -1.50 | -0.63 | C | Y | Na, X, IRE | |
| 241 | 05 34 48.97 | 06 07 45.0 | M2.1 | 0.233 | 0.0 | 0.33 | 1.8 | 0.50 | -2.68 | W | N | Li, X | ||
| 242 | 05 34 49.22 | 05 04 38.1 | M3.8 | 0.242 | 0.0 | 0.19 | 0.6 | 0.40 | -2.88 | W | N | Li, Na, X | ||
| 243 | 05 34 49.30 | 04 13 24.1 | M3.1 | 0.147 | 0.0 | 0.27 | 2.2 | 0.28 | -2.64 | W | N | Li, Na | ||
| 244 | 05 34 49.59 | 06 32 59.4 | M4.9 | 0.063 | 0.7 | 0.11 | 1.8 | 0.40 | -2.65 | W | N | Li, X | ||
| 245 | 05 34 49.64 | 04 36 41.6 | M4.9 | 0.062 | 0.0 | 0.11 | 1.8 | 0.28 | W | N | Li, Na | |||
| 246 | 05 34 49.80 | 06 15 28.5 | M5.0 | 0.090 | 0.0 | 0.12 | 0.7 | … | -2.73 | W | N | Na, X | ||
| 247 | 05 34 50.01 | 05 53 04.1 | M5.1 | 0.150 | 0.0 | 0.12 | 0.56 | -2.64 | … | N | Li, Na, X | |||
| 248 | 05 34 50.14 | 05 19 59.9 | M6.0 | 0.025 | 0.0 | 0.058 | 1.8 | 0.16 | … | ? | X | |||
| 249 | 05 34 50.24 | 05 42 16.5 | M4.3 | 0.047 | 0.2 | 0.15 | 3.5 | … | … | N | X | |||
| 250 | 05 34 50.47 | 05 32 53.9 | M5.5 | 0.055 | 0.1 | 0.088 | 1.4 | 0.26 | … | N | X | |||
| 251 | 05 34 50.55 | 05 06 38.3 | M5.1 | 0.053 | 0.0 | 0.098 | 2.1 | 0.68 | … | N | Li, Na | |||
| 252 | 05 34 50.86 | 05 29 25.1 | M4.5 | 0.178 | 0.0 | 0.15 | 0.39 | … | N | X | ||||
| 253 | 05 34 51.41 | 05 00 11.4 | M4.6 | 0.135 | 0.0 | 0.15 | 0.5 | 0.67 | -2.63 | W | N | Li, Na, X | ||
| 254 | 05 34 51.90 | 06 17 38.1 | M3.1 | 0.100 | 0.3 | 0.27 | 3.8 | 0.34 | -2.63 | W | N | Li, Na, X | ||
| 255 | 05 34 52.26 | 05 12 03.2 | M3.0 | 0.155 | 0.0 | 0.27 | 2.1 | 0.54 | … | N | X | |||
| 256 | 05 34 52.31 | 06 35 08.7 | M4.2 | 0.117 | 0.0 | 0.17 | 1.3 | … | -2.67 | W | N | Na, X | ||
| 257 | 05 34 52.34 | 05 30 08.0 | M4.1 | 0.149 | 0.0 | 0.17 | 1.1 | 0.21, 0.55 | … | Y | Li, Na, X, IRE | |||
| 258 | 05 34 52.40 | 06 11 57.0 | M1.9 | 0.261 | 0.4 | 0.34 | 1.6 | 0.30 | -2.70 | W | N | Li, X | ||
| 259 | 05 34 52.63 | 06 16 47.3 | M2.8 | 0.131 | 0.1 | 0.30 | 3.1 | 0.22 | -2.56 | W | N | Li, Na, X | ||
| 260 | 05 34 52.74 | 06 15 09.8 | M5.4 | 0.034 | 0.6 | 0.079 | 3.2 | … | -2.54 | W | N | X | ||
| 261 | 05 34 52.76 | 05 00 50.9 | M4.2 | 0.145 | 0.1 | 0.16 | 1.0 | 0.31 | -2.72 | W | N | Li, Na, X | ||
| 262 | 05 34 52.84 | 05 33 48.3 | M4.5 | 0.109 | 0.0 | 0.15 | 1.1 | 0.40 | -2.83 | … | N | X | ||
| 263 | 05 34 53.07 | 04 37 03.6 | M4.3 | 0.077 | 0.4 | 0.16 | 2.1 | … | -1.43 | -0.74 | … | Y | Na, IRE | |
| 264 | 05 34 53.31 | 05 54 05.3 | M3.8 | 0.215 | 0.1 | 0.19 | 0.9 | 0.21 | -2.75 | W | N | Li, Na, X | ||
| 265 | 05 34 53.44 | 04 57 32.8 | M4.5 | 0.121 | 0.2 | 0.15 | 0.9 | 0.43 | -1.23 | -0.90 | W | Y | Li, Na, IRE | |
| 266 | 05 34 53.45 | 04 29 09.5 | M5.3 | 0.115 | 0.0 | 0.10 | … | -2.73 | W | N | Na | |||
| 267 | 05 34 53.63 | 05 01 29.1 | M5.2 | 0.046 | 0.0 | 0.090 | 2.7 | … | -2.52 | … | N | Na, X | ||
| 268 | 05 34 53.87 | 06 23 52.6 | M1.2 | 0.693 | 0.6 | 0.37 | 0.6 | 0.50 | -0.96 | W | Y | Li, Na, IRE | ||
| 269 | 05 34 54.80 | 05 55 08.3 | M5.6 | 0.025 | 0.0 | 0.071 | 3.7 | … | -1.67 | C | Y | Na, IRE | ||
| 270 | 05 34 54.90 | 04 27 24.5 | M4.1 | 0.086 | 0.0 | 0.17 | 2.1 | … | -2.67 | W | N | Na, X | ||
| 271 | 05 34 55.06 | 05 25 29.5 | M3.0 | 0.375 | 0.8 | 0.26 | 0.7 | 0.53 | -2.53 | … | N | X | ||
| 272 | 05 34 56.04 | 04 38 12.0 | M4.1 | 0.146 | 0.0 | 0.17 | 1.1 | 0.55 | W | N | Li, Na | |||
| 273 | 05 34 56.13 | 05 06 01.8 | M4.1 | 0.249 | 0.0 | 0.17 | 0.25 | -2.81 | W | N | Li, Na, X | |||
| 274 | 05 34 56.40 | 05 38 05.2 | M5.0 | 0.180 | 0.0 | 0.12 | 0.51 | -2.35 | … | N | X | |||
| 275 | 05 34 56.62 | 06 34 10.2 | M5.0 | 0.087 | 0.3 | 0.12 | 0.7 | 0.30 | -2.64 | W | N | Li, X | ||
| 276 | 05 34 57.01 | 05 23 00.0 | M3.7 | 0.142 | 0.6 | 0.21 | 1.6 | 0.55, 0.45 | … | N | Li, X | |||
| 277 | 05 34 57.45 | 05 30 42.0 | M2.5 | 0.214 | 0.1 | 0.30 | 1.7 | 0.64 | … | N | X | |||
| 278 | 05 34 57.45 | 06 19 33.1 | M3.6 | 0.135 | 0.0 | 0.21 | 1.8 | 0.36 | -1.78 | -0.32 | W | TD | Li, Na, X, IRE | |
| 279 | 05 34 57.94 | 05 53 21.6 | M4.0 | 0.263 | 0.0 | 0.18 | 0.43, 0.31 | -2.02 | -1.52 | … | Y | Li, Na, X, IRE | ||
| 280 | 05 34 58.19 | 05 11 53.7 | M5.0 | 0.219 | 0.0 | 0.12 | 0.53 | -2.12 | … | N | X | |||
| 281 | 05 34 58.47 | 06 10 33.7 | M4.7 | 0.071 | 0.0 | 0.13 | 1.8 | 0.40 | -2.55 | W | N | Li, X | ||
| 282 | 05 34 58.90 | 05 28 03.3 | M3.0 | 0.171 | 0.0 | 0.27 | 1.9 | 0.46 | … | N | X | |||
| 283 | 05 35 01.37 | 06 03 55.7 | M4.5 | 0.066 | 0.0 | 0.14 | 2.2 | 0.30 | -1.22 | -0.83 | C | Y | Li, IRE | |
| 284 | 05 35 01.36 | 05 55 54.8 | M1.5 | 0.554 | 0.0 | 0.36 | 0.7 | 0.42, 0.49 | -2.75 | W | N | Li, X | ||
| 285 | 05 35 01.49 | 05 28 20.8 | M2.5 | 0.334 | 0.9 | 0.30 | 1.0 | 0.55 | … | N | X | |||
| 286 | 05 35 01.60 | 05 54 18.8 | M5.6 | 0.062 | 0.1 | 0.092 | 0.9 | 0.43 | -2.63 | W | N | Li, Na, X | ||
| 287 | 05 35 01.67 | 04 32 52.9 | M1.6 | 0.220 | 0.1 | 0.37 | 2.4 | 0.37 | -1.32 | -1.08 | C | Y | Li, Na, X, IRE | |
| 288 | 05 35 01.84 | 05 49 32.6 | M5.1 | 0.051 | 0.0 | 0.097 | 2.2 | 0.29, 0.26 | … | N | Li, Na | |||
| 289 | 05 35 01.94 | 05 00 43.3 | M4.9 | 0.040 | 0.1 | 0.10 | 2.8 | … | -2.72 | W | N | Na, X | ||
| 290 | 05 35 01.94 | 06 30 12.8 | M1.1 | 0.527 | 0.0 | 0.39 | 0.8 | 0.51 | -2.73 | W | N | Li, Na, X | ||
| 291 | 05 35 02.79 | 05 44 43.0 | M5.1 | 0.071 | 0.0 | 0.11 | 1.1 | … | W | N | Na | |||
| 292 | 05 35 02.79 | 06 23 59.9 | M4.8 | 0.098 | 0.0 | 0.13 | 0.9 | 0.50 | -2.55 | W | N | Li, X | ||
| 293 | 05 35 02.84 | 05 51 03.2 | M3.1 | 0.201 | 0.0 | 0.26 | 1.5 | 0.38, 0.42 | -1.43 | W | Y | Li, Na, X, IRE | ||
| 294 | 05 35 02.93 | 06 05 25.2 | M0.4 | 0.341 | 0.1 | 0.47 | 2.1 | 0.50, 0.51 | -2.76 | W | N | Li, X | ||
| 295 | 05 35 03.00 | 04 57 04.0 | M5.0 | 0.057 | 0.0 | 0.11 | 2.0 | … | … | N | Na | |||
| 296 | 05 35 03.04 | 04 59 59.8 | M4.6 | 0.211 | 0.0 | 0.14 | 0.37 | -2.61 | W | N | Li, Na | |||
| 297 | 05 35 03.09 | 06 12 23.4 | M4.3 | 0.151 | 0.1 | 0.16 | 0.7 | 0.80 | -2.64 | W | N | Li, X | ||
| 298 | 05 35 03.12 | 05 09 17.0 | M2.6 | 0.185 | 0.8 | 0.29 | 2.0 | 0.66, 0.35 | -1.42 | -0.76 | W | Y | Li, Na, X, IRE | |
| 299 | 05 35 03.14 | 05 50 01.5 | M5.2 | 0.063 | 0.0 | 0.10 | 1.4 | 0.30 | … | N | Na | |||
| 300 | 05 35 03.51 | 05 51 59.0 | M5.6 | 0.056 | 0.0 | 0.088 | 1.2 | 0.12 | … | N | Na | |||
| 301 | 05 35 03.81 | 06 16 47.5 | M2.8 | 0.172 | 0.0 | 0.28 | 2.0 | 0.46 | -2.65 | W | N | Li, Na, X | ||
| 302 | 05 35 03.98 | 04 11 53.8 | M3.6 | 0.173 | 0.0 | 0.21 | 1.3 | 0.35 | -2.72 | W | N | Li, Na | ||
| 303 | 05 35 04.52 | 05 55 25.6 | M5.2 | 0.103 | 0.0 | 0.11 | 0.27 | -2.77 | W | N | Na | |||
| 304 | 05 35 05.45 | 04 25 06.7 | M2.0 | 0.266 | 0.0 | 0.33 | 1.5 | 0.54 | -2.64 | W | N | Li, Na, X | ||
| 305 | 05 35 05.67 | 05 43 04.7 | M5.0 | 0.049 | 0.0 | 0.099 | 2.3 | 0.24 | … | N | Na, X | |||
| 306 | 05 35 05.76 | 05 44 00.1 | M3.4 | 0.197 | 0.0 | 0.23 | 1.3 | 0.32 | -2.74 | W | N | Li, Na, X | ||
| 307 | 05 35 06.08 | 05 52 39.3 | M3.6 | 0.220 | 0.0 | 0.21 | 1.0 | 0.54 | -2.43 | W | N | Li, Na, X | ||
| 308 | 05 35 06.58 | 05 59 51.4 | M4.9 | 0.095 | 0.0 | 0.12 | 0.6 | … | -2.66 | W | N | Na, X | ||
| 309 | 05 35 07.16 | 06 18 16.3 | M4.3 | 0.118 | 0.0 | 0.16 | 1.2 | 0.20 | -2.71 | W | N | Li, X | ||
| 310 | 05 35 07.24 | 04 50 25.5 | M4.8 | 0.308 | 0.0 | 0.13 | … | -2.57 | W | N | Na, X | |||
| 311 | 05 35 07.34 | 06 18 55.2 | M4.4 | 0.038 | 0.5 | 0.14 | 4.1 | 0.60 | -2.54 | W | N | Li, X | ||
| 312 | 05 35 07.38 | 06 26 34.1 | M5.4 | 0.063 | 0.0 | 0.097 | 1.1 | 0.30 | -2.57 | W | N | Li, X | ||
| 313 | 05 35 07.51 | 06 19 23.3 | M3.1 | 0.124 | 0.1 | 0.27 | 2.7 | 0.14 | -2.76 | W | N | Li, Na, X | ||
| 314 | 05 35 07.66 | 06 06 54.1 | M3.6 | 0.214 | 0.0 | 0.21 | 1.1 | 0.42 | -2.70 | W | N | X | ||
| 315 | 05 35 07.84 | 04 34 52.3 | M5.1 | 0.100 | 0.0 | 0.12 | … | W | N | Na | ||||
| 316 | 05 35 07.84 | 05 29 17.4 | M3.5 | 0.188 | 1.0 | 0.22 | 1.3 | … | … | N | X | |||
| 317 | 05 35 07.92 | 04 20 14.1 | M3.8 | 0.144 | 0.0 | 0.19 | 1.4 | 0.54 | -2.69 | W | N | Li, Na | ||
| 318 | 05 35 08.05 | 05 53 43.5 | M2.3 | 0.395 | 0.0 | 0.31 | 0.8 | 0.50, 0.48 | -2.97 | W | N | Li, Na, X | ||
| 319 | 05 35 08.25 | 05 29 12.1 | M4.5 | 0.085 | 0.8 | 0.14 | 1.6 | 0.23 | … | N | X | |||
| 320 | 05 35 08.25 | 04 25 33.3 | M0.6 | 0.219 | 0.1 | 0.49 | 4.2 | 0.54 | -2.71 | W | N | Li, X | ||
| 321 | 05 35 08.38 | 05 54 41.7 | M4.8 | 0.154 | 0.0 | 0.13 | 0.32, 0.45 | -2.68 | W | N | Li, Na, X | |||
| 322 | 05 35 08.56 | 05 53 51.4 | M5.1 | 0.084 | 0.0 | 0.11 | 0.6 | … | W | N | Na | |||
| 323 | 05 35 09.29 | 04 18 26.8 | M4.7 | 0.097 | 0.0 | 0.13 | 1.0 | … | -2.63 | W | N | Na | ||
| 324 | 05 35 09.61 | 04 33 11.0 | M2.4 | 0.408 | 0.0 | 0.30 | 0.8 | 0.17 | -2.76 | W | N | Li, Na | ||
| 325 | 05 35 10.62 | 06 01 44.8 | M3.2 | 0.163 | 0.0 | 0.25 | 1.8 | 0.40, 0.44 | -2.74 | W | N | Li, X | ||
| 326 | 05 35 10.88 | 05 49 48.6 | M5.6 | 0.054 | 0.0 | 0.086 | 1.2 | 0.21 | … | N | Na | |||
| 327 | 05 35 10.89 | 04 29 01.5 | M4.8 | 0.077 | 0.0 | 0.12 | 1.4 | 0.58 | -1.95 | -1.24 | W | TD | Li, Na, IRE | |
| 328 | 05 35 10.94 | 06 33 05.3 | M4.4 | 0.046 | 0.4 | 0.14 | 3.4 | 0.40 | -2.57 | W | N | Li, X | ||
| 329 | 05 35 11.11 | 06 00 21.6 | M4.3 | 0.182 | 0.0 | 0.16 | 0.50, 0.46 | W | N | Li, X | ||||
| 330 | 05 35 11.66 | 05 31 01.1 | M6.0 | 0.147 | 0.0 | 0.088 | … | -0.69 | -0.27 | … | Y | X, IRE | ||
| 331 | 05 35 12.05 | 06 49 54.5 | M4.6 | 0.138 | 0.0 | 0.14 | 0.50 | -1.52 | -0.65 | W | TD | Li, IRE | ||
| 332 | 05 35 12.15 | 05 31 38.8 | M4.5 | 0.336 | 0.2 | 0.15 | 0.43 | -2.20 | … | Y | X | |||
| 333 | 05 35 12.22 | 04 27 11.6 | M3.8 | 0.353 | 0.0 | 0.19 | 0.49 | -2.70 | W | N | Li, Na, X | |||
| 334 | 05 35 12.83 | 05 55 26.3 | M4.3 | 0.099 | 0.0 | 0.16 | 1.6 | 0.23 | -1.62 | -1.12 | W | TD | Li, Na, IRE | |
| 335 | 05 35 13.56 | 06 48 03.2 | M5.1 | 0.053 | 0.0 | 0.098 | 2.1 | 0.30 | -1.62 | -0.91 | W | TD | Li, IRE | |
| 336 | 05 35 13.65 | 04 11 07.4 | M4.3 | 0.098 | 0.0 | 0.16 | 1.6 | 0.60 | -2.70 | W | N | Li, Na | ||
| 337 | 05 35 13.81 | 05 30 24.4 | M3.5 | 0.256 | 0.0 | 0.22 | 0.8 | 0.59 | -2.90 | … | N | X | ||
| 338 | 05 35 14.44 | 05 54 26.6 | M4.0 | 0.087 | 0.0 | 0.18 | 2.2 | 0.30 | -1.50 | -1.19 | C | Y | Li, Na, X, IRE | |
| 339 | 05 35 14.67 | 05 08 52.1 | M3.5 | 0.207 | 0.2 | 0.22 | 1.2 | … | … | N | X | |||
| 340 | 05 35 14.93 | 05 56 36.2 | M4.1 | 0.133 | 0.0 | 0.17 | 1.3 | 0.33, 0.43 | -2.73 | W | N | Li, Na, X | ||
| 341 | 05 35 14.94 | 05 49 34.8 | M3.3 | 0.351 | 0.0 | 0.23 | 0.6 | 0.41, 0.37 | W | N | Li, Na, X | |||
| 342 | 05 35 15.59 | 05 34 46.7 | M5.0 | 0.222 | 0.6 | 0.12 | 0.36 | … | N | X | ||||
| 343 | 05 35 15.60 | 05 09 31.8 | M5.7 | 0.061 | 0.0 | 0.090 | 0.9 | 0.65 | W | N | Li, Na, X | |||
| 344 | 05 35 15.79 | 06 09 39.8 | M4.5 | 0.044 | 0.6 | 0.13 | 3.3 | 0.40, 0.16 | -2.74 | W | N | Li | ||
| 345 | 05 35 15.83 | 06 24 45.7 | M4.9 | 0.098 | 0.0 | 0.12 | 0.6 | 0.50 | -2.51 | W | N | Li, X | ||
| 346 | 05 35 15.85 | 06 09 46.7 | M5.3 | 0.029 | 0.3 | 0.080 | 3.8 | … | -1.36 | -1.04 | C | Y | IRE | |
| 347 | 05 35 15.86 | 05 28 52.9 | M2.2 | 1.039 | 1.4 | 0.30 | 0.55 | -1.53 | … | Y | X, IRE | |||
| 348 | 05 35 16.26 | 05 31 00.7 | M4.5 | 0.115 | 0.2 | 0.15 | 1.0 | 0.43 | … | N | X | |||
| 349 | 05 35 16.38 | 06 41 13.4 | M5.4 | 0.046 | 0.2 | 0.084 | 2.3 | 0.50 | -2.90 | W | N | Li | ||
| 350 | 05 35 16.41 | 04 58 02.0 | M4.7 | 0.125 | 0.0 | 0.14 | 0.67 | W | N | Li, Na, X | ||||
| 351 | 05 35 16.42 | 04 26 05.5 | M5.4 | 0.077 | 0.0 | 0.10 | … | -2.56 | W | N | Na, X | |||
| 352 | 05 35 16.66 | 04 38 05.7 | M5.0 | 0.088 | 0.0 | 0.12 | 0.7 | … | W | N | Na | |||
| 353 | 05 35 16.95 | 05 45 55.8 | M5.1 | 0.273 | 0.1 | 0.11 | 0.32 | -0.91 | -0.59 | C | Y | Li, Na, X, IRE | ||
| 354 | 05 35 17.16 | 05 41 53.9 | M5.0 | 0.129 | 0.0 | 0.12 | … | -1.32 | … | Y | X, IRE | |||
| 355 | 05 35 17.48 | 05 09 49.1 | M5.4 | 0.106 | 0.0 | 0.10 | 0.21, 0.44 | W | N | Li, Na, X | ||||
| 356 | 05 35 17.68 | 06 32 23.9 | M2.2 | 0.400 | 0.0 | 0.31 | 0.9 | 0.44 | -2.58 | -2.08 | W | DB | Li, Na, X, IRE | |
| 357 | 05 35 17.68 | 05 32 02.4 | M4.0 | 0.187 | 0.0 | 0.18 | 0.8 | … | … | N | X | |||
| 358 | 05 35 17.78 | 06 31 44.2 | M4.7 | 0.246 | 0.1 | 0.14 | 0.37 | -2.64 | W | N | Li, Na, X | |||
| 359 | 05 35 18.26 | 06 24 30.3 | M5.7 | 0.075 | 0.0 | 0.095 | 0.50 | -2.43 | W | N | Li | |||
| 360 | 05 35 18.70 | 06 03 27.6 | M4.7 | 0.062 | 0.0 | 0.13 | 2.1 | 0.60 | -2.60 | W | N | Li | ||
| 361 | 05 35 18.68 | 05 54 06.4 | M2.2 | 0.424 | 0.0 | 0.31 | 0.8 | 0.52 | -2.74 | … | N | X | ||
| 362 | 05 35 18.87 | 04 44 27.7 | M5.3 | 0.146 | 0.0 | 0.11 | … | -1.77 | -0.78 | C | TD | Na, X, IRE | ||
| 363 | 05 35 18.95 | 06 27 25.6 | M4.0 | 0.151 | 0.5 | 0.18 | 1.2 | 0.50 | -1.15 | -0.63 | C | Y | Li, X, IRE | |
| 364 | 05 35 19.03 | 05 46 16.3 | M3.4 | 0.291 | 0.0 | 0.23 | 0.7 | 0.51, 0.54 | -2.63 | W | N | Li, Na, X | ||
| 365 | 05 35 19.10 | 04 54 07.7 | M4.7 | 0.073 | 0.0 | 0.13 | 1.7 | … | W | Y | Na, X, IRE | |||
| 366 | 05 35 19.67 | 05 35 35.7 | M5.0 | 0.070 | 0.0 | 0.11 | 1.3 | 0.41 | -1.92 | … | Y | X | ||
| 367 | 05 35 19.82 | 05 45 40.9 | M4.4 | 0.196 | 0.0 | 0.16 | 0.55, 0.45 | W | N | Li, Na, X | ||||
| 368 | 05 35 19.94 | 05 33 53.5 | M3.5 | 0.337 | 0.0 | 0.22 | … | -2.72 | … | N | X | |||
| 369 | 05 35 20.21 | 05 46 51.1 | M2.6 | 0.424 | 0.1 | 0.29 | 0.7 | 0.49 | -1.93 | -1.14 | W | TD | Li, Na, X, IRE | |
| 370 | 05 35 20.28 | 05 32 16.8 | M6.0 | 0.109 | 0.0 | 0.088 | 0.17 | -0.87 | … | Y | X, IRE | |||
| 371 | 05 35 20.29 | 05 46 40.0 | M3.5 | 0.255 | 0.0 | 0.21 | 0.8 | 0.47, 0.49 | -2.62 | … | N | Li, Na, X | ||
| 372 | 05 35 20.36 | 05 02 26.6 | M4.3 | 0.344 | 0.6 | 0.16 | 0.29 | -2.68 | W | N | Li, Na, X | |||
| 373 | 05 35 20.47 | 06 47 25.9 | M1.2 | 0.278 | 0.0 | 0.40 | 2.0 | 0.60 | -2.72 | W | N | Li | ||
| 374 | 05 35 20.50 | 06 45 40.8 | M4.7 | 0.243 | 0.0 | 0.14 | 0.20 | W | N | Li | ||||
| 375 | 05 35 20.60 | 04 46 02.4 | M4.9 | 0.090 | 0.0 | 0.12 | 0.9 | … | -2.32 | W | N | Na, X | ||
| 376 | 05 35 20.96 | 06 04 00.5 | M4.5 | 0.066 | 0.0 | 0.14 | 2.2 | 0.40, 0.25 | -1.40 | -0.94 | C | TD | Li, IRE | |
| 377 | 05 35 21.21 | 05 33 17.5 | M2.0 | 0.119 | 2.4 | 0.37 | 5.5 | 0.24 | -1.35 | … | Y | IRE | ||
| 378 | 05 35 21.77 | 06 18 51.2 | M4.7 | 0.091 | 0.0 | 0.13 | 1.2 | 0.70 | -1.74 | -1.41 | W | Y | Li, X, IRE | |
| 379 | 05 35 22.84 | 04 46 41.4 | M3.2 | 0.203 | 0.5 | 0.25 | 1.4 | 0.62 | -1.46 | -0.70 | W | Y | Li, Na, X, IRE | |
| 380 | 05 35 22.79 | 05 31 37.2 | M1.0 | 0.506 | 1.3 | 0.39 | 0.9 | 0.52 | -1.27 | -0.93 | … | Y | X, IRE | |
| 381 | 05 35 23.30 | 04 57 20.6 | M2.4 | 0.201 | 0.0 | 0.31 | 1.9 | 0.31 | W | N | Li, Na, X | |||
| 382 | 05 35 23.72 | 04 48 16.6 | M4.5 | 0.144 | 0.0 | 0.15 | 0.49 | -0.29 | -0.28 | C | Y | Li, Na, X, IRE | ||
| 383 | 05 35 23.88 | 05 51 27.9 | M4.6 | 0.075 | 0.0 | 0.14 | 1.9 | 0.56, 0.14 | -1.12 | C | Y | Li, Na, IRE | ||
| 384 | 05 35 24.40 | 06 11 14.7 | M6.0 | 0.056 | 0.0 | 0.080 | 0.6 | 0.60 | -2.65 | W | N | Li | ||
| 385 | 05 35 24.49 | 06 28 40.5 | M5.0 | 0.117 | 0.0 | 0.12 | 0.45 | -2.78 | W | N | X | |||
| 386 | 05 35 25.36 | 04 33 48.9 | M4.7 | 0.119 | 0.0 | 0.14 | 0.6 | 0.21 | -1.97 | -0.27 | W | TD | Li, Na, X, IRE | |
| 387 | 05 35 25.45 | 04 54 03.9 | M5.2 | 0.077 | 0.0 | 0.11 | 0.9 | … | W | N | Na, X | |||
| 388 | 05 35 25.68 | 04 49 31.3 | M4.7 | 0.175 | 0.1 | 0.14 | 0.45 | -0.86 | C | Y | Li, Na, X, IRE | |||
| 389 | 05 35 25.70 | 05 07 03.2 | M5.3 | 0.088 | 0.4 | 0.11 | 0.44 | … | N | Na, X | ||||
| 390 | 05 35 26.01 | 06 01 39.7 | M3.9 | 0.109 | 0.0 | 0.19 | 1.9 | 0.57 | W | N | Li, Na, X | |||
| 391 | 05 35 26.37 | 05 44 34.1 | M4.5 | 0.072 | 0.0 | 0.14 | 2.1 | 0.51 | -1.74 | -1.23 | C | Y | Li, Na, X, IRE | |
| 392 | 05 35 26.59 | 06 15 32.8 | M3.6 | 0.136 | 0.1 | 0.22 | 1.7 | 0.30 | -2.65 | W | N | Li | ||
| 393 | 05 35 26.60 | 06 16 28.3 | M2.3 | 0.141 | 0.4 | 0.33 | 3.5 | 0.40 | -2.75 | W | N | Li, Na, X | ||
| 394 | 05 35 26.80 | 06 15 34.4 | M3.5 | 0.136 | 0.1 | 0.23 | 1.8 | 0.30, 0.17 | -2.79 | W | N | Li | ||
| 395 | 05 35 26.96 | 06 27 13.0 | M4.3 | 0.044 | 0.0 | 0.15 | 3.8 | 0.40 | -2.66 | W | N | Li | ||
| 396 | 05 35 27.07 | 06 17 53.8 | M6.2 | 0.046 | 0.3 | 0.070 | 0.5 | … | -2.57 | W | N | X | ||
| 397 | 05 35 27.93 | 06 09 39.1 | M3.3 | 0.364 | 0.1 | 0.23 | 0.5 | 1.00 | -2.62 | W | N | Li | ||
| 398 | 05 35 27.98 | 04 50 38.8 | M4.9 | 0.120 | 0.0 | 0.12 | … | -2.70 | … | N | Na, X | |||
| 399 | 05 35 28.03 | 05 57 43.8 | M5.2 | 0.072 | 0.0 | 0.11 | 1.0 | … | -2.49 | … | N | Na | ||
| 400 | 05 35 28.06 | 06 21 33.2 | M5.3 | 0.066 | 0.0 | 0.10 | 1.1 | 0.50 | -1.37 | -0.98 | W | Y | Li, IRE | |
| 401 | 05 35 28.28 | 06 30 22.2 | M3.6 | 0.089 | 0.8 | 0.22 | 3.0 | 0.23 | -1.44 | -0.89 | C | Y | Li, Na, IRE | |
| 402 | 05 35 28.40 | 04 58 07.1 | M5.0 | 0.034 | 0.0 | 0.092 | 3.6 | … | W | N | Na | |||
| 403 | 05 35 28.59 | 06 30 03.8 | M4.6 | 0.067 | 0.0 | 0.13 | 2.1 | 0.50 | -1.61 | W | Y | Li, IRE | ||
| 404 | 05 35 28.78 | 05 41 34.0 | M3.4 | 0.100 | 0.1 | 0.24 | 3.0 | … | W | N | Na, X | |||
| 405 | 05 35 28.80 | 06 02 58.6 | M4.8 | 0.029 | 0.2 | 0.10 | 3.9 | 0.50, 0.15 | W | N | Li | |||
| 406 | 05 35 28.93 | 04 49 13.9 | M5.9 | 0.053 | 0.0 | 0.080 | 0.7 | … | -2.53 | … | N | Na, X | ||
| 407 | 05 35 30.44 | 06 05 00.8 | M5.5 | 0.041 | 0.3 | 0.077 | 2.2 | 0.14 | -1.09 | -0.82 | C | Y | IRE | |
| 408 | 05 35 30.42 | 05 34 38.6 | M3.8 | 0.303 | 0.4 | 0.19 | 0.43 | -2.52 | W | N | Na, X | |||
| 409 | 05 35 30.53 | 04 51 29.0 | K7.0 | 0.551 | 0.0 | 0.66 | 2.2 | … | -2.70 | … | N | X | ||
| 410 | 05 35 30.63 | 06 50 33.6 | M4.8 | 0.045 | 0.3 | 0.11 | 2.7 | 0.30 | -2.59 | W | N | Li | ||
| 411 | 05 35 31.17 | 04 26 47.9 | M4.5 | 0.081 | 0.0 | 0.14 | 1.7 | … | -2.72 | W | N | Na | ||
| 412 | 05 35 31.73 | 04 49 52.6 | M4.8 | 0.134 | 0.0 | 0.13 | … | -2.52 | … | N | Na, X | |||
| 413 | 05 35 31.89 | 06 36 25.5 | M4.7 | 0.066 | 0.9 | 0.13 | 2.0 | 0.70 | -1.23 | -0.80 | C | Y | Li, IRE | |
| 414 | 05 35 31.94 | 05 31 47.8 | M9.1 | 0.021 | 0.0 | 0.018 | … | -0.83 | … | Y | X, IRE | |||
| 415 | 05 35 32.02 | 04 55 35.7 | M4.8 | 0.068 | 0.0 | 0.12 | 1.8 | … | … | N | Na, X | |||
| 416 | 05 35 32.70 | 06 30 18.2 | M2.8 | 0.158 | 0.0 | 0.28 | 2.2 | 0.45 | -2.74 | W | N | Li, Na, X | ||
| 417 | 05 35 33.04 | 06 27 29.1 | M4.5 | 0.031 | 0.4 | 0.12 | 4.7 | 1.00 | -2.91 | W | N | Li | ||
| 418 | 05 35 33.46 | 04 56 01.8 | M5.0 | 0.151 | 0.0 | 0.12 | 0.18 | W | N | Li, Na, X | ||||
| 419 | 05 35 33.55 | 04 24 56.6 | M4.5 | 0.079 | 0.0 | 0.15 | 1.9 | 0.43 | -2.80 | W | N | Li, Na | ||
| 420 | 05 35 33.57 | 06 02 20.3 | M3.7 | 0.307 | 0.0 | 0.20 | 0.40, 0.52 | -2.75 | W | N | Li, X | |||
| 421 | 05 35 33.59 | 04 47 32.8 | M5.4 | 0.054 | 0.0 | 0.089 | 2.0 | … | W | N | Na, X | |||
| 422 | 05 35 33.61 | 05 28 50.6 | M5.0 | 0.309 | 0.0 | 0.12 | 0.44 | … | N | X | ||||
| 423 | 05 35 33.85 | 05 38 20.7 | M3.5 | 0.120 | 0.0 | 0.23 | 2.2 | … | … | N | X | |||
| 424 | 05 35 33.93 | 06 14 32.8 | M5.0 | 0.181 | 0.0 | 0.12 | 0.70, 0.12 | -1.06 | -0.75 | C | Y | Li, IRE | ||
| 425 | 05 35 34.38 | 06 05 42.7 | M3.3 | 0.585 | 0.5 | 0.23 | 0.25 | -2.70 | W | N | Li, Na, X | |||
| 426 | 05 35 34.55 | 04 38 05.8 | M4.0 | 0.087 | 0.5 | 0.18 | 2.3 | 0.59 | -1.85 | -1.20 | W | Y | Li, Na, IRE | |
| 427 | 05 35 35.25 | 06 48 41.9 | M4.5 | 0.081 | 0.0 | 0.14 | 1.7 | 0.50 | -2.75 | W | N | Li | ||
| 428 | 05 35 35.22 | 05 26 55.1 | M2.5 | 0.379 | 0.8 | 0.30 | 0.9 | 0.57 | … | N | X | |||
| 429 | 05 35 35.32 | 04 44 20.3 | M5.4 | 0.055 | 0.0 | 0.090 | 2.0 | … | -1.68 | C | Y | Na, IRE | ||
| 430 | 05 35 35.54 | 04 25 23.2 | M4.6 | 0.092 | 0.5 | 0.14 | 1.3 | … | -1.78 | -1.22 | W | Y | Na, IRE | |
| 431 | 05 35 35.55 | 05 06 58.6 | M3.2 | 0.119 | 0.0 | 0.26 | 2.7 | 0.29 | W | N | Li, Na, X | |||
| 432 | 05 35 35.95 | 05 38 42.7 | M4.0 | 0.166 | 0.0 | 0.18 | 1.0 | 0.40 | -1.68 | -0.85 | … | Y | X, IRE | |
| 433 | 05 35 36.11 | 05 56 53.3 | M4.8 | 0.166 | 0.0 | 0.13 | 0.42, 0.47 | -2.73 | W | N | Li, Na, X | |||
| 434 | 05 35 37.23 | 04 46 59.4 | M5.8 | 0.086 | 0.0 | 0.092 | … | -2.55 | … | N | Na, X | |||
| 435 | 05 35 37.34 | 06 21 19.2 | M4.7 | 0.127 | 0.0 | 0.14 | 0.50 | -1.26 | -1.21 | W | Y | Li, X, IRE | ||
| 436 | 05 35 37.94 | 04 26 08.7 | M4.4 | 0.091 | 0.0 | 0.15 | 1.6 | … | -1.94 | -1.29 | W | TD | Na, IRE | |
| 437 | 05 35 38.01 | 04 52 29.6 | M4.4 | 0.113 | 1.4 | 0.15 | 1.1 | … | -1.36 | C | Y | Na, IRE | ||
| 438 | 05 35 38.03 | 05 28 21.6 | M3.5 | 0.337 | 0.0 | 0.21 | 0.42, 0.54 | -1.71 | … | Y | Li, X, IRE | |||
| 439 | 05 35 38.44 | 05 52 45.7 | M5.8 | 0.033 | 0.0 | 0.066 | 1.5 | … | -1.29 | -1.00 | C | Y | Na, IRE | |
| 440 | 05 35 38.92 | 04 41 33.8 | M4.5 | 0.056 | 0.0 | 0.14 | 2.7 | … | … | N | Na | |||
| 441 | 05 35 39.03 | 05 07 04.3 | M3.7 | 0.241 | 0.0 | 0.20 | 0.7 | 0.23 | -2.53 | W | N | Li, Na, X | ||
| 442 | 05 35 39.14 | 05 58 06.6 | M5.3 | 0.071 | 0.0 | 0.10 | 0.8 | … | -1.59 | -1.00 | C | Y | Na, IRE | |
| 443 | 05 35 39.95 | 04 21 02.2 | M4.1 | 0.083 | 0.1 | 0.17 | 2.2 | … | -1.48 | -1.07 | C | Y | Na, IRE | |
| 444 | 05 35 40.46 | 04 31 10.1 | M5.7 | 0.056 | 0.0 | 0.085 | 0.9 | … | -2.57 | W | N | Na | ||
| 445 | 05 35 40.74 | 04 35 30.3 | M4.6 | 0.067 | 0.0 | 0.13 | 2.0 | … | W | N | Na | |||
| 446 | 05 35 40.77 | 05 11 11.9 | M5.2 | 0.082 | 0.4 | 0.11 | 0.6 | 0.47, 0.26 | -1.27 | C | Y | Li, Na, X, IRE | ||
| 447 | 05 35 41.14 | 05 42 51.1 | M4.7 | 0.062 | 0.0 | 0.13 | 2.2 | 0.51 | … | N | Li, Na, X | |||
| 448 | 05 35 41.73 | 05 03 29.1 | M4.9 | 0.103 | 0.3 | 0.12 | 0.51 | W | N | Li, Na, X | ||||
| 449 | 05 35 41.78 | 04 50 27.8 | M4.7 | 0.110 | 0.0 | 0.14 | 0.7 | 0.52 | -2.70 | … | N | Li, Na, X | ||
| 450 | 05 35 41.86 | 05 52 29.6 | M4.7 | 0.151 | 0.0 | 0.14 | 0.34 | -2.59 | W | N | Li, Na, X | |||
| 451 | 05 35 42.20 | 06 15 14.4 | M4.4 | 0.071 | 0.4 | 0.15 | 2.2 | 0.20, 0.34 | -2.52 | W | N | Li, X | ||
| 452 | 05 35 42.21 | 06 11 43.8 | M5.4 | 0.041 | 0.1 | 0.082 | 2.6 | 0.80 | -1.12 | -0.44 | C | TD | Li, IRE | |
| 453 | 05 35 42.72 | 04 05 52.0 | M5.3 | 0.058 | 0.0 | 0.095 | 1.5 | 0.44 | -2.61 | W | N | Li, Na | ||
| 454 | 05 35 43.06 | 05 03 07.5 | M4.6 | 0.120 | 0.4 | 0.14 | 0.7 | 0.21, 0.31 | -1.45 | -0.71 | C | Y | Li, Na, X, IRE | |
| 455 | 05 35 43.80 | 05 09 58.8 | M5.5 | 0.081 | 0.0 | 0.10 | 0.68, 0.30 | -0.77 | C | Y | Li, Na, X, IRE | |||
| 456 | 05 35 44.20 | 05 50 04.7 | M3.7 | 0.123 | 0.0 | 0.21 | 1.8 | 0.43 | -2.62 | W | N | Li, Na, X | ||
| 457 | 05 35 44.37 | 04 57 16.9 | M5.6 | 0.131 | 0.0 | 0.097 | … | W | N | Na, X | ||||
| 458 | 05 35 44.72 | 04 30 02.0 | M5.2 | 0.044 | 0.1 | 0.089 | 2.9 | … | -2.45 | W | N | Na | ||
| 459 | 05 35 45.31 | 04 23 32.1 | M4.8 | 0.037 | 0.3 | 0.11 | 3.1 | … | -2.83 | W | N | Na | ||
| 460 | 05 35 45.88 | 06 05 38.8 | M2.8 | 0.266 | 0.0 | 0.28 | 1.2 | 0.30, 0.50 | -2.28 | W | N | Li | ||
| 461 | 05 35 46.82 | 04 18 32.8 | M2.1 | 0.357 | 0.0 | 0.33 | 1.0 | 0.37 | -2.71 | W | N | Li, Na | ||
| 462 | 05 35 47.69 | 05 58 06.1 | M4.9 | 0.079 | 0.0 | 0.12 | 1.2 | 0.36, 0.23 | -2.61 | W | N | Li, Na, X | ||
| 463 | 05 35 48.28 | 06 17 59.4 | M2.9 | 0.200 | 0.1 | 0.28 | 1.6 | 0.70, 0.52 | -2.73 | W | N | Li, X | ||
| 464 | 05 35 48.39 | 06 17 36.2 | M4.2 | 0.149 | 0.0 | 0.17 | 0.9 | 0.50, 0.47 | -2.73 | W | N | Li, X | ||
| 465 | 05 35 48.44 | 04 17 06.1 | M4.6 | 0.144 | 0.0 | 0.15 | 0.41 | -2.69 | W | N | Li, Na | |||
| 466 | 05 35 48.60 | 06 05 25.7 | M4.7 | 0.103 | 0.0 | 0.13 | 0.9 | 0.53 | -2.01 | W | Y | Li, Na | ||
| 467 | 05 35 48.78 | 06 09 07.2 | M3.3 | 0.121 | 0.0 | 0.25 | 2.5 | 0.50, 0.34 | -2.75 | W | N | Li | ||
| 468 | 05 35 48.98 | 05 01 39.4 | M2.8 | 0.243 | 0.0 | 0.28 | 1.3 | 0.52, 0.60 | -1.45 | -1.20 | C | Y | Li, Na, X, IRE | |
| 469 | 05 35 49.03 | 04 53 49.9 | M4.9 | 0.036 | 0.0 | 0.10 | 3.1 | … | C | Y | Na, IRE | |||
| 470 | 05 35 49.16 | 05 56 18.3 | M4.5 | 0.081 | 0.0 | 0.14 | 1.7 | 0.20 | -2.58 | W | N | Na, X | ||
| 471 | 05 35 49.24 | 05 59 14.2 | M4.2 | 0.084 | 0.0 | 0.17 | 2.1 | 0.20 | -2.04 | W | N | Na, X | ||
| 472 | 05 35 50.25 | 06 33 35.6 | M4.5 | 0.149 | 0.0 | 0.15 | 0.50 | -2.61 | W | N | Li | |||
| 473 | 05 35 50.96 | 06 22 43.6 | M1.1 | 0.246 | 0.0 | 0.42 | 2.6 | 0.42 | 0.32 | 0.13 | W | Y | Li, Na, X, IRE | |
| 474 | 05 35 51.32 | 06 13 53.3 | M4.9 | 0.122 | 0.1 | 0.12 | 0.46 | -1.11 | -0.92 | W | Y | Li, Na, X, IRE | ||
| 475 | 05 35 52.98 | 04 17 39.7 | M5.1 | 0.064 | 0.0 | 0.11 | 1.4 | … | -2.59 | W | N | Na | ||
| 476 | 05 35 53.08 | 05 59 48.0 | M3.4 | 0.124 | 0.0 | 0.24 | 2.3 | 0.18 | -2.75 | W | N | Li, Na, X | ||
| 477 | 05 35 53.70 | 06 30 54.7 | M5.2 | 0.029 | 0.6 | 0.084 | 3.8 | 0.21 | -1.65 | -0.62 | C | TD | IRE | |
| 478 | 05 35 54.21 | 05 05 45.5 | M4.2 | 0.091 | 0.0 | 0.17 | 1.9 | … | -2.56 | W | N | Na, X | ||
| 479 | 05 35 54.68 | 05 54 36.7 | M5.2 | 0.083 | 0.0 | 0.11 | 0.6 | 0.56 | … | N | Li, Na | |||
| 480 | 05 35 55.13 | 06 10 09.4 | M1.7 | 0.290 | 2.0 | 0.35 | 1.5 | 0.23 | -2.70 | W | N | Li, Na, X | ||
| 481 | 05 35 55.44 | 05 23 43.0 | M5.0 | 0.116 | 0.0 | 0.12 | … | … | N | X | ||||
| 482 | 05 35 56.18 | 05 52 28.5 | M3.1 | 0.208 | 0.0 | 0.25 | 1.4 | 0.28 | -2.62 | W | N | Li, Na, X | ||
| 483 | 05 35 56.41 | 04 11 28.4 | M4.4 | 0.111 | 0.0 | 0.16 | 1.2 | 0.17 | -2.62 | W | N | Li, Na | ||
| 484 | 05 35 56.45 | 04 36 50.7 | M4.3 | 0.083 | 0.0 | 0.16 | 2.0 | 0.31 | -2.28 | W | N | Li, Na, X | ||
| 485 | 05 35 58.33 | 06 22 39.4 | M5.5 | 0.031 | 0.0 | 0.074 | 3.3 | 0.34 | -3.02 | W | N | X | ||
| 486 | 05 35 58.81 | 06 12 43.8 | M3.9 | 0.075 | 0.0 | 0.19 | 3.0 | 0.40 | W | N | Li | |||
| 487 | 05 35 58.97 | 05 59 08.5 | M3.0 | 0.166 | 0.0 | 0.27 | 1.9 | 0.57 | -2.75 | W | N | Li, Na, X | ||
| 488 | 05 35 59.23 | 06 49 51.9 | M3.1 | 0.174 | 0.4 | 0.26 | 1.7 | 0.50 | -2.77 | W | N | Li | ||
| 489 | 05 36 00.28 | 06 23 47.3 | M2.1 | 0.194 | 0.8 | 0.34 | 2.4 | 0.26, 0.51 | -2.80 | W | N | Li, Na, X | ||
| 490 | 05 36 01.09 | 06 25 07.7 | M3.7 | 0.159 | 0.0 | 0.20 | 1.4 | 0.40, 0.52 | -1.65 | -1.13 | W | TD | Li, IRE | |
| 491 | 05 36 01.39 | 05 19 10.7 | M4.9 | 0.124 | 0.0 | 0.12 | 0.27 | W | N | Li, Na | ||||
| 492 | 05 36 01.41 | 06 44 14.6 | M4.6 | 0.134 | 0.0 | 0.14 | 0.30 | -2.68 | W | N | Li | |||
| 493 | 05 36 01.66 | 06 42 36.2 | M5.7 | 0.107 | 0.2 | 0.095 | 0.40 | -1.47 | -1.42 | C | Y | Li, IRE | ||
| 494 | 05 36 02.04 | 04 30 43.0 | M4.0 | 0.089 | 0.0 | 0.18 | 2.2 | 0.73 | -2.48 | W | N | Li, Na, X | ||
| 495 | 05 36 02.64 | 05 07 36.5 | K8.8 | 0.849 | 0.0 | 0.56 | 0.9 | 0.59 | -2.71 | W | N | Li, X | ||
| 496 | 05 36 02.83 | 05 32 54.4 | M6.0 | 0.071 | 0.0 | 0.088 | 0.5 | … | -1.72 | C | Y | Na, IRE | ||
| 497 | 05 36 03.24 | 05 44 32.9 | M6.3 | 0.033 | 0.0 | 0.059 | 0.7 | … | C | Y | Na, IRE | |||
| 498 | 05 36 03.62 | 04 14 17.8 | M4.1 | 0.297 | 0.0 | 0.17 | 0.26 | -1.96 | -1.06 | W | TD | Li, Na, IRE | ||
| 499 | 05 36 05.16 | 06 25 25.4 | K6.9 | 0.652 | 0.5 | 0.64 | 1.7 | 0.43, 0.62 | -2.65 | -1.81 | C | DB | Li, X, IRE | |
| 500 | 05 36 05.65 | 05 52 13.1 | M3.8 | 0.171 | 0.0 | 0.19 | 1.2 | 0.60 | -2.55 | W | N | Li, Na, X | ||
| 501 | 05 36 05.93 | 05 52 54.9 | M5.4 | 0.051 | 0.0 | 0.086 | 2.0 | … | -1.98 | … | Y | Na, IRE | ||
| 502 | 05 36 06.59 | 06 31 43.0 | M3.3 | 0.119 | 0.0 | 0.25 | 2.5 | 0.22, 0.52 | -1.20 | -0.56 | W | TD | Li, Na, X, IRE | |
| 503 | 05 36 06.80 | 05 06 15.6 | M2.8 | 0.164 | 0.1 | 0.28 | 2.1 | 0.35 | -1.55 | -1.19 | W | Y | Li, Na, X, IRE | |
| 504 | 05 36 07.21 | 04 17 00.1 | M3.6 | 0.210 | 0.0 | 0.21 | 1.1 | 0.44 | -2.73 | W | N | Li, Na | ||
| 505 | 05 36 08.40 | 04 28 52.6 | M4.3 | 0.274 | 0.3 | 0.16 | … | -2.00 | -1.36 | W | TD | Na, IRE | ||
| 506 | 05 36 08.69 | 05 21 02.2 | M4.0 | 0.307 | 0.0 | 0.18 | 0.67 | … | N | X | ||||
| 507 | 05 36 08.87 | 04 07 20.0 | M3.7 | 0.213 | 0.0 | 0.20 | 1.0 | … | -2.75 | W | N | Na | ||
| 508 | 05 36 09.28 | 04 50 00.8 | M3.9 | 0.184 | 0.0 | 0.18 | 0.9 | 0.33 | -1.42 | -1.01 | C | Y | Li, Na, IRE | |
| 509 | 05 36 09.35 | 06 17 10.8 | M2.1 | 0.425 | 0.1 | 0.32 | 0.8 | 0.50, 0.62 | -2.68 | W | N | Li, X | ||
| 510 | 05 36 09.49 | 06 18 36.3 | M1.3 | 0.548 | 0.0 | 0.37 | 0.8 | 0.50, 0.55 | -2.64 | W | N | Li, X | ||
| 511 | 05 36 09.94 | 04 26 56.7 | M4.4 | 0.072 | 0.0 | 0.15 | 2.2 | … | -2.62 | W | N | Na | ||
| 512 | 05 36 09.98 | 05 05 35.4 | M5.2 | 0.045 | 0.3 | 0.092 | 2.7 | … | -2.05 | W | N | Na, X | ||
| 513 | 05 36 09.98 | 05 57 20.2 | M5.0 | 0.051 | 0.0 | 0.10 | 2.2 | … | -2.83 | … | N | Na | ||
| 514 | 05 36 10.87 | 06 33 47.5 | M2.6 | 0.510 | 0.0 | 0.28 | 0.6 | 0.46 | -2.68 | W | N | Li, Na, X | ||
| 515 | 05 36 10.94 | 04 25 37.1 | M5.0 | 0.042 | 0.0 | 0.098 | 2.7 | … | -2.54 | W | N | Na | ||
| 516 | 05 36 11.11 | 06 18 14.1 | M6.0 | 0.032 | 0.2 | 0.061 | 0.9 | 0.80 | -2.81 | W | N | Li | ||
| 517 | 05 36 11.31 | 06 16 56.0 | M5.8 | 0.058 | 0.1 | 0.084 | 0.8 | 0.19 | -1.59 | -0.81 | W | Y | IRE | |
| 518 | 05 36 11.67 | 06 24 58.4 | M4.9 | 0.033 | 0.6 | 0.098 | 3.4 | 0.40, 0.18 | -1.21 | 0.06 | W | TD | Li, IRE | |
| 519 | 05 36 11.80 | 05 00 32.6 | M3.6 | 0.327 | 0.0 | 0.21 | 0.44 | -2.71 | W | N | Li, Na, X | |||
| 520 | 05 36 12.97 | 05 55 27.0 | M2.8 | 0.155 | 0.0 | 0.29 | 2.4 | … | -2.50 | W | N | Na, X | ||
| 521 | 05 36 13.38 | 05 02 23.0 | M5.1 | 0.097 | 0.0 | 0.11 | 0.44 | -1.50 | -0.88 | C | TD | Li, Na, X, IRE | ||
| 522 | 05 36 13.75 | 06 02 46.0 | M4.5 | 0.052 | 0.3 | 0.14 | 2.8 | 0.30 | -2.61 | W | N | Li | ||
| 523 | 05 36 14.57 | 05 33 23.8 | M4.8 | 0.067 | 0.0 | 0.12 | 1.8 | 0.60 | -2.04 | W | N | Li, Na | ||
| 524 | 05 36 15.42 | 04 20 50.2 | M5.2 | 0.045 | 0.0 | 0.090 | 2.8 | … | -2.62 | W | N | Na | ||
| 525 | 05 36 15.57 | 06 00 50.5 | M5.4 | 0.060 | 0.1 | 0.095 | 1.3 | … | -1.34 | -0.86 | C | Y | IRE | |
| 526 | 05 36 15.84 | 06 14 50.7 | M2.6 | 0.165 | 0.0 | 0.30 | 2.4 | 0.50, 0.45 | -1.51 | -0.30 | C | TD | Li, X, IRE | |
| 527 | 05 36 16.50 | 05 22 41.3 | M4.9 | 0.030 | 0.0 | 0.095 | 3.9 | … | W | N | Na | |||
| 528 | 05 36 17.23 | 06 17 24.5 | M4.6 | 0.335 | 0.4 | 0.14 | 0.30, 0.50 | -1.58 | -0.71 | C | TD | Li, X, IRE | ||
| 529 | 05 36 17.68 | 05 44 04.9 | M5.2 | 0.040 | 0.0 | 0.090 | 3.2 | … | … | N | Na | |||
| 530 | 05 36 18.01 | 06 10 02.8 | M1.9 | 0.118 | 0.7 | 0.38 | 6.0 | 0.39 | -2.73 | W | N | Li, Na, X | ||
| 531 | 05 36 18.48 | 06 20 38.7 | M0.5 | 0.401 | 0.3 | 0.45 | 1.6 | 0.50 | -1.39 | -1.02 | C | Y | Li, X, IRE | |
| 532 | 05 36 18.57 | 05 54 28.5 | M5.3 | 0.107 | 0.3 | 0.11 | … | -2.85 | … | N | Na | |||
| 533 | 05 36 18.67 | 06 31 25.6 | M4.9 | 0.182 | 0.0 | 0.13 | 0.50, 0.54 | -2.70 | W | N | Li | |||
| 534 | 05 36 18.79 | 05 12 18.3 | M4.6 | 0.152 | 0.1 | 0.14 | 0.27 | -2.63 | W | N | Li, Na, X | |||
| 535 | 05 36 18.79 | 05 10 16.6 | M4.8 | 0.053 | 0.1 | 0.12 | 2.4 | … | -2.41 | W | N | Na | ||
| 536 | 05 36 18.99 | 04 53 50.4 | M5.0 | 0.105 | 0.0 | 0.12 | 0.72 | -2.18 | W | Y | Li, Na | |||
| 537 | 05 36 19.09 | 06 22 50.6 | M8.0 | 0.025 | 0.1 | 0.058 | 2.0 | … | W | N | X | |||
| 538 | 05 36 19.26 | 05 31 08.3 | M5.1 | 0.041 | 0.0 | 0.092 | 3.1 | 0.49 | W | N | Li | |||
| 539 | 05 36 19.26 | 05 00 28.4 | M5.5 | 0.077 | 0.1 | 0.098 | 0.30 | -2.63 | W | N | Li, Na, X | |||
| 540 | 05 36 19.35 | 04 39 44.4 | M5.2 | 0.048 | 0.0 | 0.091 | 2.5 | … | -1.98 | W | Y | Na, IRE | ||
| 541 | 05 36 19.89 | 05 56 08.3 | M4.5 | 0.096 | 0.0 | 0.15 | 1.4 | … | -2.75 | … | N | Na, X | ||
| 542 | 05 36 20.00 | 04 21 15.1 | M3.9 | 0.126 | 0.0 | 0.19 | 1.6 | 0.24 | -2.67 | W | N | Li, Na | ||
| 543 | 05 36 20.50 | 05 40 57.1 | M5.1 | 0.042 | 0.0 | 0.094 | 2.9 | … | -2.13 | … | N | Na | ||
| 544 | 05 36 21.16 | 06 26 56.9 | M4.5 | 0.035 | 0.2 | 0.13 | 4.1 | … | -1.47 | W | Y | IRE | ||
| 545 | 05 36 21.96 | 06 41 42.0 | M5.1 | 0.162 | 0.0 | 0.12 | 0.40 | -1.43 | -0.95 | W | Y | Li, IRE | ||
| 546 | 05 36 22.27 | 05 55 47.6 | M4.0 | 0.075 | 0.3 | 0.18 | 2.8 | 0.62 | -1.19 | -1.11 | C | Y | Li, Na, IRE | |
| 547 | 05 36 22.87 | 04 18 48.5 | M5.4 | 0.068 | 0.0 | 0.099 | 0.9 | 0.57 | -2.58 | W | N | Li, Na | ||
| 548 | 05 36 23.05 | 05 51 54.9 | M4.3 | 0.085 | 0.0 | 0.16 | 1.9 | 0.30 | -2.44 | … | N | Li, Na | ||
| 549 | 05 36 23.26 | 06 19 37.5 | M3.2 | 0.135 | 0.1 | 0.26 | 2.3 | 0.40, 0.52 | -2.77 | W | N | Li, X | ||
| 550 | 05 36 23.69 | 04 36 17.1 | M4.8 | 0.048 | 0.0 | 0.11 | 2.5 | … | -1.69 | -0.50 | … | TD | IRE | |
| 551 | 05 36 23.69 | 04 06 15.8 | K9.7 | 0.609 | 0.5 | 0.50 | 1.1 | 0.18 | -2.73 | W | N | Li | ||
| 552 | 05 36 23.76 | 05 11 18.1 | M5.5 | 0.050 | 0.0 | 0.085 | 1.9 | … | -2.30 | W | N | Na | ||
| 553 | 05 36 23.95 | 06 45 23.7 | M4.9 | 0.122 | 0.2 | 0.13 | 0.30 | -2.87 | W | N | Li | |||
| 554 | 05 36 24.11 | 05 08 13.7 | M4.3 | 0.086 | 0.0 | 0.16 | 2.0 | 0.31 | -2.79 | W | N | Li, Na | ||
| 555 | 05 36 24.14 | 06 31 49.5 | M3.1 | 0.116 | 0.5 | 0.27 | 3.1 | 0.36, 0.51 | -2.73 | W | N | Li, Na, X | ||
| 556 | 05 36 24.16 | 05 58 26.3 | M5.2 | 0.043 | 0.0 | 0.092 | 2.9 | … | -2.75 | … | N | Na | ||
| 557 | 05 36 24.42 | 05 06 03.0 | M5.1 | 0.057 | 0.3 | 0.10 | 1.8 | … | -2.64 | W | N | Na | ||
| 558 | 05 36 24.72 | 06 05 13.3 | M1.0 | 0.227 | 1.5 | 0.44 | 3.1 | 0.23 | -1.55 | -1.46 | C | Y | Li, IRE | |
| 559 | 05 36 25.01 | 05 23 32.2 | M3.0 | 0.193 | 2.8 | 0.27 | 1.6 | … | -2.75 | W | N | Na | ||
| 560 | 05 36 25.28 | 06 23 07.2 | M7.0 | 0.027 | 0.0 | 0.048 | 0.6 | 0.90, 0.25 | W | N | Li, X | |||
| 561 | 05 36 25.41 | 06 24 31.2 | M5.7 | 0.061 | 0.3 | 0.089 | 0.8 | 0.60 | -2.54 | W | N | Li, X | ||
| 562 | 05 36 25.55 | 06 51 28.3 | M4.9 | 0.093 | 0.2 | 0.13 | 0.8 | 0.43 | -2.61 | W | N | Li, Na | ||
| 563 | 05 36 25.57 | 05 18 42.0 | M5.3 | 0.111 | 0.0 | 0.11 | 0.27 | W | N | Li, Na | ||||
| 564 | 05 36 25.64 | 04 21 58.6 | M4.4 | 0.221 | 0.0 | 0.16 | 0.47 | -2.62 | W | N | Li, Na | |||
| 565 | 05 36 26.35 | 06 48 43.6 | M5.8 | 0.087 | 0.2 | 0.093 | 0.30 | -2.37 | W | N | Li | |||
| 566 | 05 36 26.47 | 06 06 16.3 | M4.5 | 0.082 | 0.3 | 0.14 | 1.7 | 0.30 | -2.89 | W | N | Li | ||
| 567 | 05 36 27.89 | 06 25 36.0 | M4.3 | 0.159 | 0.0 | 0.16 | 0.6 | 0.30 | -1.91 | -0.37 | W | TD | Li, X, IRE | |
| 568 | 05 36 27.90 | 04 58 06.8 | M4.4 | 0.071 | 0.0 | 0.15 | 2.2 | 0.69 | W | N | Li, Na | |||
| 569 | 05 36 28.74 | 05 42 26.3 | M5.0 | 0.167 | 0.6 | 0.12 | 0.13 | -2.80 | W | N | Li, Na | |||
| 570 | 05 36 29.28 | 04 53 51.0 | M3.7 | 0.216 | 0.1 | 0.20 | 0.9 | 0.35 | -2.13 | -1.65 | W | Y | Li, Na, IRE | |
| 571 | 05 36 29.30 | 04 43 59.9 | M4.6 | 0.085 | 0.0 | 0.14 | 1.5 | … | -2.05 | -0.72 | W | TD | Na, IRE | |
| 572 | 05 36 29.40 | 06 15 44.8 | M4.4 | 0.119 | 0.0 | 0.15 | 1.1 | 0.20 | -2.71 | W | N | Li, X | ||
| 573 | 05 36 29.81 | 06 14 19.7 | M5.5 | 0.065 | 0.0 | 0.096 | 0.9 | 0.50 | -2.76 | W | N | Li, X | ||
| 574 | 05 36 29.90 | 06 38 22.3 | M1.3 | 0.281 | 0.0 | 0.39 | 1.9 | 0.37 | -2.84 | W | N | Li, Na, X | ||
| 575 | 05 36 30.17 | 05 53 09.9 | M4.9 | 0.158 | 0.0 | 0.12 | 0.56 | -2.70 | … | N | Li, Na | |||
| 576 | 05 36 30.48 | 06 30 06.9 | M4.4 | 0.045 | 0.0 | 0.14 | 3.5 | 0.40 | -2.68 | W | N | Li | ||
| 577 | 05 36 30.50 | 06 23 56.6 | M4.5 | 0.030 | 1.2 | 0.12 | 4.8 | … | -1.70 | C | Y | X, IRE | ||
| 578 | 05 36 30.52 | 06 42 03.2 | M6.0 | 0.019 | 0.0 | 0.056 | 4.0 | 0.60 | -3.01 | W | N | Li | ||
| 579 | 05 36 31.02 | 05 01 02.7 | M4.2 | 0.090 | 0.0 | 0.17 | 1.9 | … | W | N | Na | |||
| 580 | 05 36 31.84 | 06 23 23.1 | M5.3 | 0.026 | 0.3 | 0.079 | 4.0 | … | -1.33 | -0.75 | C | Y | IRE | |
| 581 | 05 36 32.42 | 06 40 43.0 | M4.9 | 0.103 | 0.0 | 0.12 | 0.66 | -1.25 | -0.89 | C | Y | Li, Na, IRE | ||
| 582 | 05 36 32.86 | 06 00 50.2 | M4.5 | 0.058 | 0.3 | 0.14 | 2.5 | 0.50 | -2.65 | W | N | Li | ||
| 583 | 05 36 32.87 | 06 12 37.5 | M1.7 | 0.444 | 0.0 | 0.34 | 0.9 | 0.44 | -2.70 | W | N | Li, Na, X | ||
| 584 | 05 36 32.99 | 06 02 29.8 | M3.4 | 0.114 | 0.2 | 0.24 | 2.5 | 0.40 | -2.58 | W | N | Li | ||
| 585 | 05 36 33.01 | 06 00 16.6 | M4.9 | 0.088 | 0.0 | 0.12 | 1.1 | … | -2.29 | … | N | Na | ||
| 586 | 05 36 33.36 | 05 45 35.5 | M4.9 | 0.060 | 0.0 | 0.11 | 2.0 | … | -2.55 | W | N | Na | ||
| 587 | 05 36 33.81 | 06 19 27.0 | M2.4 | 0.157 | 1.4 | 0.31 | 2.7 | 0.40, 0.43 | -2.76 | W | N | Li, Na, X | ||
| 588 | 05 36 33.81 | 04 24 03.7 | M3.5 | 0.132 | 0.0 | 0.23 | 2.0 | 0.34 | -2.69 | W | N | Li, Na | ||
| 589 | 05 36 34.37 | 05 40 54.8 | M5.8 | 0.119 | 0.3 | 0.093 | … | -2.66 | W | N | Na | |||
| 590 | 05 36 35.23 | 06 50 12.2 | M6.0 | 0.042 | 0.0 | 0.069 | 0.7 | 0.50 | -2.64 | W | N | Li | ||
| 591 | 05 36 35.42 | 06 17 36.5 | M4.4 | 0.042 | 0.1 | 0.14 | 3.8 | 1.20, 0.39 | -2.62 | W | N | Li | ||
| 592 | 05 36 37.35 | 05 24 43.5 | M4.1 | 0.130 | 0.0 | 0.17 | 1.3 | 0.40 | -2.17 | W | N | Li, Na | ||
| 593 | 05 36 37.39 | 05 10 22.1 | M5.0 | 0.106 | 0.0 | 0.12 | 0.44 | -2.54 | W | N | Li, Na | |||
| 594 | 05 36 37.49 | 06 16 07.7 | M5.7 | 0.035 | 0.2 | 0.069 | 1.7 | 0.13 | -2.69 | W | N | X | ||
| 595 | 05 36 37.51 | 06 27 17.3 | M2.1 | 0.132 | 1.7 | 0.35 | 4.2 | 0.26, 0.32 | -1.82 | -1.59 | W | Y | Li, Na, IRE | |
| 596 | 05 36 37.61 | 05 31 19.0 | M5.1 | 0.061 | 0.0 | 0.10 | 1.5 | … | … | N | Na | |||
| 597 | 05 36 37.99 | 04 22 17.9 | M4.9 | 0.052 | 0.0 | 0.11 | 2.3 | 0.25 | -2.67 | W | N | Li, Na | ||
| 598 | 05 36 38.03 | 06 24 25.2 | M4.1 | 0.073 | 0.0 | 0.18 | 2.7 | 0.48, 0.47 | -2.66 | W | N | Li, Na, X | ||
| 599 | 05 36 39.58 | 04 38 01.5 | M5.4 | 0.040 | 0.0 | 0.082 | 2.9 | 0.52 | W | N | Li, Na | |||
| 600 | 05 36 40.18 | 05 07 29.2 | M5.3 | 0.070 | 0.0 | 0.10 | 1.0 | 0.32 | -2.98 | W | N | Li, Na | ||
| 601 | 05 36 40.69 | 06 52 04.5 | M1.0 | 0.374 | 0.6 | 0.41 | 1.4 | 0.41 | -2.72 | W | N | Li, Na, X | ||
| 602 | 05 36 40.78 | 04 21 20.2 | M3.3 | 0.285 | 0.0 | 0.24 | 0.9 | 0.44 | -2.70 | W | N | Li, Na | ||
| 603 | 05 36 40.94 | 04 20 44.3 | M3.3 | 0.170 | 0.0 | 0.24 | 1.6 | 0.26 | -2.71 | W | N | Li, Na | ||
| 604 | 05 36 41.67 | 06 11 46.5 | M4.6 | 0.088 | 0.0 | 0.14 | 1.4 | 0.40 | -2.74 | W | N | Li, X | ||
| 605 | 05 36 42.04 | 06 07 06.1 | M3.3 | 0.339 | 0.3 | 0.23 | 0.6 | 0.50 | -2.61 | W | N | Li | ||
| 606 | 05 36 42.80 | 05 27 34.4 | M4.2 | 0.119 | 0.0 | 0.17 | 1.4 | 0.23 | … | N | Li, Na | |||
| 607 | 05 36 43.17 | 06 16 57.2 | M5.4 | 0.020 | 0.6 | 0.073 | 4.6 | 0.60 | -3.06 | W | N | Li | ||
| 608 | 05 36 43.98 | 05 58 31.8 | M3.8 | 0.407 | 0.0 | 0.20 | 0.47 | -2.68 | … | N | Li, Na | |||
| 609 | 05 36 44.56 | 06 02 09.1 | M4.8 | 0.102 | 0.1 | 0.13 | 0.7 | 0.50 | -2.86 | W | N | Li | ||
| 610 | 05 36 44.94 | 06 16 04.6 | M4.5 | 0.063 | 0.2 | 0.14 | 2.3 | 0.60 | -2.43 | W | N | Li, X | ||
| 611 | 05 36 44.95 | 06 04 35.3 | M4.3 | 0.075 | 0.0 | 0.16 | 2.2 | 0.40 | -2.80 | W | N | Li | ||
| 612 | 05 36 45.21 | 06 28 09.6 | M3.4 | 0.375 | 0.3 | 0.23 | 0.45, 0.55 | -2.68 | W | N | Li, Na, X | |||
| 613 | 05 36 46.69 | 06 07 22.3 | M2.2 | 0.419 | 0.0 | 0.31 | 0.8 | 0.50 | -2.64 | W | N | Li | ||
| 614 | 05 36 47.27 | 05 57 31.0 | M3.2 | 0.176 | 0.0 | 0.25 | 1.7 | 0.25 | -2.38 | … | N | Li, Na | ||
| 615 | 05 36 47.54 | 06 08 20.3 | M1.8 | 0.173 | 0.3 | 0.37 | 3.2 | 0.25 | -2.77 | -0.47 | C | TD | Li, Na, IRE | |
| 616 | 05 36 48.16 | 05 40 52.9 | M4.5 | 0.149 | 0.0 | 0.15 | 0.51 | -2.62 | … | N | Li, Na | |||
| 617 | 05 36 48.36 | 04 35 45.8 | M5.0 | 0.053 | 0.0 | 0.10 | 2.1 | … | -2.58 | W | N | Na | ||
| 618 | 05 36 48.37 | 05 14 16.6 | M4.8 | 0.146 | 0.0 | 0.13 | 0.28 | -2.66 | W | N | Li, Na | |||
| 619 | 05 36 49.33 | 05 33 20.6 | M4.6 | 0.037 | 0.2 | 0.12 | 3.6 | … | -1.53 | W | Y | Na, IRE | ||
| 620 | 05 36 50.23 | 06 48 58.2 | M3.3 | 0.245 | 0.4 | 0.23 | 1.0 | 0.26 | -2.67 | W | N | Li, Na, X | ||
| 621 | 05 36 50.73 | 05 37 47.3 | M4.5 | 0.211 | 0.0 | 0.15 | 0.28 | -2.88 | W | N | Li, Na | |||
| 622 | 05 36 50.90 | 06 10 55.2 | M5.5 | 0.037 | 0.0 | 0.076 | 2.7 | 0.40 | -2.68 | W | N | Li | ||
| 623 | 05 36 50.94 | 05 33 04.4 | M3.8 | 0.300 | 0.0 | 0.19 | 0.44 | -2.74 | … | N | Li, Na | |||
| 624 | 05 36 52.66 | 05 59 18.0 | M4.6 | 0.069 | 0.0 | 0.14 | 2.1 | 0.31 | -2.72 | … | N | Li, Na | ||
| 625 | 05 36 52.67 | 05 46 06.4 | M5.3 | 0.035 | 0.0 | 0.084 | 3.3 | 0.54 | -1.45 | C | Y | Li, Na, IRE | ||
| 626 | 05 36 53.03 | 05 56 43.4 | M4.4 | 0.116 | 0.0 | 0.16 | 1.2 | 0.49 | -2.82 | … | N | Li, Na | ||
| 627 | 05 36 53.26 | 06 35 00.4 | M3.4 | 0.126 | 0.6 | 0.24 | 2.2 | 0.40 | -2.56 | W | N | Li, Na, X | ||
| 628 | 05 36 53.84 | 06 20 53.7 | M3.5 | 0.117 | 0.2 | 0.23 | 2.2 | 0.50, 0.53 | -2.54 | W | N | Li, X | ||
| 629 | 05 36 54.29 | 06 19 45.6 | M1.9 | 0.237 | 0.4 | 0.35 | 1.9 | 0.39 | -2.64 | W | N | Li, Na, X | ||
| 630 | 05 36 54.37 | 06 07 21.9 | M4.0 | 0.096 | 0.1 | 0.18 | 2.0 | 0.50 | -2.60 | W | N | Li | ||
| 631 | 05 36 55.22 | 06 20 25.8 | M2.2 | 0.177 | 0.2 | 0.33 | 2.5 | 0.43 | -1.40 | -0.26 | C | TD | Li, Na, IRE | |
| 632 | 05 36 57.35 | 06 18 45.2 | M5.0 | 0.130 | 0.0 | 0.12 | 0.20 | -2.77 | W | N | Li, X | |||
| 633 | 05 36 57.57 | 05 04 25.9 | M5.4 | 0.069 | 0.0 | 0.100 | 0.8 | … | -2.39 | W | N | Na | ||
| 634 | 05 36 58.98 | 06 29 04.9 | M3.4 | 0.260 | 0.6 | 0.22 | 0.9 | 0.26 | -2.32 | -0.64 | W | TD | Li, Na, IRE | |
| 635 | 05 36 59.38 | 05 40 55.8 | M5.3 | 0.066 | 0.0 | 0.10 | 1.2 | … | -2.37 | W | N | Na | ||
| 636 | 05 36 59.97 | 06 11 45.4 | M2.1 | 0.169 | 0.8 | 0.34 | 2.8 | 0.29 | -2.65 | W | N | Li, X | ||
| 637 | 05 37 00.68 | 05 25 01.1 | M4.4 | 0.312 | 0.0 | 0.16 | 0.42 | -2.84 | W | N | Li, Na | |||
| 638 | 05 37 00.69 | 04 41 09.8 | M4.1 | 0.064 | 0.0 | 0.17 | 3.0 | … | -2.49 | W | N | Na | ||
| 639 | 05 37 01.43 | 04 19 09.7 | M2.4 | 0.199 | 0.0 | 0.30 | 1.9 | 0.42 | -2.80 | W | N | Li, Na | ||
| 640 | 05 37 03.05 | 05 51 56.1 | M4.8 | 0.050 | 0.0 | 0.12 | 2.5 | … | -2.31 | … | N | Na | ||
| 641 | 05 37 03.32 | 05 09 17.1 | M4.5 | 0.045 | 0.0 | 0.13 | 3.2 | … | -2.49 | W | N | Na | ||
| 642 | 05 37 04.72 | 06 04 55.5 | M5.0 | 0.093 | 0.0 | 0.12 | 0.31 | -3.12 | … | N | Li, Na | |||
| 643 | 05 37 04.91 | 05 37 12.7 | M4.9 | 0.338 | 0.0 | 0.13 | 0.34 | -2.72 | W | N | Li, Na | |||
| 644 | 05 37 05.31 | 04 43 06.1 | M5.3 | 0.058 | 0.0 | 0.097 | 1.6 | 0.50 | -2.80 | W | N | Li, Na | ||
| 645 | 05 37 05.78 | 06 27 16.5 | M3.5 | 0.261 | 0.0 | 0.22 | 0.8 | 0.19 | -2.70 | W | N | Li, Na, X | ||
| 646 | 05 37 05.90 | 06 47 14.9 | M3.4 | 0.267 | 0.1 | 0.23 | 0.9 | … | -2.70 | … | N | X | ||
| 647 | 05 37 05.94 | 05 40 55.5 | M4.8 | 0.065 | 0.5 | 0.12 | 1.9 | … | -1.73 | -1.05 | C | TD | Na, IRE | |
| 648 | 05 37 06.12 | 05 37 25.2 | M3.2 | 0.172 | 0.0 | 0.25 | 1.6 | … | -2.60 | … | N | Na | ||
| 649 | 05 37 06.50 | 05 53 57.3 | M4.3 | 0.096 | 0.0 | 0.16 | 1.7 | 0.36 | -3.06 | … | N | Li, Na | ||
| 650 | 05 37 07.06 | 05 11 20.9 | M3.7 | 0.101 | 0.0 | 0.21 | 2.4 | … | -2.62 | W | N | Na | ||
| 651 | 05 37 07.31 | 05 24 01.8 | M2.1 | 0.223 | 0.0 | 0.33 | 1.9 | 0.40 | -2.75 | W | N | Li, Na | ||
| 652 | 05 37 07.44 | 05 53 29.1 | M5.2 | 0.087 | 0.0 | 0.11 | … | -2.75 | … | N | Na | |||
| 653 | 05 37 07.71 | 06 42 18.6 | M5.7 | 0.041 | 0.1 | 0.074 | 1.0 | … | -2.63 | W | N | X | ||
| 654 | 05 37 08.71 | 04 38 23.8 | M4.1 | 0.132 | 0.0 | 0.17 | 1.2 | 0.30 | -2.82 | W | N | Li, Na | ||
| 655 | 05 37 09.93 | 06 45 46.5 | M2.8 | 0.171 | 0.0 | 0.28 | 2.0 | 0.30 | -2.74 | W | N | Li | ||
| 656 | 05 37 10.13 | 05 17 58.7 | M5.2 | 0.062 | 0.0 | 0.10 | 1.4 | 0.41 | -2.24 | W | N | Li, Na | ||
| 657 | 05 37 10.68 | 06 47 12.0 | M4.6 | 0.058 | 0.0 | 0.13 | 2.3 | 0.32 | -2.47 | W | N | Li, Na, X | ||
| 658 | 05 37 10.85 | 06 30 15.2 | M5.5 | 0.153 | 0.0 | 0.099 | 0.38 | -2.71 | W | N | Li, Na, X | |||
| 659 | 05 37 11.57 | 06 06 45.2 | M5.2 | 0.055 | 0.0 | 0.095 | 2.0 | 0.78 | -2.15 | … | N | Li, Na | ||
| 660 | 05 37 13.99 | 05 13 26.3 | M3.0 | 0.182 | 0.0 | 0.27 | 1.7 | … | -2.67 | W | N | Na | ||
| 661 | 05 37 14.73 | 06 35 15.8 | M4.8 | 0.095 | 0.0 | 0.13 | 0.9 | 0.35 | -2.86 | W | N | Li, Na, X | ||
| 662 | 05 37 14.81 | 06 01 41.8 | M4.8 | 0.040 | 0.0 | 0.11 | 3.0 | 0.71 | -1.98 | -0.77 | … | TD | Li, Na, IRE | |
| 663 | 05 37 16.37 | 05 26 04.1 | M4.9 | 0.025 | 0.0 | 0.093 | 4.6 | … | -1.63 | W | Y | Na, IRE | ||
| 664 | 05 37 16.87 | 06 47 50.7 | M5.5 | 0.045 | 0.7 | 0.080 | 1.8 | … | -2.69 | W | N | X | ||
| 665 | 05 37 18.25 | 05 49 20.7 | M4.4 | 0.197 | 0.5 | 0.16 | 0.31 | -1.36 | -1.19 | C | Y | Li, Na, IRE | ||
| 666 | 05 37 18.87 | 06 09 41.2 | K9.9 | 0.431 | 0.1 | 0.51 | 1.8 | 0.38 | -2.15 | -1.59 | W | Y | Li, IRE | |
| 667 | 05 37 18.89 | 06 47 04.0 | M5.1 | 0.063 | 0.1 | 0.11 | 1.5 | 0.20 | -2.70 | W | N | Li, X | ||
| 668 | 05 37 22.17 | 06 54 45.4 | M5.4 | 0.131 | 0.0 | 0.10 | 0.30 | -0.90 | -0.24 | W | Y | Li, X, IRE | ||
| 669 | 05 37 22.86 | 06 44 46.6 | M1.5 | 0.272 | 0.3 | 0.37 | 1.8 | 0.38 | -1.79 | -1.33 | C | Y | Li, Na, X, IRE | |
| 670 | 05 37 22.94 | 06 03 21.1 | M3.7 | 0.161 | 0.0 | 0.20 | 1.4 | 0.43 | -2.70 | … | N | Li, Na | ||
| 671 | 05 37 24.40 | 05 46 40.0 | M5.0 | 0.060 | 0.0 | 0.11 | 1.8 | … | -2.77 | … | N | Na | ||
| 672 | 05 37 24.91 | 06 02 42.3 | M5.2 | 0.064 | 0.0 | 0.10 | 1.3 | … | -2.50 | … | N | Na | ||
| 673 | 05 37 30.18 | 05 49 38.1 | M5.2 | 0.061 | 0.0 | 0.10 | 1.4 | … | -2.75 | … | N | Na | ||
| 674 | 05 37 32.72 | 05 35 08.0 | M4.8 | 0.034 | 0.0 | 0.11 | 3.5 | … | -1.76 | … | Y | Na, IRE | ||
| 675 | 05 37 34.00 | 05 59 35.8 | M5.0 | 0.078 | 0.0 | 0.12 | 1.1 | … | -2.61 | … | N | Na | ||
| 676 | 05 37 34.07 | 06 44 02.3 | M4.6 | 0.095 | 0.0 | 0.14 | 1.3 | 0.43 | -2.82 | W | N | Li, Na, X | ||
| 677 | 05 37 35.24 | 06 28 21.7 | M2.9 | 0.136 | 0.3 | 0.29 | 2.8 | … | -2.78 | W | N | Na, X | ||
| 678 | 05 37 38.98 | 06 45 15.4 | M3.6 | 0.371 | 0.0 | 0.21 | … | -2.59 | W | N | Na, X | |||
| 679 | 05 37 49.35 | 06 51 37.3 | M3.5 | 0.238 | 1.1 | 0.22 | 1.0 | 0.50 | -1.97 | -0.45 | W | TD | Li, X, IRE | |
| 680 | 05 37 50.24 | 04 26 16.8 | M1.9 | 0.398 | 0.6 | 0.33 | 0.9 | 0.25 | C | Y | Li, X, IRE | |||
| 681 | 05 37 51.58 | 06 41 29.1 | M3.8 | 0.147 | 0.5 | 0.20 | 1.4 | 0.41 | -2.66 | W | N | Li, Na, X | ||
| 682 | 05 37 53.08 | 06 35 55.4 | M5.2 | 0.098 | 0.1 | 0.11 | 0.50 | -1.22 | -0.98 | C | Y | Li, X, IRE | ||
| 683 | 05 37 55.03 | 06 44 59.1 | M3.3 | 0.243 | 0.0 | 0.24 | 1.1 | 0.40 | -2.68 | W | N | Li, X | ||
| 684 | 05 37 55.15 | 06 57 40.7 | M5.7 | 0.114 | 0.6 | 0.095 | 0.70 | -2.56 | W | N | Li | |||
| 685 | 05 37 55.22 | 06 57 35.8 | M4.4 | 0.254 | 0.9 | 0.16 | 0.30 | -1.87 | -1.48 | W | Y | Li, IRE | ||
| 686 | 05 37 58.90 | 06 43 30.9 | M5.6 | 0.157 | 0.0 | 0.097 | … | C | Y | IRE | ||||
| 687 | 05 37 59.81 | 06 42 05.6 | M4.0 | 0.195 | 0.0 | 0.18 | 0.7 | 0.40 | -2.62 | W | N | Li, X | ||
| 688 | 05 38 02.49 | 06 40 56.9 | M5.0 | 0.049 | 0.0 | 0.10 | 2.2 | … | -2.59 | W | N | X | ||
| 689 | 05 38 02.85 | 05 02 36.4 | K9.9 | 0.304 | 0.0 | 0.54 | 3.3 | 0.62 | W | N | Li | |||
| 690 | 05 38 10.63 | 06 22 08.6 | K8.9 | 0.690 | 1.1 | 0.56 | 1.2 | 0.47 | C | Y | Li, IRE | |||
| 691 | 05 39 07.96 | 06 29 10.3 | K8.5 | 0.823 | 0.1 | 0.57 | 0.9 | 0.62 | … | N | Li |