Pseudogap temperature of cuprate superconductors from the Nernst effect
Abstract
We use the Nernst effect to delineate the boundary of the pseudogap phase in the temperature-doping phase diagram of hole-doped cuprate superconductors. New data for the Nernst coefficient of YBa2Cu3Oy (YBCO), La1.8-xEu0.2SrxCuO4 (Eu-LSCO) and La1.6-xNd0.4SrxCuO4 (Nd-LSCO) are presented and compared with previously published data on YBCO, Eu-LSCO, Nd-LSCO, and La2-xSrxCuO4 (LSCO). The temperature at which / deviates from its high-temperature linear behaviour is found to coincide with the temperature at which the resistivity deviates from its linear- dependence, which we take as the definition of the pseudogap temperature – in agreement with the temperature at which the antinodal spectral gap detected in angle-resolved photoemission spectroscopy (ARPES) opens. We track as a function of doping and find that it decreases linearly vs in all four materials, having the same value in the three LSCO-based cuprates, irrespective of their different crystal structures. At low , is higher than the onset temperature of the various orders observed in underdoped cuprates, suggesting that these orders are secondary instabilities of the pseudogap phase. A linear extrapolation of () to = yields ( ) (0), the Néel temperature for the onset of antiferromagnetic order at = , suggesting that there is a link between pseudogap and antiferromagnetism. With increasing , () extrapolates linearly to zero at , the critical doping below which superconductivity emerges at high doping, suggesting that the conditions which favour pseudogap formation also favour pairing. We also use the Nernst effect to investigate how far superconducting fluctuations extend above the critical temperature , as a function of doping, and find that a narrow fluctuation regime tracks , and not . This confirms that the pseudogap phase is not a form of precursor superconductivity, and fluctuations in the phase of the superconducting order parameter are not what causes to fall on the underdoped side of the dome.
pacs:
72.15.Jf, 74.72.Kf, 74.25.fgI Introduction
Understanding the mechanisms responsible for superconductivity in cuprates requires that we elucidate the nature of the enigmatic pseudogap phase that coexists with the superconducting phase in their temperature-doping phase diagram. The pseudogap is a partial gap in the spectral function that opens at the Fermi energy in -space locations and , the so-called anti-nodal regions of the first Brillouin zone, as measured by angle-resolved photoemission spectroscopy (ARPES) [Damascelli et al., 2003]. It is essential to know the boundary of the pseudogap phase, i.e. the location of the pseudogap temperature as a function of doping and of the critical doping where the pseudogap phase ends at = .
Nd-LSCO is the only cuprate material for which this information is complete. Here, the critical point has been located at = , from in-plane resistivity [Daou et al., 2009a,Collignon et al., 2017], out-of-plane resistivity [Cyr-Choinière et al., 2010] and Hall effect [Collignon et al., 2017]. This location is consistent with ARPES measurements at low temperature that find a large pseudogap at = but none at = [Matt et al., 2015]. Moreover, in Nd-LSCO the temperature below which the resistivity deviates from its linear- dependence at high [Daou et al., 2009a,Collignon et al., 2017] agrees with the onset temperature for the opening of the pseudogap measured by ARPES [Matt et al., 2015]. This shows that resistivity measurements can be used to track = vs in Nd-LSCO.
In only two other cuprates is the location of well established. In YBCO, recent high-field Hall measurements in the = limit find = [Badoux et al., 2016a], in agreement with earlier analyses that yield = [Tallon and Loram, 2001]. However, there are no ARPES measurements of in YBCO, so one typically relies on determined from resistivity without spectroscopic confirmation, and there is some debate as to where crosses the superconducting temperature [Rullier-Albenque et al., 2011]. In LSCO, high-field resistivity measurements in the = limit [Boebinger et al., 1996; Cooper et al., 2009; Laliberté et al., 2016] yield = [Laliberté et al., 2016]. However, there is no consensus on the location of the line in the phase diagram of LSCO [Ando et al., 2004,Hussey et al., 2011].
In Bi2Sr2-xLaxCuO6+δ (Bi-2201) [Kondo et al., 2011] and Bi2Sr2CaCu2O8+δ (Bi-2212) [Vishik et al., 2012], ARPES measurements have delineated the line quite well, and it is found to agree with from resistivity. However, there is no agreement on the location of . In Bi-2201, STM measurements suggest that , the critical doping below which superconductivity emerges at high doping [He et al., 2014], while NMR measurements show that [Kawasaki et al., 2010]. In Bi-2212, STM measurements find that = (in the superconducting state) [Fujita et al., 2014], while Raman measurements find = (in the normal state) [Benhabib et al., 2015].
In this Article, we show that the Nernst effect can be used to detect , not only in YBCO and HgBa2CuO4+δ (Hg-1201), as shown previously [Daou et al., 2010,Doiron-Leyraud et al., 2013], but also in the LSCO-based cuprates (Fig. 7). We present new data on YBCO, Nd-LSCO and Eu-LSCO, and combine these with published data on LSCO, Nd-LSCO and Eu-LSCO to determine the pseudogap boundary in all four materials. We find that the three LSCO-based cuprates have the same line up to , irrespective of their different crystal structures. This suggests that the interactions responsible for the pseudogap have the same strength. From the fact that is quite different in LSCO and Nd-LSCO ( vs ), we infer that additional mechanisms must dictate the location of the = critical point. lies on a line that connects at = , the Néel temperature for antiferromagnetic order at zero doping, to . In YBCO, we again find that lies on a line connecting and , even if is now a factor 1.5 larger. In other words, in YBCO is 1.5 times larger than in LSCO. This suggests a link between antiferromagnetism, pseudogap and superconductivity.
The Article is organized as follows. In sec. II, we give a brief introduction to the Nernst effect. In sec. III, we provide information on the experimental measurement of the Nernst effect. In sec. IV, we establish the line for YBCO. In sec. V, we establish the line for LSCO, Nd-LSCO and Eu-LSCO. We show in detail how is independent of crystal structure. In the discussion (sec. VI), we compare YBCO and LSCO, and draw general observations about the pseudogap phase. We also plot the onset temperatures of various orders on the phase diagrams of YBCO and LSCO and discuss the implications. In the Appendix (sec. IX), we show how superconducting fluctuations in YBCO, LSCO, Hg-1201, Bi-2212 and Bi-2201 are limited to a region close to , well below , and explain why previous interpretations suggested a much wider regime of fluctuations.
II The Nernst effect
The Nernst effect is the development of a transverse electric field across the width ( axis) of a metallic sample when a temperature gradient / is applied along its length ( axis) in the presence of a perpendicular magnetic field (along the axis). Two mechanisms can give rise to a Nernst signal / / [Behnia, 2009, 2015; Behnia and Aubin, 2016]: superconducting fluctuations [Huebner, 1979; Wang et al., 2006; Chang et al., 2012a], which give a positive signal, and charge carriers (quasiparticles), which can give a signal of either sign. The focus of this Article is on the quasiparticle contribution to the Nernst effect in cuprates.
In the Appendix, we discuss the contribution of superconducting fluctuations to the Nernst signal in cuprates and explain how the traditional assumption that it is the only significant contribution is mistaken. We discriminate between the superconducting signal and the quasiparticle signal by using the fact that only the former is suppressed by a magnetic field. We show that the regime of significant superconducting fluctuations is a relatively narrow band that tracks , completely distinct from . This confirms that the pseudogap phase is not caused by fluctuations in the phase and / or the amplitude of the superconducting order parameter.
The Nernst signal is related to the conductivity and thermoelectric tensors via
| (1) |
where / is the Seebeck coefficient. In-plane isotropy is assumed ( = ) and the approximate expression on the right holds for .
The sign of will thus depend on the relative magnitude of and . In a single-band metal with an energy-independent Hall angle , where / , the two terms are equal and thus = [Behnia, 2009, 2015; Behnia and Aubin, 2016]. This is the so-called Sondheimer cancellation. An energy dependence of will offset this equality in a direction that is difficult to predict, resulting in a finite whose sign can be either positive or negative [Behnia, 2009, 2015; Behnia and Aubin, 2016]. In general, the sign of in metals is not understood. Even in single-band metals like overdoped cuprates, it is unclear why in the electron-doped material Pr2-xCexCuO4 (PCCO) [Li and Greene, 2007] and in the hole-doped material Nd-LSCO [Cyr-Choinière et al., 2009], since both have a positive Hall coefficient.
At low temperature, the magnitude of the quasiparticle Nernst signal is given approximately by [Behnia, 2009, 2015; Behnia and Aubin, 2016]:
| (2) |
where / is the Nernst coefficient, is the magnetic field, is the temperature, is Boltzmann’s constant, is the electron charge, is the carrier mobility, and is the Fermi energy. Eq. 2 works remarkably well as a universal expression for the Nernst coefficient of metals at , accurate within a factor two or so in a wide range of materials [Behnia, 2009]. It explains why a phase transition that reconstructs a large Fermi surface into small pockets (with small ) can cause a major enhancement of . The heavy-fermion metal URu2Si2 provides a good example of this. As the temperature drops below its transition to a metallic state with reconstructed Fermi surface at K, the carrier density (or ) falls and the mobility rises, both by roughly a factor 10, and / increases by a factor 100 or so [Bel et al., 2004]. Note that the electrical resistivity is affected only weakly by these dramatic changes [Hassinger et al., 2008], since mobility and carrier density are modified in ways that compensate in the conductivity = / = . This is why the Nernst effect can be a more sensitive probe of electronic transformations, such as density-wave transitions, than the resistivity. Here we use it to study the pseudogap phase of cuprate superconductors.
III Methods
The YBCO samples measured here ( = and = ) were single crystals prepared at the University of British Columbia by flux growth [Liang et al., 2012]. The detwinned samples are uncut, unpolished thin platelets, with gold evaporated contacts (of resistance ), in a six-contact geometry. Typical sample dimensions are 20-50 500-800 500-1000 m3 (thickness width length). Their hole concentration (doping) was determined from a relationship between the -axis lattice constant and the superconducting transition temperature [Liang et al., 2006], defined as the temperature below which the zero-field resistance is zero.
The Nd-LSCO samples ( = and ) and the Eu-LSCO samples ( = , and ) measured here were grown using a travelling float-zone technique in an image furnace at the University of Texas and the University of Tokyo, respectively. -plane single crystals were cut from boules into small rectangular platelets with typical dimensions of mm in length and mm in width (in the basal plane of the tetragonal structure), with a thickness of mm along the axis. Orientation was checked via Laue diffraction. The doping is taken to equal the Sr content , to within 0.005. The of our samples was determined via resistivity measurements as the temperature where goes to zero. Electrical contacts on the Nd/Eu-LSCO samples were made to the crystal surface using Epo-Tek H20E silver epoxy, cured at C for 5 min and then annealed at C in flowing oxygen for 1 hr. This resulted in contact resistances of less than at room temperature. The longitudinal contacts were wrapped around all four sides of the sample. The current contacts covered the end faces. Nernst (transverse) contacts were placed opposite each other in the middle of the sample, extending along the length of the axis, on the sides. The uncertainty in the length of the sample (between longitudinal contacts) reflects the width of the voltage / temperature contacts along the axis.
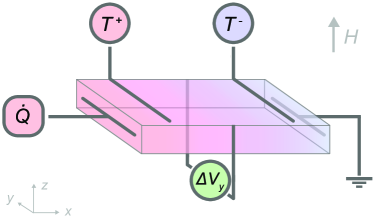
Fig. 1 summarizes how the Nernst signal is measured. The Nernst signal was measured by applying a steady heat current through the sample (along the axis). The longitudinal thermal gradient was measured using two uncalibrated Cernox chip thermometers (Lakeshore), referenced to a further calibrated Cernox. Alternatively on some samples, the longitudinal thermal gradient was measured using one differential and one absolute type-E thermocouple made of chromel and constantan wires known to have a weak magnetic field dependence. The temperature of the experiment was stabilized at each point to within mK. The temperature and voltage were measured with and without applied thermal gradient ( ) for calibration. The magnetic field , applied along the axis ( ), was then swept with the heat on, from to (where = , or T depending on sample), at T / min, continuously taking data. The thermal gradient was monitored continuously and remained constant during the course of a sweep. The Nernst signal was extracted from that part of the measured voltage which is anti-symmetric with respect to the magnetic field:
| (3) |
where is the difference in the voltage measured with and without thermal gradient. is the length (between contacts along the axis) and the width (along the axis) of the sample. This anti-symmetrization procedure removes any longitudinal thermoelectric contribution from the sample and a constant background from the measurement circuit. The uncertainty on comes mostly from the uncertainty in measuring and , giving a typical error bar of on .
IV YBCO
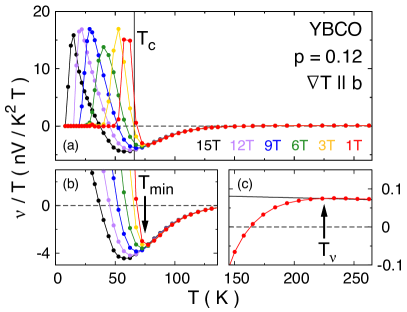
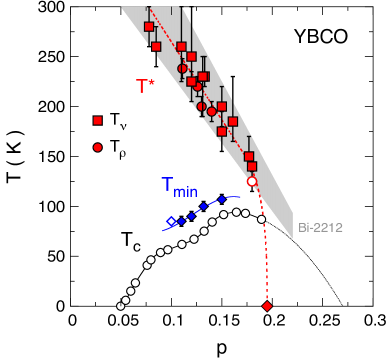
Nernst data taken on untwinned single crystals of YBCO have been reported for a range of dopings, from = to = [Daou et al., 2010]. A typical set of Nernst data is reproduced in Fig. 2 as / vs , for a sample with = . Two separate contributions are clearly seen: 1) a positive and magnetic-field-dependent signal which rises below a temperature close to ; 2) a field-independent signal which goes from small and positive at high temperature to large and negative at lower temperature, as it drops below a temperature . The first is due to superconducting fluctuations, the second is due to quasiparticles. In Fig. 3, the two onset temperatures and are plotted on a phase diagram. The 10 data points for (red squares) at are reproduced from Ref. [Daou et al., 2010]; they include data taken with and – both yield the same [Daou et al., 2010]. In Fig. 4, we report new data for dopings = and = which allow us to extend to low doping.
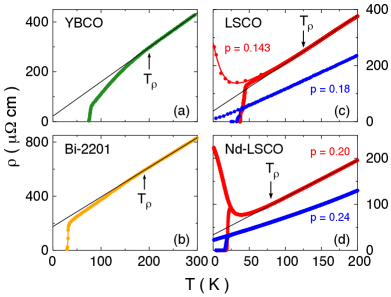
In YBCO, a standard criterion for the pseudogap temperature is the temperature below which the -axis resistivity deviates from its linear temperature dependence at high temperature [Ito et al., 1993]. An example is shown in Fig. 5(a), where we extract = K from published data at = [Ando et al., 2004]. Values for at different dopings are plotted on the phase diagram of Fig. 3, where we see that = , within error bars.
As a probe of the pseudogap phase in YBCO, the Nernst effect has an advantage over the resistivity. Pseudogap and superconductivity have opposite effects on : the former causes it to fall to negative values upon cooling, the latter causes it to rise, while for resistivity, both phenomena yield a downturn in (see Fig. 5(a), Fig. 6, and paragraph below). This makes the separation of the two contributions in the Nernst effect unambiguous, and allows us to track their respective onset temperatures.
In Fig. 6, we plot and on the “curvature map” produced by Ando and Segawa [Ando et al., 2004] from the second temperature derivative of their data. As already seen in Fig. 3, the lower bound of the linear- region (white region in the upper right corner of Fig. 6) coincides with and defines the boundary of the pseudogap phase. Below , the initial drop in shows up as a blue band, followed by an upturn (in red) (for , in Fig. 6). Superconducting fluctuations above also cause a downturn in (called “paraconductivity”), producing another blue band, which simply tracks . For , the onset of paraconductivity coincides reasonably well with . Therefore is the temperature below which superconducting fluctuations (above ) start to show up significantly in the Nernst signal. For , the two blue bands merge and become indistinguishable - the pseudogap downturn flows smoothly into the paraconductivity downturn (see Fig. 6). This makes it difficult to reliably track above = , and to say from the resistivity whether there is still a pseudogap phase (with ) beyond optimal doping. From the Nernst data, however, the answer is clearly yes, with K and = K at = .
While in YBCO the signature of is a downturn in both and / , we shall see below that the corresponding signature in LSCO is an upturn in those two quantities (see Fig. 7). We attribute this difference to a difference in the relative importance of two effects of the pseudogap: the loss of carrier density and the loss of inelastic scattering. At = , there is no inelastic scattering and so only the first effect is relevant. It has recently become clear that in the normal state at = the opening of the pseudogap at = causes a rapid drop in the carrier density from = (at ) to = (at ) [Collignon et al., 2017,Badoux et al., 2016a,Laliberté et al., 2016]. The consequence is that at is larger than it would be without the pseudogap by a factor + ) / [Collignon et al., 2017,Laliberté et al., 2016]. This drop in carrier density is what causes the upturn in seen at in LSCO (Fig. 5(c)) [Boebinger et al., 1996,Laliberté et al., 2016], Bi-2201 [Ono et al., 2000], and Nd-LSCO (Fig. 5(d)) [Daou et al., 2009a,Collignon et al., 2017], when superconductivity is suppressed by a large magnetic field. In Bi-2201, in addition to a pronounced upturn as [Ono et al., 2000], also exhibits a (slight) downturn below (Fig. 5(b)) [Ando et al., 2004,Kondo et al., 2011] showing that the two effects of the pseudogap – loss of inelastic scattering and loss of carrier density – do co-exist.
In order to see an upturn in starting right at , the loss of inelastic scattering (causing a downturn) must be a small effect compared to the loss of carriers (causing an upturn). This is the case in sufficiently disordered samples. A nice demonstration of this can be seen in YBCO at = . In clean samples, = K from the Nernst coefficient (Fig. 3), but little is seen in across . However, in a disordered sample at the same doping, a clear upturn is observed in , beginning at = K (open circle in Fig. 3) [Rullier-Albenque et al., 2008]. This upturn is definitely due to the pseudogap since no upturn is observed in when , even for disorder levels large enough to entirely suppress superconductivity [Momono et al., 1994]. Calculations without vertex corrections, perhaps appropriate when disorder scattering dominates, do get an upturn in the resistivity [Bergeron et al., 2011].
In summary, the Nernst effect is a sensitive probe of the pseudogap phase because a key property of that phase is a loss of carrier density [Badoux et al., 2016a], and / / . Because the pseudogap also causes a drop in inelastic scattering, the two effects reinforce each other in the Nernst signal, since / / , while they oppose each other in the resistivity, since / . The Nernst effect is also an unambiguous probe of in YBCO, because here the quasiparticle and superconducting contributions to the Nernst signal have opposite sign (Fig. 7). (Note that an early proposal for the negative Nernst signal in YBCO as being due to the CuO chains in that material [Ong et al., 2004] turns out to be incorrect, as the very same negative signal is observed in the tetragonal material Hg1201 [Doiron-Leyraud et al., 2013], which is free of such chains.)
The resulting phase diagram of YBCO is shown in Fig. 3, where the boundary of the pseudogap phase is clearly delineated (dashed red line). It decreases linearly with doping up to and then drops rapidly to reach its critical point at = (red diamond). The aprupt drop of at could reflect a first-order transition, as found in some calculations [Sordi et al., 2012]. It is instructive to compare = in YBCO with the pseudogap temperature measured by spectroscopic means in Bi-2212. In Fig. 3, we plot as a grey band the value of vs measured in Bi-2212 by ARPES, SIS tunneling, STS and NMR [Vishik et al., 2012]. We see that the line is essentially the same in YBCO and Bi-2212, two bilayer cuprates with similar domes. The only difference is in the value of in the normal state, namely = in YBCO and = in Bi-2212.
V LSCO, Nd-LSCO & Eu-LSCO
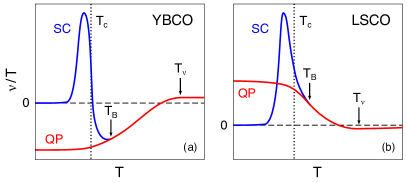
We now turn to a different family of cuprates, based on La2CuO4. Three materials will be discussed: LSCO, Nd-LSCO and Eu-LSCO. In all three materials, the quasiparticle Nernst signal in the pseudogap phase at low temperature is positive, therefore of the same sign as the superconducting signal.
As illustrated in Fig. 7, this makes it more difficult than in YBCO to separate the two contributions, and this difficulty is what led to early misinterpretations of the positive Nernst signal detected in LSCO up to 150 K as being due to vortex-like excitations in underdoped samples with [Xu et al., 2000]. We discuss this issue in more detail in the Appendix.
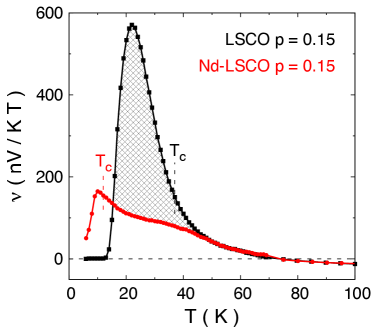
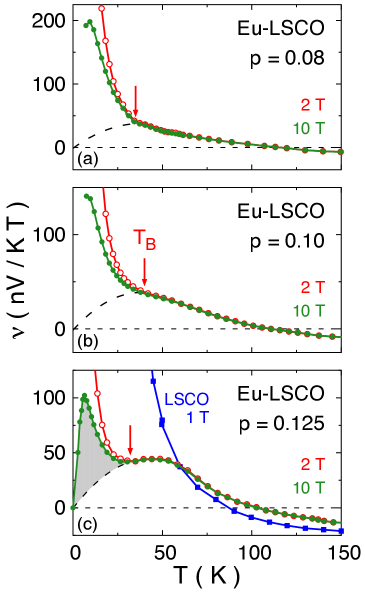
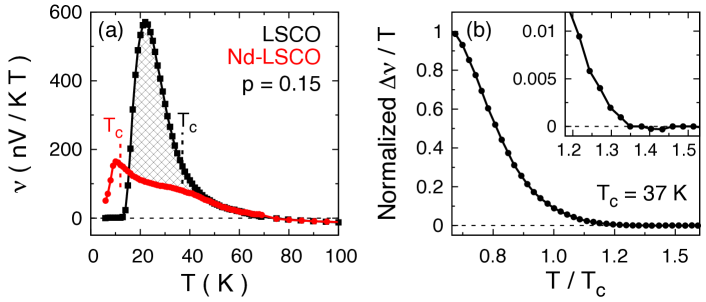
Nernst data taken on single crystals have been reported for Nd-LSCO at = and 0.24 and for Eu-LSCO at = and 0.16 [Cyr-Choinière et al., 2009]. The new data reported here were taken on Eu-LSCO at = , 0.10 and 0.21, and on Nd-LSCO at = and 0.21. We start by reviewing published data on Eu-LSCO at = (from Ref. [Cyr-Choinière et al., 2009]), displayed in Fig. 8(c), as their double-peak structure reveals most clearly the presence of two separate contributions to the Nernst signal : 1) a narrow positive peak at low temperature (shaded in grey), attributed to superconducting fluctuations because of its strong field dependence; 2) a broad positive peak at higher temperature, attributed to quasiparticles because it is independent of field. By applying a magnetic field of 28 T, the superconducting peak is entirely suppressed and only the quasiparticle peak remains (dashed line) [Chang et al., 2012a].
A double-peak structure is also observed in Nd-LSCO at = [Fujii et al., 2010] (see Fig. 9) and in the electron-doped cuprate PCCO at = [Li and Greene, 2007]. In all cases, the two peaks in can be resolved because is sufficiently low, roughly 10 K. By contrast, in LSCO at = ( = ), where K ( K), the superconducting peak in is moved up in temperature so that it lies on top of the quasiparticle peak (Figs. 8(c) and 9). This unfortunate overlap is what led to the initial misinterpretation of the LSCO data by the Princeton group [Xu et al., 2000,Wang et al., 2001].
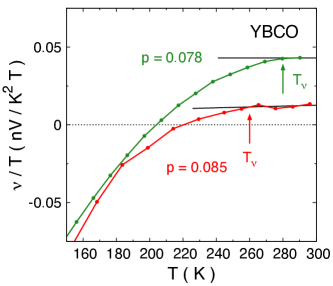
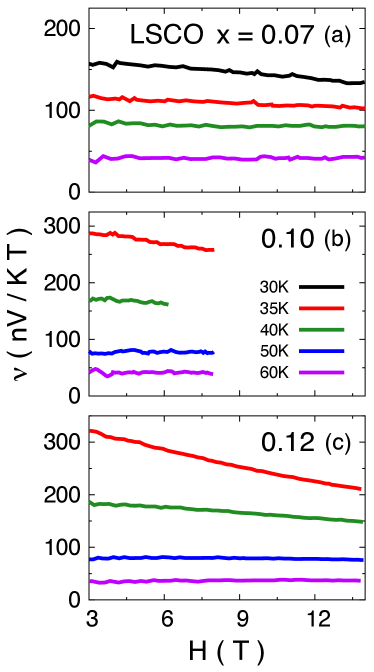
Even when two peaks cannot be resolved, one can still identify a temperature above which the Nernst coefficient is independent of magnetic field, a good indication that the superconducting Nernst signal is negligible. In Fig. 8, we see that the Nernst signal at 2 T splits off from the 10 T data below - K, for all three dopings. Above , the Nernst signal is therefore all due to quasiparticles, to a good approximation, and this is the signal we will use to pin down the onset temperature of the pseudogap phase in the three LSCO-based cuprates.
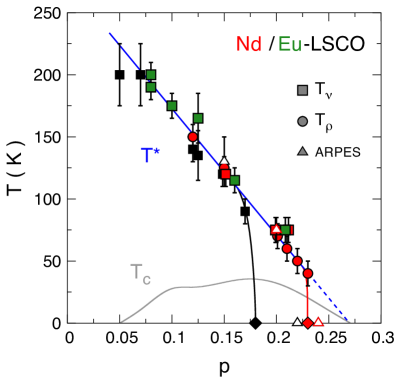
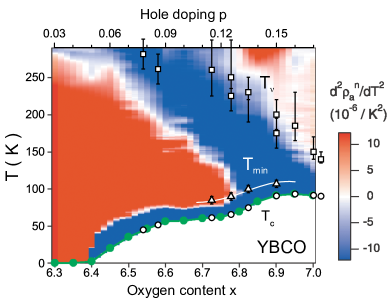
It is convenient to begin with Nd-LSCO, whose temperature-doping phase diagram is shown in Fig. 10 (red symbols), because its properties in the vicinity of the critical doping below which the pseudogap phase appears at = (red diamond) have been thoroughly characterized. In particular, ARPES measurements establish that the anti-nodal pseudogap in Nd-LSCO opens below a temperature = K at = (white triangle, Fig. 10), and that there is no pseudogap at = [Matt et al., 2015].
The onset of the pseudogap phase has a dramatic impact on the electrical resistivity of Nd-LSCO [Daou et al., 2009a], as seen in Fig. 5(d). At = , where there is no pseudogap, the normal-state (measured in high fields) is linear from K down to [Daou et al., 2009a,Collignon et al., 2017]. At = , undergoes a huge upturn as , increasing its value by a factor relative to the value it would have in the absence of a pseudogap [Daou et al., 2009a,Collignon et al., 2017]. We define as the temperature where the upturn starts, relative to the linear- dependence observed at higher temperature [Daou et al., 2009a,Collignon et al., 2017]. Using this definition, resistivity data yield the six red circles in Fig. 10 [Daou et al., 2009a,Collignon et al., 2017]. At = , = K, so that , within error bars, thereby confirming the interpretation of the low- upturn in as being due to the pseudogap.
Using measurements of both the in-plane and out-of-plane (-axis) resistivities, the upturn in was tracked vs doping to pinpoint the precise location of the critical point [Collignon et al., 2017,Cyr-Choinière et al., 2010] at (red diamond in Fig. 10). This type of upturn was first detected in LSCO twenty years ago, as illustrated in Fig. 5(c) [Boebinger et al., 1996]. Its origin was only recently shown to be a drop in the carrier density from = + above to = at = , combined with a negligible change in carrier mobility [Laliberté et al., 2016]. In Nd-LSCO, this interpretation is confirmed by Hall effect measurements that indeed find a drop in the = Hall number from = + above to = below [Daou et al., 2009a,Collignon et al., 2017], precisely as observed in YBCO [Badoux et al., 2016a].
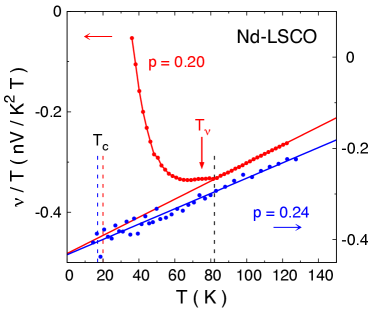
The large and abrupt drop in below should cause / to increase, just as and do, since all three quantities go as / (at = ). This is indeed the case. (A large enhancement of , from small and negative to large and positive, is also found in calculations of Fermi-surface reconstruction by commensurate [Hackl and Vojta, 2009] and incommensurate [Hackl et al., 2010] antiferrromagnetic order.) In Fig. 11, we show Nernst data for Nd-LSCO at = and = , plotted as / vs . The data in this figure are limited to those temperatures where no field dependence is detected, and are therefore purely a quasiparticle signal. The difference in behavior is striking. At = , / decreases linearly as , down to at least 15 K, remaining negative all the way. This is analogous to the linear- decrease in at that doping (Fig. 5(d)). The value / extrapolates to at = , nV / K2T, is in reasonable agreement with expectation. Indeed, using the second term in Eq. 1, we estimate / = / at , with the mobility = / / , to yield / = nV / K2T, given that / = V / K2 [Daou et al., 2009b] and = T-1 [Collignon et al., 2017] in Nd-LSCO at = . The fact that the measured / is slightly less negative than the calculated one means that the first (positive) term in Eq. 1 acts to partially reduce its magnitude. In the end, / / , the value given by simple formula in Eq. 2, since / / / . All this means that in Nd-LSCO at = , just as the small (positive) Hall coefficient reflects the large hole-like Fermi surface, with a Hall number equal to the carrier density ( = ) [Daou et al., 2009a], so do the small Seebeck and Nernst coefficients.
At = , / also decreases linearly down to 80 K, with a similar slope, but below 80 K, it undergoes a dramatic rise to positive values (Fig. 11). This upturn in / is analogous to the upturn in at that doping (Fig. 5(d)). It is a second signature of the pseudogap phase. In other words, just as the parallel drops in and / observed in YBCO are two signatures of , so the parallel rises in and / observed in Nd-LSCO are the signature of in that material – confirmed in this case by a direct spectroscopic measurement [Matt et al., 2015]. Note that in our previous work on the Nernst effect in Nd-LSCO [Cyr-Choinière et al., 2009] we attributed the rise in the Nernst coefficient at = to the onset of stripe order (combined charge-density and spin-density waves) at low temperature. (Note that no charge order has been detected at = , but spin order is seen by neutron diffraction below 20 K [Tranquada et al., 1997], with a slowing down of spin fluctuations detected by NQR below 40 K [Hunt et al., 2001].) The recent ARPES study showing a pseudogap opening at 75 K [Matt et al., 2015], precisely where the upturn in [Collignon et al., 2017] and in (Fig. 11) begins, has clarified the cause of the upturns.
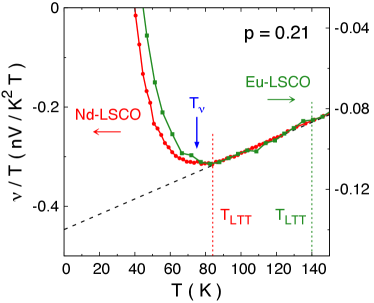
Upon close inspection of the Nernst data on Nd-LSCO = (Fig. 11), we see a small kink at = K, due to the structural transition into the low-temperature tetragonal (LTT) phase. To ascertain that this transition has only a small effect on the large upturn in / , we compare Nernst data in the three LSCO-based cuprates, at three different dopings. In Fig. 12, we compare our own data at = on Nd-LSCO and Eu-LSCO. In our Nd-LSCO sample, there is a clear kink in at = K (red dotted line). In Eu-LSCO, the LTT transition at = is expected at K [Fink et al., 2011] (green dotted line). However, it has no detectable signature in our sample; even the -axis resistivity shows no feature whatsoever. Be that as it may, any structural transition in Eu-LSCO at = occurs well above K. Yet, in both samples the Nernst data show very similar upturns. We define as the temperature where the upturn in / vs begins. At = , we find = K in Nd-LSCO and = K in Eu-LSCO; those values are added to the phase diagram (squares; Fig. 10).
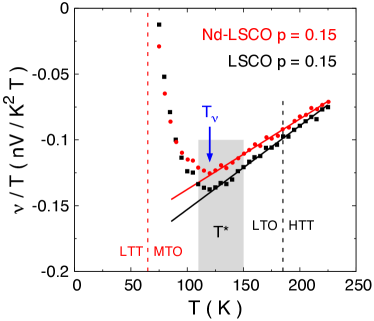
In Fig. 13, we compare data at = on Nd-LSCO and LSCO (from Ref. [Fujii et al., 2010]). We see that the upturn in / starts at a higher temperature than it did at = , with = K not only in Nd-LSCO but also in LSCO. The two samples exhibit essentially identical behavior, even though their respective crystal structures and structural transitions are quite different: the LTT transition in Nd-LSCO is at = K [Axe and Crawford, 1994] (red dashed line), K below , while the LTO transition in LSCO is at K [Keimer et al., 1992] (black dashed line), K above . This shows that the large upturns in / are not caused by structural transitions. Instead, they are caused by the opening of the pseudogap, as confirmed also in LSCO by ARPES measurements at = , which yield = K (grey band in Fig. 13) [Yoshida et al., 2009]. As we did at = , we again find that = = at = , within error bars (Fig. 10).
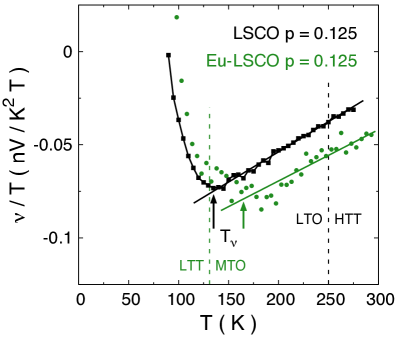
This conclusion is reinforced by yet another comparison, at = , between Eu-LSCO (from Ref. [Hess et al., 2010]) and LSCO (from Ref. [Fujii et al., 2010]), as displayed in Fig. 14. We see that in Eu-LSCO the upturn in / now starts above the LTT transition at = K (green dotted line), whereas it started well below it at = (Fig. 12). In other words, the line in Eu-LSCO goes through the LTT transition unperturbed, as in Nd-LSCO (Fig. 10). Similarly, the structural transition in LSCO has no effect on and is well below.
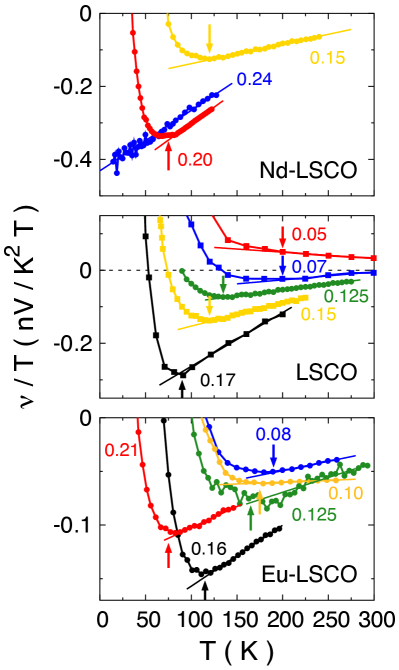
In Fig. 15, we collect data at several dopings for all three materials. We see that the behavior is similar in all three: the upturn at low in / onsets at a temperature (arrows) that increases monotonically with decreasing . In Fig. 10, all values of are plotted on a common phase diagram. The first thing to note is that is the same in all three materials, within error bars, across the whole phase diagram.
In Fig. 10, we also plot in Nd-LSCO [Daou et al., 2009a,Ichikawa et al., 2000] (red circles), the temperature below which deviates from its linear dependence at high temperature, as illustrated in Fig. 5(d). (This is the same definition used for YBCO, except that here the deviation is upward instead of downward.) We see that = , within error bars, as also found in YBCO (Fig. 3).
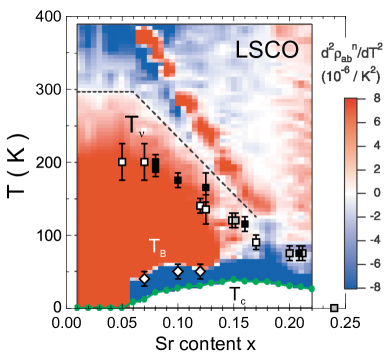
In Fig. 16, the values for LSCO, Nd-LSCO and Eu-LSCO are plotted on the curvature map of Ando and co-workers for LSCO [Ando et al., 2004]. They are seen to coincide reasonably well with the upper boundary of the red region, where the upward deviation in begins. Note that in LSCO the (white) region of linear- behaviour is contaminated near its lower bound by the structural transition, seen clearly as the red ridge inside the white region. This anomaly in can be mistaken for the pseudogap phase boundary in a resistive determination of . By contrast, a determination based on the Nernst coefficient is clear (Fig. 13), and it shows that the line in LSCO lies well below its structural transition (Fig. 16).
In Fig. 16, the region of paraconductivity, in which superconducting fluctuations cause a decrease in above , shows up very clearly as a blue band tracking the dome, of width 30 K or so. We also plot in LSCO (white diamonds), the temperature above which is independent of field (see Fig. 22). It agrees well with the upper limit of paraconductivity, both saying that superconducting fluctuations have a negligible impact on either resistivity or Nernst above K or so. The long-held notion that superconducting fluctuations are detected in LSCO up to K is incorrect (see Appendix for further discussion).

In order to complete our determination of the pseudogap phase boundary in LSCO, we need to know the location of , its end point at = . High-field measurements of the resistivity of LSCO reveal that is perfectly linear below 70 K or so, down to the lowest , at = , = and even = [Cooper et al., 2009]. At = and lower dopings, however, an upward deviation from linearity is observed at low [Boebinger et al., 1996]. Just as the appearance of an upturn was used to locate = in Nd-LSCO, we find that = in LSCO (black diamond, Fig. 10).
In summary, the onset of the pseudogap phase at causes an upturn in / in the three La2CuO4-based cuprates, which coincides with the upturn in , it has nothing to do with structural transitions, and it is distinct from the upturn due to superconducting fluctuations close to . In the phase diagram (Fig. 10), the three materials are found to have the same line, decreasing monotonically with . However, the pseudogap phase ends sooner in LSCO, at = , than in Nd-LSCO (or Eu-LSCO), where it extends up to = .
VI Discussion
We have shown that it is possible to disentangle the superconducting and quasiparticle contributions to the Nernst coefficient in cuprates. The key difference is that the former depends strongly on magnetic field and not the latter. In YBCO, they are also of opposite sign. We then showed that the quasiparticle Nernst signal in Nd-LSCO and LSCO undergoes a pronounced change when temperature is reduced below , the onset temperature of the pseudogap phase established by ARPES measurements. A similar, albeit smaller, change in the resistivity occurs simultaneously. The onset of these changes, at and respectively, can therefore be used to define . Using new and published Nernst data in four cuprates – YBCO, LSCO, Nd-LSCO, and Eu-LSCO – we identify at various dopings and then map across the temperature-doping phase diagram, in Fig. 3 for YBCO and in Fig. 10 for the other three. We find that the latter three materials all have the same line (up to ), irrespective of their different structural transitions.
VI.1 Boundary of the pseudogap phase
Having delineated the boundary of the pseudogap phase, the question arises: is it a transition or a crossover? Detailed studies of the pseudogap opening via ARPES show a rather sharp onset with decreasing temperature, as in optimally-doped Bi-2201 [Kondo et al., 2011] and Nd-LSCO at = [Matt et al., 2015], pointing to a transition. By contrast, the change in across is always very gradual (Fig. 5), suggestive of a crossover. The change in is also rather gradual when is high, but it does get sharper when is lower (Fig. 15). In the normal state at , the drop in Hall number across (in either YBCO or Nd-LSCO) is as sharp as expected theoretically for a quantum phase transition into a phase of long-range antiferromagnetic order [Collignon et al., 2017]. In Nd-LSCO, the upturn in appears very rapidly upon crossing below , going from no upturn to full upturn over a doping interval of relative width / [Collignon et al., 2017].
To better compare the phase diagrams of YBCO and LSCO, we display them side by side in Fig. 17. Some general features are immediately apparent.
VI.1.1 Pseudogap temperature
decreases monotonically with , in both cases. We see that the pseudogap temperature is 1.5 times larger in YBCO (and Bi-2212) than in LSCO (and Nd-LSCO and Eu-LSCO): YBCO LSCO (up to ). This is an important quantitative fact, which may reflect the strength of interactions and possibly the pairing strength. The weaker maximal of LSCO (40 K) compared to YBCO (93 K) may be related to its smaller .
A linear fit to vs gives a line that connects , the Néel temperature for the onset of commensurate antiferromagnetic order at = , to , the upper end of the superconducting dome at = (straight dashed lines in Fig. 17). The slope of that line is 1.5 times larger in YBCO and so is : K [Brewer et al., 1988] and K [Keimer et al., 1992], at = .
These connections suggest a link between the pseudogap phase and the antiferromagnetism of the undoped Mott insulator. They also suggest that the same interactions favour pseudogap formation and pairing.
VI.1.2 Pseudogap critical doping
If the linear decrease of with doping continued all the way, would go to zero at , the critical doping where goes to zero at high doping. In Fig. 17, we see that this is not the case, and the pseudogap phase instead comes to a rather abrupt end, with dropping precipitously to zero at , well below . In Nd-LSCO, extends up to (Fig. 10), and only then does it drop suddenly to zero at = [Collignon et al., 2017,Cyr-Choinière et al., 2010], slightly (but distinctly) below . In LSCO, follows the very same line as in Nd-LSCO, up to , but then, in striking contrast, it starts to drop at = and goes to zero at (Fig. 17). The difference between those two materials is seen most clearly in their normal-state resistivity (measured to low in high fields): in Nd-LSCO, shows a huge upturn at = and 0.22, for example [Collignon et al., 2017], while in LSCO remains linear down to at = and 0.21 [Cooper et al., 2009] (see Fig. 5).
This raises a crucial, and largely unexplored question: what controls the location of ? And specifically: why is so much higher in Nd-LSCO than in LSCO, when is otherwise the same (below )? An answer to these new questions could elucidate the fundamental nature of the pseudogap phase. A potential ingredient in the answer is the interesting observation [Benhabib et al., 2015] made in Bi-2212 that the end of the pseudogap phase in the normal state (above ) coincides with the (Lifshitz) transition that changes the topology of the Fermi surface (in one of the two CuO2 planes of the bi-layer [Kaminski et al., 2006]), from hole-like below to electron-like above the critical doping = at which the van Hove singularity crosses the Fermi level [Kaminski et al., 2006]. The idea would be that the pseudogap cannot form on an electron-like Fermi surface. This is consistent with data on LSCO [Yoshida et al., 2006] and Nd-LSCO [Matt et al., 2015] and, to our knowledge, no data on any cuprate contradicts this idea. This scenario requires further investigation.
VI.2 Orders inside the pseudogap phase
In hole-doped cuprates, a number of phases, sometimes with only short-range order, exist in the underdoped region of the phase diagram. Here we discuss four of the main phases that have been detected experimentally.
VI.2.1 Spin density wave
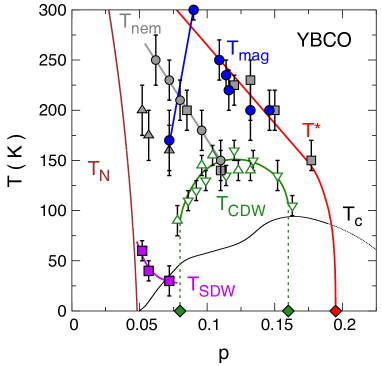
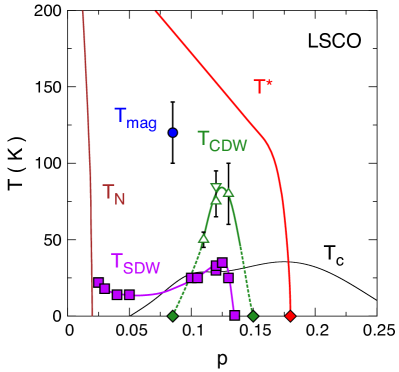
Long-range commensurate antiferromagnetic (AF) order dies out quickly with increasing : goes to zero at the critical doping = in YBCO and in LSCO (Fig. 17). Beyond , incommensurate spin-density-wave (SDW) order is observed at low , with correlation lengths that vary from rather short to fairly long amongst the various cuprates. In YBCO, short-range SDW order is observed up to in zero field (purple squares, Fig. 18). It stops when charge-density-wave (CDW) order starts, at , evidence that the two orders compete (arguably because their periods do not match [Nie et al., 2017]). In LSCO, SDW order extends up to in zero field (purple squares, Fig. 19), and it coexists with CDW order, evidence that the two orders do not compete (arguably because their periods match [Nie et al., 2017]). A magnetic field which suppresses superconductivity enhances SDW order in both YBCO and LSCO [Khaykovich et al., 2005]. In LSCO, a field of 15 T pushes the SDW critical point up to [Chang et al., 2008a]. Extrapolating to higher fields, it is conceivable that = at = T. In other words, when the competing superconductivity is fully suppressed by a field, SDW order in LSCO could extend up to , i.e. the non-superconducting ground state of the pseudogap phase could host SDW order. This is confirmed by SR studies on LSCO with Zn impurities used to suppress superconductivity, where magnetism is detected up to [Kimura et al., 2003; Panagopoulos et al., 2003, 2004].
This is also established in the case of Nd-LSCO, where magnetic Bragg peaks are detected by neutron diffraction [Tranquada et al., 1997] up to = and their onset temperature and intensity both go to zero at = . In Nd-LSCO, superconductivity is much weaker than in LSCO and a magnetic field is not needed to help SDW order win the competition. Hence the magnetic Bragg peaks do not depend on field [Chang et al., 2008a]. Note, however, that the magnetism in Nd-LSCO at = may not be fully static, as it is not detected by SR [Nachumi et al., 1998].
In YBCO, suppressing superconductivity with a large field does not induce SDW order in the range where there is CDW order, i.e. between = and = [Wu et al., 2013]. However, adding Zn impurities to suppress superconductivity, e.g. at , also suppresses CDW order, and this nucleates SDW order [Blanco-Canosa et al., 2013]. In other words, there is a three-way phase competition. It is then conceivable that between and , SDW order could emerge if superconductivity is fully suppressed, as we have proposed above for LSCO. In YBCO, this would require fields of order T, the maximal value of [Grissonnanche et al., 2014].
In summary, magnetic order (AF or SDW) at low is ubiquitous in hole-doped cuprates and it may well exist at all dopings from = up to when it is not suppressed by competition from superconductivity or CDW order. It is therefore an important property of the pseudogap phase at – a second link between pseudogap and antiferromagnetism (the first being at ). Having said this, the pseudogap phase is not simply a phase of SDW order, since (Figs. 18 and 19).
| Material | |||||
|---|---|---|---|---|---|
| YBCO | 0.195 [Badoux et al., 2016a] | ? | 0.07 [Haug et al., 2010] | 0.08 [LeBoeuf et al., 2011] | 0.16 [Badoux et al., 2016a] |
| LSCO | 0.18 [Laliberté et al., 2016] | 0.17 - 0.22 [Yoshida et al., 2006,Chang et al., 2008b] | 0.13 [Chang et al., 2008a,Kofu et al., 2009] | 0.085 [Badoux et al., 2016b] | 0.15 [Badoux et al., 2016b] |
| Nd-LSCO | 0.23 [Collignon et al., 2017] | 0.20 - 0.24 [Matt et al., 2015] | 0.24 [Tranquada et al., 1997] | ? | 0.15 - 0.20 [Daou et al., 2009b] |
| Eu-LSCO | 0.24 [Laliberté et al., 2011] | ? | ? | 0.09 [Laliberté et al., 2011] | 0.16 - 0.21 [Laliberté et al., 2011] |
VI.2.2 Charge density wave
Twenty years ago, CDW order was first detected in cuprates by neutron diffraction, in Nd-LSCO and LBCO at [Tranquada et al., 1995]. Five years later, it was seen via STM in Bi-2212 [Hoffman et al., 2002,Howald et al., 2003]. Another five years later, CDW order was first sighted in YBCO via its effect on the Fermi surface, reconstructed into small electron pockets [Doiron-Leyraud et al., 2007; LeBoeuf et al., 2007; Taillefer, 2009; Chang et al., 2010; Laliberté et al., 2011; LeBoeuf et al., 2011], and then observed directly via NMR [Wu et al., 2013,Wu et al., 2011] and X-ray diffraction (XRD) [Ghiringhelli et al., 2012,Chang et al., 2012b]. In addition to YBCO, CDW order has been observed by XRD in Nd-LSCO [M. v. Zimmermann et al., 1998,Niemöller, T. et al., 1999], Eu-LSCO [Fink et al., 2009,Fink et al., 2011], LSCO [Croft et al., 2014,Christensen et al., 2014], Hg-1201 [Tabis et al., 2014], Bi-2212 [da Silva Neto et al., 2014], and Bi-2201 [Comin et al., 2014]. It is typically strongest at and confined to a region entirely inside the pseudogap phase, between two critical dopings: at low doping and at high doping. For the four materials of particular focus here, all evidence to date indicates that is well below , (see Table 1 and Figs. 18 and 19). This immediately implies that the pseudogap phase is not a phase of CDW order, nor is it a high-temperature precursor of that order. This is confirmed by the fact that the onset temperature of CDW order in these same materials is a dome peaked at , while rises monotonically with decreasing (Figs. 18 and 19).
In other cuprates, the location of and is still not fully established. In Bi-2212, STM studies at K (below ) detect CDW modulations up to = and a transition from Fermi arcs (with pseudogap) at = to a complete large Fermi surface (without pseudogap) at = [Fujita et al., 2014]. In other words, = . However, normal-state measurements of the pseudogap (above ), such as ARPES and Raman, find = [Vishik et al., 2012,Benhabib et al., 2015]. Given this uncertainty, it seems possible that , much as in YBCO and LSCO (Table 1 ).
We infer that CDW ordering is a secondary instability of the pseudogap phase. Two open questions are why it tends to peak at and why its onset at = is delayed relative to .
VI.2.3 Nematicity
In orthorhombic YBCO, the in-plane resistivity is anisotropic because the CuO chains that run along the axis conduct. But in addition to this chain-related anisotropy, another anisotropy emerges upon cooling at low doping [Ando et al., 2002]. The onset of this additional anisotropy, which we will call nematicity, is at a temperature that runs parallel to , some 100 K below (Fig. 18). coincides with the inflexion point in [Cyr-Choinière et al., 2015], i.e. the white line that separates the red and blue regions in the curvature map of Fig. 6. Not surprisingly, this anisotropy is also detected in the Nernst coefficient [Cyr-Choinière et al., 2015].
Close to the line in the phase diagram at low doping, an anisotropy develops in the spin fluctuation spectrum, detected by inelastic neutron scattering as a splitting in the peak at = that appears for one direction and not the other [Haug et al., 2010]. This “spin nematicity” may be responsible for the transport anisotropy below .
Similarly, a “charge nematicity” is observed in the region of CDW order, at higher doping [Cyr-Choinière et al., 2015]. Here, the onset of nematicity occurs at [Daou et al., 2010]. In other words, at temperatures above the SDW and CDW orders, there is a region of enhanced nematic susceptibility, possibly associated with the precursor fluctuations of these two orders [Schütt and Fernandes, 2015].
There are three problems with equating this nematic phase with the pseudogap phase. The first is that at . The second is that nematic order does not open a gap (or a pseudogap). The third is that nematic order does not cause a change in carrier density, and so cannot explain the main signature of . But again, nematicity may well be a secondary instability of the pseudogap phase. Or the pseudogap may cause an enhanced nematic susceptibility [Okamoto et al., 2010].
VI.2.4 Intra-unit cell magnetic order
In the cuprates YBCO, Hg-1201 and Bi-2212, magnetic order has been detected by polarized neutron diffraction, with an onset temperature that coincides roughly with . This intra-unit-cell (IUC) order has a wavevector = . In Fig. 18, we reproduce the reported values of for YBCO [Fauqué et al., 2006; Sidis and Bourges, 2013; Mangin-Thro et al., 2017]. We see that in the range , = , within error bars. However, at lower doping ( ), the IUC signal weakens and it onsets at a significantly lower temperature: = K [Sidis and Bourges, 2013], while = K (Figs. 3 and 4). It has been suggested that the weakening of the IUC magnetic order in YBCO at low may be due to a competition with SDW order (or correlations) that develops below the CDW phase, i.e. at = . However, the pseudogap does not weaken at . Indeed, is higher in our sample with = , clearly below the CDW region (i.e. with a positive Hall coefficient at low ) [LeBoeuf et al., 2011], than it is in our sample with = , a doping above (Fig. 4).
A similar discrepancy is observed in LSCO at = , where = K, while = K (Fig. 19). This weakening at low suggests that the IUC magnetic order is more likely to be a secondary instability of the pseudogap phase, rather than its primary cause. Note that as in the case of nematic order, another = order, it is difficult to see how the IUC order can open a gap (or a pseudogap) and cause a change in carrier density across .
VI.3 Superconductivity
Unlike the four phases discussed previously, which are all confined to the left of (and below ), the superconducting phase extends beyond the pseudogap critical point. The region of superconductivity in the phase diagram of cuprates is always a dome, which starts at and ends at , at low and high doping, respectively. And this dome straddles , i.e. and , as we saw for YBCO, LSCO and Nd-LSCO (Fig. 17). The precise value of may depend on the material, as does the precise value of ; in LSCO and Nd-LSCO, , while in Tl-2201 [Bangura et al., 2010] and in Bi-2201 [Kondo et al., 2004].
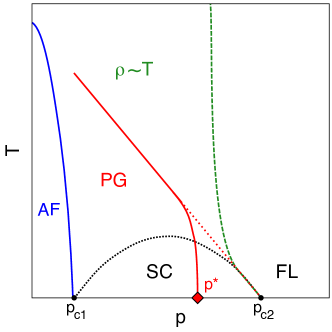
Coming from high , superconductivity with an order parameter of symmetry emerges out of a Fermi-liquid-like metallic state, characterized by a single large coherent hole-like Fermi surface [Vignolle et al., 2008], with no pseudogap and no broken symmetry of any kind. The big question is: what electron-electron interaction in this simple-looking state causes the electrons to pair? The phase diagrams in Fig. 17 may provide some clues. We already pointed out that a linear extrapolation of the line reaches = at , suggesting that the same interactions which favour pairing may also be responsible for the pseudogap.
It turns out that is also the onset of a third manifestation of electron-electron interactions: the appearance of a linear term in the temperature dependence of the resistivity , as sketched in Fig. 20. Detailed studies in overdoped Tl-2201 [Manako et al., 1992; Mackenzie et al., 1996; Proust et al., 2002] and LSCO [Cooper et al., 2009,Nakamae et al., 2003] reveal that a linear- term appears in as soon as , while at . This empirical link between linear- resistivity and [Abdel-Jawad et al., 2007] suggests that the interactions that cause the anomalous inelastic scattering also cause pairing [Taillefer, 2010]. A similar link has been observed in iron-based and organic superconductors [Doiron-Leyraud et al., 2009], materials whose phase diagrams consist of an antiferromagnetic quantum critical point (QCP) surrounded by a dome of superconductivity. In both cases, the scattering and the pairing are attributed to antiferromagnetic spin fluctuations.
In summary, three fundamental phenomena of cuprates emerge together below : superconductivity, pseudogap and anomalous scattering. (Strictly speaking, the pseudogap opens slightly below , at , but in some cases, such as Nd-LSCO and Bi-2201, the separation is small: = vs [Daou et al., 2009a], and = vs [Kawasaki et al., 2010,Kondo et al., 2004], respectively.) Fig. 20 suggests another way to summarize the situation. The two fundamental phases of cuprates – superconductivity and pseudogap – are both instabilities of a normal state that is characterized by a linear- resistivity. Given that a linear- resistivity is generally observed on the border of antiferromagnetic order and attributed to scattering by antiferromagnetic spin fluctuations, it is tempting to associate both the pseudogap and the -wave superconductivity in cuprates to antiferromagnetic correlations (perhaps short-ranged). In this scenario, the fact that falls at low while continues to rise (Fig. 17) is attributed to the competition suffered by the superconducting phase from the full sequence of other phases (Figs. 18 and 19): first, the pseudogap phase below , then the CDW, SDW and AF orders below , and , respectively.
VII Summary
We have shown how the quasiparticle and superconducting contributions to the Nernst effect in cuprates can be disentangled. We observe that the latter contribution is only significant in a narrow region of temperature above , which extends up to roughly , much as the region of paraconductivity observed in the resistivity. We showed how the quasiparticle Nernst signal can be used to detect the onset of the pseudogap phase, at a temperature . In YBCO, LSCO and Nd-LSCO, we find that = , the temperature below which the resistivity deviates from its linear- dependence at high temperature, a standard signature of the pseudogap temperature , consistent with ARPES measurements of the pseudogap. The advantage of using Nernst over resistivity is its much greater sensitivity to . By comparing Nernst data in three La2CuO4-based cuprates (LSCO, Nd-LSCO and Eu-LSCO), we find that they have the same line (up to ), independent of their different structures and structural transitions.
We arrive at the temperature-doping phase diagram of two major families of cuprates, YBCO and LSCO, which reveal some qualitative similarities and quantitative differences. Qualitatively, () decreases monotonically with in both families, along a line that stretches between at = , where is the Néel temperature for the onset of long-range commensurate antiferromagnetic order in the Mott insulator, and at = , where is the end point of the superconducting dome at high doping. These empirical links suggest that the pseudogap phase is related to antiferromagnetism and that pseudogap and pairing arise from the same interactions.
Quantitatively, we find that is 1.5 times larger in YBCO than in LSCO, as is (0). We also find that although is the same in LSCO and Nd-LSCO, the critical doping at which the pseudogap phase ends abruptly is much lower in LSCO, where , than in Nd-LSCO, where = . A possible explanation for this significant difference is the constraint that the pseudogap can only open once the Fermi surface has undergone its Lifshitz transition through the van Hove singularity, from a large electron-like surface above to a large hole-like surface below , i.e. the constraint that .
We briefly discussed four phases that occur inside the pseudogap phase, namely spin density wave (SDW), charge density wave (CDW), nematicity, and intra-unit-cell magnetic order. We conclude that all four are likely to be secondary instabilities of the pseudogap phase, as opposed to its driving mechanism or origin.
Finally, we show that the three primary phenomena of cuprates – the pseudogap, the -wave superconductivity and the anomalous metallic behaviour (linear- resistivity) – are found to all emerge together, below . In analogy with other families of materials – such as iron-based, heavy-fermion and organic superconductors – where linear- resistivity and superconductivity are observed on the border of antiferromagnetism, we suggest that antiferromagnetic spin fluctuations / correlations may play a common underlying role in these three phenomena.
VIII ACKNOWLEDGEMENTS
We thank D. Sénéchal and A.-M. Tremblay for useful discussions and J. Corbin for his assistance with the experiments. L.T. thanks ESPCI-ParisTech, Université Paris-Sud, CEA-Saclay and the Collège de France for their hospitality and support, and the European Research Council (Grant ERC-319286 QMAC)and LABEX PALM (ANR-10-LABX-0039-PALM) for their support, while this article was written. O.C.C. was supported by a fellowship from the Natural Sciences and Engineering Research Council of Canada (NSERC). J.C. was supported by a fellowship from the Swiss National Science foundation. J.-S.Z. and J.B.G. were supported by a US National Science Foundation grant. H.T. acknowledges MEXT Japan for a Grant-in-Aid for Scientific Research. R.L., D.A.B. and W.N.H. acknowledge funding from the Natural Sciences and Engineering Research Council of Canada (NSERC). L.T. acknowledges support from the Canadian Institute for Advanced Research (CIFAR) and funding from the Natural Sciences and Engineering Research Council of Canada (NSERC; PIN:123817), the Fonds de recherche du Québec - Nature et Technologies (FRQNT), the Canada Foundation for Innovation (CFI), and a Canada Research Chair. Part of this work was funded by the Gordon and Betty Moore Foundation’s EPiQS Initiative (Grant GBMF5306 to L.T.).
IX APPENDIX
Nernst signal from superconducting fluctuations
In this Article, our main focus is on the quasiparticle Nernst signal and how it can be used to detect the onset of the pseudogap phase. We only discussed briefly how that signal can be disentangled from the superconducting Nernst signal. In this Appendix, we provide further information on the superconducting Nernst signal in cuprates. We focus on the field dependence of as a way to isolate in YBCO and LSCO. We end by analyzing how prior interpretations of the Nernst effect in cuprates led to the mistaken notion that essentially all the Nernst signal above is due to superconducting fluctuations.
IX.1 Gaussian fluctuations
Recent Nernst measurements in the electron-doped cuprate PCCO have been used to show that a Gaussian theory of superconducting fluctuations can account qualitatively and quantitatively for the observed superconducting signal [Tafti et al., 2014]. Because is very small in PCCO (at most 10 T), one can fully suppress superconducting fluctuations by applying a field T. This enables one to directly obtain , which can then be subtracted from to get , and compare this to theory [Ussishkin et al., 2002; Serbyn et al., 2009; Michaeli and Finkel’stein, 2009].
The authors find no difference in the nature of the superconducting fluctuations on the underdoped side of the dome relative to the overdoped side [Tafti et al., 2014]. This shows that the decrease of at low doping is not due to a growth of phase fluctuations, as originally proposed [Emery and Kivelson, 1995]. Rather, the drop in below optimal doping is associated with the critical point where the Fermi surface of PCCO undergoes a reconstruction [Dagan et al., 2004].
A similar study was performed in the hole-doped cuprate Eu-LSCO, in the underdoped regime [Chang et al., 2012a]. The Nernst signal is here also found to agree with Gaussian theory, as in more conventional superconductors, such as NbSi [Pourret et al., 2006].
We note, however, that spectroscopic studies of ARPES [Reber et al., 2013,Kondo et al., 2015] and STM [Lee et al., 2009,Gomes et al., 2007] (see section IX.3.4) show a superconducting gap persisting well above – a fact that is hard to reconcile with Gaussian (amplitude) fluctuations.
The quantitative question of how far in temperature (or in magnetic field) superconducting fluctuations extend above (or above ) is in some sense meaningless, for it clearly depends on the sensitivity of the probe. In NbSi, for example, a superconducting Nernst signal was detected up to 30 and 5 [Pourret et al., 2006]. Nevertheless, because the extent of the fluctuation regime in cuprate superconductors has been the subject of much debate, we further explore that question in the following sections. We emphasize that in this article no assumption is made about the nature of the SC fluctuations above nor is any use made of Gaussian theory. Readers interested in learning whether Gaussian theory can describe the SC fluctuations measured in cuprates are referred to Refs. Tafti et al., 2014 and Chang et al., 2012a.
IX.2 Field dependence and
In YBCO, the separation of quasiparticle and superconducting contributions is straightforward because the former is negative (below ) and the latter is positive. In Fig. 2, the minimum in / vs at provides an immediate measure of the temperature below which the superconducting signal becomes important. A plot of vs on the phase diagram reveals that the region of significant superconducting fluctuations closely tracks , with (Fig. 3). The same conclusion is reached by looking at the paraconductivity in the resistivity, as seen in the curvature map of Fig. 6. This proves the essential point, that the pseudogap phase is not a phase of precursor superconductivity. There is no evidence from Nernst data that short-lived Cooper pairs start to form at .
The limitation is that cannot be defined for a cuprate with , like LSCO. We therefore turn to another, more general criterion, based on the field dependence of . Indeed, because always decreases with increasing , we can say that when is independent of field, then is negligible compared to . We define to be the temperature above which no longer decreases with .
IX.2.1 YBCO
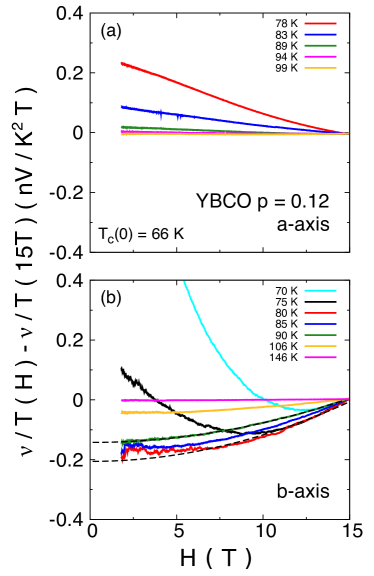
Fig. 21 shows / vs for YBCO at doping = at different temperatures above = K. Note that the value of / at the maximum field ( T) is subtracted from the isotherms to remove most of the quasiparticle contribution. Let us first examine the -axis data (panel (a)). For K, the field is seen to suppress , as expected. For K, however, there is negligible field dependence. Using the lack of a detectable field dependence to define , we get = K, in agreement with = K in that sample (Fig. 3).
In panel (b) of Fig. 21, we show the -axis isotherms in YBCO at = . At = K (pale blue curve) and = K (black curve), we see clearly that the field suppresses the superconducting signal. But it also causes a positive rise in , thereby producing a minimum in vs . We attribute this positive “magneto-resistance”, which grows as (or as if plotted as vs ), to the quasiparticle component of the Nernst signal [Tafti et al., 2014]. (All odd (even) powers of are allowed by symmetry in ).) The dependence is best seen at = K (green curve), where / vs is perfectly described by a quadratic fit (dashed line in Fig. 21). (It is possible that the same contribution is in fact present in the -axis data, but with a much reduced magnitude, perhaps in proportion with the ten-time smaller quasiparticle signal [Daou et al., 2010].) At low , a superconducting signal is seen above the background (dashed line) at = K, for example. For the -axis isotherms, we define to be the temperature above which is purely quadratic, giving = K for this doping, in agreement, within error bars, with the value obtained from the -axis isotherms.
In summary, we find that = at = , as also found at other nearby dopings (Fig. 3). Note that this is consistent with the onset of paraconductivity in the DC resistivity (Fig. 6) and microwave conductivity (see sec. IX.3.3).
IX.2.2 LSCO
In order to delineate the region of significant superconducting fluctuations in LSCO, we can use paraconductivity, as was done for YBCO. In Fig. 16, we see that the onset of paraconductivity in LSCO occurs at a temperature between 50 K and 65 K, in the range [Ando et al., 2004]. (Note that the weak dependence of may come from some inhomogeneity in doping, whereby parts of all samples have some optimally-doped regions, where is highest.) At optimal doping, where = K, K, so that .
It is harder to disentangle superconducting and quasiparticle contributions to the Nernst signal in LSCO-based materials because unlike YBCO the quasiparticle contribution also rises positively with decreasing temperature, so there is no equivalent of . We therefore use the lack of a detectable field dependence to define , as our criterion for the onset of superconducting fluctuations. Fig. 22 shows as a function of magnetic field for LSCO at three dopings ( et ), at . We can extract from these curves as the temperature above which the isotherms are flat: = and K for = et , respectively. We note that the available data is limited to 10 T and it would be interesting to see if this linearity can be tracked at higher fields. is then plotted as a function of doping on the curvature map of LSCO (Fig. 16). It is seen to fall more or less on the boundary of the paraconductivity region (blue band above ), i.e. .
IX.2.3 Comparing LSCO to Nd-LSCO
Another approach for disentangling and in LSCO is to compare with Nd-LSCO, its lower- counterpart, at the same doping. As seen in Fig. 23(a), at high temperature is essentially identical in LSCO and Nd-LSCO, and it is not due to superconducting fluctuations. Therefore, comparing the two materials should reveal the onset of a detectable superconducting contribution in LSCO, since its is higher than in Nd-LSCO. Fig. 23(a) compares LSCO and Nd-LSCO at = , using data from Ref. [Fujii et al., 2010], where = K and K, respectively. Down to 50 K or so, the data are nearly identical, even through the LTT structural transition of Nd-LSCO (at 70 K). Below 50 K, the two curves deviate, with the LSCO curve showing a pronounced superconducting peak. This difference between the two curves (shaded region in Fig. 23(a)) can be seen as the superconducting contribution of LSCO. Fig. 23(b) plots this difference between the two data sets (normalized at maximum value) vs / , with = K (in LSCO). In the inset, a zoom shows that the difference becomes non-zero below . This puts a reasonable upper bound on a detectable superconducting Nernst signal in LSCO.
We conclude that the regime of significant superconducting fluctuations in LSCO extends up to , with the error bar covering the various criteria (paraconductivity in the resistivity, field independence in the Nernst signal, comparison to Nd-LSCO).
IX.3 Other probes and materials
IX.3.1 Nernst effect in Bi-2201 and Hg-1201
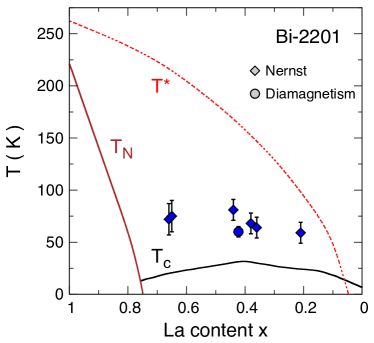
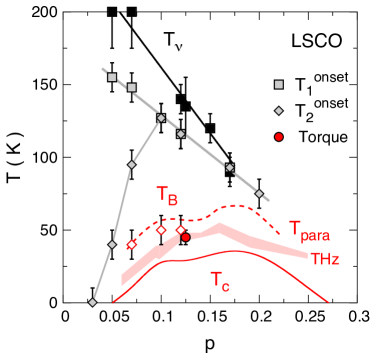
In this Article on the Nernst effect in cuprates, we have focused on YBCO and LSCO (as well as Nd-LSCO and Eu-LSCO). Now, studies of the Nernst effect have also been carried out on other cuprates, such as Bi-2212 and Bi-2201. They lead to the same basic finding that the regime of SC fluctuations tracks and ends well below the pseudogap temperature . In Fig. 24, we plot the temperature below which the Nernst signal in Bi-2201 becomes detectable in the data of ref. Okada et al., 2010. Note that is necessarily an upper bound on the regime of SC fluctuations. Looking closely at the data across the doping range, one finds no trace of any signal above K. As discussed below (sec. IX.3.2), this value is consistent with the upper limit on detectable SC fluctuations in torque magnetometry data on Bi-2201. What is clear from Fig. 24 is that in Bi-2201 is flat vs doping, with K across the phase diagram, whereas rises with underdoping, to values as high as K at low doping. This is therefore very similar to the phase diagram of LSCO shown in Fig. 26. Both LSCO and Bi-2201 lead us to the same conclusion as reached for YBCO: the regime of SC fluctuations tracks , and it lies well below the pseudogap temperature .
As for YBCO, Nernst measurements on Hg-1201 have the advantage of a negative quasiparticle signal, so that the onset of SC fluctuations can immediately be detected as a minimum occurring at . For a sample with = K, = 5 K [Doiron-Leyraud et al., 2013]. In Fig. 25, we show how this compares to the values in YBCO, where for the same one gets = K (Fig. 3).
IX.3.2 Torque magnetometry
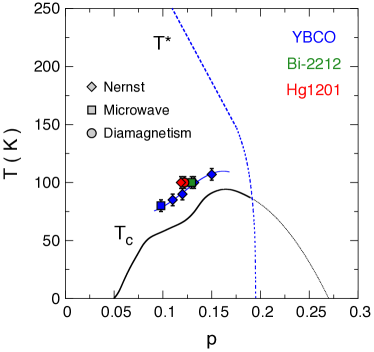
In this Article, we have seen that the resistivity and the Nernst coefficient can both be used to detect the onset of SC fluctuations above . Magnetization is another probe of such fluctuations, and torque magnetometry measurements have been carried out on several cuprates. Detailed high-sensitivity torque measurements of three different cuprates [Yu et al., 2012,Yu et al., 2017] reveal that SC fluctuations can no longer be detected above = K in LSCO at = (in good agreement with = K; see Fig. 26), = K in Bi-2201 at optimal doping (in good agreement with 65 K; see Fig. 24), and = K in underdoped Hg-1201 (in good agreement with = K; see Fig. 25).
IX.3.3 Microwave and THz conductivity
SC fluctuations can also be detected via measurements at microwave and THz frequencies. In a seminal study using microwave measurements, Corson and co-workers detected SC fluctuations in an underdoped sample of Bi-2212 with = K up to at most = K [Corson et al., 1999]. As shown in Fig. 25, this upper limit for the fluctuation regime in Bi-2212 agrees perfectly with = K measured in YBCO for the same value of . More recent microwave measurements on YBCO itself [Grbić et al., 2011] confirm the excellent agreement with (Fig. 25).
Measurements on LSCO at THz frequencies find that the regime of SC fluctuations tracks closely, as displayed in Fig. 26, in excellent agreement with the torque magnetization and with from the Nernst effect.
IX.3.4 ARPES and STM
Although some ARPES studies (e.g. [Lee et al., 2007]) find that the superconducting gap closes at , other studies find a superconducting gap persisting above . For example, Reber and co-workers argue that in underdoped Bi-2212 such a gap extrapolates to zero only at = [Reber et al., 2013], an observation confirmed by a recent high-resolution laser-ARPES study [Kondo et al., 2015]. This is roughly consistent with the microwave data mentioned in the previous section.
STM studies on Bi-2212 also find superconductivity persisting above [Lee et al., 2009], in one case [Gomes et al., 2007] up to temperatures much higher than the limit imposed by the ARPES and microwave data.
IX.4 The Princeton interpretation
Following the seminal work of the Princeton group in the period 2000 - 2006 [Wang et al., 2006,Ong et al., 2004,Xu et al., 2000,Wang et al., 2001,Wang et al., 2002,Wang et al., 2003], the Nernst effect in cuprates has been widely attributed to superconducting fluctuations, and in the underdoped regime those have been mostly interpreted as phase fluctuations, detectable in some cases up to . This has been viewed as evidence that short-lived Cooper pairs without phase coherence form at temperatures well above . In this Article, we have argued that the superconducting Nernst signal does not, in fact, extend very far above , becoming negligible above . Moreover, recent studies suggest that even in the underdoped regime these fluctuations are not phase fluctuations, but rather Gaussian fluctuations of both the amplitude and the phase of the order parameter [Chang et al., 2012a,Tafti et al., 2014]. (Phase fluctuations may appear at very low doping.)
In this section, we examine the analysis performed by the Princeton group to understand why their interpretation is different from our own. We emphasize that the data themselves are perfectly consistent amongst the various groups, so that the disagreement is on the analysis and interpretation only. This discussion will focus on LSCO data.
A first difference in the analysis lies in the definition of the onset temperature. The Princeton group defines the onset of the low-temperature rise in the Nernst signal of LSCO (and other cuprates) as the temperature below which (rather than / ) starts to rise upon cooling. In general, this is not equal to our (defined as the temperature below which / starts to rise). For example, data on LSCO at = , plotted as vs in Fig. 23(a), yield K, while we get = K from the same data plotted as / vs (Fig. 13).
As shown in Fig. 26, a plot of vs (, open squares [Xu et al., 2000]) yields a line that is qualitatively similar to the line in Fig. 10full squares in Fig. 26), but slightly lower. Although the difference is not huge, it is nevertheless significant, and adopting the correct definition is important to arrive at a meaningful onset temperature.
For the same reason that one should plot / , / and / when analyzing the specific heat , thermal conductivity and thermopower of a metal, one should plot / rather than when analyzing the Nernst coefficient (see Eq. 2). Because the laws of thermodynamics require that all four quantities (, , and ) go to zero as , the negative observed at high in LSCO (Fig. 23(a)) must inevitably rise upon cooling, but this rise may not reflect any change in the electronic behaviour. This point is illustrated by the data on Nd-LSCO at = (Fig. 11), which show a monotonic decrease of / vs as . There is no upturn and so = . The absence of a pseudogap temperature (or any other characteristic temperature) is confirmed by the fact that the resistivity is featureless and perfectly linear below 50 K (Fig. 5(d)). By contrast, if we were to plot vs instead, we would necessarily obtain , suggesting that there is a meaningful crossover, in contradiction with the featureless . Furthermore, the good agreement between and for both YBCO (Fig. 3) and Nd-LSCO (Fig. 10) validates the use of / to define the onset of the change in at high temperature.
Beyond the issue of the correct definition (whether or ), the real question is what causes to initially rise upon cooling below ? We attribute the initial rise in = + (coming down from high temperature) to a change in the quasiparticle component , while the Princeton group attributes this rise to a growth in the superconducting component . In 2000, this was their interpretation for all dopings [Xu et al., 2000], down to = , their lowest doping (Fig. 26).
In 2001, they realized that this interpretation is incorrect at low doping [Wang et al., 2001], by examining the behavior of + , where = / is the mobility and is the Seebeck coefficient. At = , they recognized that the initial rise in from high temperature, reaching nV / KT at = K is in fact due to an increase in the quasiparticle term . Only below 40 K is there an additional rise coming from superconducting fluctuations. They therefore revised the estimated temperature for the onset of superconducting fluctuations from = K [Xu et al., 2000] down to = K [Wang et al., 2001] (see Fig. 26). However, the Princeton group adopted the view that such a revision was only needed for , arguing that any rise in is negligible for . This is where we disagree. At = , also rises up to nV / KT at = K [Xu et al., 2000], a rise that is very similar to the above-mentioned rise seen at = . Why, then, would the rise in at = not also come from ? A rough estimate of can be obtained by looking at [Behnia, 2009]. The Princeton data shows that at = K is actually larger at = , not smaller. Indeed, nV / KT (Fig. 3a, ref. Xu et al., 2000), while nV / KT at = (Fig. 3b, ref. Wang et al., 2001). Moreover, the measured is comparable, namely = nV / KT at both dopings = and = . There numbers show clearly that there is no reason to assume that can be neglected at = .
We see that in LSCO, just as in Eu-LSCO (see Fig. 8c) and Nd-LSCO (see Fig. 9), the initial rise in , below , is in fact due to , and the rise in only starts at much lower temperature.
Not surprisingly, the fact of using different criteria for for dopings above and below = causes a sharp change in at that doping, producing an artifical peak at = (see ; grey diamonds in Fig. 26). The resulting line has no clear relation to the real onset of superconducting fluctuations. For example, the peak value, at = , is = K, whereas at that doping the onset of paraconductivity occurs at K (Fig. 16) and the onset of field dependence in occurs at = K (Fig. 22). Moreover, the onset of superconducting fluctuations detected in both THz conductivity (sec. IX.3.3) and torque magnetization (sec. IX.3.2) is K (Fig. 26).
In summary, the widely used Nernst phase diagram of vs in LSCO (Fig. 26) does not correspond to the region of superconducting fluctuations in LSCO.
The Princeton group has also used torque magnetometry as a separate way to detect superconducting fluctuations above [Li et al., 2010]. They define an onset temperature of diamagnetism (from superconducting fluctuations), , as the temperature below which the magnetization (or susceptibility) deviates downwards, towards negative values, from a positive paramagnetic background presumed to have a linear temperature dependence. The values of they extract as a function of doping agree with the vs in Fig. 26. They argue that this reinforces their interpretation of as being the onset of superconducting fluctuations above in the phase diagram [Li et al., 2010].
The assumption of a linear-in-temperature magnetization background has been questioned [Yu et al., 2015,Yu et al., 2012,Yu et al., 2017]. In particular, it neglects the effect of the pseudogap phase on the paramagnetic susceptibility [Yu et al., 2015]. (To attribute a downward drop in the susceptibility from its linear- dependence at high to diamagnetism is a bit like attributing the downward drop in the resistivity of YBCO from its linear- dependence at (Fig. 5(a)) to paraconductivity.) To properly identify the diamagnetism that comes from superconductivity, Yu and coworkers [Yu et al., 2012,Yu et al., 2017] used its non-linear field dependence (and the emergence of higher harmonics in its angular dependence). This is similar to our definition of from the Nernst signal. With this criterion, Yu et al. find that superconducting fluctuations are significant (in the magnetization signal) only in a narrow temperature region above the superconducting dome, up to at most , in LSCO, Bi-2201 and Hg-1201 [Yu et al., 2012,Yu et al., 2017]. This narrow regime of SC fluctuations, much narrower than that reported by the Princeton group, is consistent with several probes ( from Nernst, paraconductivity from DC resistivity, microwave and THz conductivity) applied to several cuprates (YBCO, LSCO, Bi-2201, Bi-2212, Hg-1201), as shown in Figs. 24, 25 and 26.
Note that the field and temperature dependence of the magnetization data by the Princeton group can be explained in terms of a Gaussian Ginzburg-Landau approach [Rey et al., 2013]. The theory of Gaussian superconducting fluctuations was also shown to provide a valid quantitative description of diamagnetism data in YBCO [Kokanović et al., 2013]. We conclude that the scenario of strong phase fluctuations in underdoped cuprates is neither supported by Nernst data nor by magnetization data, except perhaps close to = .
IX.5 Summary
To summarize this Appendix, several different measurements and properties, including the Nernst effect, paraconductivity, magnetization, terahertz spectroscopy, and microwave conductivity – applied to a variety of materials, including YBCO, LSCO, Bi-2201, Bi-2212, Hg-1201 – point to the same conclusion: significant superconducting fluctuations are present in cuprates only in a temperature interval close to , and well below .
References
- Damascelli et al. (2003) A. Damascelli, Z. Hussain, and Z.-X. Shen, Rev. Mod. Phys. 75, 473 (2003).
- Daou et al. (2009a) R. Daou, N. Doiron-Leyraud, D. LeBoeuf, S. Y. Li, F. Laliberté, O. Cyr-Choinière, Y. J. Jo, L. Balicas, J.-Q. Yan, J.-S. Zhou, J. B. Goodenough, and L. Taillefer, Nat. Phys. 5, 31 (2009a).
- Collignon et al. (2017) C. Collignon, S. Badoux, S. A. A. Afshar, B. Michon, F. Laliberté, O. Cyr-Choinière, J.-S. Zhou, S. Licciardello, S. Wiedmann, N. Doiron-Leyraud, and L. Taillefer, Phys. Rev. B 95, 224517 (2017).
- Cyr-Choinière et al. (2010) O. Cyr-Choinière, R. Daou, J. Chang, F. Laliberté, N. Doiron-Leyraud, D. LeBoeuf, Y. J. Jo, L. Balicas, J.-Q. Yan, J.-G. Cheng, J.-S. Zhou, J. B. Goodenough, and L. Taillefer, Physica C 470, S12 (2010), proceedings of the 9th International Conference on Materials and Mechanisms of Superconductivity.
- Matt et al. (2015) C. E. Matt, C. G. Fatuzzo, Y. Sassa, M. Månsson, S. Fatale, V. Bitetta, X. Shi, S. Pailhès, M. H. Berntsen, T. Kurosawa, M. Oda, N. Momono, O. J. Lipscombe, S. M. Hayden, J.-Q. Yan, J.-S. Zhou, J. B. Goodenough, S. Pyon, T. Takayama, H. Takagi, L. Patthey, A. Bendounan, E. Razzoli, M. Shi, N. C. Plumb, M. Radovic, M. Grioni, J. Mesot, O. Tjernberg, and J. Chang, Phys. Rev. B 92, 134524 (2015).
- Badoux et al. (2016a) S. Badoux, W. Tabis, F. Laliberté, G. Grissonnanche, B. Vignolle, D. Vignolles, J. Béard, D. A. Bonn, W. N. Hardy, R. Liang, L. Doiron-Leyraud, N. Taillefer, and C. Proust, Nature 531, 210 (2016a).
- Tallon and Loram (2001) J. Tallon and J. Loram, Physica C 349, 53 (2001).
- Rullier-Albenque et al. (2011) F. Rullier-Albenque, H. Alloul, and G. Rikken, Phys. Rev. B 84, 014522 (2011).
- Boebinger et al. (1996) G. S. Boebinger, Y. Ando, A. Passner, T. Kimura, M. Okuya, J. Shimoyama, K. Kishio, K. Tamasaku, N. Ichikawa, and S. Uchida, Phys. Rev. Lett. 77, 5417 (1996).
- Cooper et al. (2009) R. A. Cooper, Y. Wang, B. Vignolle, O. J. Lipscombe, S. M. Hayden, Y. Tanabe, T. Adachi, Y. Koike, M. Nohara, H. Takagi, C. Proust, and N. E. Hussey, Science 323, 603 (2009).
- Laliberté et al. (2016) F. Laliberté, W. Tabis, S. Badoux, B. Vignolle, D. Destraz, N. Momono, T. Kurosawa, K. Yamada, H. Takagi, N. Doiron-Leyraud, C. Proust, and L. Taillefer, arXiv 1606.04491 (2016).
- Ando et al. (2004) Y. Ando, S. Komiya, K. Segawa, S. Ono, and Y. Kurita, Phys. Rev. Lett. 93, 267001 (2004).
- Hussey et al. (2011) N. E. Hussey, R. A. Cooper, X. Xu, Y. Wang, I. Mouzopoulou, B. Vignolle, and C. Proust, Philosophical Transactions of the Royal Society of London A: Mathematical, Physical and Engineering Sciences 369, 1626 (2011).
- Kondo et al. (2011) T. Kondo, Y. Hamaya, A. D. Palczewski, T. Takeuchi, J. S. Wen, Z. J. Xu, G. Gu, J. Schmalian, and A. Kaminski, Nat. Phys. 7, 21 (2011).
- Vishik et al. (2012) I. M. Vishik, M. Hashimoto, R.-H. He, W.-S. Lee, F. Schmitt, D. Lu, R. G. Moore, C. Zhang, W. Meevasana, T. Sasagawa, S. Uchida, K. Fujita, S. Ishida, M. Ishikado, Y. Yoshida, H. Eisaki, Z. Hussain, T. P. Devereaux, and Z.-X. Shen, Proc. Natl. Acad. Sci. U.S.A. 109, 18332 (2012).
- He et al. (2014) Y. He, Y. Yin, M. Zech, A. Soumyanarayanan, M. M. Yee, T. Williams, M. C. Boyer, K. Chatterjee, W. D. Wise, I. Zeljkovic, T. Kondo, T. Takeuchi, H. Ikuta, P. Mistark, R. S. Markiewicz, A. Bansil, S. Sachdev, E. W. Hudson, and J. E. Hoffman, Science 344, 608 (2014).
- Kawasaki et al. (2010) S. Kawasaki, C. Lin, P. L. Kuhns, A. P. Reyes, and G.-q. Zheng, Phys. Rev. Lett. 105, 137002 (2010).
- Fujita et al. (2014) K. Fujita, C. K. Kim, I. Lee, J. Lee, M. H. Hamidian, I. A. Firmo, S. Mukhopadhyay, H. Eisaki, S. Uchida, M. J. Lawler, E.-A. Kim, and J. C. Davis, Science 344, 612 (2014).
- Benhabib et al. (2015) S. Benhabib, A. Sacuto, M. Civelli, I. Paul, M. Cazayous, Y. Gallais, M.-A. Méasson, R. D. Zhong, J. Schneeloch, G. D. Gu, D. Colson, and A. Forget, Phys. Rev. Lett. 114, 147001 (2015).
- Daou et al. (2010) R. Daou, J. Chang, D. LeBoeuf, O. Cyr-Choinière, F. Laliberté, N. Doiron-Leyraud, B. J. Ramshaw, R. Liang, D. A. Bonn, W. N. Hardy, and L. Taillefer, Nature 463, 519 (2010).
- Doiron-Leyraud et al. (2013) N. Doiron-Leyraud, S. Lepault, O. Cyr-Choinière, B. Vignolle, G. Grissonnanche, F. Laliberté, J. Chang, N. Barišić, M. K. Chan, L. Ji, X. Zhao, Y. Li, M. Greven, C. Proust, and L. Taillefer, Phys. Rev. X 3, 021019 (2013).
- Behnia (2009) K. Behnia, J. Phys.: Condens. Matter 21, 113101 (2009).
- Behnia (2015) K. Behnia, Fundamentals of Thermoelectricity (Oxford University Press, 2015).
- Behnia and Aubin (2016) K. Behnia and H. Aubin, Rep. Prog. Phys. 79, 046502 (2016).
- Huebner (1979) R. P. Huebner, Magnetic Flux Structures in Superconductors (Berlin: Springer, 1979).
- Wang et al. (2006) Y. Wang, L. Li, and N. P. Ong, Phys. Rev. B 73, 024510 (2006).
- Chang et al. (2012a) J. Chang, N. Doiron-Leyraud, O. Cyr-Choiniere, G. Grissonnanche, F. Laliberté, E. Hassinger, J.-P. Reid, R. Daou, S. Pyon, T. Takayama, H. Takagi, and L. Taillefer, Nat. Phys. 8, 751 (2012a).
- Li and Greene (2007) P. Li and R. L. Greene, Phys. Rev. B 76, 174512 (2007).
- Cyr-Choinière et al. (2009) O. Cyr-Choinière, R. Daou, F. Laliberté, D. LeBoeuf, N. Doiron-Leyraud, J. Chang, J.-Q. Yan, J.-G. Cheng, J.-S. Zhou, J. B. Goodenough, S. Pyon, T. Takayama, H. Takagi, Y. Tanaka, and L. Taillefer, Nature 458, 743 (2009).
- Bel et al. (2004) R. Bel, H. Jin, K. Behnia, J. Flouquet, and P. Lejay, Phys. Rev. B 70, 220501 (2004).
- Hassinger et al. (2008) E. Hassinger, G. Knebel, K. Izawa, P. Lejay, B. Salce, and J. Flouquet, Phys. Rev. B 77, 115117 (2008).
- Liang et al. (2012) R. Liang, D. A. Bonn, and W. N. Hardy, Philosophical Magazine 92, 2563 (2012).
- Liang et al. (2006) R. Liang, D. A. Bonn, and W. N. Hardy, Phys. Rev. B 73, 180505 (2006).
- Rullier-Albenque et al. (2006) F. Rullier-Albenque, R. Tourbot, H. Alloul, P. Lejay, D. Colson, and A. Forget, Phys. Rev. Lett. 96, 067002 (2006).
- Ito et al. (1993) T. Ito, K. Takenaka, and S. Uchida, Phys. Rev. Lett. 70, 3995 (1993).
- Rullier-Albenque et al. (2008) F. Rullier-Albenque, H. Alloul, F. Balakirev, and C. Proust, EPL (Europhysics Letters) 81, 37008 (2008).
- Ono et al. (2000) S. Ono, Y. Ando, T. Murayama, F. F. Balakirev, J. B. Betts, and G. S. Boebinger, Phys. Rev. Lett. 85, 638 (2000).
- Momono et al. (1994) N. Momono, M. Ido, T. Nakano, M. Oda, Y. Okajima, and K. Yamaya, Physica C: Superconductivity 233, 395 (1994).
- Bergeron et al. (2011) D. Bergeron, V. Hankevych, B. Kyung, and A.-M. S. Tremblay, Phys. Rev. B 84, 085128 (2011).
- Ong et al. (2004) N. Ong, Y. Wang, S. Ono, Y. Ando, and S. Uchida, Annalen der Physik 13, 9 (2004).
- Sordi et al. (2012) G. Sordi, P. Sémon, K. Haule, and A.-M. Tremblay, Sci. Rep. 2, 547 (2012).
- Xu et al. (2000) Z. A. Xu, N. P. Ong, Y. Wang, T. Kakeshita, and S. Uchida, Nature 406, 486 (2000).
- Fujii et al. (2010) T. Fujii, T. Matsushima, T. Maruoka, and A. Asamitsu, Physica C 470, S21 (2010), proceedings of the 9th International Conference on Materials and Mechanisms of Superconductivity.
- Wang et al. (2001) Y. Wang, Z. A. Xu, T. Kakeshita, S. Uchida, S. Ono, Y. Ando, and N. P. Ong, Phys. Rev. B 64, 224519 (2001).
- Ichikawa et al. (2000) N. Ichikawa, S. Uchida, J. M. Tranquada, T. Niemöller, P. M. Gehring, S.-H. Lee, and J. R. Schneider, Phys. Rev. Lett. 85, 1738 (2000).
- Yoshida et al. (2009) T. Yoshida, M. Hashimoto, S. Ideta, A. Fujimori, K. Tanaka, N. Mannella, Z. Hussain, Z.-X. Shen, M. Kubota, K. Ono, S. Komiya, Y. Ando, H. Eisaki, and S. Uchida, Phys. Rev. Lett. 103, 037004 (2009).
- Hackl and Vojta (2009) A. Hackl and M. Vojta, Phys. Rev. B 80, 220514 (2009).
- Hackl et al. (2010) A. Hackl, M. Vojta, and S. Sachdev, Phys. Rev. B 81, 045102 (2010).
- Daou et al. (2009b) R. Daou, O. Cyr-Choinière, F. Laliberté, D. LeBoeuf, N. Doiron-Leyraud, J.-Q. Yan, J.-S. Zhou, J. B. Goodenough, and L. Taillefer, Phys. Rev. B 79, 180505 (2009b).
- Tranquada et al. (1997) J. M. Tranquada, J. D. Axe, N. Ichikawa, A. R. Moodenbaugh, Y. Nakamura, and S. Uchida, Phys. Rev. Lett. 78, 338 (1997).
- Hunt et al. (2001) A. W. Hunt, P. M. Singer, A. F. Cederström, and T. Imai, Phys. Rev. B 64, 134525 (2001).
- Axe and Crawford (1994) J. D. Axe and M. K. Crawford, Journal of Low Temperature Physics 95, 271 (1994).
- Keimer et al. (1992) B. Keimer, N. Belk, R. J. Birgeneau, A. Cassanho, C. Y. Chen, M. Greven, M. A. Kastner, A. Aharony, Y. Endoh, R. W. Erwin, and G. Shirane, Phys. Rev. B 46, 14034 (1992).
- Hess et al. (2010) C. Hess, E. M. Ahmed, U. Ammerahl, A. Revcolevschi, and B. Büchner, Eur. Phys. J. Spec. Top. 188, 103 (2010).
- Fink et al. (2011) J. Fink, V. Soltwisch, J. Geck, E. Schierle, E. Weschke, and B. Büchner, Phys. Rev. B 83, 092503 (2011).
- Brewer et al. (1988) J. H. Brewer, E. J. Ansaldo, J. F. Carolan, A. C. D. Chaklader, W. N. Hardy, D. R. Harshman, M. E. Hayden, M. Ishikawa, N. Kaplan, R. Keitel, J. Kempton, R. F. Kiefl, W. J. Kossler, S. R. Kreitzman, A. Kulpa, Y. Kuno, G. M. Luke, H. Miyatake, K. Nagamine, Y. Nakazawa, N. Nishida, K. Nishiyama, S. Ohkuma, T. M. Riseman, G. Roehmer, P. Schleger, D. Shimada, C. E. Stronach, T. Takabatake, Y. J. Uemura, Y. Watanabe, D. L. Williams, T. Yamazaki, and B. Yang, Phys. Rev. Lett. 60, 1073 (1988).
- Hücker et al. (1999) M. Hücker, V. Kataev, J. Pommer, J. Harraß, A. Hosni, C. Pflitsch, R. Gross, and B. Büchner, Phys. Rev. B 59, R725 (1999).
- Kaminski et al. (2006) A. Kaminski, S. Rosenkranz, H. M. Fretwell, M. R. Norman, M. Randeria, J. C. Campuzano, J.-M. Park, Z. Z. Li, and H. Raffy, Phys. Rev. B 73, 174511 (2006).
- Yoshida et al. (2006) T. Yoshida, X. J. Zhou, K. Tanaka, W. L. Yang, Z. Hussain, Z.-X. Shen, A. Fujimori, S. Sahrakorpi, M. Lindroos, R. S. Markiewicz, A. Bansil, S. Komiya, Y. Ando, H. Eisaki, T. Kakeshita, and S. Uchida, Phys. Rev. B 74, 224510 (2006).
- Nie et al. (2017) L. Nie, A. V. Maharaj, E. Fradkin, and S. A. Kivelson, arXiv 1701.02751 (2017).
- Khaykovich et al. (2005) B. Khaykovich, S. Wakimoto, R. J. Birgeneau, M. A. Kastner, Y. S. Lee, P. Smeibidl, P. Vorderwisch, and K. Yamada, Phys. Rev. B 71, 220508 (2005).
- Chang et al. (2008a) J. Chang, C. Niedermayer, R. Gilardi, N. B. Christensen, H. M. Rønnow, D. F. McMorrow, M. Ay, J. Stahn, O. Sobolev, A. Hiess, S. Pailhes, C. Baines, N. Momono, M. Oda, M. Ido, and J. Mesot, Phys. Rev. B 78, 104525 (2008a).
- Kimura et al. (2003) H. Kimura, M. Kofu, Y. Matsumoto, and K. Hirota, Phys. Rev. Lett. 91, 067002 (2003).
- Panagopoulos et al. (2003) C. Panagopoulos, J. Tallon, B. Rainford, J. Cooper, C. Scott, and T. Xiang, Solid State Commun. 126, 47 (2003), proceedings of the High-Tc Superconductivity Workshop.
- Panagopoulos et al. (2004) C. Panagopoulos, A. P. Petrovic, A. D. Hillier, J. L. Tallon, C. A. Scott, and B. D. Rainford, Phys. Rev. B 69, 144510 (2004).
- Hücker et al. (2014) M. Hücker, N. B. Christensen, A. T. Holmes, E. Blackburn, E. M. Forgan, R. Liang, D. A. Bonn, W. N. Hardy, O. Gutowski, M. v. Zimmermann, S. M. Hayden, and J. Chang, Phys. Rev. B 90, 054514 (2014).
- Blanco-Canosa et al. (2014) S. Blanco-Canosa, A. Frano, E. Schierle, J. Porras, T. Loew, M. Minola, M. Bluschke, E. Weschke, B. Keimer, and M. Le Tacon, Phys. Rev. B 90, 054513 (2014).
- LeBoeuf et al. (2011) D. LeBoeuf, N. Doiron-Leyraud, B. Vignolle, M. Sutherland, B. J. Ramshaw, J. Levallois, R. Daou, F. Laliberté, O. Cyr-Choinière, J. Chang, Y. J. Jo, L. Balicas, R. Liang, D. A. Bonn, W. N. Hardy, C. Proust, and L. Taillefer, Phys. Rev. B 83, 054506 (2011).
- Haug et al. (2010) D. Haug, V. Hinkov, Y. Sidis, P. Bourges, N. B. Christensen, A. Ivanov, T. Keller, C. T. Lin, and B. Keimer, New J. Phys. 12, 105006 (2010).
- Ando et al. (2002) Y. Ando, K. Segawa, S. Komiya, and A. N. Lavrov, Phys. Rev. Lett. 88, 137005 (2002).
- Cyr-Choinière et al. (2015) O. Cyr-Choinière, G. Grissonnanche, S. Badoux, J. Day, D. A. Bonn, W. N. Hardy, R. Liang, N. Doiron-Leyraud, and L. Taillefer, Phys. Rev. B 92, 224502 (2015).
- Fauqué et al. (2006) B. Fauqué, Y. Sidis, V. Hinkov, S. Pailhès, C. T. Lin, X. Chaud, and P. Bourges, Phys. Rev. Lett. 96, 197001 (2006).
- Sidis and Bourges (2013) Y. Sidis and P. Bourges, Journal of Physics: Conference Series 449, 012012 (2013).
- Mangin-Thro et al. (2017) L. Mangin-Thro, Y. Li, Y. Sidis, and P. Bourges, Phys. Rev. Lett. 118, 097003 (2017).
- Croft et al. (2014) T. P. Croft, C. Lester, M. S. Senn, A. Bombardi, and S. M. Hayden, Phys. Rev. B 89, 224513 (2014).
- Christensen et al. (2014) N. B. Christensen, J. Chang, J. Larsen, M. Fujita, M. Oda, M. Ido, N. Momono, E. M. Forgan, A. T. Holmes, J. Mesot, M. Huecker, and M. v. Zimmermann, arXiv 1404.3192 (2014).
- Badoux et al. (2016b) S. Badoux, S. A. A. Afshar, B. Michon, A. Ouellet, S. Fortier, D. LeBoeuf, T. P. Croft, C. Lester, S. M. Hayden, H. Takagi, K. Yamada, D. Graf, N. Doiron-Leyraud, and L. Taillefer, Phys. Rev. X 6, 021004 (2016b).
- Kofu et al. (2009) M. Kofu, S.-H. Lee, M. Fujita, H.-J. Kang, H. Eisaki, and K. Yamada, Phys. Rev. Lett. 102, 047001 (2009).
- Wakimoto et al. (1999) S. Wakimoto, G. Shirane, Y. Endoh, K. Hirota, S. Ueki, K. Yamada, R. J. Birgeneau, M. A. Kastner, Y. S. Lee, P. M. Gehring, and S. H. Lee, Phys. Rev. B 60, R769 (1999).
- Lake et al. (2002) B. Lake, H. M. Ronnow, N. B. Christensen, G. Aeppli, K. Lefmann, D. F. McMorrow, P. Vorderwisch, P. Smeibidl, N. Mangkorntong, T. Sasagawa, M. Nohara, H. Takagi, and T. E. Mason, Nature 415, 299 (2002).
- Kimura et al. (1999) H. Kimura, K. Hirota, H. Matsushita, K. Yamada, Y. Endoh, S.-H. Lee, C. F. Majkrzak, R. Erwin, G. Shirane, M. Greven, Y. S. Lee, M. A. Kastner, and R. J. Birgeneau, Phys. Rev. B 59, 6517 (1999).
- Balédent et al. (2010) V. Balédent, B. Fauqué, Y. Sidis, N. B. Christensen, S. Pailhès, K. Conder, E. Pomjakushina, J. Mesot, and P. Bourges, Phys. Rev. Lett. 105, 027004 (2010).
- Nachumi et al. (1998) B. Nachumi, Y. Fudamoto, A. Keren, K. M. Kojima, M. Larkin, G. M. Luke, J. Merrin, O. Tchernyshyov, Y. J. Uemura, N. Ichikawa, M. Goto, H. Takagi, S. Uchida, M. K. Crawford, E. M. McCarron, D. E. MacLaughlin, and R. H. Heffner, Phys. Rev. B 58, 8760 (1998).
- Wu et al. (2013) T. Wu, H. Mayaffre, S. Krämer, M. Horvatic̀, C. Berthier, P. L. Kuhns, A. P. Reyes, R. Liang, W. N. Hardy, D. A. Bonn, and M.-H. Julien, Nat. Commun. 4, 3113 (2013).
- Blanco-Canosa et al. (2013) S. Blanco-Canosa, A. Frano, T. Loew, Y. Lu, J. Porras, G. Ghiringhelli, M. Minola, C. Mazzoli, L. Braicovich, E. Schierle, E. Weschke, M. Le Tacon, and B. Keimer, Phys. Rev. Lett. 110, 187001 (2013).
- Grissonnanche et al. (2014) G. Grissonnanche, O. Cyr-Choinière, F. Laliberté, S. René de Cotret, A. Juneau-Fecteau, S. Dufour-Beauséjour, M.-E. Delage, D. LeBoeuf, J. Chang, B. J. Ramshaw, D. A. Bonn, W. N. Hardy, R. Liang, S. Adachi, N. E. Hussey, B. Vignolle, C. Proust, M. Sutherland, S. Kramer, J.-H. Park, D. Graf, N. Doiron-Leyraud, and L. Taillefer, Nat. Commun. 5, 3280 (2014).
- Chang et al. (2008b) J. Chang, M. Shi, S. Pailhés, M. Månsson, T. Claesson, O. Tjernberg, A. Bendounan, Y. Sassa, L. Patthey, N. Momono, M. Oda, M. Ido, S. Guerrero, C. Mudry, and J. Mesot, Phys. Rev. B 78, 205103 (2008b).
- Laliberté et al. (2011) F. Laliberté, J. Chang, N. Doiron-Leyraud, E. Hassinger, R. Daou, M. Rondeau, B. Ramshaw, R. Liang, D. Bonn, W. Hardy, S. Pyon, T. Takayama, H. Takagi, I. Sheikin, L. Malone, C. Proust, K. Behnia, and L. Taillefer, Nat. Commun. 2, 432 (2011).
- Tranquada et al. (1995) J. M. Tranquada, B. J. Sternlieb, J. D. Axe, Y. Nakamura, and S. Uchida, Nature 375, 561 (1995).
- Hoffman et al. (2002) J. E. Hoffman, E. W. Hudson, K. M. Lang, V. Madhavan, H. Eisaki, S. Uchida, and J. C. Davis, Science 295, 466 (2002).
- Howald et al. (2003) C. Howald, H. Eisaki, N. Kaneko, and A. Kapitulnik, Proc. Natl. Acad. Sci. U.S.A. 100, 9705 (2003).
- Doiron-Leyraud et al. (2007) N. Doiron-Leyraud, C. Proust, D. LeBoeuf, J. Levallois, J.-B. Bonnemaison, R. Liang, D. A. Bonn, W. N. Hardy, and L. Taillefer, Nature 447, 565 (2007).
- LeBoeuf et al. (2007) D. LeBoeuf, N. Doiron-Leyraud, J. Levallois, R. Daou, J.-B. Bonnemaison, N. E. Hussey, L. Balicas, B. J. Ramshaw, R. Liang, D. A. Bonn, W. N. Hardy, S. Adachi, C. Proust, and L. Taillefer, Nature 450, 533 (2007).
- Taillefer (2009) L. Taillefer, J. Phys.: Condens. Matter 21, 164212 (2009).
- Chang et al. (2010) J. Chang, R. Daou, C. Proust, D. LeBoeuf, N. Doiron-Leyraud, F. Laliberté, B. Pingault, B. J. Ramshaw, R. Liang, D. A. Bonn, W. N. Hardy, H. Takagi, A. B. Antunes, I. Sheikin, K. Behnia, and L. Taillefer, Phys. Rev. Lett. 104, 057005 (2010).
- Wu et al. (2011) T. Wu, H. Mayaffre, S. Krämer, M. Horvatic̀, C. Berthier, W. N. Hardy, R. Liang, D. A. Bonn, and M.-H. Julien, Nature 477, 191 (2011).
- Ghiringhelli et al. (2012) G. Ghiringhelli, M. Le Tacon, M. Minola, S. Blanco-Canosa, C. Mazzoli, N. B. Brookes, G. M. De Luca, A. Frano, D. G. Hawthorn, F. He, T. Loew, M. M. Sala, D. C. Peets, M. Salluzzo, E. Schierle, R. Sutarto, G. A. Sawatzky, E. Weschke, B. Keimer, and L. Braicovich, Science 337, 821 (2012).
- Chang et al. (2012b) J. Chang, E. Blackburn, A. T. Holmes, N. B. Christensen, J. Larsen, J. Mesot, R. Liang, D. A. Bonn, W. N. Hardy, A. Watenphul, M. v. Zimmermann, E. M. Forgan, and S. M. Hayden, Nat. Phys. 8, 871 (2012b).
- M. v. Zimmermann et al. (1998) M. v. Zimmermann, Vigliante, A., Niemöller, T., Ichikawa, N., Frello, T., Madsen, J., Wochner, P., Uchida, S., Andersen, N. H., Tranquada, J. M., Gibbs, D., and Schneider, J. R., Europhys. Lett. 41, 629 (1998).
- Niemöller, T. et al. (1999) Niemöller, T., Ichikawa, N., Frello, T., Hünnefeld, H., Andersen, N. H., Uchida, S., Schneider, J. R., and Tranquada, J. M., Eur. Phys. J. B 12, 509 (1999).
- Fink et al. (2009) J. Fink, E. Schierle, E. Weschke, J. Geck, D. Hawthorn, V. Soltwisch, H. Wadati, H.-H. Wu, H. A. Dürr, N. Wizent, B. Büchner, and G. A. Sawatzky, Phys. Rev. B 79, 100502 (2009).
- Tabis et al. (2014) W. Tabis, Y. Li, M. L. Tacon, L. Braicovich, A. Kreyssig, M. Minola, G. Dellea, E. Weschke, M. J. Veit, M. Ramazanoglu, A. I. Goldman, T. Schmitt, G. Ghiringhelli, N. Barišić, M. K. Chan, C. J. Dorow, G. Yu, X. Zhao, B. Keimer, and M. Greven, Nat. Commun. 5, 5875 (2014).
- da Silva Neto et al. (2014) E. H. da Silva Neto, P. Aynajian, A. Frano, R. Comin, E. Schierle, E. Weschke, A. Gyenis, J. Wen, J. Schneeloch, Z. Xu, S. Ono, G. Gu, M. Le Tacon, and A. Yazdani, Science 343, 393 (2014).
- Comin et al. (2014) R. Comin, A. Frano, M. M. Yee, Y. Yoshida, H. Eisaki, E. Schierle, E. Weschke, R. Sutarto, F. He, A. Soumyanarayanan, Y. He, M. Le Tacon, I. S. Elfimov, J. E. Hoffman, G. A. Sawatzky, B. Keimer, and A. Damascelli, Science 343, 390 (2014).
- Schütt and Fernandes (2015) M. Schütt and R. M. Fernandes, Phys. Rev. Lett. 115, 027005 (2015).
- Okamoto et al. (2010) S. Okamoto, D. Sénéchal, M. Civelli, and A.-M. S. Tremblay, Phys. Rev. B 82, 180511 (2010).
- Bangura et al. (2010) A. F. Bangura, P. M. C. Rourke, T. M. Benseman, M. Matusiak, J. R. Cooper, N. E. Hussey, and A. Carrington, Phys. Rev. B 82, 140501 (2010).
- Kondo et al. (2004) T. Kondo, T. Takeuchi, T. Yokoya, S. Tsuda, S. Shin, and U. Mizutani, Journal of Electron Spectroscopy and Related Phenomena 137–140, 663 (2004), iCESS-9 Proceedings of the 9th International Conference on Electronic Spectroscopy and Structure.
- Vignolle et al. (2008) B. Vignolle, A. Carrington, R. A. Cooper, M. M. J. French, A. P. Mackenzie, C. Jaudet, D. Vignolles, C. Proust, and N. E. Hussey, Nature 455, 952 (2008).
- Manako et al. (1992) T. Manako, Y. Kubo, and Y. Shimakawa, Phys. Rev. B 46, 11019 (1992).
- Mackenzie et al. (1996) A. P. Mackenzie, S. R. Julian, D. C. Sinclair, and C. T. Lin, Phys. Rev. B 53, 5848 (1996).
- Proust et al. (2002) C. Proust, E. Boaknin, R. W. Hill, L. Taillefer, and A. P. Mackenzie, Phys. Rev. Lett. 89, 147003 (2002).
- Nakamae et al. (2003) S. Nakamae, K. Behnia, N. Mangkorntong, M. Nohara, H. Takagi, S. J. C. Yates, and N. E. Hussey, Phys. Rev. B 68, 100502 (2003).
- Abdel-Jawad et al. (2007) M. Abdel-Jawad, J. G. Analytis, L. Balicas, A. Carrington, J. P. H. Charmant, M. M. J. French, and N. E. Hussey, Phys. Rev. Lett. 99, 107002 (2007).
- Taillefer (2010) L. Taillefer, Ann. Rev. Cond. Mat. Phys. 1, 51 (2010).
- Doiron-Leyraud et al. (2009) N. Doiron-Leyraud, P. Auban-Senzier, S. René de Cotret, C. Bourbonnais, D. Jérome, K. Bechgaard, and L. Taillefer, Phys. Rev. B 80, 214531 (2009).
- Tafti et al. (2014) F. F. Tafti, F. Laliberté, M. Dion, J. Gaudet, P. Fournier, and L. Taillefer, Phys. Rev. B 90, 024519 (2014).
- Ussishkin et al. (2002) I. Ussishkin, S. L. Sondhi, and D. A. Huse, Phys. Rev. Lett. 89, 287001 (2002).
- Serbyn et al. (2009) M. N. Serbyn, M. A. Skvortsov, A. A. Varlamov, and V. Galitski, Phys. Rev. Lett. 102, 067001 (2009).
- Michaeli and Finkel’stein (2009) K. Michaeli and A. M. Finkel’stein, EPL (Europhysics Letters) 86, 27007 (2009).
- Emery and Kivelson (1995) V. J. Emery and S. A. Kivelson, Nature 374, 434 (1995).
- Dagan et al. (2004) Y. Dagan, M. M. Qazilbash, C. P. Hill, V. N. Kulkarni, and R. L. Greene, Phys. Rev. Lett. 92, 167001 (2004).
- Pourret et al. (2006) A. Pourret, H. Aubin, J. Lesueur, C. A. Marrache-Kikuchi, L. Berge, L. Dumoulin, and K. Behnia, Nat. Phys. 2, 683 (2006).
- Reber et al. (2013) T. J. Reber, N. C. Plumb, Y. Cao, Z. Sun, Q. Wang, K. McElroy, H. Iwasawa, M. Arita, J. S. Wen, Z. J. Xu, G. Gu, Y. Yoshida, H. Eisaki, Y. Aiura, and D. S. Dessau, Phys. Rev. B 87, 060506 (2013).
- Kondo et al. (2015) T. Kondo, W. Malaeb, Y. Ishida, T. Sasagawa, H. Sakamoto, T. Takeuchi, T. Tohyama, and S. Shin, Nature Communications 6, 7699 EP (2015).
- Lee et al. (2009) J. Lee, K. Fujita, A. R. Schmidt, C. K. Kim, H. Eisaki, S. Uchida, and J. C. Davis, Science 325, 1099 (2009).
- Gomes et al. (2007) K. K. Gomes, A. N. Pasupathy, A. Pushp, S. Ono, Y. Ando, and A. Yazdani, Nature 447, 569 (2007).
- Okada et al. (2010) Y. Okada, Y. Kuzuya, T. Kawaguchi, and H. Ikuta, Phys. Rev. B 81, 214520 (2010).
- Yu et al. (2012) G. Yu, D.-D. Xia, N. Barišić, R.-H. He, N. Kaneko, T. Sasagawa, Y. Li, X. Zhao, A. Shekhter, and M. Greven, arXiv 1210.6942 (2012).
- Yu et al. (2017) G. Yu, D.-D. Xia, D. Pelc, R.-H. He, N. Kaneko, T. Sasagawa, Y. Li, X. Zhao, N. Barišić, A. Shekhter, and M. Greven, arXiv 1710.10957 (2017).
- Corson et al. (1999) J. Corson, R. Mallozzi, J. Orenstein, J. N. Eckstein, and I. Bozovic, Nature 398, 221 (1999).
- Grbić et al. (2011) M. S. Grbić, M. Požek, D. Paar, V. Hinkov, M. Raichle, D. Haug, B. Keimer, N. Barišić, and A. Dulčić, Phys. Rev. B 83, 144508 (2011).
- Lee et al. (2007) W. S. Lee, I. M. Vishik, K. Tanaka, D. H. Lu, T. Sasagawa, N. Nagaosa, T. P. Devereaux, Z. Hussain, and Z. X. Shen, Nature 450, 81 (2007).
- Bilbro et al. (2011) L. S. Bilbro, R. V. Aguilar, G. Logvenov, O. Pelleg, I. Božovi’c, and N. P. Armitage, Nat. Phys. 7, 298 (2011).
- Wang et al. (2002) Y. Wang, N. P. Ong, Z. A. Xu, T. Kakeshita, S. Uchida, D. A. Bonn, R. Liang, and W. N. Hardy, Phys. Rev. Lett. 88, 257003 (2002).
- Wang et al. (2003) Y. Wang, S. Ono, Y. Onose, G. Gu, Y. Ando, Y. Tokura, S. Uchida, and N. P. Ong, Science 299, 86 (2003).
- Li et al. (2010) L. Li, Y. Wang, S. Komiya, S. Ono, Y. Ando, G. D. Gu, and N. P. Ong, Phys. Rev. B 81, 054510 (2010).
- Yu et al. (2015) J. F. Yu, B. J. Ramshaw, I. Kokanović, K. A. Modic, N. Harrison, J. Day, R. Liang, W. N. Hardy, D. A. Bonn, A. McCollam, S. R. Julian, and J. R. Cooper, Phys. Rev. B 92, 180509 (2015).
- Rey et al. (2013) R. I. Rey, A. Ramos-Álvarez, J. Mosqueira, M. V. Ramallo, and F. Vidal, Phys. Rev. B 87, 056501 (2013).
- Kokanović et al. (2013) I. Kokanović, D. J. Hills, M. L. Sutherland, R. Liang, and J. R. Cooper, Phys. Rev. B 88, 060505 (2013).