Energy-dependent variability of the bare Seyfert 1 galaxy Ark 120
Abstract
We present results from a detailed spectral-timing analysis of a long ks XMM-Newton observation of the bare Seyfert 1 galaxy Ark 120 which showed alternating diminution and increment in the 0.310 keV X-ray flux over four consecutive orbits in 2014. We study the energy-dependent variability of Ark 120 through broad-band X-ray spectroscopy, fractional root-mean-squared (rms) spectral modelling, hardnessintensity diagram and fluxflux analysis. The X-ray (0.310 keV) spectra are well fitted by a thermally Comptonized primary continuum with two (blurred and distant) reflection components and an optically thick, warm Comptonization component for the soft X-ray excess emission below keV. During the first and third observations, the fractional X-ray variability amplitude decreases with energy while for second and fourth observations, X-ray variability spectra are found to be inverted-crescent and crescent shaped respectively. The rms variability spectra are well modelled by two constant reflection components, a soft excess component with variable luminosity and a variable intrinsic continuum with the normalization and spectral slope being correlated. The spectral softening of the source with both the soft excess and UV luminosities favour Comptonization models where the soft excess and primary X-ray emission are produced through Compton up-scattering of the UV and UV/soft X-ray seed photons in the putative warm and hot coronae, respectively. Our analyses imply that the observed energy-dependent variability of Ark 120 is most likely due to variations in the spectral shape and luminosity of the hot corona and to variations in the luminosity of the warm corona, both of which are driven by variations in the seed photon flux.
keywords:
black hole physics–galaxies: active–galaxies: X-rays–galaxies: individual: Ark 1201 Introduction
Active galactic nuclei (AGN) emit radiation over the entire range of the electromagnetic spectrum where the X-rays are emitted from the innermost region of the accretion flow. The X-ray spectra of Seyfert 1 galaxies have the following main components: a power-law like primary emission with a high energy cut-off, ‘soft X-ray excess’ emission below keV, reflected emission consisting of a Fe K line near 6 keV and a Compton hump in the keV energy range. It is widely accepted that Comptonization of lower energy seed photons is the driving mechanism for the production of the primary X-ray emission (e.g. Sunyaev & Titarchuk 1980; Titarchuk 1994). The seed photons are thought to arise from the accretion disc with peak emission at optical/ultraviolet (UV) wavebands (Shakura & Sunyaev, 1973). However, the location and geometry of the scattering region are still a matter of debate. It has been suggested that the scattering region can be a hot corona above the cold disc (Haardt & Maraschi, 1991, 1993; Poutanen & Svensson, 1996), a base of the relativistic jet (Fender et al., 1999, 2004; Markoff, Nowak & Wilms, 2005) or an advection-dominated accretion flow (ADAF; Narayan & Yi 1994; Esin et al. 1997). The radial extension of the corona is also unresolved: it could be either physically compact (Fabian, 2012; Reis & Miller, 2013) or extended (Kurpiewski et al., 1997; Wilkins et al., 2016; Chainakun & Young, 2017). In addition to the primary X-ray continuum, many Seyfert 1 galaxies show an excess emission below keV, the origin of which is still controversial. Presently, there are two physical scenarios that can describe the origin of the soft X-ray excess emission – thermal Comptonization of the optical/UV seed photons in an optically thick, warm corona (Magdziarz et al., 1998; Dewangan et al., 2007; Done et al., 2012; Lohfink et al., 2012) and blurred reflection from an ionized accretion disc (Fabian et al., 2002; Ross & Fabian, 2005; Crummy et al., 2006; Garćia et al, 2014). The reflection features (Fe Kα line and Compton hump) arise due to the photoelectric absorption followed by the fluorescence line emission below 10 keV and Compton scattering dominating above 10 keV in a dense and relatively cold medium like the accretion disc or torus. However, the complexity of the broad-band AGN spectra sometimes results in mean spectral model degeneracy (Dewangan et al., 2007; Mallick & Dewangan, 2017) and to overcome that problem, we need to study the variability properties of different spectral components.
The X-ray emission from type 1 AGN is known to be strongly variable on a wide range of time-scales (Leighly, 1999b; Turner et al., 1999; Ponti et al., 2012). However, the exact nature of X-ray variability is not clearly understood. The X-ray variability may arise due to variations in the accretion rate (e.g. Arévalo et al. 2005) and/or intrinsic luminosity of the X-ray emitting hot corona (e.g. Marinucci et al. 2014; Mallick et al. 2016). Some of the observed variability can also be explained in terms of variations in the source height (Miniutti & Fabian, 2004). One of the most promising techniques that can probe the variable behaviour of spectral components is the root-mean-squared (rms) variability spectrum since it connects the energy spectrum with the variability properties and has been proven to be very successful in explaining the variability of spectral components in AGN (e.g. MCG–6-30-15: Miniutti et al. 2007, 1H 0707–495: Fabian 2012, RX J1633.3+4719: Mallick et al. 2016, PG 1211+143: Lobban et al. 2016). The rms spectrum determines the dynamical nature of distinct spectral components (Comptonization, reflection, absorption) or spectral parameters (normalization, spectral index etc.) and also the coupling between different components or parameters on various timescales.
In this work, we investigate the origin of energy-dependent variability of Ark 120 including the soft excess emission, the intrinsic coronal emission and UV/X-ray connection using the XMM-Newton archival data from the 2014 observations. Ark 120 is a broad-line Seyfert 1 galaxy (Véron-Cetty & Véron, 2006) at a redshift of (Theureau et al., 2005) with Balmer lines full width at half-maximum FWHM(Hβ) km s-1 (Wandel et al., 1999), an estimated black hole mass of (Peterson et al., 2004) and low Eddington ratio of (Vasudevan & Fabian, 2007). The source is well known for showing a strong soft excess (Matt et al., 2014), a deficit of intrinsic ultraviolet/X-ray ionized absorption (Crenshaw & Kraemer, 2001; Vaughan et al., 2004) and no significant contamination from the host galaxy (Ward et al., 1987) therefore considered as a ‘bare’ nucleus and an ideal target to shed light on the central engine. Here we present the spectral-temporal analysis including the broad-band energy spectrum, fluxflux analysis, hardnessintensity diagram (HID), rmsflux relation and fractional rms spectrum to probe the variable nature of different spectral components in Ark 120.
2 Observations and Data Reduction
Ark 120 was observed with the XMM-Newton telescope (Jansen et al., 2001) during four consecutive orbits (rev2614, rev2615, rev2616, rev2617) in 2014. We refer them 2014a, 2014b, 2014c and 2014d to represent their chronological order. Here we analyse the data from the European Photon Imaging Camera (EPIC-pn; Strüder et al. 2001) which was operated in the small window (sw) mode using the thin filter for all four observations. We processed the data sets with the Scientific Analysis System (sas v.15.0.0) and used the most recent (as of 2016 September 4) calibration files. We have used unflagged events with pattern. We excluded the intervals of proton flares by creating a gti (Good Time Interval) file above 10 keV for the full field with the rate cts s-1, cts s-1, cts s-1 and cts s-1 for 2014a, 2014b, 2014c and 2014d, respectively, to acquire the maximum signal-to-noise ratio. Then we extracted the source and background events with extraction radii of 30 arcsec and 60 arcsec, respectively. The rmf (Redistribution Matrix File) and arf (Ancillary Region File) for each EPIC-pn spectral data sets were produced with the sas tasks rmfgen and arfgen, respectively. We binned the spectra using the grppha tool with a minimum of 100 counts per bin. The source and background light curves for different energy bands were extracted using xselect V.2.4 c from the cleaned pn events. Finally, we produced the background subtracted light curves with the ftool task lcmath.
The Optical Monitor (OM; Mason et al. 2001) was operated in the imaging-fast (IF) mode using all six optical/UV filters (UVW2, UVM2, UVW1, U, B, V) with a total duration of ks for each observation. There is a total of 80 OM exposures for each observation. We processed the fast mode OM data with the sas task omfchain and generated the optical/UV light curves. To process the imaging mode OM data, we used the sas task omichain. We detected the source in the sky aligned image for each filter. Then we checked the combined source list to find the right ascension, declination and background subtracted count rate of the source, corrected for coincidence losses.
| Revolution | Order No. | Obs. ID | Date | Filtered Duration | Net Exposure | Net Count Rate |
|---|---|---|---|---|---|---|
| (yyyy-mm-dd) | ( ks) | ( ks) | (counts s-1) | |||
| rev2614 | 2014a | 0721600201 | 2014-03-18 | 121.0 | 65.71 | 28.3 |
| rev2615 | 2014b | 0721600301 | 2014-03-20 | 122.0 | 73.02 | 23.7 |
| rev2616 | 2014c | 0721600401 | 2014-03-22 | 124.0 | 72.54 | 26.2 |
| rev2617 | 2014d | 0721600501 | 2014-03-24 | 119.0 | 77.65 | 23.8 |


3 Spectral Analysis
We analysed the 2014 XMM-Newton/EPIC-pn energy spectra of Ark 120 with xspec v.12.8.2 (Arnaud, 1996). We employed the statistics to estimate the errors on the best-fitting model parameters at the 90 per cent confidence limit which corresponds to = 2.706 for each parameter. We ignored the 1.82.5 keV band in order to avoid the effects of instrumental features on the broad-band energy spectrum (see e.g. Matt et al. 2014; Marinucci et al. 2014).
3.1 The hard band EPIC-pn spectrum
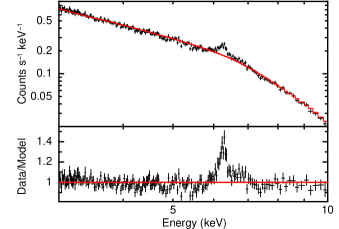
The X-ray energy spectrum of Ark 120 is complex in nature as evident from the previous 2013 observation (Matt et al., 2014). Therefore we began our analysis by fitting the 2014a hard band (310 keV) EPIC-pn spectrum with a power-law (zpowerlw) modified by the Galactic absorption. We modelled the Galactic absorption using tbabs in xspec with the interstellar Hydrogen column density fixed at cm-2 (Kalberla et al., 2005). The fit is unacceptable with /d.o.f = 936/664. Figure 1 shows the 2014a EPIC-pn 310 keV spectrum, absorbed power-law fit to the data and the data-to-model ratio plot with a strong residual in the Fe K region. Initially, we fitted the Fe K region with two narrow emission lines (zgauss1+zgauss2) by fixing the line widths at eV, which improved the fit to /d.o.f = 708/660 (=228 for 4 d.o.f). The lines are centred at keV and keV. However, a visual inspection of the residual indicates a broad emission feature at keV. Therefore we added a third Gaussian line (zgauss3) which provided a statistically acceptable fit with /d.o.f = 661.5/657 (=46.2 for 3 d.o.f). The best-fitting value of the broad emission line width is eV. The line energies of two narrow and one broad emission lines are keV, keV and keV with equivalent widths of eV, eV and eV, respectively. We conclude that the EPIC-pn 310 keV spectrum is well fitted by a power-law with a photon index of along with one broad and two narrow iron emission lines.
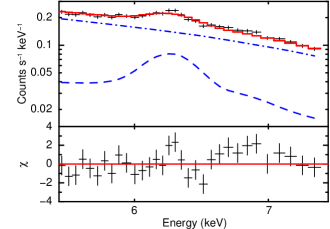
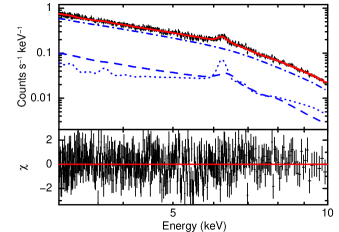
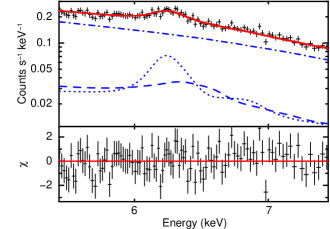
We then refitted the hard band (310 keV) spectrum with the physically motivated reflection models to understand the origin of the spectral lines. First, we used the relativistic reflection model relconvxillver (Garćia et al, 2014) to obtain the reflected emission from the inner accretion disc. Since the xillver model assumes a power-law with a high energy cutoff as input continuum, we used a cutoff power-law (cutoffpl) model as the primary continuum. We consider a SMBH of spin , disc inclination angle of , an emissivity law and an outer disc radius of as assumed by Nardini et al. (2016). The high energy cutoff of the primary Continuum was fixed at keV. The fitting of the 310 keV spectrum with the blurred reflection model, tbabs(relconvxillver+cutoffpl) provided a /d.o.f = 677/660 with two residuals at around keV and keV (see Figure 2), which are in agreement with the results of Nardini et al. (2016). The keV emission represents the Fe Kα line, while the keV emission feature most likely arises from a blend of the Fe XXVI Ly line at keV and Fe Kβ line at keV. In order to model these two narrow features, we added one distant reflection (xillver) model which improved the fit to /d.o.f = 661.2/658 (=15.7 for 2 d.o.f) with no significant residuals. The 2014a EPIC-pn 310 keV spectral data, the best-fitting model, tbabs(relconvxillver+xillver+cutoffpl) and the residuals are shown in Figure 3 (left). The accretion disc inner radius and ionization parameter obtained from the hard band spectral fitting are and erg cm s-1, respectively. Thus the modelling of the hard band spectrum suggests the presence of a highly ionized blurred disc reflection and a weakly ionized distant reflection in Ark 120. Fig. 3 (right) shows the Fe K (5.57.5 keV) region spectral data with all the model components.
| Model | tbabs(optxagnf+relconvxillver+xillver+nthcomp) | 2014a | 2014b | 2014c | 2014d |
| Date | 2014-03-18 | 2014-03-20 | 2014-03-22 | 2014-03-24 | |
| Obs. ID | 0721600201 | 0721600301 | 0721600401 | 0721600501 | |
| Component | Parameter | ||||
| tbabs | (1020 cm-2) | 9.78(f) | 9.78(f) | 9.78(f) | 9.78(f) |
| optxagnf | ) | ||||
| 0∗ | 0∗ | 0∗ | 0∗ | ||
| ( keV) | 0.34 | ||||
| 11.4 | 12.1 | 11.8 | 13.2 | ||
| () | |||||
| () | 400(f) | 400(f) | 400(f) | 400(f) | |
| 0(f) | 0(f) | 0(f) | 0(f) | ||
| relconv | 3(f) | 3(f) | 3(f) | 3(f) | |
| 0(f) | 0(f) | 0(f) | 0(f) | ||
| (deg) | 30(f) | 30(f) | 30(f) | 30(f) | |
| () | |||||
| () | 400(f) | 400(f) | 400(f) | 400(f) | |
| xillver | 1.2 | 0.8 | 1.3 | 0.8 | |
| (erg cm s-1) | 497 | 473 | 454 | 269 | |
| 1.87∗ | 1.83∗ | 1.82∗ | 1.82∗ | ||
| (10-8) | 3.7 | 2.4 | 4.4 | 5.1 | |
| (deg) | 30∗ | 30∗ | 30∗ | 30∗ | |
| ( keV) | 1000(f) | 1000(f) | 1000(f) | 1000(f) | |
| xillver | 1.2∗ | 0.8∗ | 1.3∗ | 0.8∗ | |
| (erg cm s-1) | 12 | 20 | 20 | 20 | |
| 1.87∗ | 1.83∗ | 1.82∗ | 1.82∗ | ||
| (10-6) | 3.8 | 3.0 | 1.9 | 2.7 | |
| (deg) | 30∗ | 30∗ | 30∗ | 30∗ | |
| ( keV) | 1000∗ | 1000∗ | 1000∗ | 1000∗ | |
| nthcomp | 1.87 | 1.83 | 1.82 | 1.82 | |
| ( keV) | 350(f) | 350(f) | 350(f) | 350(f) | |
| ( eV) | 20(f) | 20(f) | 20(f) | 20(f) | |
| (10-3)a | 11.2 | 9.6 | 10.7 | 9.9 | |
| flux | (10-11)b | 3.6 | 3.0 | 3.3 | 3.0 |
| (10-11)b | 3.9 | 3.5 | 4.0 | 3.7 | |
| / | 1105/1056 | 1141.2/1062 | 1119.4/1103 | 1158.6/1101 |
Notes:a Normalization in units of photons cm-2 s-1 keV-1 at 1 keV. b Observed flux in units of erg cm-2 s-1.
3.2 The broad-band EPIC-pn spectrum
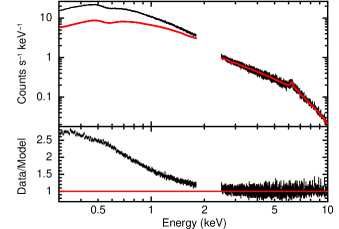
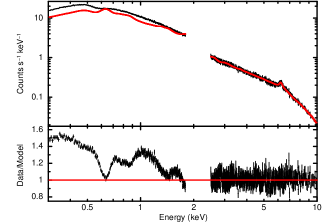
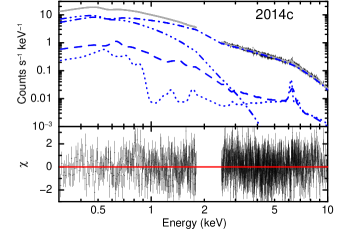
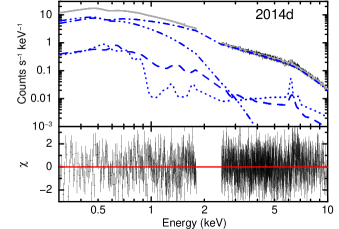
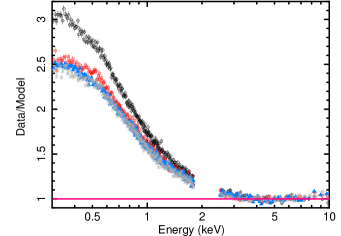
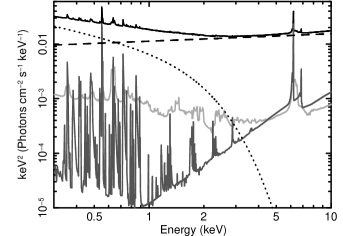
To study the soft X-ray excess emission from Ark 120, we extrapolated our hard band best-fitting phenomenological model, tbabs(zgauss1zgauss2zgauss3zpowerlw) down to 0.3 keV, which revealed a strong soft excess emission below 2 keV (see Figure 4). The soft excess is very similar to that found in other Seyfert 1 galaxies and QSOs (Czerny et al., 2003; Gierliński & Done, 2004; Crummy et al., 2006; Papadakis et al., 2007). Although one blurred and one distant reflected emission successfully explained the 310 keV X-ray spectrum, the extrapolation of the hard band best-fitting physical model tbabs(relconvxillver+xillver+cutoffpl) significantly underestimates the flux at lower energies with /d.o.f = 51399/1068 (see Figure 5). The fitting of the broad-band (0.310 keV) pn data with the reflection models resulted in a higher value of the spectral index, and a poor fit with /d.o.f = 2080/1060. Therefore we added intrinsic disc Comptonization model optxagnf (Done et al. 2012) following the approach of Matt et al. (2014) in order to account for the soft excess emission only. The optxagnf is an energetically self-consistent model as it assumes that the gravitational energy released at each radius in the accretion disc is emitted as a blackbody radiation at radii larger than a certain radius, known as the coronal radius (). However, at radii less than , the energy is partitioned between powering the soft X-ray excess and hard X-ray power-law with a cutoff energy of keV. The lower limit of the previously non-detected high energy cutoff of Ark 120 is keV (Matt et al., 2014), which is higher than the cutoff energy assumed by optxagnf model. Hence we switched off the hard power-law component of the optxagnf model and modelled only the soft excess emission by setting , which measures the fraction of the power emitted in the hard Comptonization component below . The normalization of the model is determined by four parameters: black hole mass (), dimensionless spin (), proper distance () and soft X-ray luminosity in units of Eddington luminosity () and therefore the model requires the normalization to be fixed at 1. We fixed the black hole mass, proper distance and outer disc radius at (Peterson et al., 2004), 134 Mpc and 400 respectively. In xspec, the 0.310 keV model reads as tbabs(optxagnf+relconvxillver+xillver+cutoffpl), which resulted in a statistically acceptable fit with /d.o.f = 1105.1/1056 = 1.04. For physical consistency, we replaced the cutoffpl model for the primary emission by a thermally Comptonized continuum model nthcomp (Zdziarski, Johnson & Magdziarz, 1996). We assumed an electron temperature of keV which agrees with the high energy cutoff of keV, since is about a factor of 2 or 3 higher than the hot coronal temperature. The disc blackbody seed photon temperature was fixed at eV, which is the maximum disc temperature relevant for Ark 120, given its mass and accretion rate (Frank, King & Raine, 2002). The fitting of the broad-band (0.310 keV) data with the tbabs(optxagnf+relconvxillver+xillver+nthcomp) model provided the similar quality fit with /d.o.f = 1105/1056 = 1.04. The 2014 individual EPIC-pn spectrum, the best-fitting physical model with components and the deviations of the broad-band pn data from the best-fitting model are shown in Figure 6. The best-fitting model parameters for all four 2014 observations (2014a, 2014b, 2014c and 2014d) are listed in Table 2. Our broad-band spectral modelling suggests that the soft excess emission from Ark 120 is produced through thermal Comptonization of the disc seed photons in a warm corona with an electron temperature of keV and an optical depth of .
3.3 Joint Analysis of Four EPIC-pn Spectra
We then performed the joint fitting of all four EPIC-pn spectra and studied the variability of spectral components. First, we applied the 310 keV best-fitting phenomenological model, tbabs(zgauss1zgauss2zgauss3zpowerlw) to all four hard band EPIC-pn data. We tied all the parameters except the power-law normalization which resulted in a statistically acceptable fit with /d.o.f = 2730.7/2750. As before, we extrapolated the hard band best-fitting phenomenological model to lower energies. The ratio of the broad-band pn data to the extrapolated hard band best-fitting phenomenological model is shown in Figure 7 (left). Interestingly, we found that the strength of the soft excess component is variable between observations. The soft component has the highest flux level for 2014a, moderate for 2014b and lowest during the 2014c and 2014d observations. In order to probe the soft excess variability over the observed -week period, we applied the broad-band (0.310 keV) best-fitting physical model, tbabs(optxagnf+relconvxillver+xillver+nthcomp) to all four EPIC-pn spectral data sets. Initially, all the parameters were tied except the normalization of the primary continuum (nthcomp) which resulted in a statistically poor fit with /d.o.f = 9475.4/4355. Then we allowed the soft excess luminosity, of the optxagnf model to vary between observations which improved the fit to /d.o.f = 4750.7/4352 = 1.1. If we left the spectral index of the primary continuum to vary, we find a best-fit of /d.o.f = 4665.6/4349 = 1.07 (=85 for 3 d.o.f) with no significant residual. The best-fitting values of the coronal radius, ionization parameters of the blurred and distant reflection components are , erg cm s-1 and erg cm s-1, respectively. The best-fitting physical model along with the model components are shown in Fig. 7 (right). The joint fitting of all four EPIC-pn spectral data sets indicate that the observed X-ray spectral variability of Ark 120 is due to variations in the normalization and photon index of the primary X-ray emission as well as the luminosity of the soft excess emission.
| Obs. Id | Order No. | Energy range | Mean (counts s-1) | rms (counts s-1) | (per cent) |
|---|---|---|---|---|---|
| 0721600201 | 2014a | 26.7 | 1.58 | 5.91 | |
| 22.37 | 1.38 | 6.16 | |||
| 4.32 | 0.21 | 4.77 | |||
| 0721600301 | 2014b | 22.42 | 1.22 | 5.46 | |
| 18.53 | 1.02 | 5.48 | |||
| 3.89 | 0.21 | 5.49 | |||
| 0721600401 | 2014c | 24.76 | 1.42 | 5.74 | |
| 20.38 | 1.24 | 6.07 | |||
| 4.38 | 0.18 | 4.21 | |||
| 0721600501 | 2014d | 22.52 | 0.46 | 2.04 | |
| 18.52 | 0.52 | 2.8 | |||
| 4.0 | 0.1 | 2.4 |
| Order No. | linear model () | power-law model () | ||||
|---|---|---|---|---|---|---|
| /d.o.f | /d.o.f | |||||
| 2014a | 0.14 | 1.23 | 187.2/119 | 0.47 | 0.71 | 188.1/119 |
| 2014b | 0.2 | 0.15 | 197.1/120 | 0.24 | 0.95 | 196.7/120 |
| 2014c | 0.14 | 1.5 | 155.3/122 | 0.61 | 0.65 | 155.8/122 |
| 2014d | 0.11 | 5.97 | 193.3/117 | 16.8 | 0.49 | 193.1/117 |


| Obs. Id | Gradient | Intercept | /d.o.f | Behaviour when brighter | |
|---|---|---|---|---|---|
| 2014a | (22.6, 29.7) | 0.55 | Softer | ||
| 2014b | (19.6, 22.1 | 0.49 | Harder | ||
| 2014b | (22.1, 24.4) | 0.35 | Softer | ||
| 2014c | (21.3, 26.7) | 0.49 | Softer | ||
| 2014d | (21.4, 23.35) | 1.0 | Softer |

4 Timing Analysis
4.1 Light Curve and Hardness Ratio
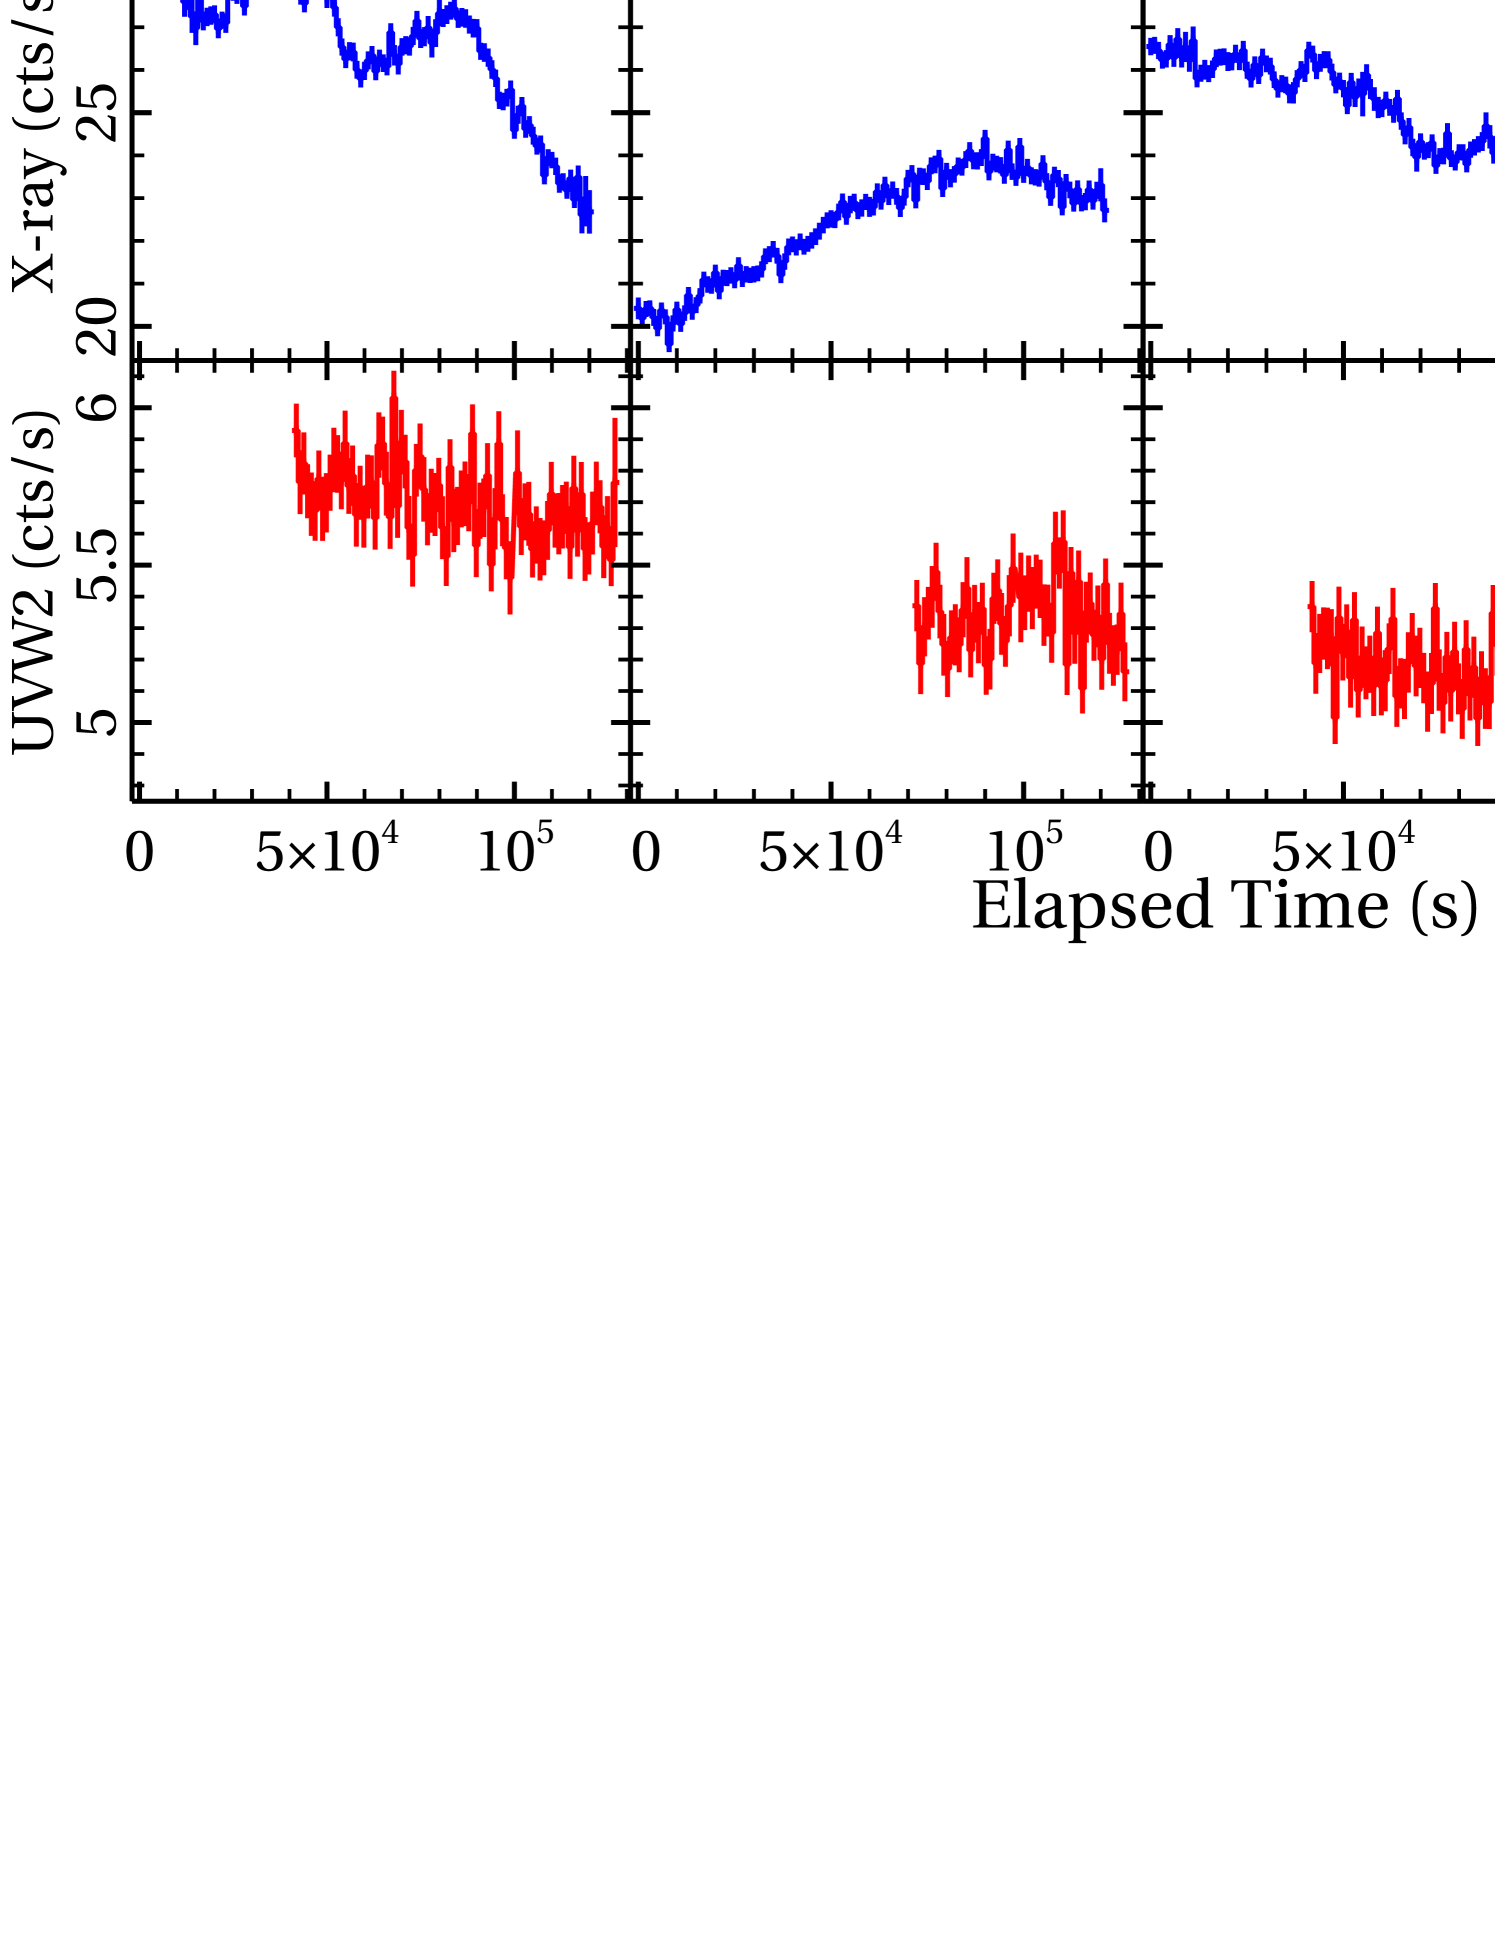
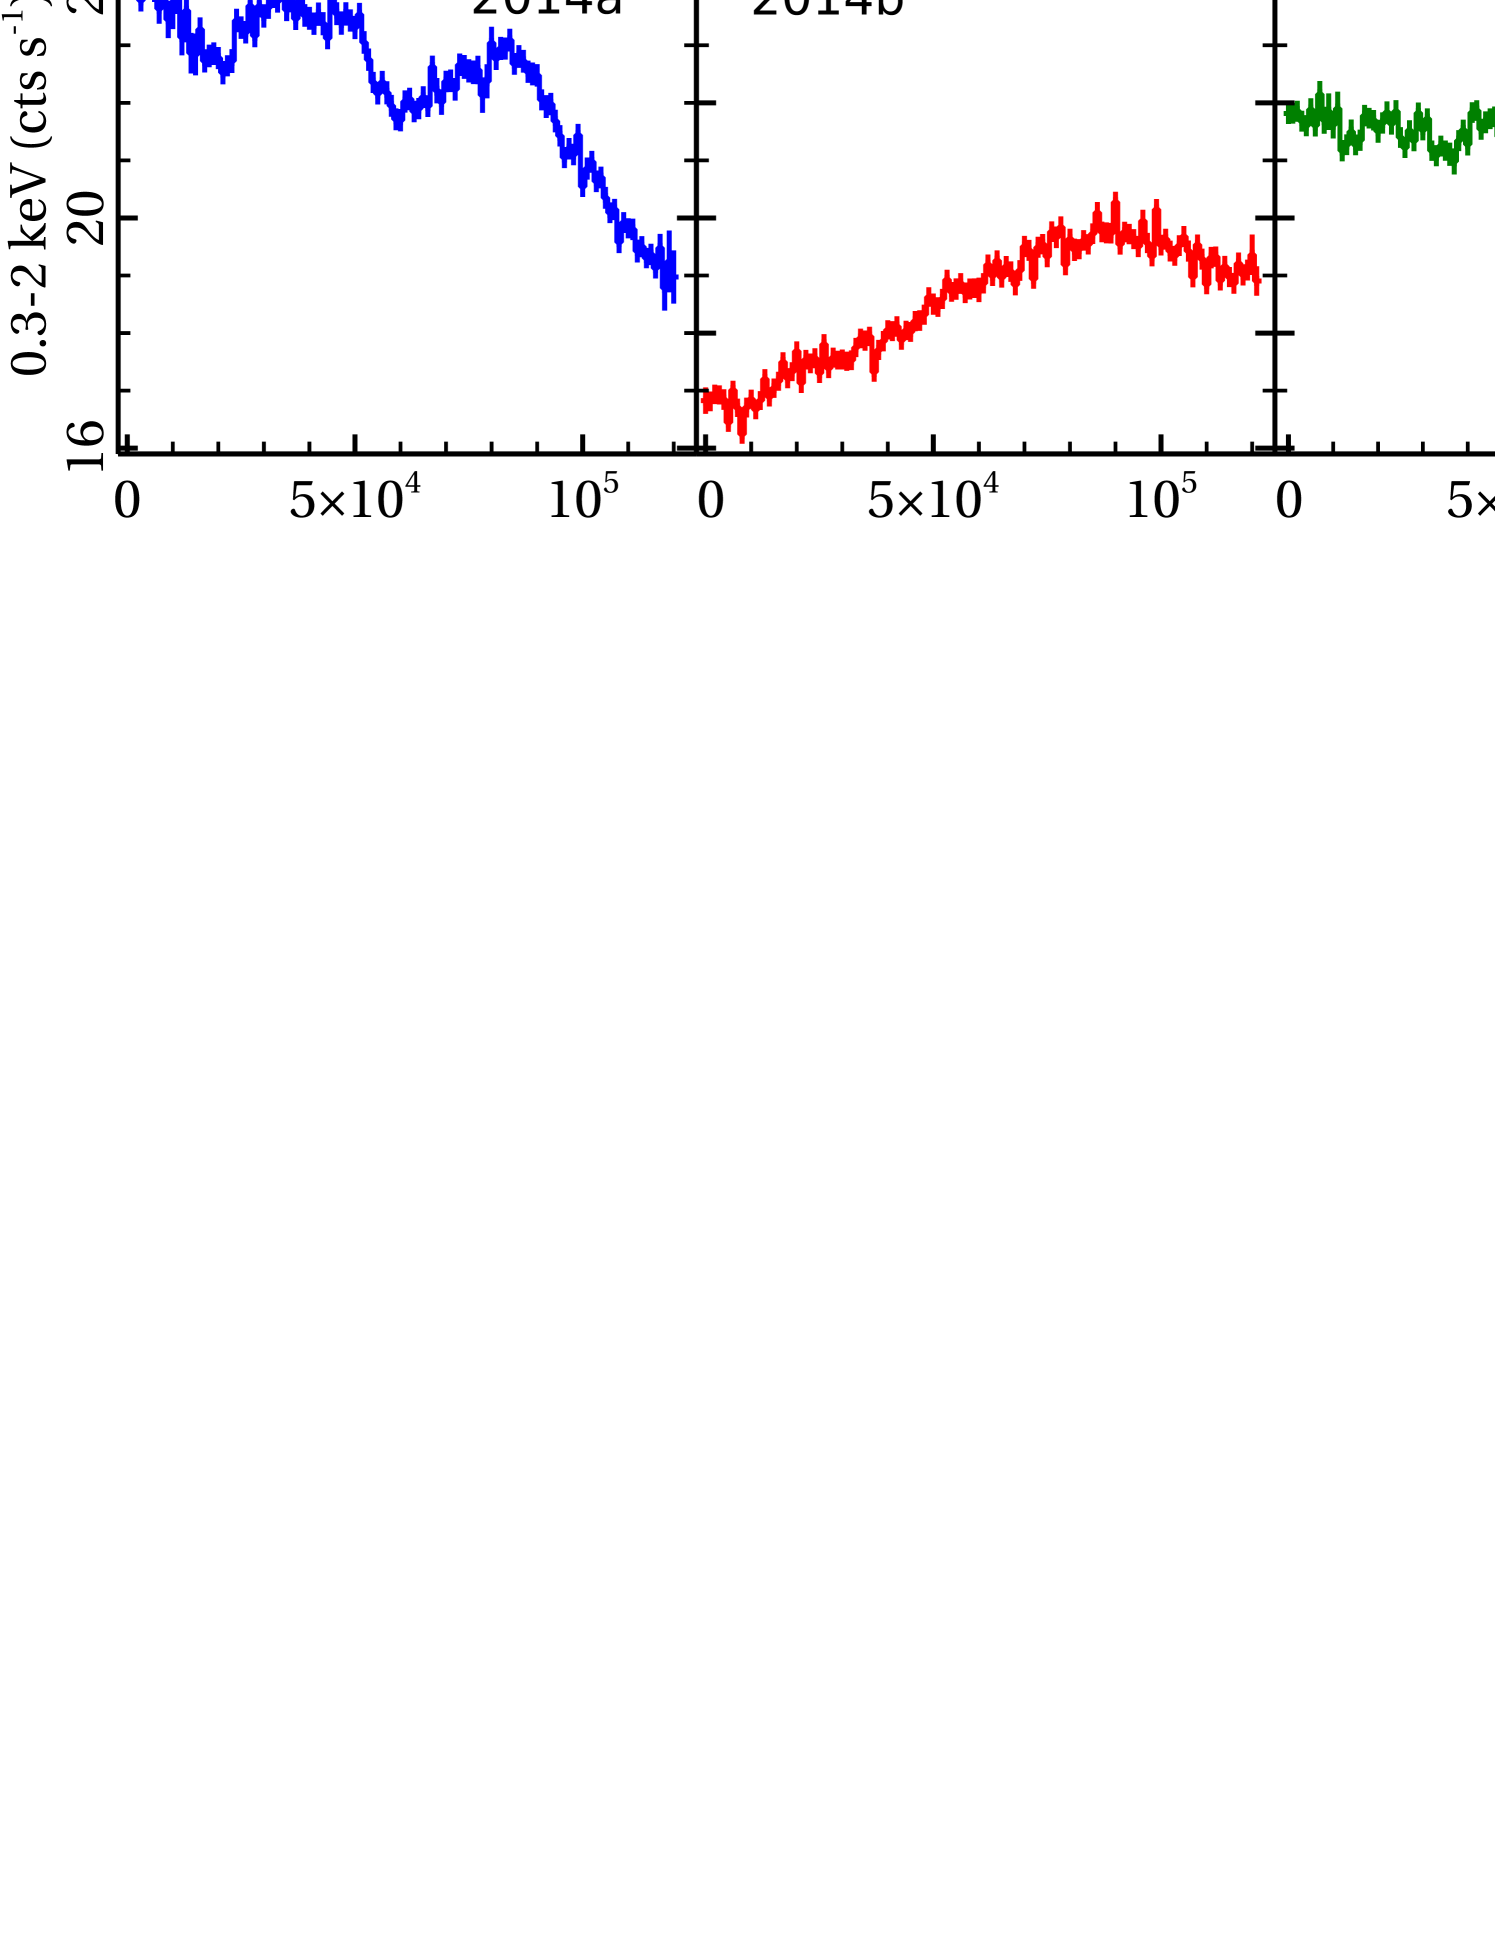
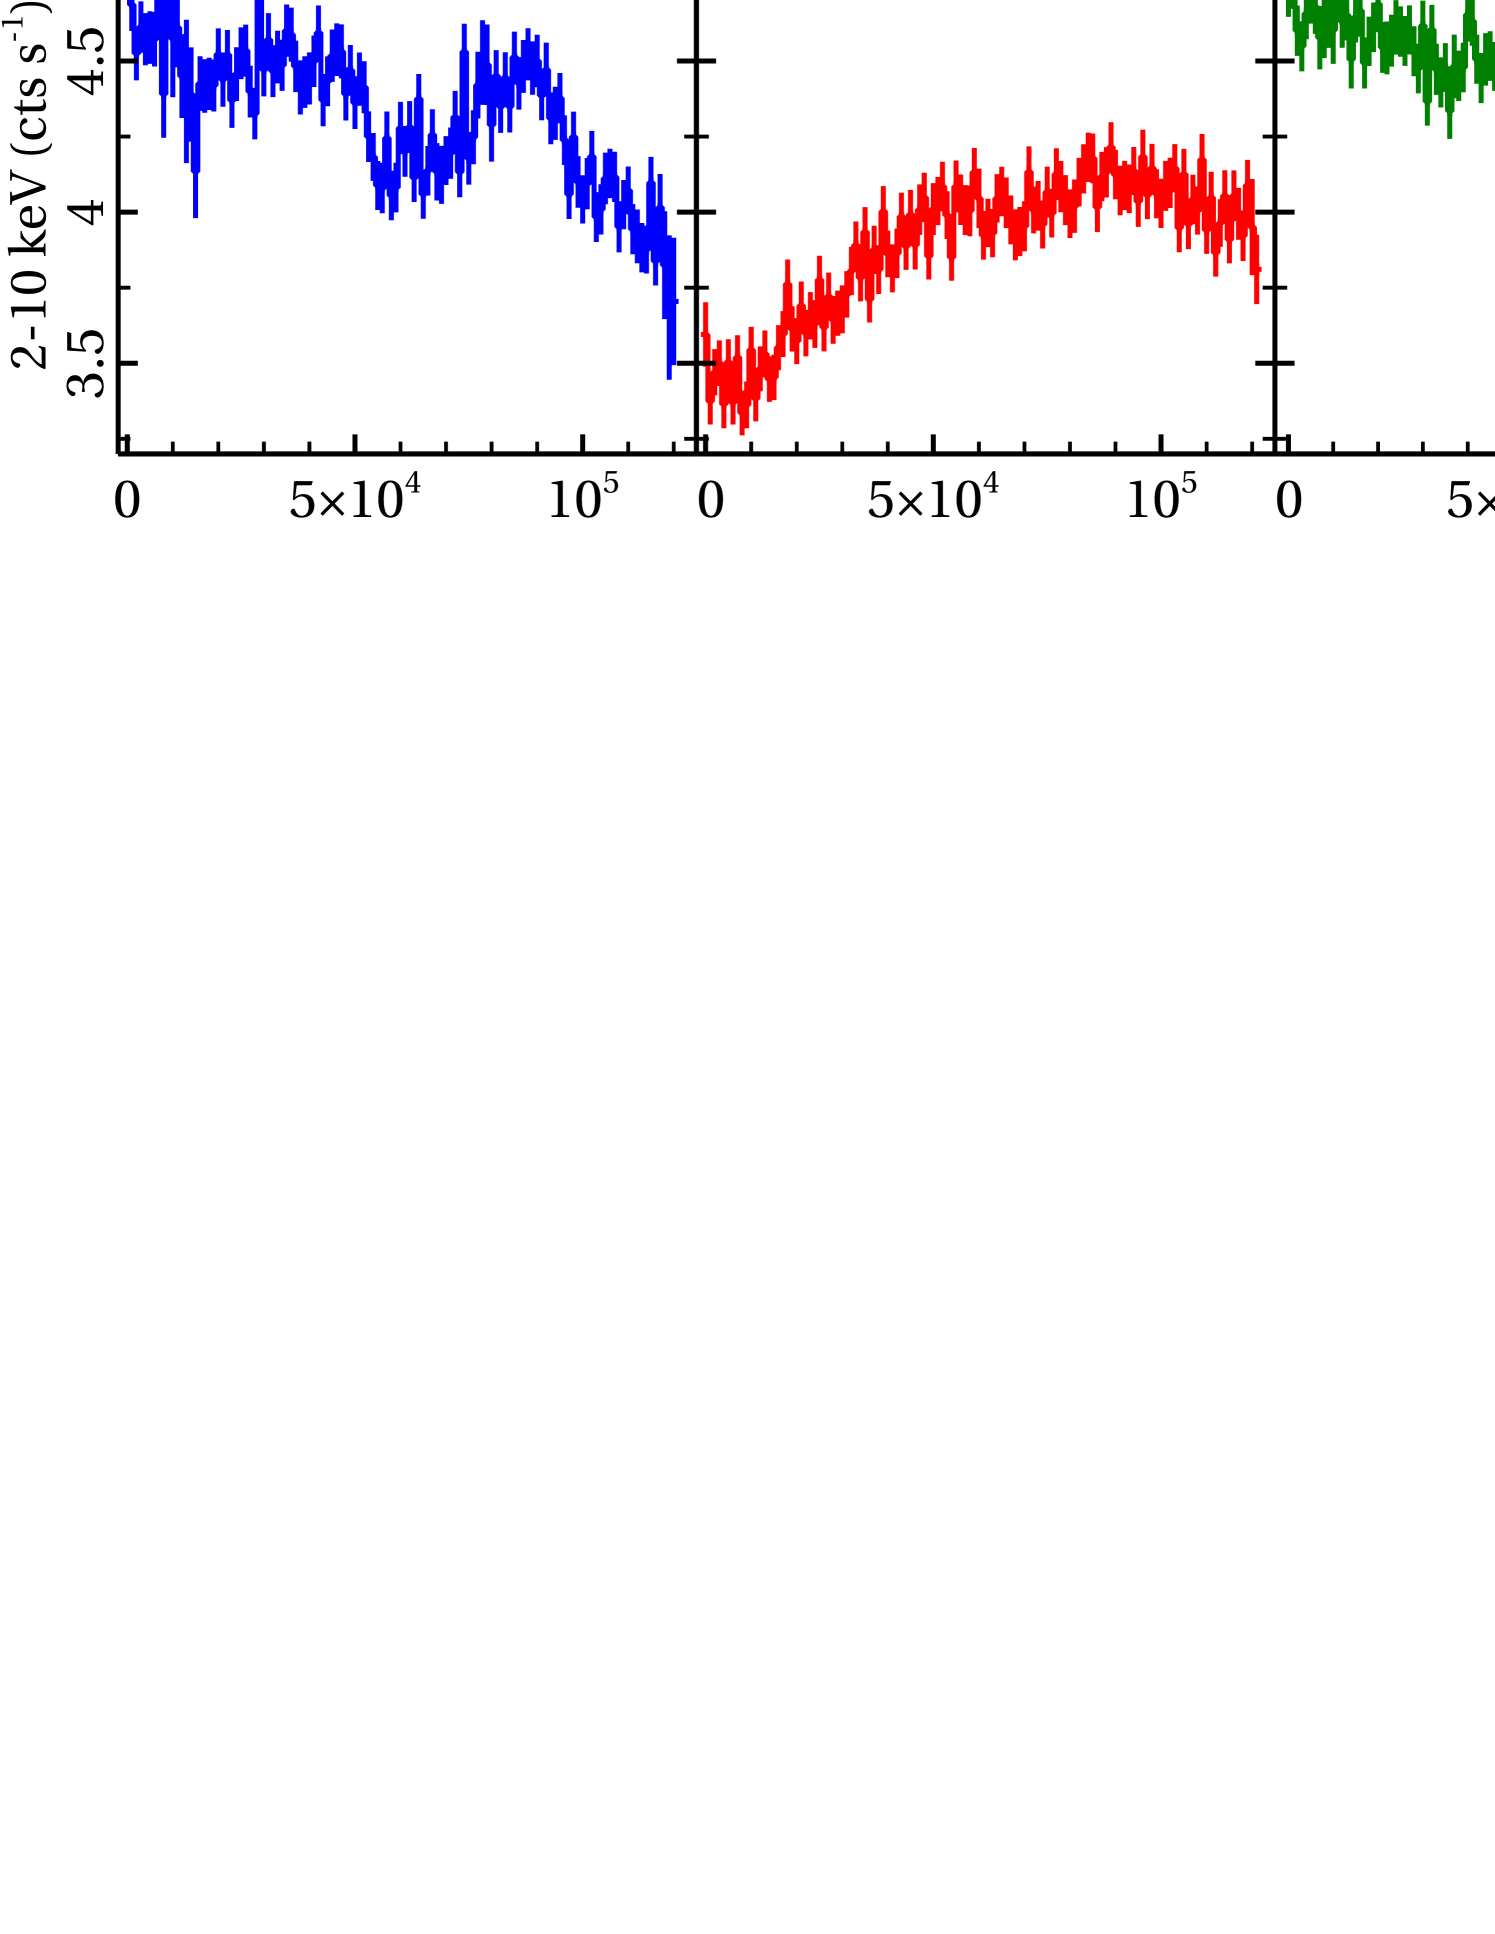
Ark 120 showed moderate short-term variability during the 2014 XMM-Newton observations. The top panels in Figure 8 show the background subtracted, 0.310 keV EPIC-pn light curves with the time bin size of 1 ks. A visual inspection of the light curve indicates that Ark 120 underwent a gradual flux variability by a factor of , , and within the 2014a, 2014b, 2014c and 2014d observations, respectively. The amplitude of the observed variations are of per cent, per cent, per cent and per cent of the mean count rate on ks timescales derived from the 2014a, 2014b, 2014c and 2014d EPIC-pn light curves, respectively. The fractional root-mean-squared (rms) variability amplitudes in the full band (0.310 keV) are ) per cent, () per cent, () per cent and () per cent for 2014a, 2014b, 2014c and 2014d, respectively. The error on was computed in conformity with Vaughan et al. (2003). In the bottom panel of Fig. 8, we have shown the simultaneous UVW2 light curves of Ark 120 with a time resolution of 1 ks extracted from the OM/fast mode observation. The fractional rms variability amplitudes in the UVW2 band are ) per cent, () per cent, () per cent and () per cent for 2014a, 2014b, 2014c and 2014d, respectively.
To study the energy dependence of X-ray variability, we extracted the time series in two energy bands: soft (S=0.32 keV) and hard (H=210 keV). Figure 9 shows the background subtracted soft (top panel) and hard (middle panel) X-ray light curves of Ark 120 with the time binning of 1 ks. The pattern of variability between the soft and hard X-ray bands is similar except for 2014d where the trend is acutely different. The percentage of fractional variability in the soft band exceeds the hard band variability except for 2014b where the soft and hard bands have comparable variability amplitude. The mean count rate, the absolute rms amplitude and the fractional rms variability amplitude in the full, soft and hard bands are listed in Table 3.
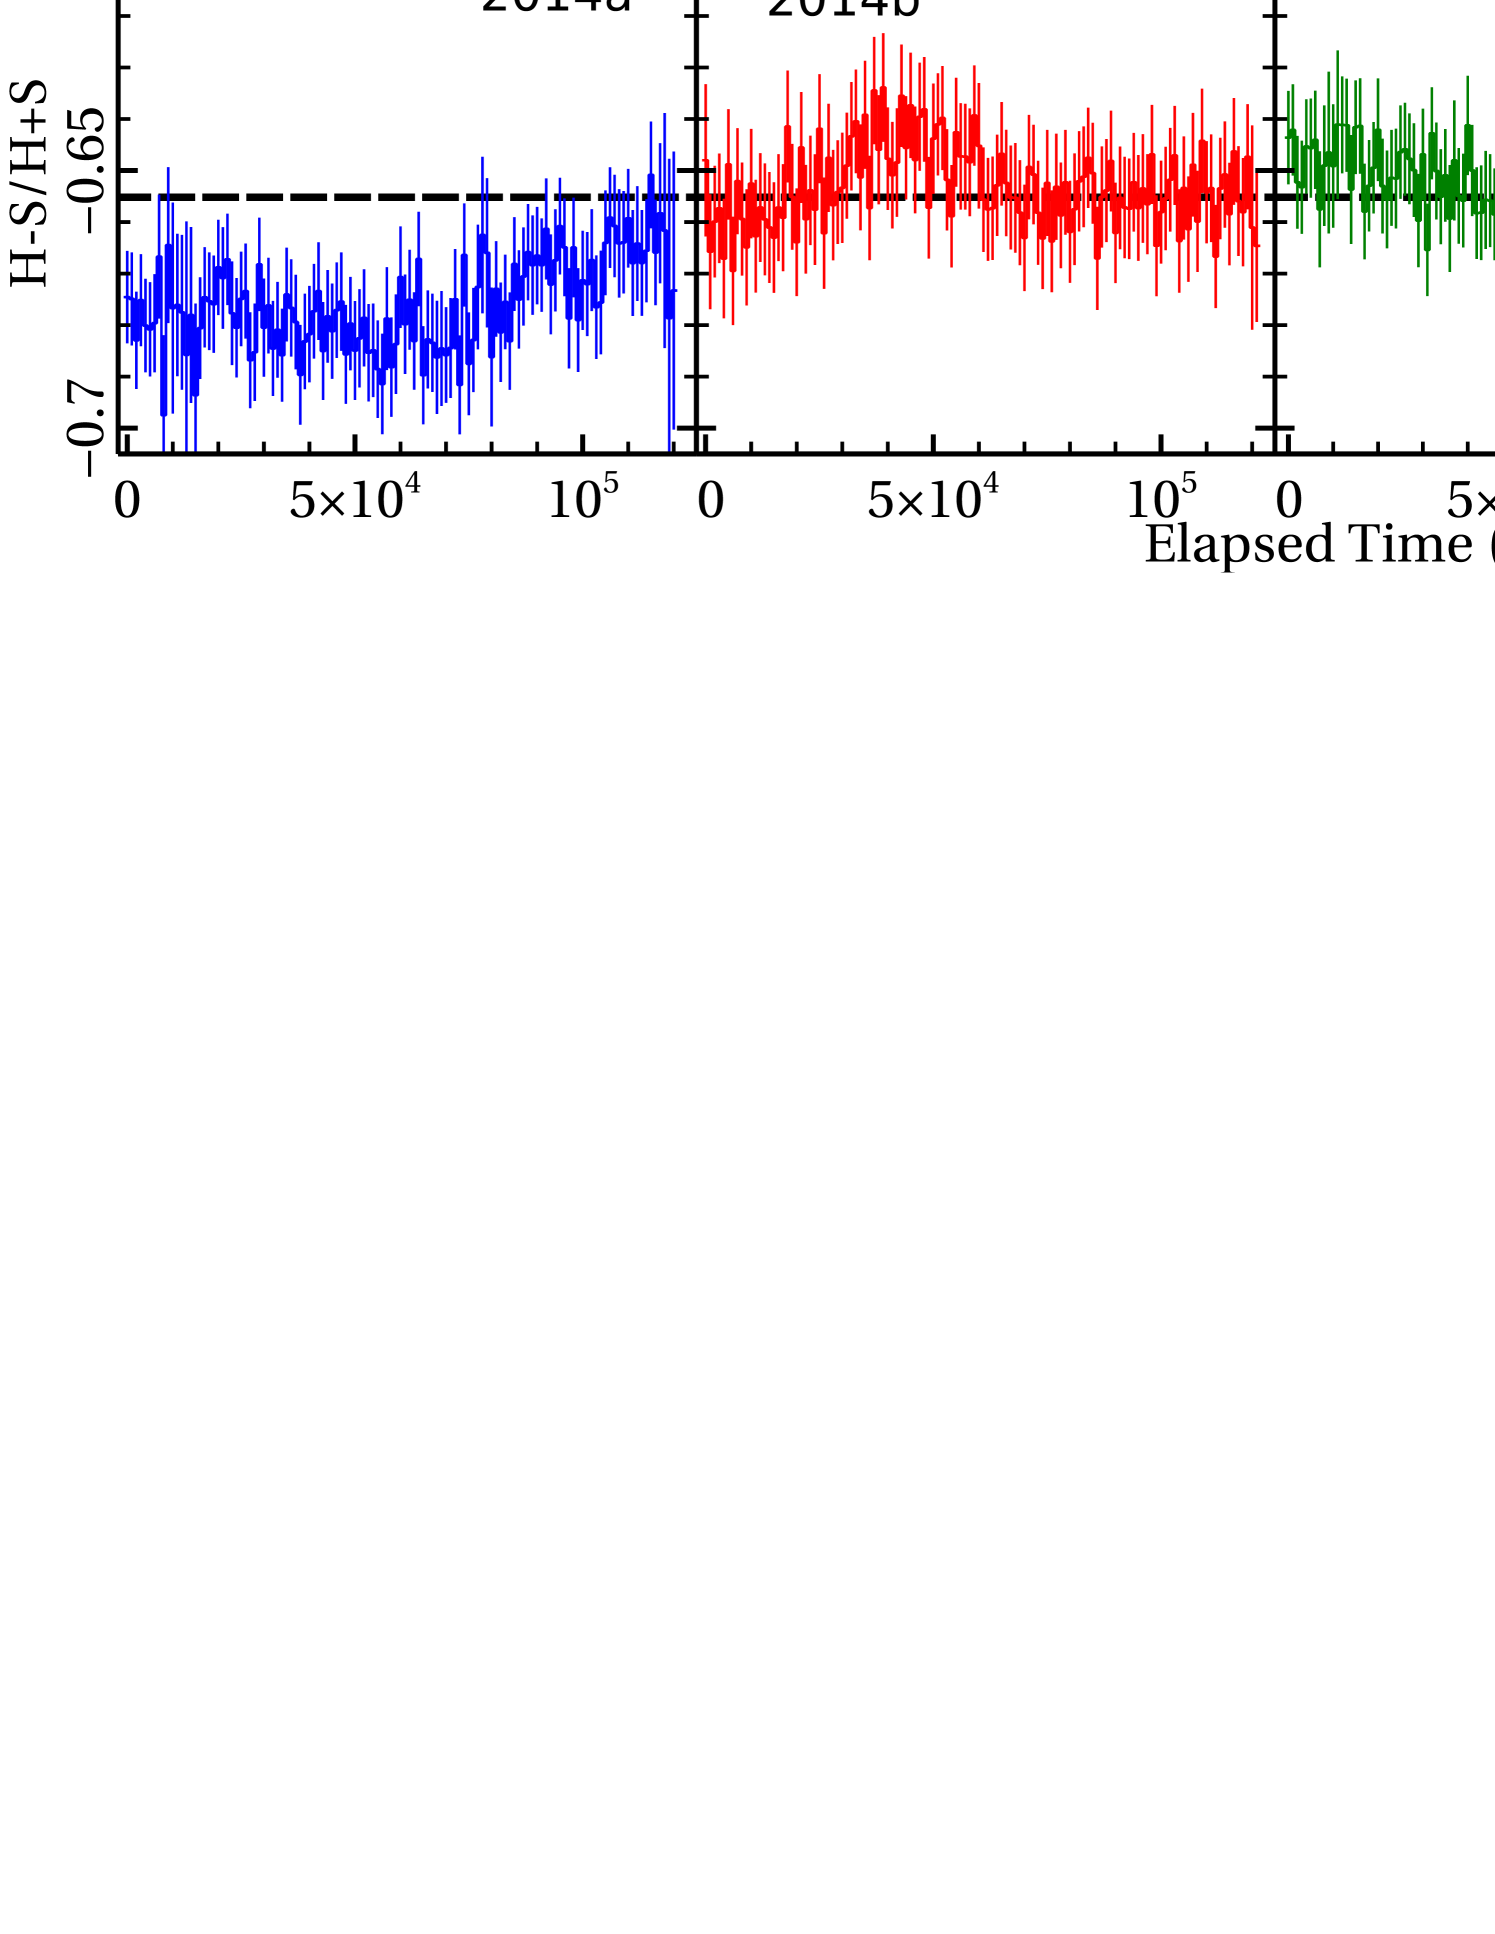
In the bottom panel of Fig. 9, we have shown the time series of the hardness ratio which is defined by HS/H+S. To investigate the time variability of the hardness ratio, we fitted a constant model to all four 2014 data sets which provided a statistically unacceptable fit with /d.o.f = 1249/485, indicating the presence of a significant spectral variability over the period of days. Thus the X-ray time series and hardness ratio analysis imply that the source is variable in flux as well as in spectral shape.
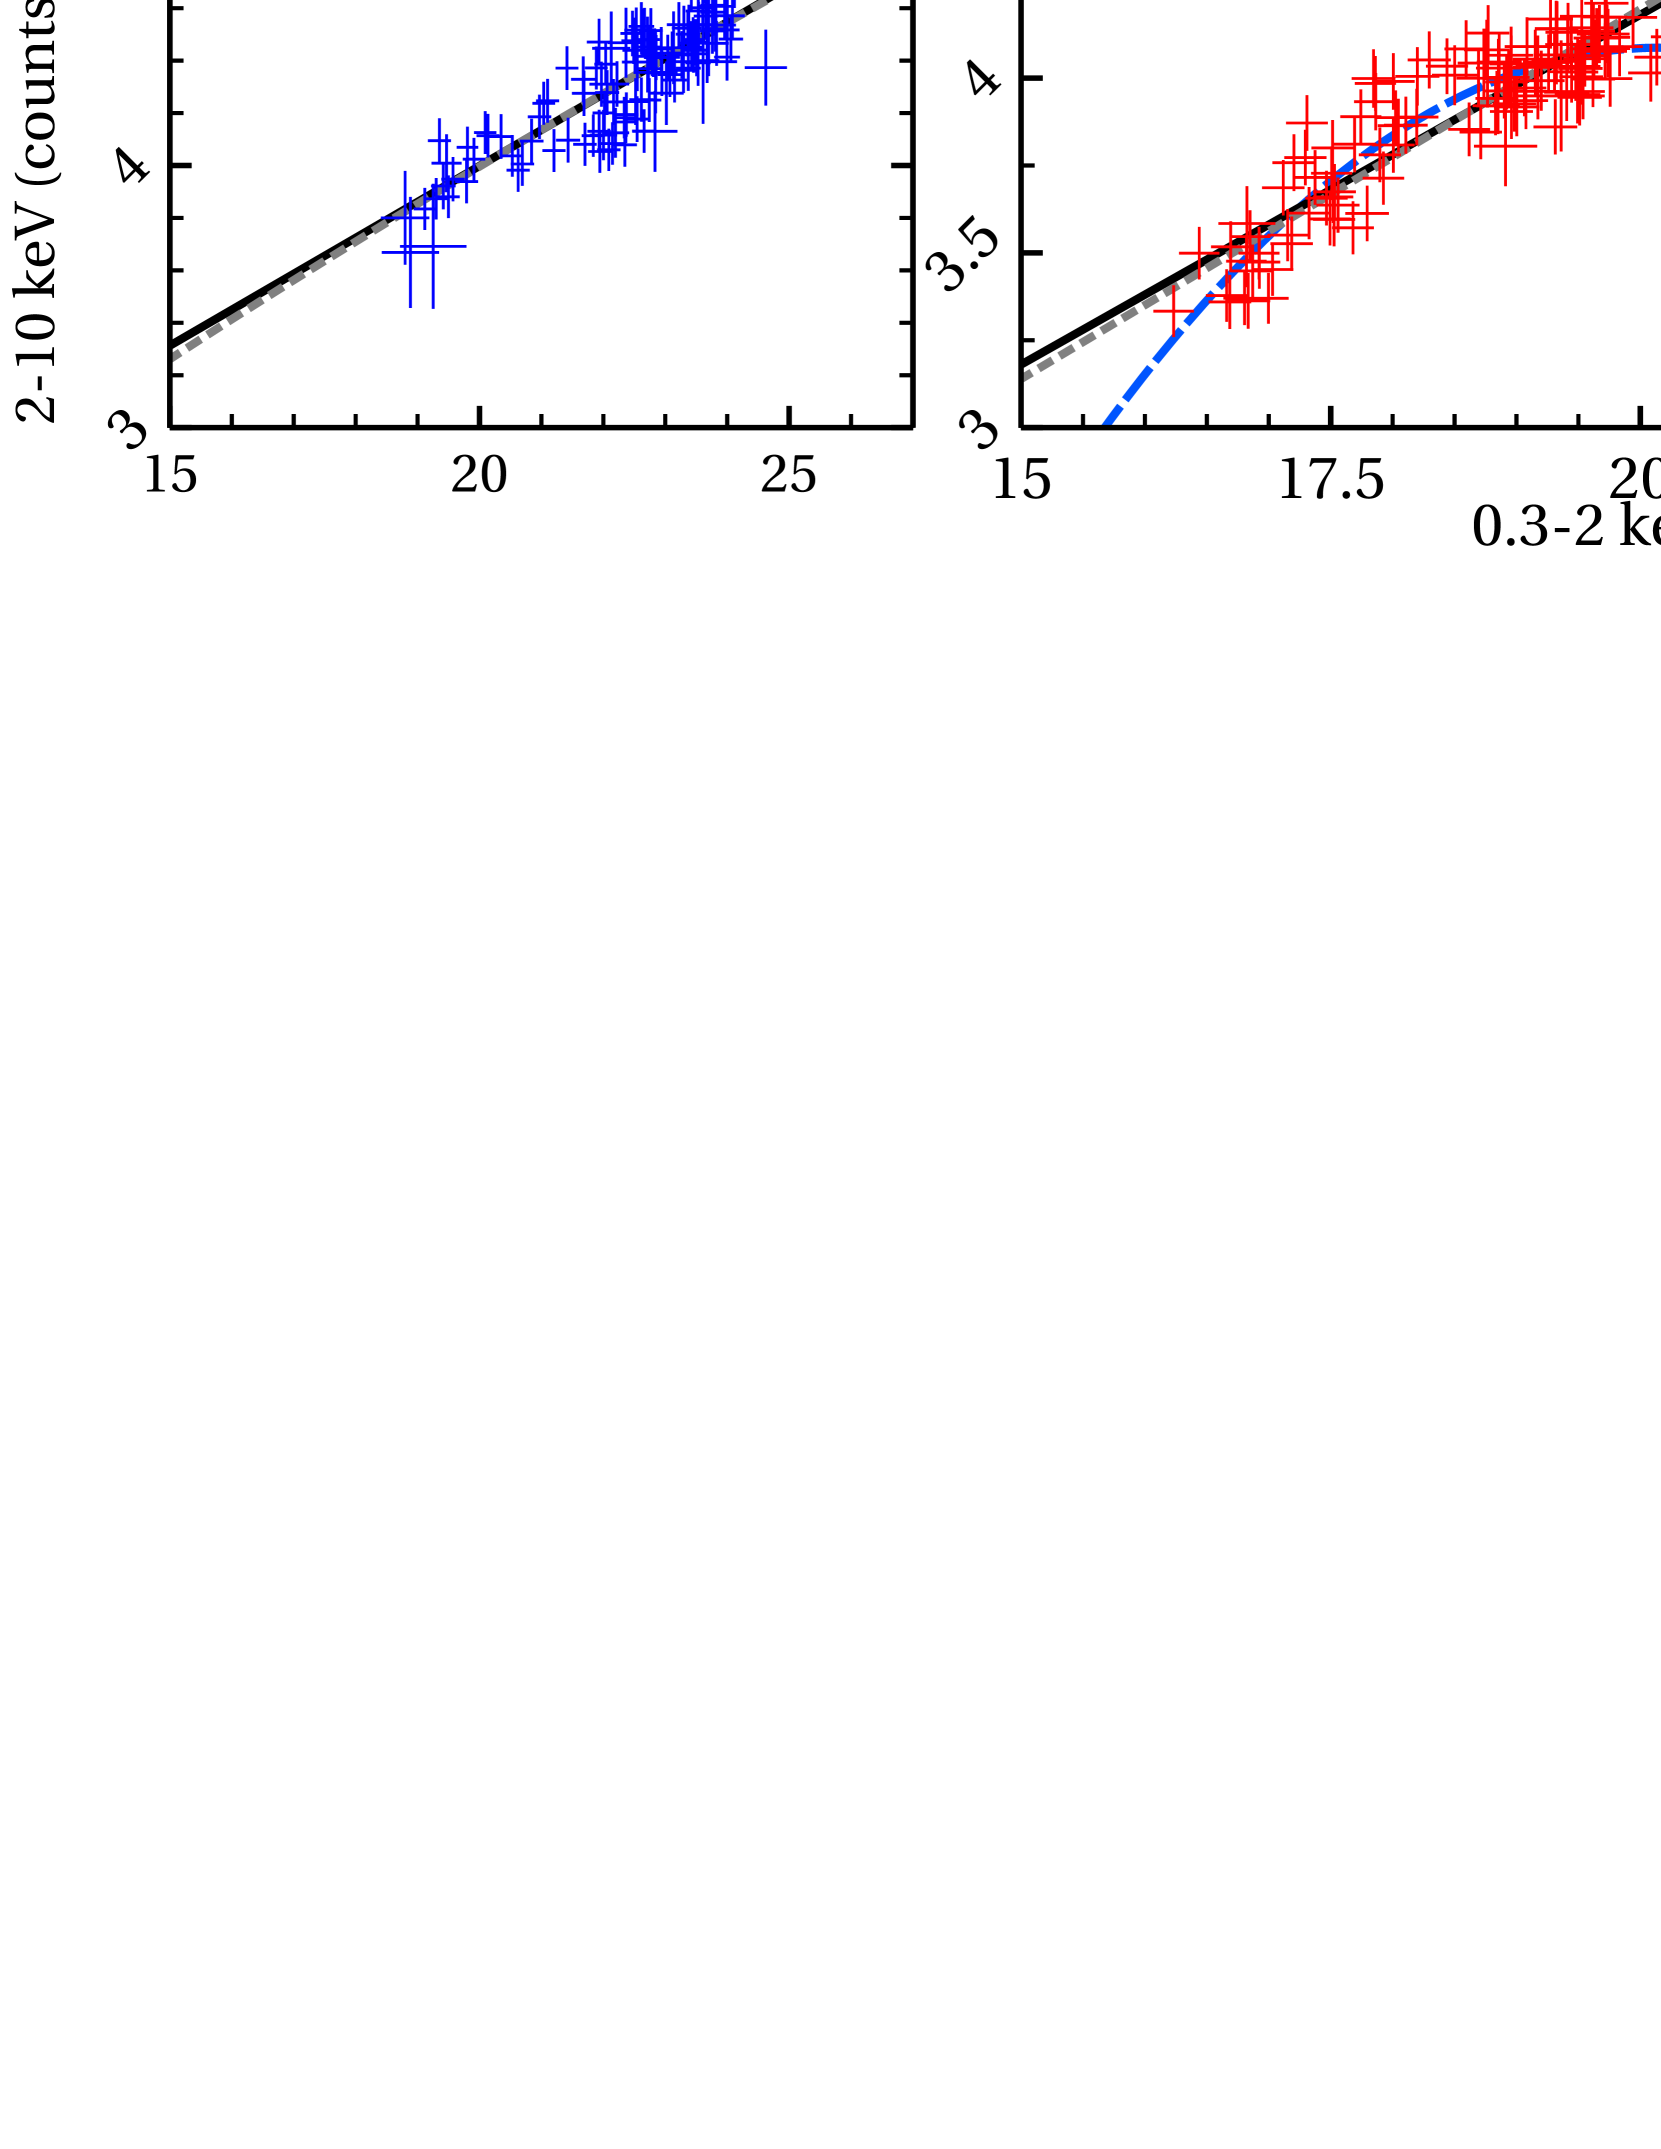
4.2 FluxFlux Analysis
To investigate the connection between the soft and hard X-ray bands, we derived the H (=210 keV) vs S (=0.32 keV) fluxflux plots with the time bin size of 1 ks, which are shown in Figure 10. The fluxflux analysis is a model-independent approach to probe the spectral variability and has been successfully applied in a number of Galactic sources and Seyfert galaxies (e.g. Cyg X-1: Churazov, Gilfanov & Revnivtsev 2001, MCG-6-30-15: Taylor, Uttley & McHardy 2003). First, we fitted a linear model of the form, to the data which resulted in a good fit to all four 2014 observations except for 2014b. In order to test whether the pivoting of the primary emission is responsible for variability, we fitted a power-law without constant component to the data which provided an equally good fit except for 2014b where we found that a quadratic function of the form, described the data better with /d.o.f = 150.6/119. In the case of 2014d, the soft and hard band count rates are anti-correlated with the Spearman rank correlation coefficient of and null hypothesis probability of . The 2014 FluxFlux plots of Ark 120 can be reasonably fitted by both the linear and power-law models except for 2014b where more complex modelling is required by the data. The results of the FluxFlux modelling are listed in Table 4. We also investigated the variability relation between the UVW2 and X-ray bands. Figure 11 shows the variation of the UVW2 count rate as a function of the full band ( keV) X-ray count rate. To test for any UV/X-ray correlation, we calculated the Spearman rank correlation coefficient between the UVW2 and X-ray count rates for all four 2014 observations. The estimated correlation coefficient is which indicates that the X-ray and UV emission are not significantly correlated at zero time-lag. The lack of a formal correlation could be due to a sampling problem which arises when one section of the data is much more heavily sampled than another. There is a lot of scatter in the data and most of the points are concentrated in the bottom left region of Fig. 11, which dominate the correlation.
4.3 HardnessIntensity Diagram
The study of the hardness ratio (HR) versus total X-ray flux is an important model-independent approach which is used to determine the spectral evolution of the source and its association with the observed flux variability. Figure 12 shows the hardnessintensity diagram (HID) for all four EPIC-pn observations of Ark 120. The source showed a decrease in spectral hardness with increasing flux within the 2014a, 2014c and 2014d observations, although the HID of the 2014b observation is found to be an inverted-crescent shaped with two opposite trends below and above the mean count rate of cts s-1. In order to numerically quantify whether Ark 120 is harder- or softer-when-brighter, we fitted the HID of the source with a linear model of the form . The best-fitting model parameters are listed in Table 5; the best-fitting model is shown as the solid black line in Fig. 12. The modelling of the HID reveals the softer-when-brighter behaviour of Ark 120 during the 2014a, 2014c and 2014d observations. The only exception is the 2014b data where Ark 120 had the lowest flux during the first ks of the observation and then the source switched from the harder-when-brighter to softer-when-brighter behaviour at a count rate of cts s-1. In Figure. 13, we have also shown the X-ray hardness ratio versus UVW2 count rate. The estimated Spearman rank correlation coefficient between the X-ray hardness and UVW2 count rate is with the null hypothesis probability of . Thus we conclude that the source is brighter in the UVW2 band when it is softer in X-rays.
4.4 The rmsflux relation
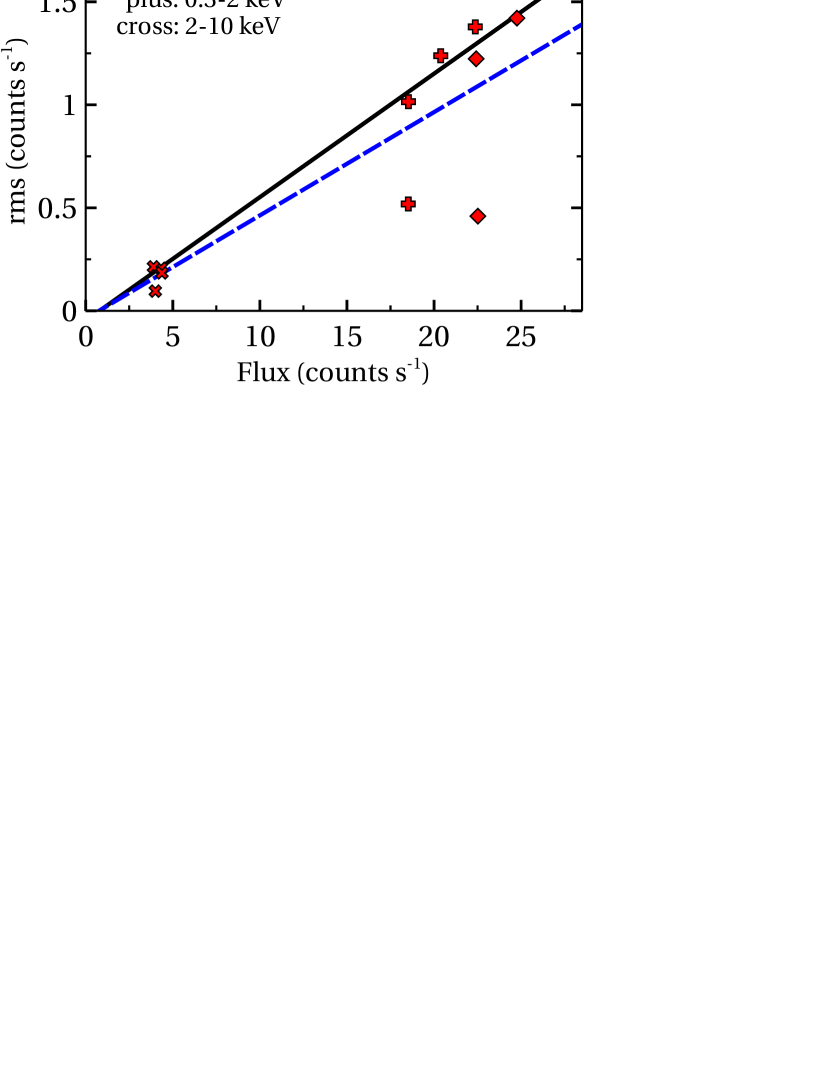
We also derived the rmsflux relation which represents the behaviour of the absolute rms variability amplitude as a function of the X-ray flux and is commonly observed to be linear in X-ray binaries and AGN with a large range of black hole masses (Uttley & McHardy, 2001; Gaskell, 2004; Uttley et al., 2005). The absolute rms variability amplitude is defined by the sample variance minus the uncertainties due to Poisson noise (Vaughan et al., 2003):
| (1) |
where is the total variance of the time series of length and is the mean squared error which is defined by
| (2) |
We calculated the absolute rms in the background subtracted EPIC-pn light curves of time bins 1 ks using equation (1) in three different energy bands: full (0.310 keV), soft (0.32 keV) and hard (210 keV). The rmsflux relation for Ark 120 is shown in Figure 14. To test the linearity of the relationship, we fitted a linear model of the form , which described the data well excluding 2014d. The best-fitting values of the slope and intercept are and , respectively. The black solid line is the best-fitting linear model to the data excluding 2014d. The inclusion of the 2014d data causes a slight deviation from the best-fitting linear relation due to its much less variability and is shown as the blue dashed line Fig. 14.
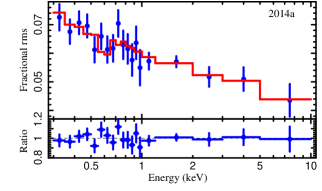
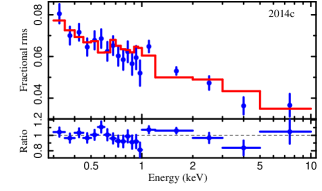
4.5 Fractional rms Spectral Modelling
To quantify the variability of different spectral parameters and the relationship between them, we derived and modelled the fractional rms spectrum of Ark 120. First, we generated background subtracted EPIC-pn light curves in a number of energy bands with a time resolution of ks. Then we calculated the fractional rms variability amplitude and its error in each light curve using the formula given in Vaughan et al. (2003). The frequency averaged ( Hz) fractional rms spectra of Ark 120 are shown in Figure 15. The source showed a decrease in fractional variability with energy for 2014a and 2014c. However, we found noticeably different rms spectra in the case of 2014b and 2014d. The 2014b variability spectrum showed an increase in fractional rms with energy up to keV and then it started decreasing. For 2014d, the fractional variability decreases with energy until keV and then it begins to rise with energy.
The fractional rms variability spectrum can distinguish the variable spectral components present in the mean spectrum and therefore can be considered as a useful tool to probe the spectral variability of AGN (Miniutti et al. 2007; Fabian 2012; Mallick et al. 2016; Mallick & Dewangan 2017). In order to identify the spectral components responsible for the observed X-ray variability and to compute the fractional variability of variable spectral parameters, we modelled the fractional rms variability spectra of Ark 120. First we generalized the equation (4) of Mallick et al. (2016) for numbers of variable spectral parameters () of the mean spectrum consisting of numbers of spectral components (). Therefore the expression for the fractional rms variability spectrum can be written as
| (3) |
where
| (4) |
and
| (5) |
The equation (4) represents the best-fitting mean spectral model which consists of a thermally Comptonized primary continuum (), a blurred reflection (), a distant reflection () and an intrinsic disc Comptonized component (). Mathematically, the expression for the best-fitting mean spectral model excluding the Galactic absorption can be written as
| (6) |
The equation (5) represents variations in the mean spectrum arising due to variable spectral components. If the observed X-ray variability is due to variations in the normalization () and slope () of the primary emission (nthcomp) and the luminosity () of the soft excess emission (optxagnf) then the equation (5) can be written as
| (7) |
where
| (8) |
and
| (9) |
Therefore the expression for the fractional rms can be written as
| (10) |
We then expanded the first term on the right-hand side (R.H.S) of equation (8) and (9) in a Taylor series around the variable parameters (, ) and , respectively and then ignored higher order (from the second order derivatives onward) terms. The Taylor series expansion also provides the correlation coefficient, between these two parameters, and of the primary spectral component (nthcomp). We then constructed the fractional rms spectral model (equation 10) in S-Lang V2.3.0 and implemented in ISIS V.1.6.2-32 (Houck & DeNicola, 2000) as a local model.


| Variable | Model | Parameter | 2014a | 2014b | 2014c | 2014d |
| Component | ||||||
| Primary Continuum | nthcomp | (per cent) | ||||
| (per cent) | 0.8 | |||||
| 0.8 | 0.88 | 0.9 | 1 | |||
| Soft Excess | optxagnf | (per cent) | ||||
| C-stat/d.o.f | 9.2/15 | 11.1/8 | 20.6/15 | 27.2/15 |
Initially, we fitted the keV fractional rms spectra with the primary continuum (nthcomp) model having only variable normalization . This resulted in a statistically unacceptable fit with C-stat/d.o.f = 725.6/18, 280/11, 839.3/18 and 368.4/18 for 2014a, 2014b, 2014c and 2014d respectively. Then we introduced the slope variation () of the primary continuum and also the correlation coefficient () between and , which improved the fit to C-stat/d.o.f = 268.3/16 (=457 for 2 d.o.f), 41.3/9 (=239 for 2 d.o.f), 639.3/16 (=200 for 2 d.o.f) and 146.2/16 (=222 for 2 d.o.f) for 2014a, 2014b, 2014c and 2014d, respectively. However, the variable primary emission (nthcomp) model underestimated the low energy ( keV) variability which is basically driven by the soft excess. Therefore we introduced variability in the soft excess luminosity, of the optxagnf model which provided a significant improvement in the fitting with C-stat/d.o.f = 9.2/15 (=259), 11.1/8 (=30.2), 20.6/15 (=618.7) and 27.2/15 (=119) for 2014a, 2014b, 2014c and 2014d, respectively. The best-fitting model parameters are listed in Table 6. The best-fitting rms model for all four observations is shown as solid red lines in Fig. 15. Thus the modelling of the X-ray (0.310 keV) variability spectra suggests the presence of two constant reflection components, a variable soft excess and a variable primary continuum in Ark 120.

5 Discussion and Conclusions
5.1 Summary
We present results from a long ( ks) XMM-Newton/EPIC-pn and OM analysis of the bare Seyfert 1 galaxy Ark 120 observed during 2014 March. We investigated the small-amplitude, short-term variability in the source through a detailed analysis of the X-ray spectral-timing properties and UV/X-ray connection over the observed -week period. We also distinguished between the variable components (primary continuum and soft excess) using the fractional rms spectral modelling. We summarize the main results of our work below.
-
1.
The X-ray (0.310 keV) spectrum of Ark 120 is well described by a thermally Comptonized primary continuum with two (one blurred and one distant) reflection components and a warm Comptonization component for the soft X-ray continuum. The lower limit on the inner disc radius estimated from the blurred reflection model is , , and for 2014a, 2014b, 2014c and 2014d, respectively, which are in close agreement with the results obtained by Nardini et al. (2016). The coronal radius determined from the joint fitting of four X-ray spectra is .
-
2.
Ark 120 was observed in a moderately variable state with the fractional X-ray (0.310 keV) and UVW2 variability amplitudes to lie in the range of per cent and per cent, respectively on timescales of days.
-
3.
The joint spectral fitting of all four observations (2014a, 2014b, 2014c and 2014d) revealed a significant variability in the soft excess luminosity, primary power-law normalization and photon index, although there was no noticeable variation in the electron temperature ( keV) of the optically thick, warm corona.
-
4.
The fractional variability amplitude in the soft band (0.32 keV) is higher than the hard band (210 keV) which is indicative of the presence of multiple spectral components varying differently, while for the second observation (2014b), the fractional rms amplitude variation in these two bands is found to be similar.
-
5.
Ark 120 exhibits more variability when brighter which is consistent with the linear rms-flux relation observed in accreting objects over a wide range in black hole mass. However, the variability in 2014d was much less than the other three observations and hence causes a slight deviation from the linear relation (see Fig. 14).
-
6.
The soft (0.32 keV) and hard (210 keV) band count rates are found to be correlated with each other for the 2014a, 2014b and 2014c observations. However, for the 2014d observation, we found a moderate anti-correlation between these two bands (see Fig. 10). The hard band positive offset observed in all four flux–flux plots can be interpreted as a corroboration for the presence of a constant component at higher energies, which is in agreement with the non-variability of the reflection components (iron emission complex) as inferred from the X-ray variability spectral modelling. A similar behaviour was also observed in another Seyfert 1 galaxy MCG-6-30-15 (Miniutti et al., 2007).
-
7.
The fractional rms variability decreases with energy for 2014a and 2014c. However, the X-ray rms variability spectra for 2014b and 2014d are found to be inverted-crescent and crescent shaped, respectively (see Fig. 15). The modelling of the X-ray (0.310 keV) variability spectra confirmed the presence of constant reflection components, a variable disc Comptonized soft excess emission and a variable illuminating continuum (see Table 6).
-
8.
The hardness ratio analysis shows a softer-when-brighter behaviour for Ark 120 during the 2014 observations. However, we found a dual nature of the hardnessintensity diagram (HID) during the 2014b observation where the source evolves from harder-when-brighter to softer-when-brighter behaviour at the mean count rate of cts s-1 (see Fig. 12). A detailed discussion of the peculiar HID including flux resolved rms spectrum for the second observation is deferred to a future paper.
5.2 Primary Continuum Variability
The energy-dependent X-ray variability of Ark 120 showed strong modulation during 2014 March as observed in Fig. 15. Our spectral and timing analyses suggest that the observed moderate variability is predominantly due to the primary continuum which is variable both in flux and spectral shape. The variations in the normalization and spectral index of the hot coronal emission are correlated with each other by per cent. The softening of the source with increasing keV flux is consistent with that observed from the radio-quiet AGN (e.g. Vaughan & Edelson 2001; Papadakis et al. 2007; Emmanoulopoulos et al. 2011). This type of variability is generally attributed to the thermal Comptonization where an increase in the seed photon flux cools down the hot corona, resulting in a steeper primary emission. We also found a harder-when-brighter behaviour of Ark 120 in the beginning (first 46 ks) of the 2014b observation during which the source was in the lowest flux state among all four observations. Such a behaviour is generally observed in blazars (e.g. Krawczynski et al. 2004; Gliozzi et al 2006; Mallick et al. 2016) or in low luminosity AGN (e.g. Emmanoulopoulos et al. 2012; Connolly et al. 2016). The intrinsic X-ray (0.310 keV) luminosities of Ark 120 are erg s-1, erg s-1, erg s-1 and erg s-1 for 2014a, 2014b, 2014c and 2014d respectively, while for the first 46 ks of the 2014b observation, the source luminosity is estimated to be erg s-1 which is about 1.3 times less than the 2014a observation. The dominant variable component appears to be the primary continuum (see Table 6) during the 2014b observation, thus the dual nature of the HID is likely to be caused by intrinsic variations of the hot corona.
To investigate the disc/corona interaction in the inner regions of the accretion disc, we studied the dependence of disc ionization state () on the Eddington ratio () which is considered as a probe to test the -disc accretion theory (Shakura & Sunyaev, 1973). According to the standard -disc model, the disc ionization parameter is expected to be correlated with the bolometric luminosity of AGN (Isobe et al., 1990; Ballantyne et al., 2011). We estimated the Eddington ratio of Ark 120 by applying the 210 keV bolometric correction (, Vasudevan et al. 2009) to the X-ray (210 keV) luminosity. By definition, . We calculated the unabsorbed 210 keV flux from the combined time-averaged spectrum using the convolution model cflux in xspec. Thus the bolometric luminosity is estimated to be . For (Peterson et al., 2004), the Eddington luminosity is and hence the Eddington ratio for Ark 120 is which is around 1.6 times higher than the Eddington rate () estimated by Vasudevan & Fabian (2007) using the ASCA X-ray data. The discrepancy in the Eddington ratio is due to variations in the intrinsic 210 keV source luminosity between 1994 ASCA and 2014 XMM-Newton observations. Figure 16 shows the dependence of disc ionization parameter () on the Eddington ratio for a number of Seyfert galaxies (Ballantyne et al., 2011) including Ark 120 (Nardini et al. 2011 and this work). The solid line represents the linear relation [] from Isobe et al. (1990). The departure of Ark 120 from the predicted linear relation can be attributed to the changing coronal power assuming a constant radiative efficiency of the accretion disc (Ballantyne et al., 2011), which is further supported by the presence of a variable coronal emission in the X-ray rms spectra of Ark 120.
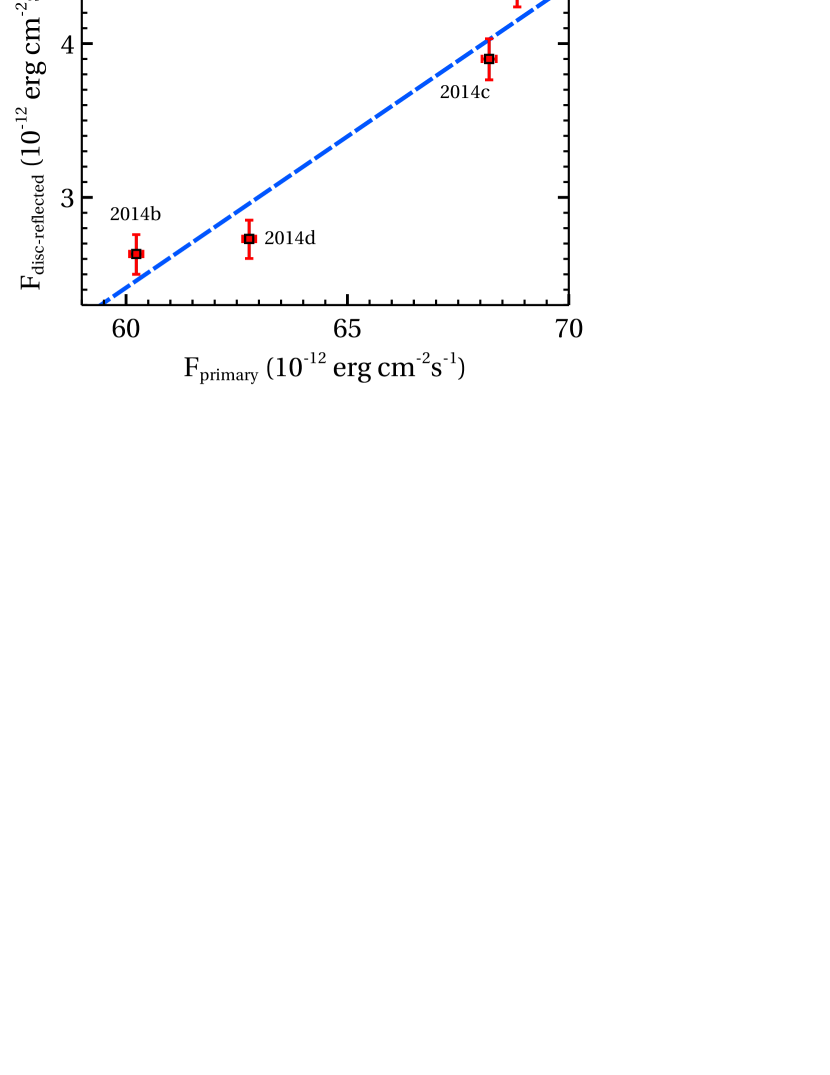
The nature of the hard band variability in Ark 120 is complex and the fractional rms variability pattern is changing from observation-to-observation (see Fig. 15) which can be explained in terms of the interplay between the primary continuum (flux/spectral shape) and reflected emission from the accretion disc. In Figure 17, we have shown the variation of the disc reflected flux as a function of the intrinsic continuum flux during the course of the 2014 observations. The approximately linear correlation between the primary continuum and disc reflected fluxes implies that the variation in the highly ionized disc reflected emission is driven by the changes in the illuminating flux and thus variability is intrinsic to the X-ray source. Therefore the complex hard X-ray variability of Ark 120 can be attributed to the X-ray emitting hot corona with a variable intrinsic luminosity. The fractional variations in the normalization of the incident continuum are per cent, per cent, per cent and per cent for 2014a, 2014b, 2014c and 2014d, respectively. Above keV, the fractional rms decreases with energy for the first three observations. This behaviour is due to spectral steepening with flux possibly resulting from changes in the optical depth and/or electron temperature of the hot corona. A similar hard X-ray rms variability pattern has been observed in other Seyfert galaxies (e.g. IC 4329A: Brenneman et al. 2014 and NGC 4151: Keck et al. 2015). In the case of 2014d observation, the fractional rms variability above keV increases with energy which is probably due to the hot coronal compactness variability with a minimal normalization variability of the hard Comptonized component (Gierliński & Zdziarski, 2005). From the X-ray variability spectral modelling, we found that the fractional variation in the normalization of the primary continuum for 2014d observation is only percent which is much less (a factor of ) compared to the other three observations (see Table 6).
5.3 Soft Excess Variability
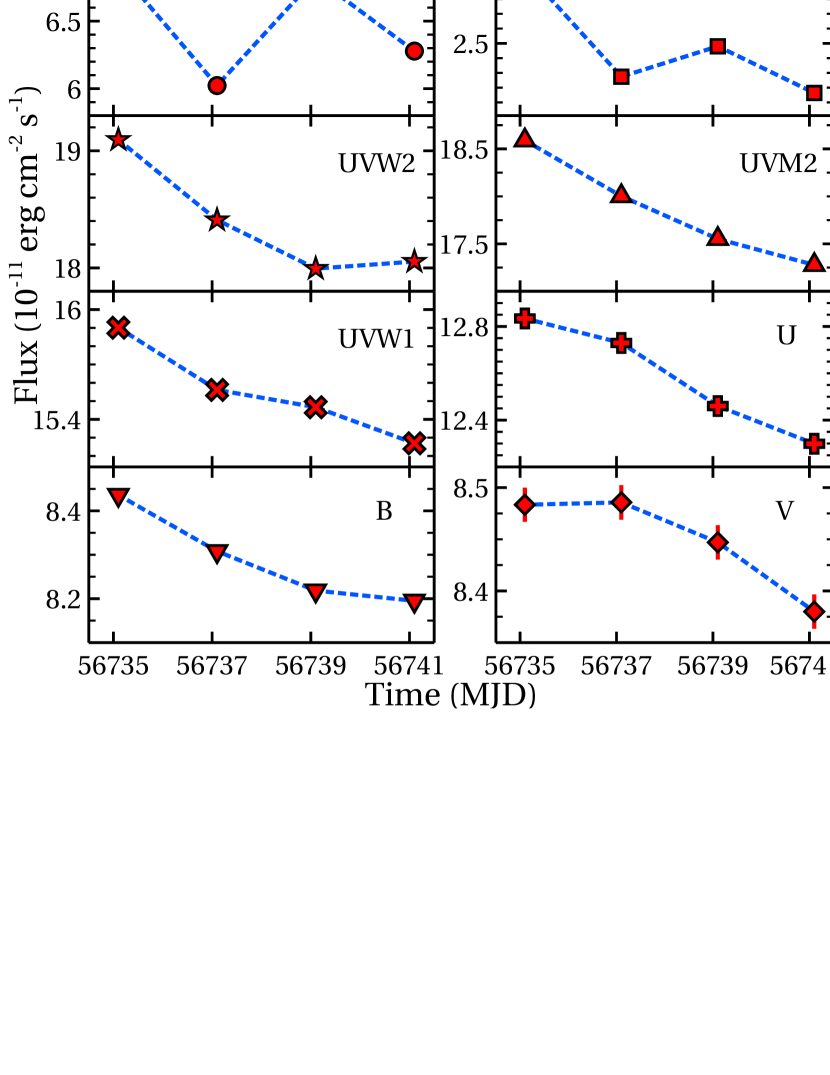
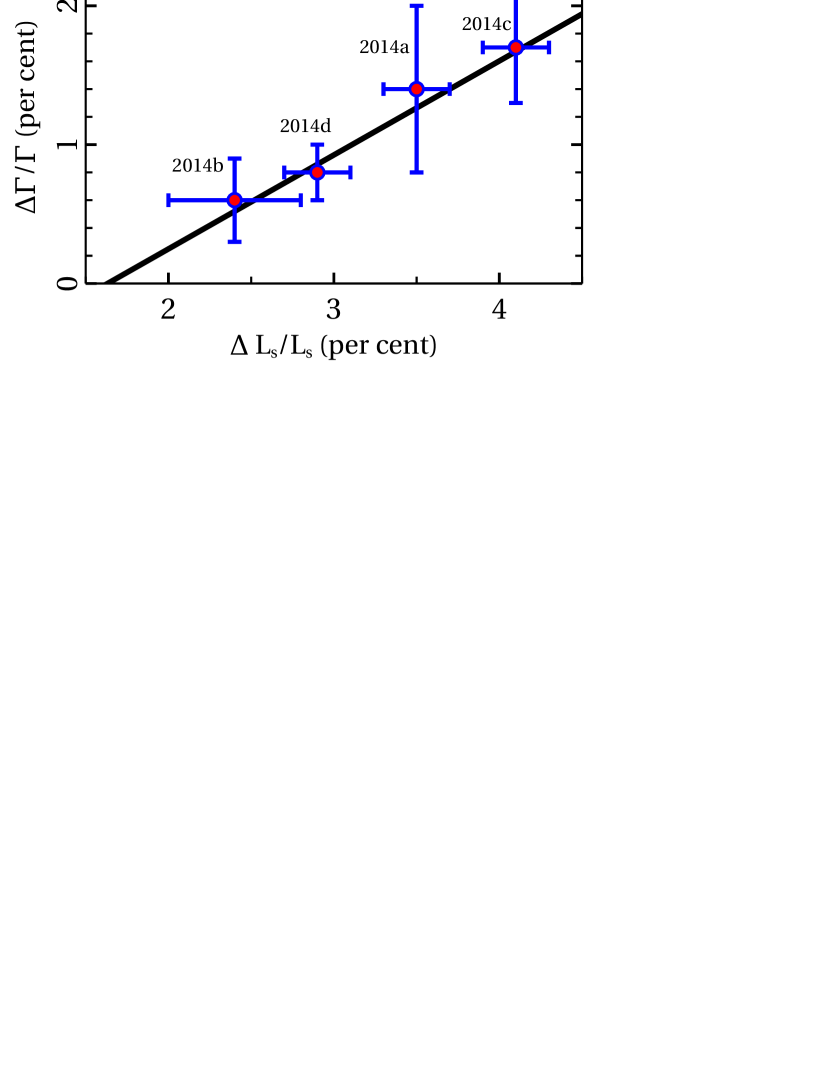
In all four observations, Ark 120 showed a strong soft X-ray excess emission which is described by the intrinsic disc Comptonization model, which requires a warm corona with the electron temperature of keV and the optical depth of . The observed soft excess emission is variable within individual observations ( days) as well as between observations typically separated by day. The X-ray rms spectral modelling implies that the observed soft excess variability in the keV band is caused by the luminosity variation of the warm corona. The fractional variations in the luminosity of the soft excess emitting warm corona are per cent, per cent, per cent and per cent for 2014a, 2014b, 2014c and 2014d, respectively. Although the soft excess flux is variable, we did not find any significant variations in the electron temperature and optical depth of the warm corona. The variability pattern of the soft excess flux appears to be correlated with both the intrinsic power-law flux and de-reddened UV (in particular UVW1) flux over the entire days period (Figure 18). Moreover, the variations in the soft excess luminosity and the primary continuum photon index are correlated with each other over the observed timescale (see Fig. 19), which further supports the softer-when-brighter behaviour of Ark 120. All these characteristics are in favour of Comptonization models where the soft excess and primary X-ray emission are produced through Compton up-scattering of the UV and UV/soft X-ray seed photons, respectively.
5.4 UV/X-ray Connection
The fractional UV variability amplitude in Ark 120 is lower (a factor of ) compared to the X-ray variability which is expected since the intrinsic UV emission originates from the outer disc and/or broad-line region (BLR) (Reeves et al., 2016). For Ark 120, Gliozzi et al (2017) found that the X-rays led UV by days. The lack of a correlation between the UV and X-ray emission at zero lag may be due to a long reprocessing delay between these two bands or a sampling problem which is caused by the concentration of data points in a narrow range of the UVW2 vs. X-ray flux-flux plot (see Fig. 11). We found that the UV emission from Ark 120 is anti-correlated with the X-ray hardness ratio (see Fig. 13), which suggests that the UV seed photons from the accretion disc/BLR get Compton up-scattered in the corona and as the seed photon supply to the corona increases, the corona cools down and hence the observed X-ray spectrum becomes steeper. This behaviour further supports Comptonization scenario as a physical process responsible for the connection between the UV and X-ray emission from Ark 120 over the observed -week period. A similar UV flux/X-ray hardness ratio anti-correlation has been observed in a few other Seyfert galaxies (e.g. MCG-6-30-15: Arévalo et al. 2005 and NGC 5548: McHardy et al. 2014).
The X-ray spectral softening of the source with the UV flux (Fig. 13), as well as an identical variability trend between the UVW1/soft excess or UVW1/primary continuum flux over the observed days timescales (Fig. 18) indicate that both the soft excess emitting warm corona and primary X-ray emitting hot corona are powered by the Comptonization of the lower energy UV seed photons. The observed linear correlation between the fractional variations in the soft excess luminosity and spectral index of the primary continuum (Fig. 19) implies that the Comptonized soft X-ray photons from the warm corona can also act as seed photons for the production of the primary X-ray emission in the hot corona. However, distinguishing the spatial separation between the warm and hot coronae quantitatively is beyond the scope of this work. Our spectro-temporal analysis suggests that the observed energy-dependent variability of Ark 120 is a consequence of variations in the spectral shape and intrinsic luminosity of the primary X-ray emitting hot corona, as well as the luminosity of the soft excess emitting warm corona, both of which are driven by variations in the Comptonizing seed photon flux.
6 Acknowledgements
The authors thank the anonymous referee for valuable comments and suggestions which helped to improve the manuscript. LM is thankful to Poshak Gandhi, Ranjeev Misra and Julien Malzac for useful comments. IMcH thanks the Royal Society for support under a Royal Society Leverhulme Trust Senior Research Fellowship, and thanks STFC for support under grant ST/M001326/1. This research has made use of archival data of XMM-Newton observatory through the High Energy Astrophysics Science Archive Research Center Online Service, provided by the NASA Goddard Space Flight Center. This research has made use of the NASA/IPAC Extragalactic Database (NED), which is operated by the Jet Propulsion Laboratory, California Institute of Technology, under contract with the NASA. Figures in this paper were made with the GUI scientific plotting package veusz.
References
- Arnaud (1996) Arnaud K. A., 1996, ASPC, 101, 17
- Arévalo et al. (2005) Arévalo P., Papadakis I., Kuhlbrodt B., Brinkmann W., 2005, A&A, 430, 435
- Ballantyne et al. (2011) Ballantyne D. R., McDuffie J. R., Rusin J. S., 2011, ApJ, 734, 112
- Brenneman et al. (2014) Brenneman L. W., Madejski G., Fuerst F., Matt G., Elvis M. et al. 2014, ApJ, 788, 61
- Churazov, Gilfanov & Revnivtsev (2001) Churazov E., Gilfanov M., Revnivtsev M., 2001, MNRAS, 321, 759
- Crenshaw & Kraemer (2001) Crenshaw D. M., Kraemer S. B., 2001, ApJ, 562, L29
- Czerny et al. (2003) Czerny B., Nikołajuk M., Różańska A., Dumont A.-M., Loska, Z., Zycki, P. T., 2003, A&A, 412, 317
- Crummy et al. (2006) Crummy J., Fabian A. C., Gallo L., Ross R. R., 2006, MNRAS, 365, 1067
- Connolly et al. (2016) Connolly S. D., McHardy I. M., Skipper C. J., Emmanoulopoulos D. 2016, MNRAS, 459, 3963
- Chainakun & Young (2017) Chainakun P., Young A. J., 2017, MNRAS, 465, 3965
- Dewangan et al. (2007) Dewangan G. C., Griffiths R. E., Dasgupta S., Rao A. R., 2007, ApJ, 671, 1284
- Done et al. (2012) Done C., Davis S. W., Jin C., Blaes O., Ward M., 2012, MNRAS, 420, 1848
- Esin et al. (1997) Esin Ann A., McClintock Jeffrey E., Narayan R., 1997, ApJ, 489, 865
- Emmanoulopoulos et al. (2011) Emmanoulopoulos D., Papadakis I. E., McHardy I. M., et al., 2011, MNRAS, 415, 1895
- Emmanoulopoulos et al. (2012) Emmanoulopoulos D., Papadakis I. E., M c Hardy I. M., Arévalo P., Calvelo D. E., Uttley P., 2012, MNRAS, 424, 1327
- Frank, King & Raine (2002) Frank J., King A., Raine D. J., 2002, Accretion Power in Astrophysics. Cambridge Univ. Press, Cambridge
- Fabian et al. (2002) Fabian A. C., Ballantyne D. R., Merloni A., Vaughan S., Iwasawa K., Boller Th., 2002, MNRAS, 331L, 35
- Fabian (2012) Fabian A., 2012, ARA&A, 50, 455
- Fender et al. (1999) Fender R., Corbel S., Tzioumis T., McIntyre V., et al., 1999, ApJ, 519, L165
- Fender et al. (2004) Fender R. P., Belloni T. M., Gallo E., 2004, MNRAS, 355, 1105
- Gierliński & Done (2004) Gierliński M., Done C., 2004, MNRAS, 349, 7
- Gaskell (2004) Gaskell C. Martin, 2004, ApJL, 612, L21
- Gierliński & Zdziarski (2005) Gierliński M., Zdziarski A. A., 2005, MNRAS, 363, 1349
- Gliozzi et al (2006) Gliozzi M., Sambruna R. M., Jung I., Krawczynski H., Horan D., Tavecchio F., 2006, ApJ, 646, 61
- Garćia et al (2014) García J., Dauser T., Lohfink A., Kallman T. R., et al., 2014, ApJ, 782, 76
- Gliozzi et al (2017) Gliozzi M., Papadakis I. E., Grupe D., Brinkmann W. P., Rath C., 2017, MNRAS, 464, 3955
- Haardt & Maraschi (1991) Haardt F. & Maraschi L., 1991, ApJ, 380, 51
- Haardt & Maraschi (1993) Haardt F. & Maraschi L., 1993, ApJ, 413, 507
- Houck & DeNicola (2000) Houck J. C. & DeNicola L. A., 2000, ASPC, 216, 591
- Isobe et al. (1990) Isobe T., Feigelson E. D., Akritas M. G., Babu G. J. 1990, ApJ, 364, 104
- Jansen et al. (2001) Jansen F. et al., 2001, A&A, 365, L1
- Kurpiewski et al. (1997) Kurpiewski A., Kuraszkiewicz J., Czerny B., 1997, MNRAS, 285, 725
- Krawczynski et al. (2004) Krawczynski H. et al., 2004, ApJ, 601, 151
- Kalberla et al. (2005) Kalberla P. M. W., Burton W. B., Hartmann D., et al., 2005, A&A, 440, 775
- Keck et al. (2015) Keck M. L., Brenneman L. W., Ballantyne D. R., Bauer F., et al., 2015, ApJ, 806, 149
- Leighly (1999b) Leighly K. M., 1999, ApJS, 125, 317
- Lohfink et al. (2012) Lohfink A. M., Reynolds C. S., Miller J. M., Brenneman L. W., Mushotzky R. F., Nowak M. A., Fabian A. C., 2012, ApJ, 758, 67
- Lobban et al. (2016) Lobban A. P., Vaughan S., Pounds K., Reeves J. N., 2016, MNRAS, 457, 38
- Magdziarz et al. (1998) Magdziarz P., Blaes O. M., Zdziarski A. A., Johnson W. N., Smith D. A., 1998, MNRAS, 301, 179
- Mason et al. (2001) Mason K. O. et al., 2001, A&A, 365, 36
- Miniutti & Fabian (2004) Miniutti G., Fabian A. C., 2004, MNRAS, 349, 1435
- Miniutti et al. (2007) Miniutti G., Fabian A. C., Anabuki N., Crummy J. et al., 2007, PASJ, 59S, 315
- Markoff, Nowak & Wilms (2005) Markoff S., Nowak M. A., Wilms J., 2005, ApJ, 635, 1203
- Matt et al. (2014) Matt G., Marinucci A., Guainazzi M., Brenneman L. W., Elvis M. et al. 2014, MNRAS, 439, 3016
- Marinucci et al. (2014) Marinucci A., Matt G., Miniutti G., Guainazzi M. et al., 2014, ApJ, 787, 83
- McHardy et al. (2014) McHardy I. M., Cameron D. T., Dwelly T., Connolly S., et al, 2014, MNRAS, 444, 1469
- Mallick et al. (2016) Mallick L., Dewangan G.C., Gandhi P. et al., 2016, MNRAS, 460, 1705
- Mallick & Dewangan (2017) Mallick L. & Dewangan G.C., 2017, arXiv:1702.08383
- Narayan & Yi (1994) Narayan R. & Yi I., 1994, ApJ, 428, 13
- Nardini et al. (2011) Nardini E., Fabian A. C., Reis R. C., Walton D. J. 2011, MNRAS, 410, 1251
- Nardini et al. (2016) Nardini, E. Porquet, D., Reeves J. N., Braito V., Lobban A., Matt G., 2016, ApJ, 832, 45
- Poutanen & Svensson (1996) Poutanen J. & Svensson R., 1996, ApJ, 470, 249
- Peterson et al. (2004) Peterson B. M., Ferrarese L., Gilbert K. M., Kaspi S. et al., 2004, ApJ, 613, 682
- Papadakis et al. (2007) Papadakis I. E., Brinkmann W., Page M. J., McHardy I., Uttley P., 2007, A&A, 461, 931
- Ponti et al. (2012) Ponti G., Papadakis I., Bianchi S., Guainazzi M., Matt G., Uttley P., Bonilla N. F., 2012, A&A, 542, A83
- Ross & Fabian (2005) Ross R.R., Fabian A.C., 2005, MNRAS, 358, 211
- Reis & Miller (2013) Reis R. C., Miller J. M., 2013, ApJ, 769, L7
- Reeves et al. (2016) Reeves J. N., Porquet D., Braito V., Nardini E., Lobban A., Turner T. J., 2016, ApJ, 828, 98
- Shakura & Sunyaev (1973) Shakura N. I. & Sunyaev R. A., 1973, A&A, 24, 337
- Sunyaev & Titarchuk (1980) Sunyaev R. A. & Titarchuk L. G., 1980, Astronomy and Astrophysics, 86, 121
- Strüder et al. (2001) Strüder L. et al., 2001, A&A, 365, L18
- Titarchuk (1994) Titarchuk L., 1994, ApJ, 434, 570
- Turner et al. (1999) Turner T. J., George I. M., Nandra K., Turcan D., 1999, ApJ, 524, 667
- Taylor, Uttley & McHardy (2003) Taylor R. D., Uttley P., McHardy I. M., 2003, MNRAS, 342, 31
- Theureau et al. (2005) Theureau G., Coudreau N., Hallet N., Hanski M. et al., 2005, A&A, 430, 373
- Uttley & McHardy (2001) Uttley P., McHardy I. M., 2001, MNRAS, 323, 26
- Uttley et al. (2005) Uttley P., McHardy I. M., Vaughan S., 2005, MNRAS, 359, 345
- Vaughan & Edelson (2001) Vaughan S., Edelson R., 2001, ApJ, 548, 694
- Vaughan et al. (2003) Vaughan S., Edelson R., Warwick R. S., Uttley P., 2003, MNRAS, 345, 1271
- Vaughan et al. (2004) Vaughan S., Fabian A. C., Ballantyne D. R., De Rosa A., Piro L., Matt G., 2004, MNRAS, 351, 193
- Véron-Cetty & Véron (2006) Véron-Cetty M.-P., Véron P., 2006, A&A, 455, 773
- Vasudevan & Fabian (2007) Vasudevan R. V., Fabian A. C., 2007, MNRAS, 381, 1235
- Vasudevan et al. (2009) Vasudevan R. V., Mushotzky R. F., Winter L. M., Fabian A. C., 2009, MNRAS, 399, 1553
- Ward et al. (1987) Ward M. J., Elvis M., Fabbiano G., Carleton N. P., Willner S. P., Lawrence A., 1987, ApJ, 315, 74
- Wandel et al. (1999) Wandel A., Peterson B. M., Malkan M. A., 1999, ApJ, 526, 579
- Wilkins et al. (2016) Wilkins D. R., Cackett E. M., Fabian A. C., Reynolds C. S., 2016, MNRAS, 458, 200
- Zdziarski, Johnson & Magdziarz (1996) Zdziarski A. A., Johnson W. N., Magdziarz P., 1996, MNRAS, 283, 193