The curious case of PDS 11: a nearby, 10 Myr old, classical T Tauri binary system
Abstract
We present results of our study of PDS 11 binary system, which belongs to a rare class of isolated, high galactic latitude T Tauri stars. Our spectroscopic analysis reveals that PDS 11 is a M2M2 binary system with both components showing similar H emission strength. Both the components appear to be accreting, and are classical T Tauri stars. The lithium doublet Li i 6708, a signature of youth, is present in the spectrum of PDS 11A, but not in PDS 11B. From the application of lithium depletion boundary age-dating method and a comparison with the Li i 6708 equivalent width distribution of moving groups, we estimated an age of 1015 Myr for PDS 11A. Comparison with pre-main sequence evolutionary models indicates that PDS 11A is a 0.4 M⊙ T Tauri star at a distance of 114131 pc. PDS 11 system does not appear to be associated with any known star forming regions or moving groups. PDS 11 is a new addition, after TWA 30 and LDS 5606, to the interesting class of old, dusty, wide binary classical T Tauri systems in which both components are actively accreting.
1 Introduction
T Tauri stars are low-mass (K & M spectral types) young stars which are in their pre-main sequence phase of evolution (e.g., Joy, 1945; Bertout, 1989; Herczeg & Hillenbrand, 2014). They are often associated with cloud complexes such as Taurus, Orion and Ophiuchus (Herbig, 1962; Herczeg & Hillenbrand, 2014; Appenzeller & Mundt, 1989). However, T Tauri stars are also found in isolated regions above the Galactic plane and far from any dark clouds (de la Reza et al., 1989; McGehee, 2013; Elliott et al., 2016). TW Hydrae was the first such ‘isolated T Tauri star’ identified, which was later found to be part of an association of about three dozen members, known as TW Hydrae association (TWA, Kastner et al., 1997; Zuckerman & Song, 2004; Mamajek, 2016). They were not runaway stars from molecular clouds but formed in situ in the present region 10 Myr ago, which is now devoid of molecular gas (Rucinski & Krautter, 1983; Tachihara et al., 2009). Since then several such nearby, young associations have been identified such as, the Pictoris moving group, the AB Doradus moving group, the Tucana/Horologium association etc., within 100 pc of the Sun (see Zuckerman & Song, 2004; Torres et al., 2008; Mamajek, 2016, for a review).
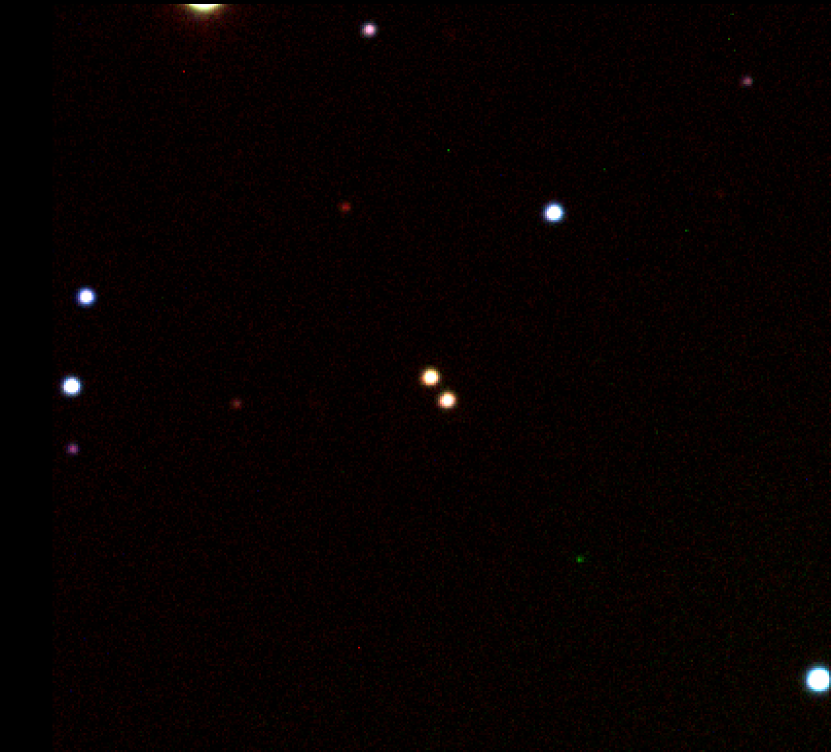
In this paper we present a detailed analysis of the high galactic latitude (b = 30∘) binary T Tauri star system PDS 11 (GSC 04744-01367, IRAS 04451-0539). Gregorio-Hetem et al. (1992) have reported this to be a binary system with components PDS (PDS stands for Pico dos Dias Survey) 11A and PDS 11B. PDS 11A is the North-Eastern component of the binary (Figure 1). PDS 11A and PDS 11B are present in the Washington double star (WDS) catalog, with the component magnitudes being 14.76 and 15.34, respectively. The position angle (PA) and separation were found to be 216∘ and 8.8, respectively (Mason et al., 2001). Our analysis indicate that PDS 11 is a young (1015 Myr), nearby (114131 pc) binary T Tauri system, where both the components are possibly accreting. The paper is arranged as follows. Section 2 describes the optical and near-IR observations. The results from this study are presented in Sect. 3. A detailed discussion of the key results is given in Sect. 4, and finally in Sect. 5 we present our conclusions.
2 Observations and data reduction
2.1 Optical spectroscopy
Optical spectra of both the components of the PDS 11 system in the wavelength range 38009000 Å were obtained with the Himalayan Faint Object Spectrograph Camera (HFOSC)111Further details of the instruments and telescopes is available at http://www.iiap.res.in/iao/hfosc.html mounted on the 2-m Himalayan Chandra Telescope (HCT). The wavelength range was covered using Grism 7 (blue region, 38005500 Å) and Grism 8 (red region, 55009000 Å). The grisms in combination with 1.92 wide and 11 long slit provide an effective resolving power of 900 in blue region and 1050 in red region. A spectrophotometric standard, Feige 34, was observed on the same night and is used for flux calibration. The observations were carried out on 2016 February 13. The FeNe, FeAr lamp spectra were taken after each on-source exposure for wavelength calibration. The spectra were reduced in a standard manner after bias subtraction and flat field correction using the standard tasks in Image Reduction and Analysis Facility (IRAF)222IRAF is distributed by the National Optical Astronomy Observatories, which are operated by the Association of Universities for Research in Astronomy, Inc., under cooperative agreement with the National Science Foundation. Further, the extracted spectra were wavelength calibrated and flux calibrated. The target was again observed on March 15 to confirm the spectral features observed. The log of observations is given in Table 1.
2.2 Near-infrared spectroscopy
We also obtained near-IR spectra of PDS 11 with TIFR near-infrared spectrometer and imager (TIRSPEC; Ninan et al., 2014) mounted on 2-m HCT. The spectra were taken in (1.021.20 m), (1.211.48 m), (1.491.78 m) and (2.042.35 m) bands, in combination with Grism and L3 slit (1.97 wide and 300 long). The effective resolving power is around 1200. The program stars PDS 11A and PDS 11B are co-aligned in the slit and care is taken while reducing the spectra to extract them separately. A telluric standard HIP34768 (A1V spectral type) at nearby airmass was also observed. The observations were carried out in dithered mode. The log of infrared spectroscopic observations is given in Table 1. Argon spectra were obtained after the object spectra for wavelength calibration. The wavelength calibrated object spectrum is divided with the the telluric spectrum whose hydrogen absorption lines were removed. The resultant spectrum is multiplied with a blackbody spectrum of 9230 K, corresponding to A1V spectral type of the telluric standard (Kenyon & Hartmann, 1995). The final spectrum is normalized with respect to the band center in , , and bands.
| Object | Date | Optical | Infrared | ||||
|---|---|---|---|---|---|---|---|
| Exp.time (s) | Exp.time (s) | ||||||
| Gr7/167l | Gr8/167l | ||||||
| PDS 11A | 2016 Feb. 13 | 1800 | 1800 | . | . | . | . |
| 2016 Feb. 14 | . | . | 1000 | 1000 | 1000 | 1000 | |
| 2016 Mar. 15 | 1800 | 1800 | . | . | . | . | |
| PDS 11B | 2016 Feb. 13 | 1800 | 1800 | . | . | . | . |
| 2016 Feb. 14 | . | . | 1000 | 1000 | 1000 | 900 | |
| 2016 Mar. 15 | 900 | 900 | . | . | . | . | |
| Feige 34 | 2016 Feb. 13 | 600 | 600 | . | . | . | . |
| HIP 34768 | 2016 Feb. 14 | . | . | 400 | 400 | 240 | 160 |
2.3 Optical photometry
We imaged the 1010 region centered on PDS 11 in passbands (Bessell, 1990) on 2016 March 19 using HFOSC. The data reduction was carried out using various packages available in IRAF. Aperture photometry was performed on the program star and nearby field stars. The , , magnitudes of the nearby field stars were obtained using available SDSS photometry, which were converted to Bessell system using the transformation relations given in Lupton (2005)333https://www.sdss3.org/dr10/algorithms/sdssUBVRITransform.php. The magnitude of the program stars were calibrated differentially with respect to the nearby field stars.
3 Results
3.1 Spectral analysis: optical and near-IR
The spectra of both PDS 11A (Figure 2) and PDS 11B (Figure 3) look very similar due to the presence of Balmer emission lines, from H all the way up to H8 (82), Ca ii H & K emission lines and TiO absorption bands, albeit with different line strengths. Gregorio-Hetem et al. (1992) reported an H equivalent width (EW) of 20 Å for PDS 11A and 42 Å for PDS 11B. The equivalent width measured from our spectra are 23 Å and 27 Å, which is quite different from the earlier measurements, particularly for PDS 11B. The EW and full width at half maximum (FWHM) of the prominent spectral lines are given in Table 2.


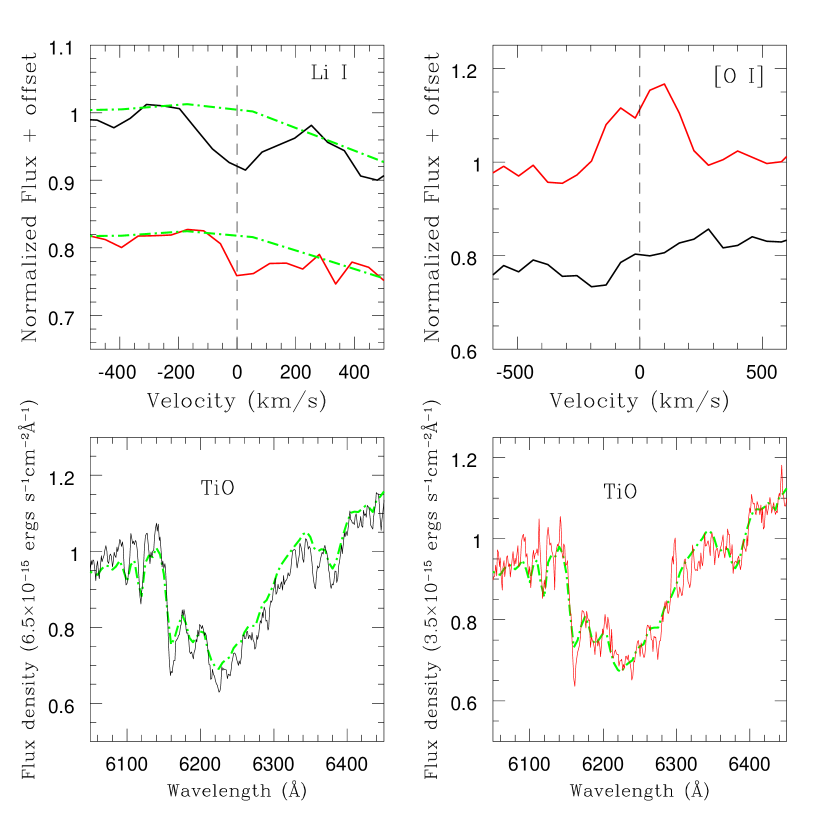
We found [O i] 6300 in emission in PDS 11B (Figure 4). This line is often seen in the collimated jets driven by accreting T Tauri stars (e.g. Hartigan et al., 1995; Hartmann, 2009). Whitelock et al. (1995) also noticed [O i] 6300 in the spectrum of PDS 11B. This emission line is not seen in the spectrum of PDS 11A, both in our observations and that of Whitelock et al. (1995). Zuckerman et al. (2014) have suggested that [O i] 6300 is formed by the photodissociation of OH molecules in the disk by far-ultraviolet stellar photons. We find evidence for the presence of He i 4471 and 5876 in emission in the spectra of PDS 11B (Figure 3). He i 4471 is red shifted by 3 Å , as seen from the spectra observed on 2016 February 13. This feature was absent during the observation on March 15. He i 5876 is affected by molecular absorption bands. However, when compared with the spectrum of PDS 11A, where He i 5876 is equally affected by molecular band absorption, an emission component is seen at 5876. It may be noted that Whitelock et al. (1995) identified He i 5876 emission in PDS 11B. It is possible that He i emission lines are formed from photoionization and subsequent recombination in the accretion shock region, close to the stellar surface (Zuckerman et al., 2014). Hence, the presence of [O i] 6300 and He i emission lines in the spectrum of PDS 11B suggest that it belongs to the class of accreting T Tauri stars.


The flux calibrated , , , spectra of PDS 11A and PDS 11B, normalized to band center values are shown in Figure 5. Since the signal to noise is low, the spectra is smoothed to 5 points for display purpose. Pa is the only prominent spectral line found in PDS 11A, which is present in emission with an EW of 3 Å. No prominent emission or absorption features are present in PDS 11B.
3.2 Spectral type estimation
We estimated the spectral type of PDS 11A and PDS 11B using TiO bands, the dominant molecular absorption band in M-type stars. The spectral type has been estimated from the TiO5 spectral index, which is defined as the ratio of mean flux value in 71267135 Å region to that at 70427046 Å wavelength region (Reid et al., 1995). Reid et al. (1995) derived a relation between the spectral type (SpT) and TiO5 index, SpT = 10.775TiO5 + 8.2. They suggested using this relation as a reliable spectral type estimator in the range K7 to M6.5 dwarfs. We have measured the flux values from the flux calibrated spectra obtained on 2016 February 13 and found TiO5 to be 0.600.01 for PDS 11A and 0.560.01 for PDS 11B. The spectral type is estimated from the above mentioned relation whereby PDS 11A is found to be M1.70.1 and PDS 11B to be M2.10.1. Since fractional subtypes are not used for analysis, we will be approximating the spectral type of both stars as M2, but suggest that PDS 11A can be earlier than PDS 11B by a fractional subtype. Further, we compared the absorption strength of TiO 6180 absorption feature with the M2V spectral template from Pickles library (see Figure 4). A close match between the TiO band strength of the object and the template spectrum support the M2 classification of PDS 11A and PDS 11B. The early M-type classification is further supported by the absence of TiO 8465 band in our spectra. This band starts appearing in the spectra from M3 onwards and is used as a criteria to classify objects with spectral type M3L3 (Slesnick et al., 2006).
| Spectral line | Date of obs. | PDS 11A | PDS 11B | ||
|---|---|---|---|---|---|
| EW (Å) | FWHM (Å) | EW (Å) | FWHM (Å) | ||
| Caii K | 2016 Feb. 13 | -230.3 | 7.90.1 | -484 | 8.60.6 |
| 2016 Mar. 15 | -283 | 9.51 | -386 | 7.52 | |
| Caii H + H | 2016 Feb. 13 | -221 | 7.90.4 | -233 | 7.80.2 |
| 2016 Mar. 15 | -172 | 7.60.3 | -244 | 8.01 | |
| H | 2016 Feb. 13 | -14.60.6 | 9.00.3 | -9.40.8 | 9.00.4 |
| 2016 Mar. 15 | -9.10.6 | 8.40.6 | -103 | 8.02 | |
| H | 2016 Feb. 13 | -12.80.5 | 8.90.2 | -10.80.6 | 9.30.2 |
| 2016 Mar. 15 | -11.40.4 | 9.01 | -112 | 8.51 | |
| 4474 (HeI?) | 2016 Feb. 13 | . | . | -2.40.1 | 6.20.3 |
| 2016 Mar. 15 | . | . | . | . | |
| H | 2016 Feb. 13 | -10.80.8 | 8.80.4 | -13.00.7 | 8.60.4 |
| 2016 Mar. 15 | -7.80.6 | 8.30.3 | -101 | 8.40.4 | |
| Hei 5876 | 2016 Feb. 13 | . | . | -1.90.1 | 9.00.1 |
| 2016 Mar. 15 | . | . | -1.40.4 | 8.20.6 | |
| Nai (5890+5896) | 2016 Feb. 13 | 5.20.2 | 12.40.3 | 3.40.2 | 12.70.4 |
| 2016 Mar. 15 | 6.00.2 | 13.50.5 | 3.20.3 | 13.80.5 | |
| [O i]6300 | 2016 Feb. 13 | . | . | -1.20.1 | 6.50.1 |
| 2016 Mar. 15 | . | . | -1.70.3 | 5.90.4 | |
| H | 2016 Feb. 13 | -23.00.8 | 7.60.1 | -27.00.7 | 7.90.2 |
| 2016 Mar. 15 | -25.00.5 | 7.70.2 | -25.00.5 | 8.30.2 | |
| Lii 6708 | 2016 Feb. 13 | 0.450.05 | 5.20.1 | . | . |
| 2016 Mar. 15 | 0.400.04 | 5.00.3 | . | . | |
| Nai 8183 | 2016 Feb. 13 | 0.80.1 | 6.80.2 | 0.80.1 | 6.30.1 |
| 2016 Mar. 15 | 1.00.1 | 7.90.2 | 0.90.2 | 7.30.2 | |
| Nai 8195 | 2016 Feb. 13 | 1.00.1 | 6.40.2 | 1.00.1 | 6.80.1 |
| 2016 Mar. 15 | 1.30.1 | 7.10.1 | 1.10.2 | 7.20.2 | |
3.3 H: Accretion indicator
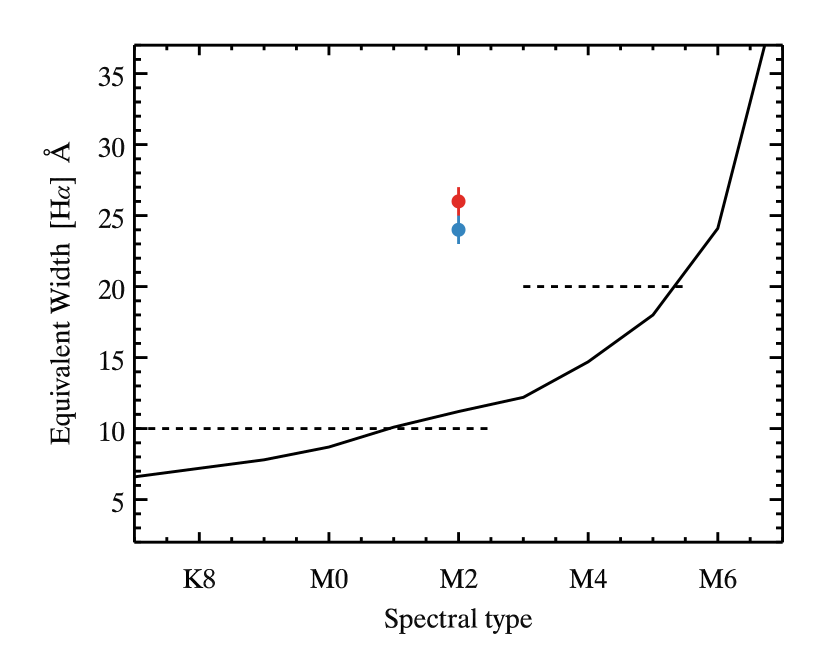
Historically, the strength of the H line has been used to distinguish between accreting classical T Tauri stars (CTTS) from weak-lined T Tauri stars (WTTS), where the H emission is due to chromospheric activity. An H equivalent width EW(H) 10 Å was set as the discrimination boundary. However, because of the ‘contrast effect’ of the photosphere, no unique EW(H) value distinguishes all CTTSs from WTTSs, and several authors have proposed EW(H) dividing line as function of spectral type (Martín, 1998; White & Basri, 2003; Barrado y Navascués & Martín, 2003). White & Basri (2003) prescribed empirically determined maximum EW(H) values observed for non-accreting T Tauri stars for different spectral type ranges. Barrado y Navascués & Martín (2003) proposed EW(H) values as a function of spectral type derived from the observed saturation limit for the chromospheric activity at Log(LHα/Lbol) = 3.3. Figure 6 shows both White & Basri (2003) and Barrado y Navascués & Martín (2003) criteria to distinguish between CTTSs from WTTSs. Also shown in the figure are the EW(H) values of PDS 11A and PDS 11B, which are well above the lines depicting White & Basri (2003) and Barrado y Navascués & Martín (2003) criteria. Thus, both PDS 11A and PDS 11B are accreting and are CTTSs.
We computed the accretion rates for PDS 11A from the H and H line luminosities using the empirical relations given by Herczeg & Hillenbrand (2008), Fang et al. (2009), and Ingleby et al. (2013). For the distance range listed in Table 3 (114131 pc) corresponding to the age range of 1015 Myr, the accretion rates obtained are in the range of 4.210-11 5.010-10 M⊙ yr-1 with a median value of 1.010-10 M⊙ yr-1. The accretion rates we obtain for PDS 11A is significantly lower than that found for 3 Myr old CTTSs of spectral type M2 (e.g., Ingleby et al., 2013; Kim et al., 2016). They are, however, quite similar to the accretion rates found for M2 members of the 1015 Myr old moving groups (e.g., Zuckerman et al., 2014). The Hi line luminosity and the estimated from them for the PDS 11A are significantly higher than that expected from chromospheric activity. Following Manara et al. (2013), the noise introduced in the estimated due to chromospheric contamination (see eqn. 2 in Manara et al., 2013) is 1.810-4 , while the accretion luminosity of PDS 11A is 1.410-3 , which is 8 times higher, indicating that PDS 11A is accreting material from the disk.
From the accretion rates of PDS 11A, we further estimated the expected line flux and equivalent widths for Pa and Br lines using the empirical relations from Muzerolle et al. (1998), Calvet et al. (2004) and Natta et al. (2006). For PDS 11A, the expected Pa EW is 2 Å (line flux 2.110-21 W cm-2) and the expected Br EW is 0.3 Å (line flux 3.110-22 W cm-2). From the observed spectra discussed in Sect. 3.1 we found that Pa EW is around 3 Å whereas no clear emission is present in Br, which agrees with these estimates. Thus the strength of the observed H i lines in the optical and near-IR spectra of PDS 11A is consistent with the star accreting at a rate of 10-10 M⊙ yr-1.
3.4 Age estimation of PDS 11A from Li i 6708 EW
The Li i 6708 absorption feature is an indicator of youth and is often used as one of the criteria to classify the source as a T Tauri star (Bodenheimer, 1965; Hamann & Persson, 1992; Sergison et al., 2013). We found evidence for the presence of Li i 6708 line in the spectrum of PDS 11A, with an EW of 0.43 Å (mean value of both epochs, Table 2). In Figure 4, the presence of Li i 6708 absorption is particularly evident from the comparison of line profile with that of M2V spectral template from Pickles library. It may be noted that a tentative detection of Li i 6708 in PDS 11B is seen in Figure 4, when compared to the template spectrum, but can only be confirmed from spectra with better resolution and signal-to-noise. Henceforth we will be considering Li i 6708 absorption only in PDS 11A. Gregorio-Hetem et al. (1992) also have reported Li i 6708 absorption line in the spectrum of PDS 11A with an EW of 0.71 Å. The identification of Li i 6708 in the spectra of PDS 11A supports its T Tauri membership.
We have used lithium depletion boundary (LDB) technique to estimate the age of PDS 11A. This method is model independent when compared to the age estimation from stellar evolutionary models and is often used for precise age estimation of young stars in moving groups (Soderblom, 2010; Song et al., 2002; Binks & Jeffries, 2014). From the measured Li i 6708 EW it is possible to estimate the age of the T Tauri star using LDB technique. Since we know the spectral type of our object of interest, it is possible to set an age limit during which Li i 6708 absorption line is present in the spectra. The stellar models of Baraffe et al. (2015) show that the surface lithium is depleted in M2 stars such as PDS 11A (whose effective temperature (Teff) is 3490 K; Pecaut & Mamajek, 2013) at an age of 15 Myr. This means that since Li i 6708 is present in PDS 11A, the age should be less than 15 Myr.
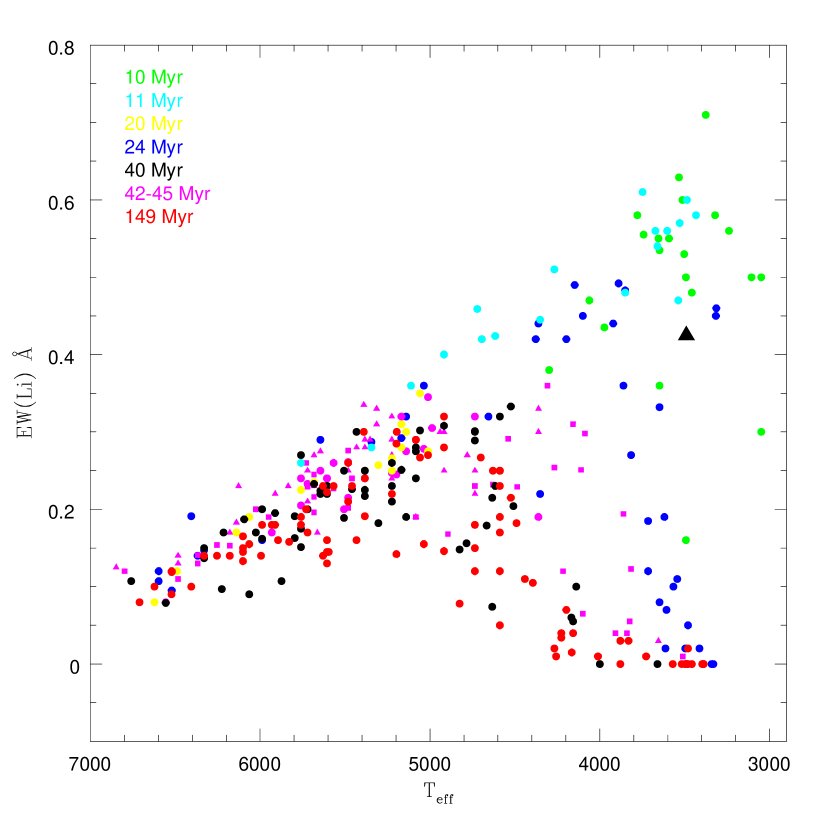
To see whether the age of PDS 11A matches with young stars in moving groups, we analyzed the Li i 6708 EW measurements of all the known members of the nine nearby moving groups identified so far, from da Silva et al. (2009). We have used those values along with the stellar effective temperature (as given in da Silva et al., 2009) to analyze the Li i 6708 EW variation with temperature (Figure 7). In Figure 7, PDS 11A is located between 10 Myr old TW Hya association and 24 Myr old Pic moving group. It may be noted there are no moving groups with Li i EW measurements of stars between 10 and 24 Myr. Hence, from LDB method and the analysis of Li i EW distribution in moving groups, we found that PDS 11A has an age of 1015 Myr, which will be used in further discussion.
PDS 11 is not the first case of a T Tauri binary system where only one of the components show Li i 6708 absorption. Song et al. (2002) found that Li i 6708 absorption feature is seen in the secondary of the HIP 112312 (GJ 871.1 A and B) pre-MS binary system whereas it is absent in the primary. They have used this system, which is about 12 Myr old and at a distance of 24 pc, to study the LDB in pre-main sequence stars. The spectral type of GJ 871.1 A and B (M4 and M4.5) is closer to that of PDS 11A and PDS 11B (M2). It is intriguing to see why Li i 6708 is present in absorption only in one component of the binary system, if they are of similar age. We note that presence of Li i 6708 in absorption is not a necessary condition to classify the object as a T Tauri star. Baraffe & Chabrier (2010) have cautioned that lithium may not always be a reliable age indicator since the lithium abundance depends on the accretion history of the star. Episodic accretion in young stars can increase the central temperature due to which lithium can get severely depleted (Chabrier et al., 1996).
3.5 Stellar parameters
From our photometry we estimated and values of PDS 11A and PDS 11B as 14.750.03 (mV1), 1.430.05, and 14.980.03 (mV2), 1.280.05, respectively. The intrinsic color of PDS 11A and PDS 11B is 1.46, considering that both are M2 stars (Pecaut & Mamajek, 2013). Our observed colors are found to be bluer by 0.03 mag and 0.18 mag than the intrinsic values, for PDS 11A and PDS 11B, respectively. This has been noticed in previous studies and could be caused by the lower gravity of pre-MS stars with respect to the dwarfs (Song et al., 2002). From the observed values, the color excess of both the stars is found to be negative and hence will be considered as zero from now on. This is understandable since these are high Galactic latitude objects and hence suffer little extinction.
Comparison with 1015 Myr isochrones from Baraffe et al. (2015) for an M2 star (Teff = 3490 K) indicates a mass of 0.4 M⊙ and luminosity in the range 0.0890.067 L⊙ (log L/L⊙ = 1.05 – 1.17) for PDS 11A. These luminosity values imply bolometric magnitude Mbol in the range of 7.377.67, from which absolute magnitude (MV1) is obtained using the bolometric correction of -1.80 for M2 stars given in Pecaut & Mamajek (2013). The observed V magnitude, mV1 = 14.75, and MV1 indicate a distance of 114131 pc for PDS 11A. The estimated stellar parameters are given in Table 3. Similar estimates are not possible for PDS 11B as Li i 6708 is not present in the spectra.
| Reference | PDS 11A | PDS 11B |
|---|---|---|
| Sp.type | M1.70.1 | M2.10.1 |
| Teff (K) | 3490 | 3490 |
| Lbol (L⊙) | 0.0670.089 | . |
| 0 | 0 | |
| Distance (pc) | 114131 | . |
| Age (Myr) | 1015 | . |
| Mass (M⊙) | 0.4 | . |
| Vr ( km s-1) | 2131 | 1082 |
| 3 (mas yr-1) | 6.04.3 | 5.73.4 |
| 3 (mas yr-1) | -1.44.8 | 4.62.5 |
3.6 Infrared excess
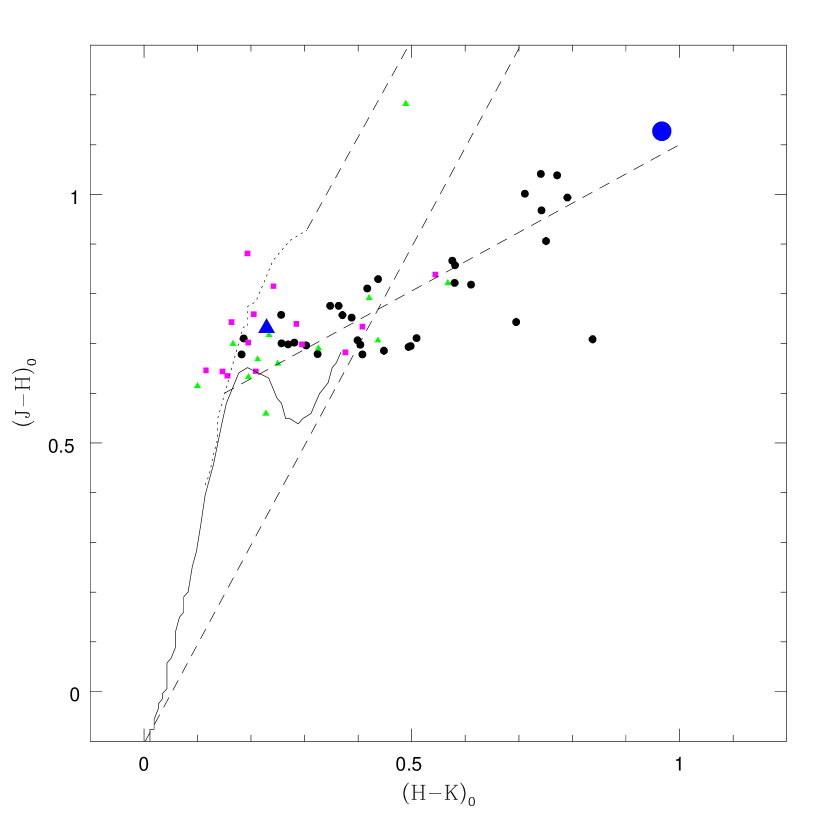
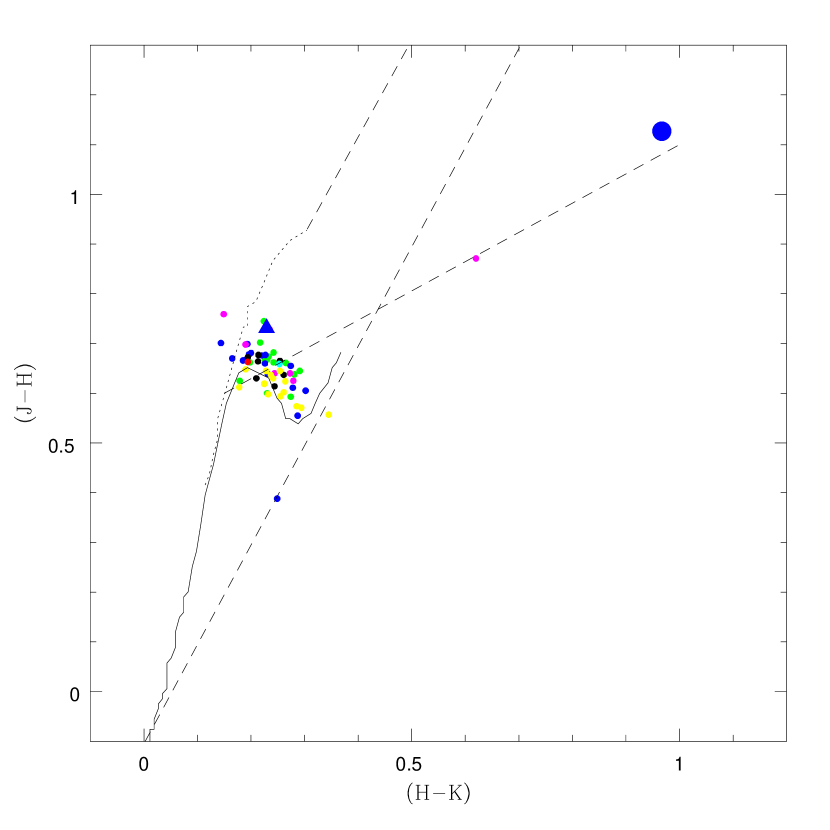
Infrared excess in the energy distribution is one of the defining criteria to identify T Tauri stars among the sample of low mass stars (Calvet & Gullbring, 1998; Meyer et al., 1997). We made use of the archival 2MASS data to estimate the near-IR , colors and use them to assess near-IR excess in PDS 11A and PDS 11B. Figure 8 shows the location of PDS 11A & 11B in the color-color diagram. For assessing the nature of near-IR excess in PDS 11 components, we also show CTTS, WTTS and transitional disk candidates in the figure. The 32 CTTS shown are of spectral types M0M3 from the Taurus star forming region, identified from Furlan et al. (2006) and Furlan et al. (2011). Also, included are 14 WTTS in the spectral type range M0M3 from the Taurus and Chamaeleon star forming regions (Furlan et al., 2011; Manoj et al., 2011). We have used the 2MASS colors of a sample of 16 TD candidates in Taurus and Chamaeleon I, taken from Kim et al. (2013). It is immediately evident from Figure 8 that PDS 11B shows considerable IR excess and is found to be on the CTTS locus. The , colors of the object seems to be higher than the sample of CTTS used for this analysis. However, since the location do not contain T Tauri stars other than CTTS, it is pretty clear that PDS 11B belong to CTTS category. The near-IR excess of PDS 11A is similar to the WTTS/TDs, suggesting significantly less hot dust material around it. In order to see whether our stars have any analogs in any of the moving group in terms of near-IR colors, we have represented them in versus color-color diagram. We have included stars in the spectral range M0M3, from known moving groups listed in Zuckerman & Song (2004) and Torres et al. (2008). As seen from Figure 9, almost all the members of various moving groups are found to be clustered near the main sequence, similar to PDS 11A. The extreme type of IR excess seen in PDS 11B is generally not seen in any other association members. In summary, both PDS 11A and PDS 11B are found to lie on the CTTS locus, indicating the presence of warm circumstellar dust around them. In addition to the near-IR excess, both the stars are accreting (Sect. 3.3) and show veiling in the observed spectra (discussed in Sect. 4.1), qualifying them as classical T Tauri stars. PDS 11B show very high near-IR excess and lies at the extreme end of the CTTS locus. Since none of the known CTTS display such high near-IR excess (see Figure 8), it is worth exploring the nature of PDS 11B from further studies.
3.7 Spectral Energy Distribution
The Spectral Energy Distribution (SED) of PDS 11A and PDS 11B is constructed with the available photometric data given in Table 4. The SEDs are shown in Figures 10. We have used BT-Settl model atmospheres corresponding to the temperature (Teff) and gravity (log ) values of of PDS 11A and PDS 11B. Even though Teff of both the stars are 3490 K, we have taken the BT-Settl atmosphere for 3500 K, which is the closest temperature for which stellar atmosphere is available. Generally, in the case of pre-MS stars, model atmospheres corresponding to log() = 4.5 is used for SED analysis. We have verified this in the case of PDS 11A, which has a log() value of 4.34 from the stellar models of Baraffe et al. (2015). Since BT-Settl model atmospheres corresponding to Teff = 3490 K and log() = 4.34 is unavailable, we have used the nearest combination of Teff = 3500 K and log() = 4.5 for SED analysis.
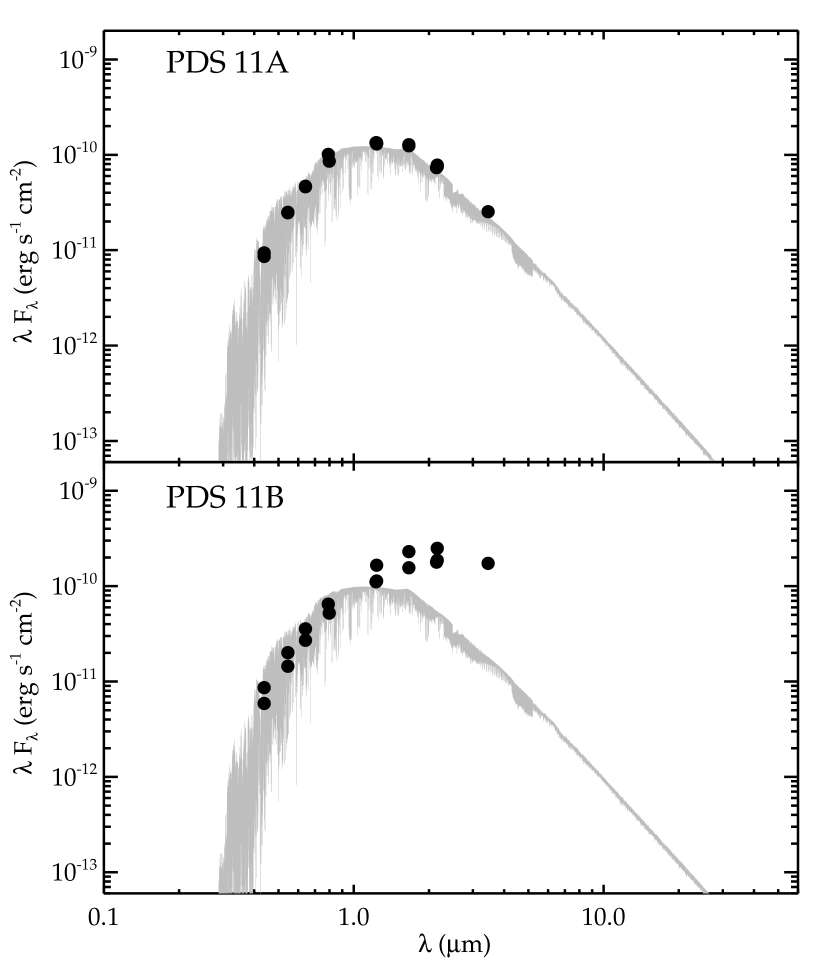
PDS 11A do not show much of IR excess whereas PDS 11B shows considerable excess with the SED rising in near-IR itself (Figure 10). We found that mid-infrared magnitudes are available from mission for PDS 11B, but the beam size includes PDS 11A as well. Comparison of , , magnitudes of both stars from 2MASS and Whitelock et al. (1995) indicate that most of the excess emission is coming from PDS 11B. PDS 11B is about 2.2 mag brighter than PDS 11A in band (Whitelock et al., 1995). PDS 11B shows considerably high and color excess ( 1 mag), which is even higher than that for CTTS in star forming region (Figure 8). We note that in addition to disk excess, the IR excess in PDS 11B can also be contributed by an unseen late-type companion, which demands further investigation.
| Reference | Band | PDS 11A | PDS 11B |
|---|---|---|---|
| This work | 16.180.04 | 16.270.04 | |
| 14.750.03 | 14.980.03 | ||
| 13.690.03 | 13.980.03 | ||
| G92 | 16.27 | 16.68 | |
| 14.76 | 15.34 | ||
| 13.70 | 14.28 | ||
| 12.55 | 13.09 | ||
| DENIS | 12.4330.03 | 12.9150.03 | |
| 11.1590.06 | 11.3610.06 | ||
| 10.2590.06 | 9.2930.06 | ||
| 2MASS | 11.1820.026 | 11.3320.029 | |
| 10.4510.026 | 10.2050.029 | ||
| 10.2220.019 | 9.2380.021 | ||
| W95 | 11.1520.036 | 10.9190.189 | |
| 10.4220.047 | 9.7810.174 | ||
| 10.1850.039 | 8.9230.173 | ||
| 9.9600.061 | 7.8720.125 |
4 Discussion
Our analysis so far suggest that both components of the PDS 11 system are of similar spectral type, M2. Both PDS 11A and PDS 11B show strong H emission, confirming their CTTS status. While PDS 11B show strong excess emission in the near-IR, PDS 11A show no or weak excess, indicating the that no hot dust is present close to the star. Intriguingly, PDS 11A show lithium absorption, suggesting that it is 1015 Myr old; PDS 11B do not show lithium absorption. Below we discuss more aspects on veiling and binarity of this system.
4.1 Veiling estimate from Ca i 4227
The presence of excess continuum emission, referred to as veiling, is often observed in classical T Tauri stars (Joy, 1949; Johns-Krull & Valenti, 2001). In the magnetospheric accretion model, veiling is due to the dissipation of energy in the post-shock region at the base of the magnetic funnel, close to the stellar surface (Koenigl, 1991; Hartmann et al., 1994; Calvet & Gullbring, 1998). Herczeg & Hillenbrand (2014) suggested a method to estimate veiling in T Tauri stars. They found that measured EW values of Cai 4227 absorption line follow a relation with spectral type, of the form EW(Ca i) = 189.218 + 7.36 0.072. Since both PDS 11A and PDS 11B are of M2 spectral type, ‘’ corresponds to 60 (Herczeg & Hillenbrand, 2014). Hence the expected Ca i 4227 EW should be 6.8 Å, if veiling is not present. In the case of PDS 11A, EW(Ca i) measured on 2016 February 13 agrees with the expected value, whereas it changed to 5.60.2 Å, when measured from the spectra taken on 2016 March 15. During the first epoch, the measured EW value of Ca i 4227 is almost similar to that expected if veiling is not present. But in the second epoch, the line gets veiled, suggesting that emission from accretion continuum is filling-in the absorption line. The situation is even more interesting in the case of PDS 11B which show EW(Ca i) value of 6.00.4 from the spectra taken on 2016 February 13 and the line is almost not visible in the spectra taken on 2016 March 15. Since the measured EW of Ca i 4227 is considerably lower than the empirical estimates, PDS 11B must be undergoing strong veiling. We estimated the effect of veiling on spectral type determination for both the stars using the EW(Ca i) relation given in Herczeg & Hillenbrand (2014). We found that the spectral type of PDS 11A could change from M2 to M1 for a change in EW(Ca i) from 6.8 to 5.6 Å. In the case of PDS 11B, the Ca i 4227 line is almost completely veiled and hence the spectral type can shift to earlier type by 5 subtypes.
The fact that the spectra of both the stars in PDS 11 are veiled has important implications. Firstly, this supports our result that PDS 11A and PDS 11B are CTTS in active accretion phase. Secondly, this explains the absence of Li i 6708 absorption line in PDS 11B. It is quite possible that PDS 11B is of the same age as PDS 11A and Li i 6708 is present, but the line is filled in because of strong veiling. We examined this aspect by comparing the lithium abundance values listed in Baraffe et al. (2015) with the shift in spectral type due to veiling. In the previous paragraph, we described that veiling was present in the spectrum of PDS 11B obtained on 2016 February 13, while PDS 11A did not show evidence for veiling during that epoch. The equivalent width of Ca i 4227 in PDS 11B was found to be 6 Å, whereas the expected value in the absence of veiling is 6.8 Å. This reduction in absorption strength due to veiling will shift the spectral type from M2 to M1 for PDS 11B, according to the EW(Ca i) relation given in Herczeg & Hillenbrand (2014). Thus, based on EW(Ca i), the spectral type of PDS 11B was of M1 and PDS 11A of M2 type, for the epoch 2016 February 13. The age of PDS 11A is estimated in the range 1015 Myr. From Baraffe et al. (2015) stellar models it is seen that at an age of 10 Myr, the ratio of surface lithium abundance to initial abundance is 27 times higher in an M2 star like PDS 11A, when compared to M1 star like PDS 11B. Since we found Li i 6708 absorption in PDS 11A to be 0.43 Å, the EW(Li i) expected for PDS 11B is around 0.02 Å. This value is far below the detection limit of our instrument, which supports our proposition that Li i 6708 might be present in PDS 11B, but not visible in the spectrum due to strong veiling.
4.2 Possible association with a moving group
We have used the Banyan II webtool444www.astro.umontreal.ca/ gagne/banyanII.php to check whether our candidates are associated with any of the nearby kinematic groups. Banyan II is a Bayesian analysis tool which makes use of the position and space velocities of the object to assess the match with the database of nearby (100 pc) moving groups, younger than 100 Myr (Gagné et al., 2014; Malo et al., 2013). The heliocentric radial velocity and proper motion of PDS 11A and PDS 11B are taken from the literature and are given in Table 3. From the analysis we found that PDS 11A and PDS 11B are not associated with any known moving group. Banyan II analysis gives 100% probability that PDS 11A and PDS 11B belong to young field population (Gagné et al., 2014). It is quite possible that our object parameters may not match with that of any known association and hence has been ascribed to young field population.
4.3 PDS 11: a wide binary classical T Tauri system?
Although the PDS 11 system has been treated as binary in the literature (Gregorio-Hetem et al., 1992), it is yet to be demonstrated that PDS 11A & 11B are gravitationally bound. It has been identified as visual binaries in Washington Double Star catalog (Mason et al., 2001), but that do not guarantee them being gravitationally bound. Instead, we found that the proper motion in RA and Dec for both the stars are similar within uncertainties (Table 3). This suggests that PDS 11A and PDS 11B form a binary system. Considering PDS 11 at a distance of 114131 pc, with a separation of 8.8 between the components (Mason et al., 2001), the physical separation between PDS 11A and PDS 11B is 10031153 AU. The proximity of two CTTS at such a separation argues against chance alignment and suggests that they are part of a bound system. Hence, the age and distance estimated for PDS 11A can as well be applied to PDS 11B.
From a study of T Tauri stars in Taurus-Auriga star-forming region, Bertout et al. (2007) obtained a relation to estimate the lifetime of the disk in T Tauri stars (), = 4106(M/M⊙)0.75, in terms of the mass of the parent star (M). Since the mass of PDS 11A and PDS 11B are estimated to be 0.4 M⊙, the disk lifetime is around 2.0 Myr. Evidently it is quite puzzling how a disk which harbors enough gas and dust survive in 1015 Myr old system like PDS 11. T Tauri binary systems with disks at ages older than the typical disk dissipation timescales have been reported in the literature. Most of them belong to nearby ( 100 pc) young moving groups. They are: 8 Myr old binary systems TW Hya (Teixeira et al., 2008), HR 4796 (Kastner et al., 2008), TWA 30 (Looper et al., 2010a, b), T Cha (Kastner et al., 2012), 20 Myr old V4046 Sgr (Kastner et al., 2011), and LDS 5606 (Rodriguez et al., 2014). These objects belong to class of wide binaries, where the separation between the components is in the range 1.7 kau (for LDS 5606, Rodriguez et al., 2014) to 41 kau (for TW HyaTWA 28 system, Teixeira et al., 2008). Among them, only TWA 30 and LDS 5606 are T Tauri binary systems in which both components are accreting. The binary components of TWA 30 system are separated by 3400 au, show nearly edge-on orientation and are of similar spectral type, M5 and M4, respectively (Looper et al., 2010b; Principe et al., 2016). LDS 5606 is an M5/M5 T Tauri binary system at a separation of 1700 au and they are members of Pic moving group (Rodriguez et al., 2014; Zuckerman et al., 2014).
To summarize, PDS 11 is the third such system, after TWA 30 and LDS 5606, which belong to the interesting class of old, dusty, wide binary classical T Tauri systems in which both components undergo active accretion. It is quite possible that PDS 11A is a transition disk candidate since it is accreting and lacks hot dust material close to the star (see Sect. 3.3 & 3.6). However, further studies are needed to confirm other transition disk properties such as mid- and far-IR excess and the presence of outer disk in PDS 11A. Also, further observations are needed to assess whether the near-IR excess in PDS 11B is entirely due to circumstellar material or due to the contribution from late-type companion. If confirmed, this would be the first known example of a 10 Myr old binary system, where one of the components harbor a radially continuous full disk, while the other is surrounded by a disk with inner hole or gap.
5 Conclusion
We have analyzed the star/disk properties and derived the spectral type of the T Tauri binary system PDS 11 from optical photometry, spectroscopy and infrared spectroscopic observations. Our analysis indicates that PDS 11 is the new addition, after TWA 30 and LDS 5606, to the interesting class of old, dusty, wide binary classical T Tauri systems in which both components are actively accreting. The main conclusions from this study are listed below.
-
•
The spectral type of PDS 11A and PDS 11B were not known. We have classified both as M2-type making use of the TiO 7050 band feature, with the aid of TiO5 index and the relations from Reid et al. (1995).
-
•
PDS 11A and PDS 11B are found to have H emission strength of 25 Å , which is higher than the threshold value of chromospherically active stars. The median accretion rate derived from H emission line is around 1.010-10 M⊙ yr-1 for PDS 11A. PDS 11B show very high near- and mid-infrared excess. The emission lines of [O i] 6300 and He i 5876, indicative of accretion process, are present in the spectrum of PDS 11B. All these evidences conclusively prove that PDS 11A and PDS 11B are classical T Tauri stars. It needs to be assessed from future studies how an active accretion disk sustains in a 1015 Myr old system like PDS 11A.
-
•
We found that PDS 11A is less than 15 Myr from age dating using lithium depletion boundary method. Further, from the comparison of Li i 6708 EW with that of young stars in moving groups, the age is constrained in the range 1015 Myr.
-
•
Since Li i 6708 is not present in the spectrum of PDS 11B, the stellar parameters other than spectral type and temperature were not determined. However, since we prove that PDS 11A and PDS 11B form a binary system, age and distance of PDS 11B is taken to be similar to PDS 11A.
-
•
From our analysis PDS 11 is identified as a binary system with component masses of 0.4 M⊙, luminosity of 0.0670.089 L⊙ and at a distance of 114131 pc.
-
•
From the analysis with Banyan II webtool, PDS 11A and PDS 11B were not identified as members of any known moving group and hence is considered as a young field binary system.
Acknowledgments
We would like to thank the staff at IAO, Hanle and its remote control station at CREST, Hosakote for their help during the observation runs. This research uses the SIMBAD astronomical data base service operated at CDS, Strasbourg. This publication made use data of 2MASS, which is a joint project of University of Massachusetts and the Infrared Processing and Analysis Centre/California Institute of Technology, funded by the National Aeronautics and Space Administration and the National Science Foundation.
References
- Appenzeller & Mundt (1989) Appenzeller, I., Mundt, R. 1989, A&AR, 1, 291
- Baraffe et al. (2015) Baraffe, I., Homeier, D., Allard, F., et al. 2015, A&A, 577, A42
- Baraffe & Chabrier (2010) Baraffe, I., Chabrier, G. 2010, A&A, 521, A44
- Barrado y Navascués & Martín (2003) Barrado y Navascués, D., Martín, E. L. 2003, AJ, 126, 2997
- Bell et al. (2015) Bell, C. P. M., Mamajek, E. E., Naylor, T. 2015, MNRAS, 454, 593
- Bertout et al. (2007) Bertout, C., Siess, L., Cabrit, S. 2007, A&A, 473, L21
- Bertout (1989) Bertout, C. 1989, ARA&A, 27, 351
- Bessell (1990) Bessell, M. S. 1990, PASP, 102, 1181
- Binks & Jeffries (2014) Binks, A. S., Jeffries, R. D. 2014, MNRAS, 438, L11
- Bodenheimer (1965) Bodenheimer, P. 1965, ApJ, 142, 451
- Calvet et al. (2004) Calvet, N., Muzerolle, J., Briceno, C., et al. 2004, AJ, 128, 1294
- Calvet & Gullbring (1998) Calvet, N., & Gullbring, E. 1998, ApJ, 509, 802
- Carpenter (2001) Carpenter, J. M. 2001, AJ, 121, 2851
- Chabrier et al. (1996) Chabrier, G., Baraffe, I., Plez, B. 1996, ApJ, 459, L91
- Cutri et al. (2003) Cutri R. M., et al. 2003, VizieR Online Data Catalog, 2246, 0
- da Silva et al. (2009) da Silva, L., Torres, C. A. O., de La Reza, R., et al. 2009, A&A, 508, 833
- de la Reza et al. (1989) de la Reza, R., Torres, C. A. O., Quast, G., et al. 1989, ApJ, 343, L61
- Elliott et al. (2016) Elliott, P., Bayo, A., Melo, C. H. F., et al. 2016, A&A, 590, A13
- Fang et al. (2009) Fang, M., van Boekel, R., Wang, W., et al. 2009, A&A, 504, 461
- Furlan et al. (2011) Furlan, E., Luhman, K. L., Espaillat, C., et al. 2011, ApJS, 195, 3
- Furlan et al. (2006) Furlan, E., Hartmann, L., Calvet, N., et al. 2006, ApJS, 165, 568
- Gagné et al. (2014) Gagné, J., Lafreniére, D., Doyon, R., et al. 2014, ApJ, 783, 121
- Gregorio-Hetem et al. (1992) Gregorio-Hetem, J., Lepine, J. R. D., Quast, G. R., et al. 1992, AJ, 103, 549
- Hamann & Persson (1992) Hamann, F., & Persson, S. E. 1992, ApJS, 82, 247
- Hartigan et al. (1995) Hartigan, P., Edwards, S., Ghandour, L. 1995, ApJ, 452, 736
- Hartmann (2009) Hartmann, L. 2009, Accretion Processes in Star Formation: Second Edition (Cambridge University Press)
- Hartmann et al. (1994) Hartmann, L., Hewett, R., Calvet, N. 1994, ApJ, 426, 669
- Herbig & Bell (1988) Herbig G. H., Bell K. R. 1988, Third Catalog of Emission-Line Stars of the Orion Population, Lick Observatory, Santa Cruz
- Herbig (1962) Herbig, G. H. 1962, Adv. Astr. Astrophys., Vol. 1, p. 47
- Herczeg & Hillenbrand (2014) Herczeg, G. J., & Hillenbrand, L. A. 2014, ApJ, 786, 97
- Herczeg & Hillenbrand (2008) Herczeg, G. J., & Hillenbrand, L. A. 2008, ApJ, 681, 594
- Ingleby et al. (2013) Ingleby, L., Calvet, N., Herczeg, G., et al. 2013, ApJ, 767, 112
- Johns-Krull & Valenti (2001) Johns-Krull, C. M., Valenti, J. A. 2001, ApJ, 561, 1060
- Joy (1949) Joy, A. H. 1949, ApJ, 110, 424
- Joy (1945) Joy, A. H. 1945, ApJ, 102, 168
- Kastner et al. (2012) Kastner, J. H., Thompson, E. A., Montez, R. 2012, ApJ, 747, L23
- Kastner et al. (2011) Kastner, J. H., Sacco, G. G., Montez, R., et al. 2011, ApJ, 740, L17
- Kastner et al. (2008) Kastner, J. H., Zuckerman, B., Bessell, M. 2008, A&A, 491, 829
- Kastner et al. (1997) Kastner, J. H., Zuckerman, B., Weintraub, D. A., et al. 1997, Sci, 277, 67
- Kenyon & Hartmann (1995) Kenyon, S. J., Hartmann, L. 1995, ApJS, 101, 117
- Kim et al. (2016) Kim, K. H., Watson, D. M., Manoj, P. et al. 2016, preprint, (arXiv:1604.07907)
- Kim et al. (2013) Kim, K. H., Watson, D. M., Manoj, P. et al. 2013, ApJ, 769, 149
- Koenigl (1991) Koenigl, A. 1991, ApJ, 370, L39
- Koornneef (1983) Koornneef, J. 1983, A&A, 128, 84
- Looper et al. (2010a) Looper, D. L., Mohanty, S., Bochanski, J. J., et al. 2010a, ApJ, 714, 45
- Looper et al. (2010b) Looper, D. L., Bochanski, J. J., Burgasser, A. J., et al. 2010b, AJ, 140, 1486
- Malo et al. (2013) Malo, L., Doyon, R., Lafreniére, D., et al. 2013, ApJ, 762, 88
- Mamajek (2016) Mamajek, E. E. 2016, in IAU, Symp 10, 314, 21
- Manara et al. (2013) Manara, C. F., Beccari, G., Da Rio, N., et al. 2013, A&A, 558, A114
- Manoj et al. (2011) Manoj, P., Kim, K. H., Furlan, E., et al. 2011, ApJS, 193, 11
- Martín (1998) Martín, E. L. 1998, AJ, 115, 351
- Mason et al. (2001) Mason, B. D., Wycoff, G. L., Hartkopf, W. I., et al. 2001, AJ, 122, 3466
- McGehee (2013) McGehee, P. M. 2013, Handbook of Star Forming Regions, Volume II: The Southern Sky ASP Monograph Publications, Vol. 5. Edited by Bo Reipurth, p.813
- Meyer et al. (1997) Meyer, M. R., Calvet, N., Hillenbrand, L. A. 1997, AJ, 114, 288
- Muzerolle et al. (1998) Muzerolle, J., Calvet, N., Hartmann, L. 1998, ApJ, 492, 743
- Natta et al. (2006) Natta, A., Testi, L., Randich, S. 2006, A&A, 452, 245
- Ninan et al. (2014) Ninan J. P. et al., 2014, J. Astron. Instrum., 3, 1450006
- Pecaut & Mamajek (2013) Pecaut, M. J., & Mamajek, E. E. 2013, ApJS, 208, 9
- Pickles (1998) Pickles, A. J. 1998, PASP, 110, 863
- Principe et al. (2016) Principe, D. A., Sacco, G., Kastner, J. H., et al. 2016, MNRAS, 459, 2097
- Qi et al. (2015) Qi, Z., Yu, Y., Bucciarelli, B., et al. 2015, AJ, 150, 137
- Reid et al. (1995) Reid, I. N., Hawley, S. L., Gizis, J. E. 1995, AJ, 110, 1838
- Rieke & Lebofsky (1985) Rieke, G. H., & Lebofsky, M. J. 1985, ApJ, 288, 618
- Rodriguez et al. (2014) Rodriguez, D. R., Zuckerman, B., Faherty, J. K., et al. 2014, A&A, 567, A20
- Rucinski & Krautter (1983) Rucinski, S. M., Krautter, J. 1983, A&A, 121, 217
- Sergison et al. (2013) Sergison, D. J., Mayne, N. J., Naylor, T., et al. 2013, MNRAS, 434, 966
- Slesnick et al. (2006) Slesnick, C. L., Carpenter, J. M., Hillenbrand, L. A., et al. 2006, AJ, 132, 2665
- Soderblom (2010) Soderblom, D. R. 2010, ARA&A, 48, 581
- Song et al. (2002) Song, I., Bessell, M. S., Zuckerman, B. 2002, ApJ, 581, L43
- Tachihara et al. (2009) Tachihara, K., Neuhäuser, R., Fukui, Y. 2009, PASJ, 61, 585
- Teixeira et al. (2008) Teixeira, R., Ducourant, C., Chauvin, G., et al. 2008, A&A, 489, 825
- Torres et al. (2008) Torres, C. A. O., Quast, G. R., Melo, C. H. F., Sterzik, M. F. 2008, Handbook of Star Forming Regions, Volume II: The Southern Sky ASP Monograph Publications, Vol. 5. Edited by Bo Reipurth, p.757
- White & Basri (2003) White, R. J., & Basri, G. 2003, ApJ, 582, 1109
- Whitelock et al. (1995) Whitelock, P., Menzies, J., Feast, M., et al. 1995, MNRAS, 276, 219
- Zuckerman et al. (2014) Zuckerman, B., Vican, L., Rodriguez, D. R. 2014, ApJ, 788, 102
- Zuckerman & Song (2004) Zuckerman, B., & Song, I. 2004, ARA&A, 42, 685