The Infall of the Virgo Elliptical galaxy M60 Toward M87
and the gaseous structures produced by Kelvin-Helmholtz Instabilities
Abstract
We present Chandra observations of hot gas structures, characteristic of gas stripping during infall, in the Virgo cluster elliptical galaxy M60 (NGC4649) located 1 Mpc east of M87. keV Chandra X-ray images show a sharp leading edge in the surface brightness kpc north and west of the galaxy center in the direction of M87 characteristic of a merger cold front due to M60’s motion through the Virgo ICM. We measured a temperature of keV for abundance inside the edge and keV for abundance in the Virgo ICM free stream region. We find that the observed jump in surface brightness yields a density ratio between gas inside the edge and in the cluster free stream region. If the edge is a cold front due solely to the infall of M60 in the direction of M87, we find a pressure ratio of and Mach number . For keV Virgo gas, we find a total infall velocity for M60 of km s-1 . We calculate the motion in the plane of the sky to be km s-1 implying an inclination angle degrees. Surface brightness profiles also show the presence of a faint, diffuse gaseous tail. We identify filamentary gaseous wing structures caused by the galaxy’s motion through the ICM. The structure and dimensions of these wings are consistent with simulations of Kelvin-Helmholtz instabilities as expected if the gas stripping is close to inviscid.
1 Introduction
The earliest X-ray images taken with Einstein revealed galaxy clusters to be far from dynamically relaxed systems (Jones et al. 1979). Extensive evidence now exists for subcluster and galaxy infall into clusters. As galaxies move through the intracluster medium they undergo hydrodynamical and tidal interactions of varying severity. Surface brightness edges (contact discontinuities in density and temperature) may be caused by a variety of physical mechanisms. When seen in cluster galaxies moving through the intra-cluster gas, these surface brightness edges may be the result of ram-pressure stripping as the galaxy moves through the ICM. These ‘cold fronts’ are contact discontinuities at the edge of two gas regions of different densities and temperatures (e.g. Markevitch & Vikhlinin 2007).
From X-ray observations of diffuse galaxy and cluster gas, and the galaxy redshift, the total galaxy velocity and direction of motion can be measured, providing one of the few ways that galaxy velocities in the plane of the sky can be inferred. The gas densities and temperatures are determined from X-ray observations, from which the components of thermal pressure on both sides of the contact discontinuity are derived. Approximating the flow to that of uniform gas about a blunt body, the total galaxy velocity follows from the ratio of thermal pressures at the stagnation point and free stream region (Vikhlinin et al. 2001). These cold fronts from ram pressure stripping are often accompanied by additional gas features such as wings and stripped gaseous tails (see e.g. Machacek et al. 2005; 2006; Kraft et al. 2017). The morphology of these features may allow one to constrain the microphysical properties of the surrounding gas (Roediger et al. 2015a,b). Cold front edges may also be induced by gas bulk motions (sloshing) caused by ongoing galaxy mergers. In this case multiple surface brightness edges or a spiral pattern are often observed, depending on the orientation of the merger with respect to the observer’s line of sight (e.g. Markevitch & Vikhlinen 2007). The measured ratio of thermal pressures across a sloshing cold front is . Finally, surface brightness edges may be due to shocks from episodic nuclear activity, lifting galaxy gas higher in the galaxy gravitational potential making it easier to be stripped. Several or all of these processes may act in concert on galaxies in galaxy clusters as the galaxies and clusters evolve.
The Virgo cluster of galaxies is located Mpc away (Mei et al. 2007). Böhringer et al. (1994) show Virgo to be an evolving cluster; the smooth X-ray distribution towards the center (M87) and the patchy distribution in the outer regions suggest the cluster is still forming. The galaxy dynamics of other ellipticals in Virgo have been studied including NGC4472 (Kraft et al. 2011), M86 (Randall et al. 2008; Forman et al. 1979), and NGC4552 (Machacek et al. 2006; Kraft et al. 2017).
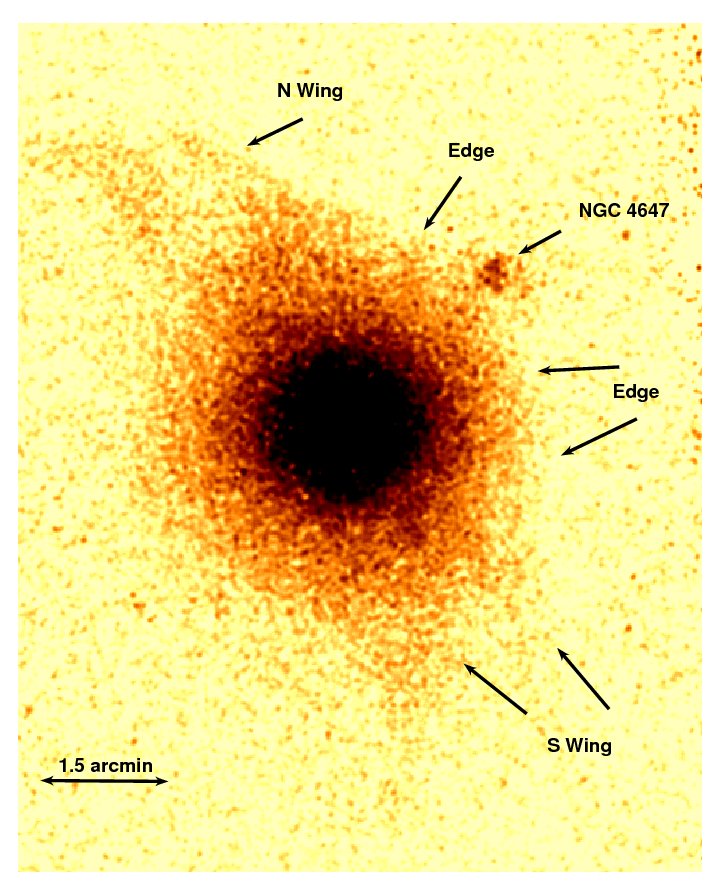
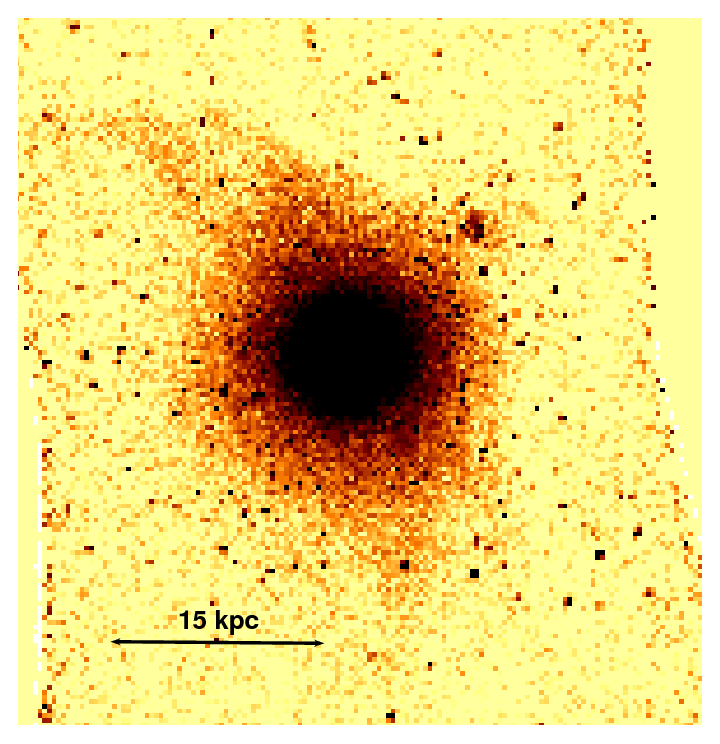
M60 (), is a massive elliptical galaxy located in projection arcmin ( Mpc) east of M87 (, ). M60’s line of sight velocity ( km s-1 ; Trager et al. 2000) compared to that of M87 ( km s-1 ; Smith et al. 2000) implies that M60 is moving through the Virgo ICM with at least km s-1 towards us relative to M87. We obtain key measurements of the gas in the massive elliptical galaxy M60 using archival Chandra X-ray observations (see Table 1) with a cleaned coadded exposure time of ks. These deep data sets reveal a wealth of gas-stripping related structures, showing that M60 is undergoing ram pressure stripping as it falls through the ICM towards the cluster center. In the Chandra image (Fig. 1), we see the gas removed from the core of M60 has formed wings, a western edge and a faint eastern filamentary tail. Understanding the nature of these edges and filamentary gaseous structures and a determination of the velocity of M60 through the Virgo ICM are the focus of this paper.
The discussion in this paper is presented as follows: In §2 we list the five Chandra observations used, explaining the data reduction and processing methods. §3 documents the critical steps undertaken to analyze the Chandra data, highlighting the observational results from the reprocessed, coadded data and discussing the results drawn. Our conclusions are presented in §4. All coordinates are J2000 and, unless otherwise indicated, all errors are confidence levels. Using the Surface Brightness Fluctuation (SBF) distances from Mei et al. (2007), the distance to M87, is Mpc and kpc. These measurements assume a Hubble constant km s-1 Mpc-1 in the CDM cosmology and are consistent with the SBF measurements by Tonry et al. (2001) ( Mpc).
2 Observations and data reduction
We reprocessed and then co-added five observations of M60 (Table 1) taken with the Chandra X-ray Observatory using the Advanced CCD Imaging Spectrometer array (ACIS) with ACIS-S (chip S3) at the aimpoint, giving a total exposure of ks. A sixth, ks observation from the archive (ObsID 785) was badly flared and so was excluded from our analysis. All the data were taken in VFAINT mode and analyzed using the standard X-ray processing packages, CIAO 4.7 (CALDB 4.6.8), FTOOLS 6.15, Sherpa 4.4 and XSPEC 12.9.0. The data were filtered with lc_clean and deflare to remove events in periods of abnormally low or high counts, where the count rate deviates more than above or below the mean. This gave a useful exposure time of ks.
| ObsID | Date | Exposure | Cleaned Exposure |
|---|---|---|---|
| (ks) | (ks) | ||
| 8182 | 2007 Jan 30 | ||
| 8507 | 2007 Feb 1 | ||
| 12975 | 2011 Aug 8 | ||
| 12976 | 2011 Feb 24 | ||
| 14328 | 2011 Aug 12 |
Note. — The cleaned exposure is after removal of periods of anomalously high and low count rates.
Some events from M60’s bright core are redistributed along the ACIS readout direction during readout. These out-of-time events may contaminate both imaging and spectral analyses of the faint diffuse X-ray emission of interest. We model the readout contribution to the background using CIAO tool readout_bkg, based on the algorithm developed by Vikhlinin et al. (2005). The cosmic X-ray contribution to the background was taken from the blank-sky background (BSB) files; a series of source-free background sets obtained at high galactic latitude to avoid contamination from our Galaxy. For each observation the relevant blank-sky background for that date was downloaded and reprocessed. These were the period D source-free datasets for the S3 CCD with exposure ks. Identical energy filters and the same cleaning process using CIAO were applied to the blank-sky background files. The normalization of the background was set by the ratio of exposure times between the M60 and blank-sky background datasets, with a last adjustment to account for the time variability of the particle background component made by matching the detected count rate for background and source in the keV energy band, where particle backgrounds dominate. Both the readout and cosmic X-ray background contributions were subtracted from our subsequent image analysis. Exposure-corrected, background-subtracted flux images were created for each observation in the soft ( keV) and hard ( keV) X-ray energy bands, binned at two by two pixel resolution (). The exposure-corrected, background-subtracted, coadded mosaic of the five Chandra observations used in our analysis with the identified point sources excluded is shown in Fig. 1. The dynamical gas features studied within this paper are marked. The reader may view a less processed coadded mosaic of the five data sets that includes point sources in Fig. 5.
3 Results
M60 shows several features evident of gas dynamics. Fig 1, in the keV energy band, shows a surface brightness edge at kpc north and west from the galaxy center in the direction of M87, a north wing arcing to the northeast and a less prominent, possibly bifurcated, wing extending to the south. We will also show evidence for a faint diffuse tail downstream. These features are similar to those in M89 caused by ram-pressure stripping as M89 interacts with the Virgo ICM during infall (Machacek et al. 2006, Kraft et al. 2017). We suggest that M60 is similarly undergoing gaseous stripping as it moves through the Virgo ICM, forming the upstream edge, wings to the northeast and south, and a faint diffuse eastern tail. A leading edge, faint tail and wings caused by Kelvin-Helmholtz Instabilities (KHI) are expected for ram-pressure stripping through an inviscid medium (Roediger et al. 2015a). We study the gas properties in these features in M60 and compare with the simulations of M89 (Roediger et al. 2015a,b), a similar Virgo galaxy, to test this scenario.
3.1 Surface Brightness Profiles
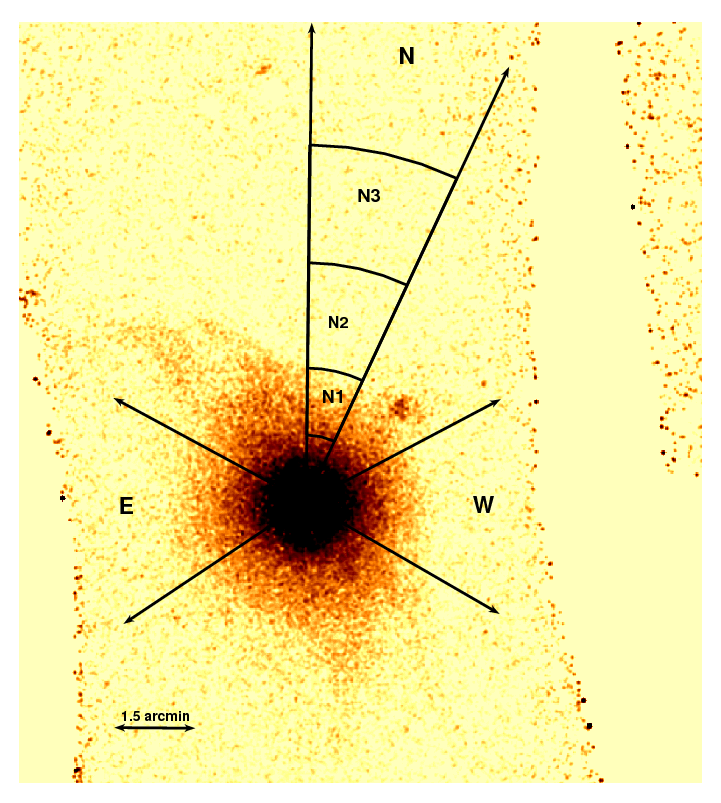
To study the leading edge, we construct circular surface brightness profiles from the background subtracted, exposure corrected, coadded keV image, using logarithmic radial steps. The profiles are each centered on the X-ray peak of M60 () and confined to sectors to the north and west that avoid the wings and exclude the interacting spiral galaxy NGC 4647. We similarly construct the circular surface brightness profile in the eastern (downstream) direction to search for a diffuse, faint tail. These sectors are defined in Table 2 and are shown in Fig. 2.
| Profile Label | A | B |
|---|---|---|
| (degree) | (degree) | |
| N | ||
| W | ||
| E |
Note. — The sector is centered at the X-ray peak and is defined as subtending the angle measured counterclockwise from angle A to angle B. All angles are measured counterclockwise from West.
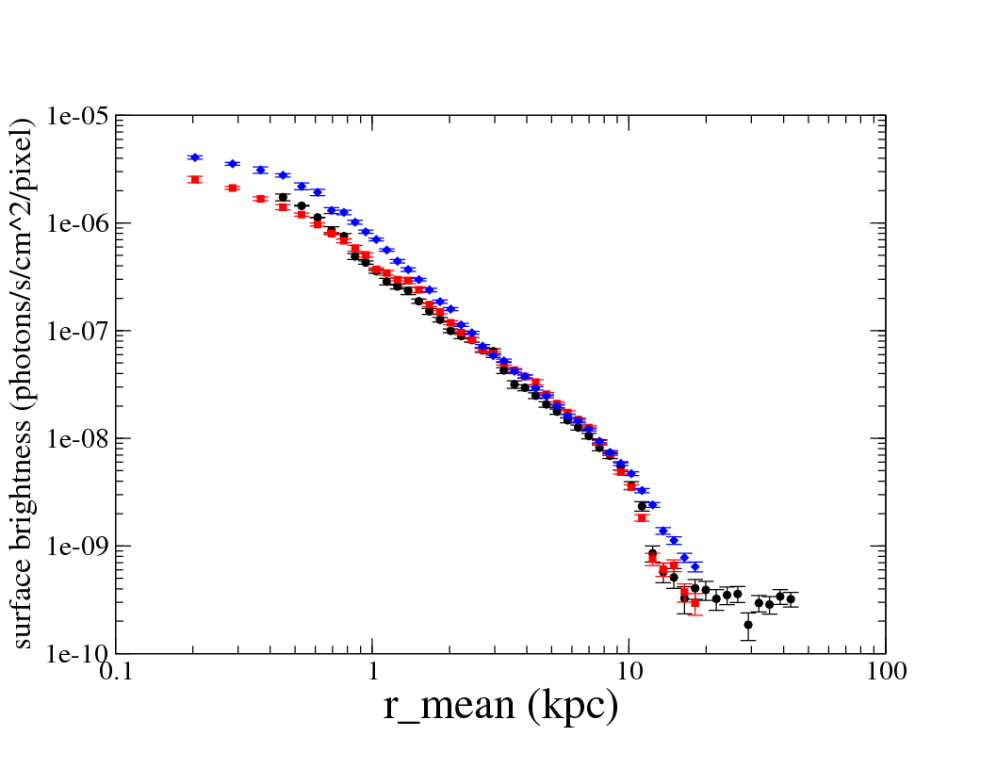
Our results are shown in Fig. 3. Note that the profiles in the N and W sectors are the same in the radial range of overlap. This suggests that they are part of the same leading edge caused by ram-pressure, only interrupted in the excluded region by the impending merger of NGC 4647. Due to our Chandra coverage we can study the morphology of the surface brightness profile to larger radii to the north (profile N) than to the west (profile W). We thus confine our analysis to the profile of the N sector of the leading edge, shown in Fig 3, to measure gas properties to larger radii and probe farther from the galaxy into the surrounding Virgo ICM. We see three distinct regions, the characteristic edge profile for galaxy gas for ( kpc), a very slowly varying, nearly flat surface brightness profile for ( kpc), and a steeply falling region of excess emission in between. At the Mpc distance of M60 from M87, taken to be the center of the Virgo cluster, emission from undisturbed Virgo cluster gas would appear to be flat over the kpc scale measured by the profile, consistent with the profile behavior at kpc. We take this to be representative of the ’free stream region’ from Vikhlinin et al. ( 2001). We suggest the sharply falling surface brightness profile at kpc may be Virgo gas gravitationally attracted to M60’s deep gravitational potential at close radii, i.e. the pile-up region (Vikhlinin et al. 2001). These regions are also shown in Fig. 2.
Vikhlinin et al. (2001) showed the edge of a cool dense gas cloud moving through surrounding hot gas can be seen in radial X-ray surface brightness profiles as a discontinuity (‘edge’) and that the relative velocity of the gas cloud and its surrounding ICM can be determined by the ratio of thermal gas pressures between gas at the stagnation point and cluster gas in the free stream region. If the dense M60 gas were at rest relative to the ICM, the thermal pressures would be equal on both sides of the edge. However, for M60 infalling through the Virgo ICM, where it is subjected to both ram and thermal pressures, this equality is only true at the stagnation point where the relative gas velocity is zero. Following Vikhlinin et al. (2001), we use the gas pressure just inside the edge as a proxy for the pressure at the stagnation point. We then use the pressure ratio between gas at the stagnation point and in the free stream region to derive the relative velocity between M60 and the Virgo ICM, as detailed in §3.4.
To calculate pressures, characterize the nature of the edge, and, in the case of ram pressure stripping, calculate the velocity of the galaxy, the relative temperatures and electron densities must be obtained for the gas on both sides of the edge.
3.2 Gas Densities
As in Machacek et al. (2006), we assume spherically symmetric electron power law density models inside and outside the edge ()
| (1) |
with normalization , inner and outer power law indices and , respectively, and a discontinuous density ’jump’ across the edge. We then determine the density by integrating the X-ray emissivity along the line of sight to fit the surface brightness profile, using a multi-variate -minimization scheme with the position of the edge (), the density power law indices and , and the square root of the surface brightness discontinuity across the edge allowed to vary. The measured surface brightness discontinuity is related to the density jump at the edge through the ratio of X-ray emissivities
| (2) |
where () are the cooling functions for gas inside (outside) the edge, respectively.
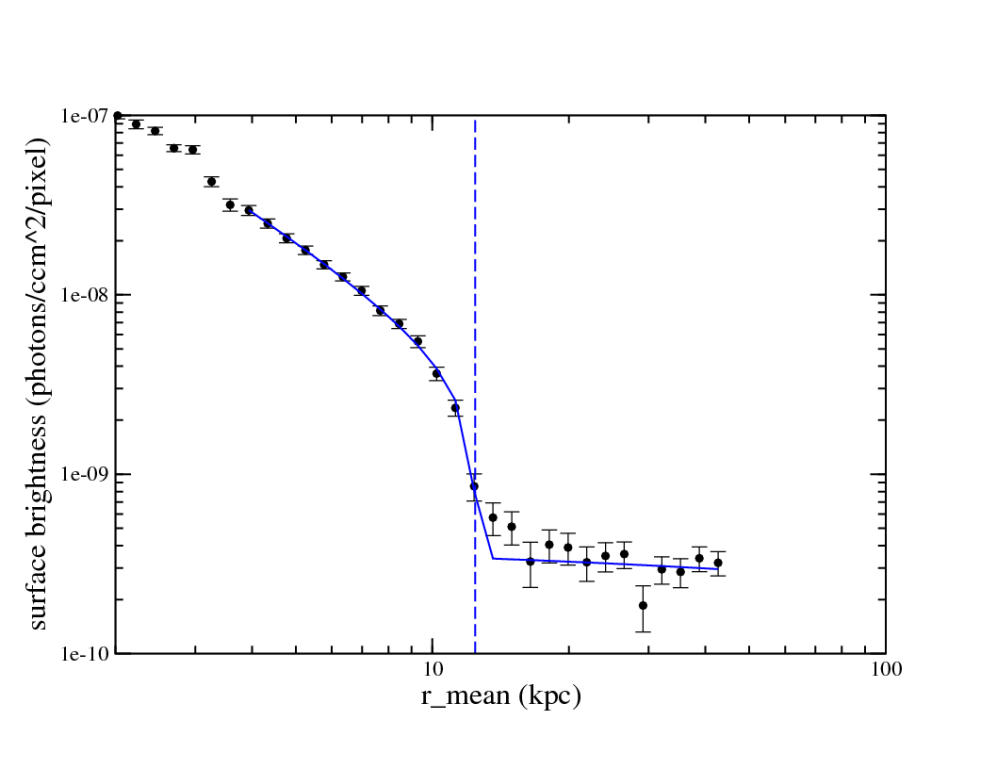
At a projected distance of Mpc from M87, we expect the X-ray surface brightness of the Virgo ICM to be slowly varying over the angular scales probed by our merged observations. Thus we extrapolate the flat Virgo surface brightness at kpc to the observed edge and fit the resulting profile to determine the gas density ratio between galaxy gas inside the edge and undisturbed Virgo gas (the free stream region) outside the edge. Our results are shown in Fig. 4 and listed in Table 3. We find an edge position at kpc and .
For massive galaxy clusters where ICM gas temperatures are high, the cooling functions in Eq. 2 are largely independent of gas abundances and only a weak function of the temperature such that and . The density jump can be inferred from the surface brightness profile fits alone. However, for gas at lower temperatures ( kev), X-ray cooling is line dominated and the cooling function is strongly dependent on gas metallicity. If these abundances are different, which is likely the case for galaxy gas and ICM gas in the outskirts of a galaxy cluster, the ratio of cooling functions in Eq. 2 may deviate significantly from and must be determined from spectral modeling before we can infer the gas density ratio of interest and complete the calculation of the infall velocity for M60. (see, e.g. Machacek et al. 2005).
| (kpc) | |||
|---|---|---|---|
Note. — The density model extrapolates the slowly varying Virgo ICM over the pile-up region to the edge. Columns are edge location , power law indices () inside and outside th edge, and square root of the surface brightness jump. The density model extrapolates the slowly varying Virgo ICM over the pile-up region to the edge.
3.3 Spectral Modeling: Gas Temperatures and Abundances
To determine the mean spectral properties of the gas in M60, we use CIAO tool specextract to extract a mean spectrum in a circular region centered on the observed X-ray peak. We also extract spectra for the regions N1, N2, and N3 along the northern profile shown in Fig. 2 to characterize the Virgo emission (N3) at the position of M60 and to complete the cold front analysis across the leading surface brightness edge (see Fig. 4). Point sources above a detection threshold of erg s-1 (see Appendix), as well as emission from the interacting companion galaxy NGC 4647, are excluded from the data. The resulting spectra are modeled using XSpec 12.9.0 (See Arnaud 1996).
3.3.1 Mean X-ray Spectral Properties of M60
We first consider the average spectral properties of M60 as a whole using the blank sky background files as in §3.1 for backgrounds. This will allow us to determine the mean abundance as well as temperature of gas within M60. ACIS read-out effects redistribute of the source counts along the read-out direction. Since most of these photons are from the bright core, which is included in our mean spectrum, and inspection of the read-out map shows that only of the total source counts are redistributed outside the circular spectral region, read-out will not significantly affect the mean spectral fit. We use an absorbed VAPEC model, that assumes X-ray emission from collisionally ionized diffuse gas with emission rates calculated from the most current atomic transition data tabulated in AtomDB.111http://atomdb.org We fix the hydrogen column density at the Galactic value ( cm-2 ). For more information on the VAPEC model, please see XSpec: An X-ray Spectral Fitting Package User’s Guide by Arnaud, Gordon, and Dorman.222https//heasarc.nasa.gov/docs/xanadu/spec/manual/manual.html
The temperature and abundances for Fe, Mg, Si, and O were allowed to vary. All other abundances were fixed at solar. We find a mean temperature keV with Fe, O, Mg and Si Anders & Grevesse (1989) abundances of , , , and for . Total intrinsic fluxes and luminosities for M60 for the assumed Mpc distance are listed in Table 4.
Although a thermal plasma VAPEC model provides an excellent fit to the data, Chandra data measure the X-ray emission from all sources in M60 and along the line of sight. This includes X-ray emission from any unresolved point sources, such as cataclysmic variables (CV’s), accreting white dwarfs (AB’s) and low mass X-ray binaries (LMXBs), and Virgo ICM emission along the line of sight, as well as the diffuse galaxy gas. We model the relative contribution of each of these unresolved stellar X-ray sources in the Appendix to determine whether these sources significantly affect our spectral measurements of flux, temperature and metallicity of M60’s diffuse gas. We find that CV’s and AB’s contribute only and LMXB’s of M60’s total keV flux. Thus M60 is still gas dominated. If these stellar components are included in our spectral model, our results for the temperature and abundance of the diffuse galaxy gas are unchanged. Furthermore if we allow the normalization of the power law model for unresolved LMXBs to be a free parameter, the measured keV flux of unresolved LMXBs in this region is consistent with our predicted value.
| Band | Range | Flux | Luminosity |
|---|---|---|---|
| (keV) | erg s-1 cm-2 ) | ( erg s-1 ) | |
| Soft | |||
| Hard | |||
| Full |
Note. — Flux and luminosities from the best absorbed VApec model fit to the mean spectrum of M60 using a radius circular region centered on M60’s X-ray peak.
3.3.2 Virgo ICM
The final component to model in fitting the spectra is the contribution from the cluster emission. Virgo is a young, dynamically active cluster. Urban et al. (2011) found from XMM-Newton observations that beyond kpc from M87, the X-ray surface brightness of the Virgo ICM is highly variable, varying as much as a factor at Mpc, the projected distance of M60 from M87. Using Suzaku, Simonescu et al. (private communication) further showed that the flux and temperature of Virgo gas at large radius depends strongly on the azimuthal direction of the observation, with higher fluxes and temperatures found along directions that coincide with higher density filaments. We thus choose to measure the spectral properties of the Virgo gas using our combined Chandra data in region N3 (see Fig. 2), where the northern surface brightness profile shown in Fig. 3 flattens, rather than adopt a model from the literature. We model the spectrum of the Virgo ICM in region N3 using an absorbed thermal plasma APEC model with fixed Galactic hydrogen absorption and abundance (Urban et al. 2011). We find best-fit temperature, model normalization and intrinsic keV flux of keV, cm-5, and erg s-1 cm-2 (see Table 5). X-ray emission in the cluster outskirts is faint, contributing only of the keV flux in the circular region emcompassing M60. From the VAPEC model normalization we find a mean electron density for this region of cm-3 with uncertainties, yielding a thermal gas pressure of ergs cm-3 . These results are consistent with Urban et al. (2011), given the measured variability observed at these large radii. Since we directly measure the thermal properties of the Virgo cluster gas, i.e. gas density, temperature and thermal gas pressure, from the spectral fitting of the X-ray emission of the gas, any evolutionary effects of the ambient cluster magnetic field on determining those thermal properties have implicitly been accounted for in that measurement. Ambient magnetic fields could also contribute an additional non-thermal component to the total pressure in the Virgo Cluster. However, using the simulated magnetic field profile for the Virgo Cluster from Pfrommer & Dursi (2010), the expected non-thermal pressure due to ambient magnetic fields is at most of the thermal pressure at these radii and likely could be much less. Thus it does not significantly affect our analysis.
| Region | norm | flux | |||
|---|---|---|---|---|---|
| (keV) | ( cm-5) | ( erg s-1 cm-2 ) | ergs cm3 s-1) | ||
| N1 | |||||
| N2 | |||||
| N3 |
Note. — Spectra were modeled using an absorbed Apec model with Galactic absorption and abundance fixed at for M60 galaxy gas (N1) and at for regions N2 and N3 consistent with Virgo Cluster gas
3.3.3 Spectral Fitting Across the Edge
To determine the infall velocity of M60 into the Virgo galaxy cluster, we need to measure the temperatures and densities of gas on either side of the edge. We chose the northern profile sector for our analysis because detector coverage allows us to measure gas properties out to greater distances consistent with undisturbed Virgo gas (N3). Additionally the northern sector lies perpendicular to the readout direction, and the inner radius of region N1, the region just inside the edge, lies outside the bright core region, where readout would be greatest, minimizing the contribution of these out-of-time events in these regions. Thus readout in the spectral analysis of the northern regions (N1,N2,N3) may be neglected. We also note that a comparsion of X-ray and kinematical mass measurements for M60, show that magnetic fields do not contribute significantly to the pressure inside the edge in region N1 ( kpc (Paggi et al. 2014).
We model the inner two northern regions (N1 and N2), similar to that of N3 in Section 3.3.2, with an absorbed APEC model with fixed Galactic hydrogen absorption and abundances at for region N1 in M60, consistent with our measured mean Fe abundance for M60 galaxy gas, and at the Virgo value () for gas in the pile-up region N2. Our results are given in Table 5.
Since both galaxy and Virgo gas have temperatures keV, the cooling function and thus emissivity for each depends sensitively on the metal abundance of the gas. We determine the cooling functions for each of the northern spectral regions (N1, N2, N3) using
| (3) |
where is the unabsorbed model flux in the keV energy band, to match that of the surface brightness profile, is the APEC model normalization, is the redshift, are the luminosity (angular size) distances, respectively, and for . Values for , , and are also given in Table 5.
3.4 Constraining M60’s dynamical motion
Using the fitted surface brightness jumps from Table 3 and the cooling functions given in Table 5 in Equation 2, we calculate the density ratio between galaxy gas inside the edge and free streaming Virgo gas and multiply these by the respective temperature ratios from the spectral fits to obtain the pressure ratio between the stagnation point and the Virgo free stream region. Uncertainties in derived ratios are estimated using the extreme values of the CL uncertainties for measured properties. Our results are listed in Table 6.
| ( km s-1 ) | ( km s-1 ) | (deg) | |||||
|---|---|---|---|---|---|---|---|
Note. — Velocities assume a sound speed of km s-1 for keV Virgo gas and M60 radial velocity km s-1 . Uncertainites for derived values assume extremes in the 90% CL uncertainties for measured properties.
The Mach number (where is the speed of sound in the cluster free stream region) for the cold gas cloud moving through the hot ICM is determined from the ratio of pressures (see Eqs. 4 and Eq. 5 ).
| (4) |
| (5) |
where is the adiabatic index of the monatomic gas.
From the pressure ratios given in Table 6 and Eqns. 4 and 5, we find M60 moving at Mach relative to the Virgo ICM. The sound speed in completely ionized keV Virgo gas in the free stream region is km s-1 , such that we find the speed of M60 relative to the Virgo ICM is km s-1 .
The physical separation of M60 and M87 is 971 kpc, confirmed with the distance moduli measurements in both Tonry et al. (2001) and Mei et al. (2007). The radial velocity difference between M60 and M87 is km s-1 (Trager et al. 2000). Taking the Virgo cluster ICM to be at rest relative to M87, we determine the relative transverse component of M60’s velocity as km s-1 . The components of M60’s motion through the Virgo ICM imply an inclination angle with respect to the plane of the sky of degrees. Nearly all of M60’s motion is therefore in the plane of the sky, consistent with the sharp surface brightness edge observed. We estimate the time for pericenter passage assuming a constant infall velocity and direct projected path towards M87, such that Gyr. If the motion of M60 in the plane of the sky is directly towards M87, this will be an upper bound on the infall time.
MHD simulations suggest that magnetic fields may wrap around a galaxy during infall, forming a thin draping layer. In this layer ambient cluster magnetic fields may become amplified to a maximum value such that their magnetic pressure equals the ram pressure of the ICM on the galaxy (Lyutikov 2006; Pfrommer & Dursi 2010). Recent simulations also suggest these fields may become tangled and not suppress ram pressure stripping (Ruszkowski et al. 2014). For M60 infalling at km s-1 through Virgo gas of electron density cm-3 , this would imply a possible maximum magnetic field of within a ( pc) thick draping layer outside the edge. Unfortunately our combined observations of M60 are not deep enough to constrain the properties of any such layer (See, e.g. Su et al. 2017 for the analysis of NGC 1404, a similar galaxy, but with a Chandra exposure a factor longer than the one presented here).
3.5 Wings and Tail Structures of M60
The motion of M60 through the Virgo ICM causes the gas on the northwest side to be stripped and pushed behind the galaxy in the wake of its passage through Virgo, forming the observed ‘wings’ and sharp northwest edge. The coadded images show there are a pair of wings in both the northeast and south directions. These wings align with the direction of the outburst of the AGN at the core of M60 (Paggi et al. 2014).
The double wing structure is shown more clearly by binning to pixels ( bins) in Fig 5. The filamentary wings are thin and long, extending at least in both directions and as wide as the galaxy atmosphere radius ( span across each double wing structure). The northeastern wings are of approximately equal length () and separated by a cavity wide. The wings to the south are less symmetric, with the front wing being shorter than the downstream wing by a factor of .
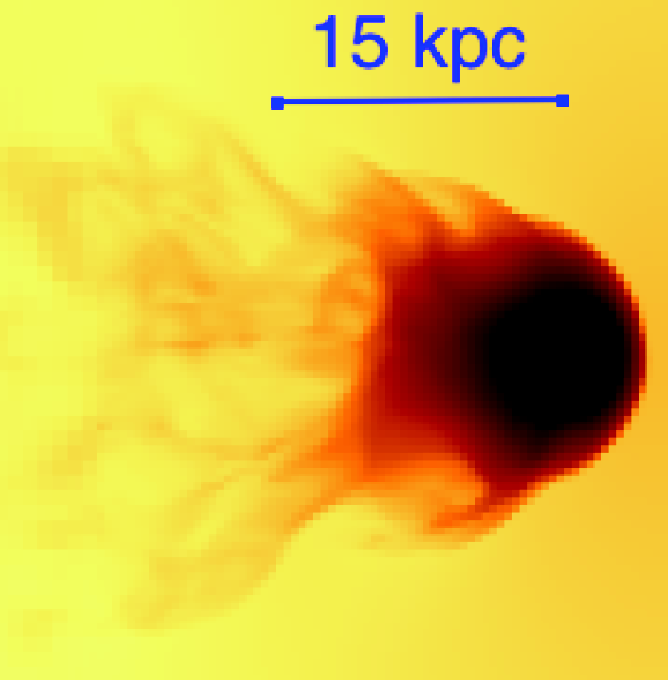
The dimensions of these filamentary wings were compared with simulations by Roediger et al. (2015a,b) of the Virgo galaxy M89 (NGC4552). The lower panel of Fig 5 shows a soft band X-ray projection of M89 that demonstrates how turbulent stripping can create wings of diffuse gas to the sides of the galaxy, as we observe for M60. The size of the wings scales with the size of the gas atmosphere, hence larger wings are seen in M60, compared to the simulations of the Virgo elliptical M89, since most of M89’s gas has already been stripped.
The double wing structure is seen in the simulation image (Fig 5 lower panel). The wings are attached directly to the sides of the galaxy as is the case for M60, another indicator of motion nearly in the plane of the sky. This can also be explained by the inclination angle; the simulations assume motion purely in the plane of the sky, while M60 has an inclination of degrees as shown in §3.4. For M89 these features are attached to the upstream edge rather than to the sides (Machacek et al. 2006). Thus the simulation better represents M60 in this instance.
Two processes can disturb the sharp-edge of a cold front; Rayleigh-Taylor instabilities and Kelvin-Helmholtz (KHI) instabilities (Roediger et al. 2012). The Rayleigh-Taylor instability occurs when two fluids of different densities are accelerated into each other. The galaxy gas is accelerating into the ICM, but the Rayleigh-Taylor instability is suppressed by M60’s gravity, so that the effective acceleration points in the opposite direction.
KHI instabilities, formed at the surface of the cold front edge where velocity shears may produce turbulent motions, are likely the cause of the filamentary wings seen in Figs. 1 and 5, perhaps aided by previous AGN outbursts that may have lifted the galaxy gas upward in M60’s gravitational potential making it easier to strip.
The simulations predict some faint emission behind the wings downstream leading to a diffuse tail trailing the galaxy. There is a faint excess of emission seen for kpc in the eastern surface brightness profile (Fig. 3) over that observed in the northern or western profiles, suggestive of such a tail.
The simulations of M89 predict a downstream edge marking the boundary between the galaxy atmosphere and diffuse tail. We performed our edge analysis as outlined in §3.2, on the eastern profile of M60 to look for this downstream edge (See Figs. 2 and 3 and Table 2).
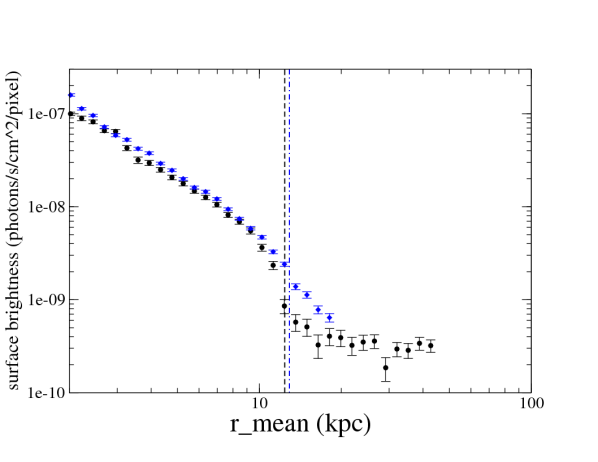
Using the power law model from Eq. 1, the eastern profile is well fit with upstream and downstream power law slopes of and , respectively. We find a small jump at kpc downstream from the center of M60. Since we expect from simulations that the near tail is composed of galaxy gas displaced but not yet completely stripped from M60 (Roediger etal 2015a), the abundance across the eastern edges should be the same. Thus , the ratio of the gas density across the eastern downstream edge. Fig 6 shows the extracted surface brightness profiles for both the upstream (northern cold front) and downstream (eastern tail) edges. The simulations generally find the downstream edge at a larger radius than the upstream edge, even more so than is observed for M60.
The surface brightness profiles are symmetric in both radial directions until each respective edge. In the simulations of M89, the upstream edge of the cold front and wings look sharper than the downstream edge, consistent with what we see in Fig 6.
There are several factors that could keep the tail of M60 faint. A steep initial gas density profile for M60 would mean there was less gas to strip at larger radii and the stripped gas may mix quickly with the surrounding ICM. The large distance of M60 from M87 ( kpc) and the galaxy velocity of km s-1 suggest multiple possibilities. First, we could be witnessing the very early stages of the M60-Virgo interaction, thus sufficient gas has not yet been stripped to form a clear tail as observed in M89, which is located far closer to M87 ( kpc) and therefore has undergone a much longer gas stripping period. Alternatively, M60 may already have passed through the Virgo system once and we are observing it shortly upon completing a turn around in its orbit. This would suggest stripping is occurring primarily from KHI, such that no large volumes of gas are being pushed behind the galaxy. In either case, stripping may be less efficient in the low density Virgo outskirts, requiring gas to first be uplifted by periodic AGN activity before being pushed back into the tail.
4 Conclusions
Using archival data from the Chandra X-ray Observatory (total cleaned exposure time ks), we identified a surface brightness discontinuity (edge) kpc from the center of M60 to the north and west in the direction on M87, the Virgo Cluster center. The surface brightness edge is produced by the ram pressure stripping of the gas in M60 as it passes through the Virgo ICM. From the surface brightness profile, taken to the north to minimize instrumental effects and maximize radial distance coverage, we measured gas temperatures within the edge in M60, in the Virgo gas pile-up region () immediately outside the edge, and in the Virgo free stream region ( kpc), and measured the density ratio between gas inside the edge and in the Virgo free stream region to determine the physical motion of the elliptical galaxy M60 through the Virgo ICM.
We find:
-
•
X-ray emission in M60 is gas dominated and well fit in the mean by a VAPEC spectral model with keV and Fe, O, Mg, and Si abundance of , , , and , respectively.
-
•
Fixing the abundance inside the edge at consistent with M60’s mean results and at for Virgo gas at Mpc from the literature, gas temperatures along the northern profile for galaxy gas inside the edge, in the pile-up region, and in the Virgo free stream region are keV, keV, and keV, respectively.
-
•
The leading (northern) edge at kpc from the galaxy center, coincides with a jump in density of between gas inside the edge and Virgo gas in the free stream region.
-
•
The measured pressure ratio between galaxy gas inside the edge and in the Virgo free stream region implies M60 is infalling with total velocity km s-1 (Mach ) relative to the Virgo ICM. Given the relative radial velocity of , this yields an inclination angle degrees with respect to the plane of the sky, consistent with the observed sharp surface brightness edge. M60’s inferred transverse infall velocity, km s-1 , places an upper bound on the time to pericenter passage of Gyr.
-
•
Extended wing-like features are observed to the northeast and south of M60. Comparison of these features with simulations of ram-pressure stripping suggests that these wings are likely produced by Kelvin-Helmholtz instabilities caused by M60’s motion through a nearly inviscid Virgo ICM. The thin and long filamentary gas wings scale with the size of the gas atmosphere and are attached directly to the sides of M60, an indicator of motion in the plane of the sky, consistent with the small measured inclination angle.
-
•
Excess emission observed to the east (downstream) of M60’s motion and confirmed in the eastern surface brightness profile is consistent with the existence of a faint, diffuse tail, similar to those seen in simulations of ram pressure stripping. The faintness of the tail is due either to insufficient stripping of the gas due to M60’s distance from the cluster core, or because we are observing M60 shortly after completing a turn-around of its orbit.
Acknowledgments
Data reduction and analysis was supported by the CXC CIAO, Sherpa, XMM-ESAS software packages and CALDB v4.4.8. Archival data was extracted from the Chandra Webchaser and XMM data archives. The NASA/IPAC Extragalactic Database (NED), which is operated by JPL/Caltech, under contract with NASA was used throughout as were the ADS facilities and arXiv for the literature. We thank Gary Mamon, and Paul Nulsen for useful discussions of the Virgo cluster and gas stripping, respectively. This work was supported by Chandra grants GO1-13141X, GO1-12110X, GO0-1106X, NASA contract NAS8-03060, the University of Southampton and the Smithsonian Astrophysical Observatory.
References
- (1)
- (2) Anders, E. & Grevesse, N. 1989, Geochimina et Cosmochimica Acta, 53, 197
- (3)
- (4) Arnaud, K. A. 1996, Astronomical Data Analysis Software and Systems V, eds. Jacoby G. and Barnes, J., ASP Conference Series Vol 101, pg. 17
- (5)
- (6) Bell, E. F., McIntosh, D. H., Katz, N., & Weinberg, M. D. 2003, ApJS, 149, 289
- (7)
- (8) Bogdan, A. & Gilfanov, M. 2011, MNRAS, 418, 1901
- (9)
- (10) Böhringer, H., Briel, U. G., Schwarz, R. A., et al. 1994, Nature, 368, 828
- (11)
- (12) de Vaucouleurs, G., de Vaucouleurs, A., Corbin, H. G.. et al. 1991, Third Reference Catalogue of Bright Galaxies (RC3), version 3.9b, Springer-Verlag New York
- (13)
- (14) Forman, W., Schwarz, J., Jones, C., Liller, W., & Fabian, A. C. 1979, ApJ, 234, L27
- (15)
- (16) Gilfanov, M. 2004, MNRAS, 349, 146
- (17)
- (18) Jones, C., Mandel, E., Schwarz, J., et al. 1979, ApJ, 234, L21
- (19)
- (20) Kraft, R. P., Forman, W. R., Jones, C., et al. 2011, ApJ, 727, 41
- (21)
- (22) Kraft, R.P., Roediger, E., Machacek, M., et al. 2017, ApJ, 848, 27
- (23)
- (24) Lyutikov, M. 2006, MNRAS, 373, 73
- (25)
- (26) Machacek, M., Dosaj, A. Forman W., et al. 2005, ApJ, 621, 663
- (27)
- (28) Machacek, M., Jones, C., Forman, W. R., & Nulsen, P. 2006, ApJ, 644, 155
- (29)
- (30) Markevitch, M., & Vikhlinin, A. 2007, Phys. Rep., 443, 1
- (31)
- (32) Mei, S., Blakeslee, J. P., Cote, P., et al. 2007, ApJ, 655, 144
- (33)
- (34) Paggi, A., Fabbiano, G., Kim, D., Pellegrini, et al. 2014, ApJ, 787, 134
- (35)
- (36) Pfrommer, C. & Dursi, L. J. 2010, Nature Physics, 6, 520
- (37)
- (38) Randall, S., Nulsen, P., Forman, W. R., et al. 2008, ApJ, 688, 208
- (39)
- (40) Revnivtsev, M., Churazov, E., Sazonov, S., Forman, W., & Jones, C. 2007, A&A, 473, 783
- (41)
- (42) Revnivtsev, M., Churazov, E., Sazonov, S., Forman, W., & Jones, C. 2008, A&A, 490, 37
- (43)
- (44) Roediger, E., Kraft, R. P., Machacek, M. E., et al. 2012, ApJ, 754, 147
- (45)
- (46) Roediger, E., Kraft, R. P., Machacek, M. E., et al. 2015a, ApJ, 806, 103
- (47)
- (48) Roediger, E., Kraft, R. P., Machacek, M. E., et al. 2015b, ApJ, 806, 104
- (49)
- (50) Ruszkowski, M. Brüggen, M., Lee, D. & Shin, M.-S. 2014, ApJ, 784, 75
- (51)
- (52) Smith, R. J., Lucey, J. R., Hudson, M. J., Schlegel, D. J., & Davies, R. L. 2000, MNRAS, 313, 469
- (53)
- (54) Su, Y., Kraft, R. P., Roediger, E., et al. 2017, ApJ, 834, 74
- (55)
- (56) Tonry, J. L., Dressler, A., Blakeslee, J. P., et al. 2001, ApJ, 546, 681
- (57)
- (58) Trager, S. C., Faber, S. M., Worthey, G., & Gonzalez, J. J. 2000, AJ, 119, 1645
- (59)
- (60) Urban, O., Werner, N., Simionescu, A., Allen, S. W., & Böhringer, H. 2011, MNRAS, 414, 2101
- (61)
- (62) Vikhlinin, A., Markevitch, M., & Murray, S. S. 2001, ApJ, 551, 160
- (63)
- (64) Vikhlinin, A. Markevitch, M., Murray, S.S., et al. 2005, ApJ, 628, 655
- (65)
Appendix
The Chandra data measure the X-ray emission from all sources in M60; this will encompass the diffuse galaxy gas, any unresolved point sources, such as cataclysmic variables (CV’s), accreting white dwarfs (AB’s) and low mass X-ray binaries (LMXBs), as well as the Virgo ICM emission along the line of sight. We model the relative contribution of each of these unresolved stellar X-ray sources to the X-ray luminosity of M60 below:
Cataclysmic Variables and Accreting Binaries
Based on X-ray observations of M32, Revnivtsev et al. (2007) found that unresolved stellar objects may provide a large fraction of the diffuse X-ray emission in low mass galaxies. In their follow-up paper, Revnivtsev et al. (2008) show the old stellar populations in galaxies can be characterized by a universal value of X-ray emissivity per unit stellar mass or per unit K-band luminosity.
From studying the K-band images of M60 taken with the 2MASS survey, we determined the stellar mass and implied X-ray luminosity of the stars. The K-band luminosity measured in a radius region centered on the X-ray peak is . Bell et al. (2003) showed that the relation between the galaxy’s stellar mass and the K-band luminosity can be expressed as:
| (6) |
where is in units of and is in units of . Using , (Bell et al. 2003) and the extinction corrected color for M60 from RC3 data (de Vaucouleurs et al. 1991; NED) in Eq. 6, we find a stellar mass of , where systematic uncertainties in the M/L relationship may be as high as .
Revnivtsev et al. (2007) give the relation between X-ray luminosity and stellar mass in the soft ( keV) energy band as follows:
| (7) |
Using Eq. 7, the stellar contribution to the soft X-rays is therefore erg s-1 , such that the stellar component is of the total keV emission. One should note, however, that there is of order a factor scatter in the LX - LK relation for these components in early type galaxies (see, e.g. Bogdan and Gilfanov 2011).
In fitting the X-ray spectra, this component is modeled with a mekal model plus power law with fixed temperature keV, Anders and Grevasse abundance and power law exponent (Revnivtsev et al. 2008). The relative normalization of the two components is fixed by setting the ratio of mekal model to power law fluxes to be in the keV band and the overall normalization is fixed such that the contribution of CV and AB stars is of the keV flux.
Low Mass X-ray Binaries
A second component to the X-ray emission is required to account for unresolved LMXBs below the individual source detection threshold that contribute to the overall diffuse X-ray luminosity. The azimuthally averaged spatial distribution of the number of LMXBs for most normal galaxies follows closely the distribution of the near-infrared light (Gilfanov 2004). The combined luminosity functions of LMXBs for such galaxies are as follows:
| (8) |
| (9) |
The average normalization is per , , , , (Gilfanov 2004). The total number of LMXBs and their collective luminosity is directly proportional to the stellar mass of the host galaxy. In regions without significant diffuse X-ray emission, counts is typically sufficient to detect a point source with Chandra. Assuming a power law LMXB spectrum with a slope of , and the combined exposure time of ks, the estimated source detection sensitivity would be erg s-1 . However, due to the presence of copious diffuse emission in M60, the actual source detection sensitivity is significantly higher than this. Based on a sensitivity map that was computed using the CIAO lim_sens task, we estimate that in most regions of M60 we detect sources brighter than erg s-1 . Based on this source detection sensitivity and equations 8 and 9,we predict that the X-ray luminosity of unresolved LMXBs in M60 is erg s-1 in the keV band, approximately of of the total X-ray luminosity within the radius region.