Anharmonicity and the isotope effect in superconducting lithium at high pressures: a first-principles approach
Abstract
Recent experiments Schaeffer et al. (2015a) have shown that lithium presents an extremely anomalous isotope effect in the 15-25 GPa pressure range. In this article we have calculated the anharmonic phonon dispersion of and under pressure, their superconducting transition temperatures, and the associated isotope effect. We have found a huge anharmonic renormalization of a transverse acoustic soft mode along K in the fcc phase, the expected structure at the pressure range of interest. In fact, the anharmonic correction dynamically stabilizes the fcc phase above 25 GPa. However, we have not found any anomalous scaling of the superconducting temperature with the isotopic mass. Additionally, we have also analyzed whether the two lithium isotopes adopting different structures could explain the observed anomalous behavior. According to our enthalpy calculations including zero-point motion and anharmonicity it would not be possible in a stable regime.
I Introduction
The strongly anomalous isotope effect recently measured in lithium in the 15-25 GPa pressure rangeSchaeffer et al. (2015a) brought this element back under the spotlight. The reported superconducting critical temperatures () contrast starkly with the BCS theory, where is expected to scale as , with being the atomic mass and the isotope coefficient (0.5 within the BCS theory). Actually, for most phonon mediated superconductors, does not deviate much from 0.5. However, the above mentioned experiment shows a highly erratic behavior of as a function of pressure, with values ranging from 1 to 4 from 15 to 21 GPa, decreasing sharply between 21 and 25 GPa, where it even becomes negative, with values as low as -2.
It is just another fascinating example of the rich and exotic phenomena emerging in lithium under pressure. The lightest metal on the periodic table shows a nearly free-electron bcc structure at ambient conditionsSeitz (1935). Although it could be expected to evolve to an even more free-electron like system with increasing pressure, it has been shown that pressure not only induces several structural transformations Guillaume et al. (2011); Hanfland et al. (2000); Matsuoka et al. (2008); Schaeffer et al. (2015b); Ackland et al. (2017), but also gives rise to a plethora of fascinating physical propertiesRousseau et al. (2011). For instance, lithium becomes a semiconductor near 80 GPaMatsuoka and Shimizu (2009), it shows a maximum in the melting line Hernández et al. (2010) and melts below ambient temperature (190 K) at around 50 GPaGuillaume et al. (2011). It also presents one of the highest for an elementDeemyad and Schilling (2003); Struzhkin et al. (2002); Schaeffer et al. (2015a); Bazhirov et al. (2010); Shimizu et al. (2002); Ashcroft (2002) and it is expected to display a periodic undamped plasmonSilkin et al. (2007); Errea et al. (2010). Additionally, according to a recent experiment lithium shows quantum and isotope effects in its low temperature and pressure phase transformationsAckland et al. (2017).
Experimental evidenceHanfland et al. (2000); Guillaume et al. (2011); Matsuoka and Shimizu (2009); Matsuoka et al. (2008); Schaeffer et al. (2015b); Ackland et al. (2017) shows that in the pressure and temperature ranges where the anomalous isotope effect was measured (15-25 GPa and below 30 K) lithium presents a fcc structure. At around 40 GPa, it transforms to the rhombohedral hR1 phase, which is just a distortion of the fcc phase along the c axis if one switches to a hexagonal representation. The transformation to the cubic cI16 phase occurs shortly after, at around 43 GPa.
Theoretical calculations within the harmonic approximation in fcc lithium show a highly softened transverse acoustic mode in the high-symmetry lineProfeta et al. (2006); Akashi and Arita (2013); Bazhirov et al. (2010); Maheswari et al. (2005); Rodriguez-Prieto et al. (2006). Around , where a is the lattice parameter, this anomalous mode presents a huge electron-phonon coupling, becoming a key factor to explain the high observed in lithiumProfeta et al. (2006); Akashi and Arita (2013); Maheswari et al. (2005). This softening is associated to a well defined Fermi surface nestingProfeta et al. (2006); Akashi and Arita (2013); Bazhirov et al. (2010); Maheswari et al. (2005); Rodriguez-Prieto et al. (2006); Rodriguez-Prieto and Bergara (2005) and even yields imaginary phonon frequencies at pressures where fcc is known to be stable; the instability emerges at pressures higher than 30 GPa in the local density approximation (LDA), and at even lower pressures if one uses the generalized gradient approximation (GGA). As seen in other systems, such as simple cubic Ca Errea et al. (2012), PdHErrea et al. (2013), the record superconductor Errea et al. (2016) and Leroux et al. (2015), anharmonicity is expected to have a significant role stabilizing this structure and, due to phonon frequency renormalization, also determining its superconducting propertiesBorinaga et al. (2017). As it has been measured at lower pressures of the phase diagram of lithiumAckland et al. (2017), zero-point vibrational energy could strongly impact the phase transitions of lithium in the 15-25 GPa pressure range, specially considering the small enthalpy differences between the most competitive candidates according to previous calculationsHanfland et al. (2000); Ma et al. (2008); Yao et al. (2009). In fact, the anharmonic correction to the vibrational energy could be significant as well.
The origin of the observed unconventional isotope effect in high pressure lithium remains unclear. Here we consider the following two hypothesis to explain this behavior. (i) Phonon frequencies scale with the atomic mass differently as expected within the harmonic approximation. Therefore, while in the harmonic approach the electron phonon coupling constant is independent of the isotopic mass, anharmonicity could make it differ from one isotope to the other, as it happens in palladium hydride Errea et al. (2013). (ii) and isotopes adopt different crystal structures due to the significant role of the vibrational energy in the phase diagram. Experimental evidence and previous theoretical calculations claim Li adopts the fcc phase from as low as 7 GPa to as high as 40 GPa in the temperature regime where superconductivity has been measuredGuillaume et al. (2011); Matsuoka and Shimizu (2009); Matsuoka et al. (2008); Schaeffer et al. (2015b). However, there is a considerable lack of experimental data in the mentioned region of the phase diagram and all previous calculations have been done in the static approach.
In this work we present an exhaustive analysis of the superconducting properties of fcc and cI16 structures of lithium in the 15-45 GPa pressure range, with vibrational degrees of freedom treated at the anharmonic level. We also analyze the possible existence of the hR1 phase in the pressure range of interest.
II Computational details
Our density functional theory (DFT) calculations were done within the Perdew-Burke-Ernzerhof (PBE) parametrization of the GGAPerdew et al. (1996). Harmonic phonon frequencies and the electron-phonon deformation potential were calculated within density functional perturbation theory (DFPT)Baroni et al. (2001) as implemented in Quantum ESPRESSOGiannozzi et al. (2009). The electron-proton interaction was considered making use of an ultrasoft pseudopotentialVanderbilt (1990) which includes 1s and 2s electrons. Anharmonic calculations, including the vibrational contribution to the enthalpy, were performed using the stochastic self-consistent harmonic approximation (SSCHA)Errea et al. (2014). Anharmonic force constant matrices of fcc lithium were obtained by calculating forces in supercells. Therefore, anharmonic dynamical matrices were obtained in the respective commensurate q-point grids and interpolated to a finer mesh afterwards. These were combined with DFPT electron-phonon calculations obtained in the fine mesh to calculate the anharmonic Eliashberg function . The same procedure was used for the cI16 structure, being and the coarse and fine grids respectively. The vibrational contribution to the enthalpy of hR1, which is a distortion of the fcc phase, was calculated using a grid for obtaining anharmonic force constant matrices and interpolating the differences with respect to the undistorted fcc structure. More details and the convergence parameters are given in the Supplementary Material.
III Results and Discussion
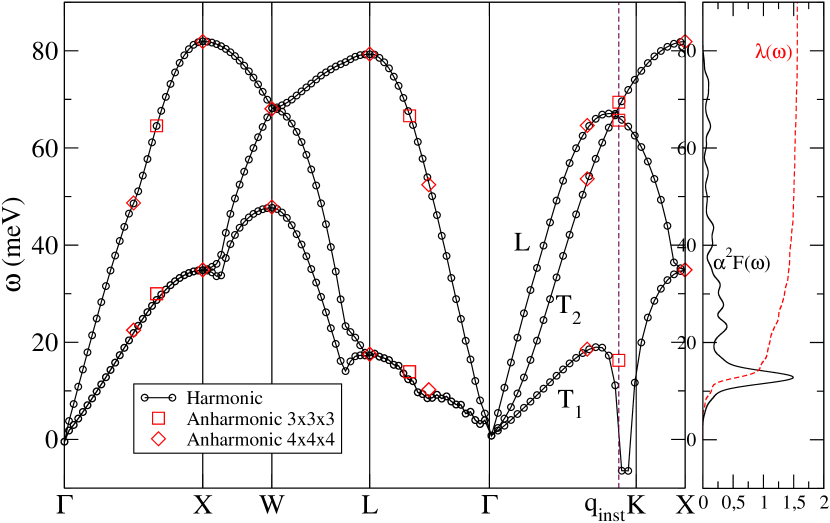
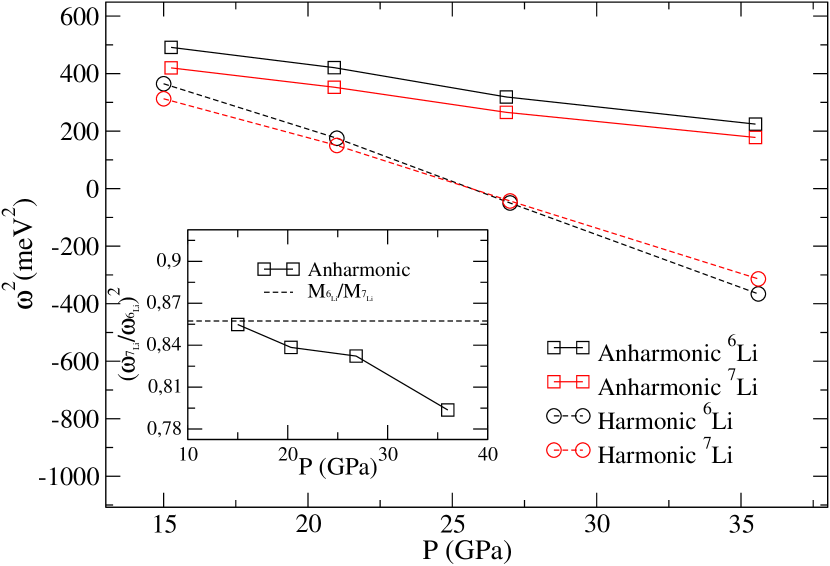
Fig. 1 shows the DFPT harmonic phonon dispersion of fcc at 26 GPa and the anharmonic corrections calculated within the SSCHA. Anharmonic force constant matrices were obtained by calculating forces in and supercells. Consequently, anharmonic dynamical matrices were obtained in the respective commensurate q-point grids. We see that anharmonicity is primarily localized around the phonon softening at the transverse acoustic branch at , where the frequency is strongly shifted up by anharmonic effects. This well known phonon softening has been widely analyzed and explained in terms of Fermi surface nesting Profeta et al. (2006); Akashi and Arita (2013); Bazhirov et al. (2010); Maheswari et al. (2005); Rodriguez-Prieto et al. (2006); Rodriguez-Prieto and Bergara (2005) and, as shown in Fig. 2, it even yields imaginary frequencies at pressures higher than 25 GPa; a considerably lower pressure than the 30 GPa obtained within the LDA. In the same graph we also show the anharmonic frequency of the same mode, confirming fcc lithium is dynamically stabilized by anharmonicity above 25 GPa. However, as it is shown in the inset and even though this soft mode shows huge anharmonic effects, its frequency scales practically as in the harmonic case ( ). Despite the large anharmonicity, a similar harmonic scaling was previously calculated for high pressure simple cubic calciumErrea et al. (2012).
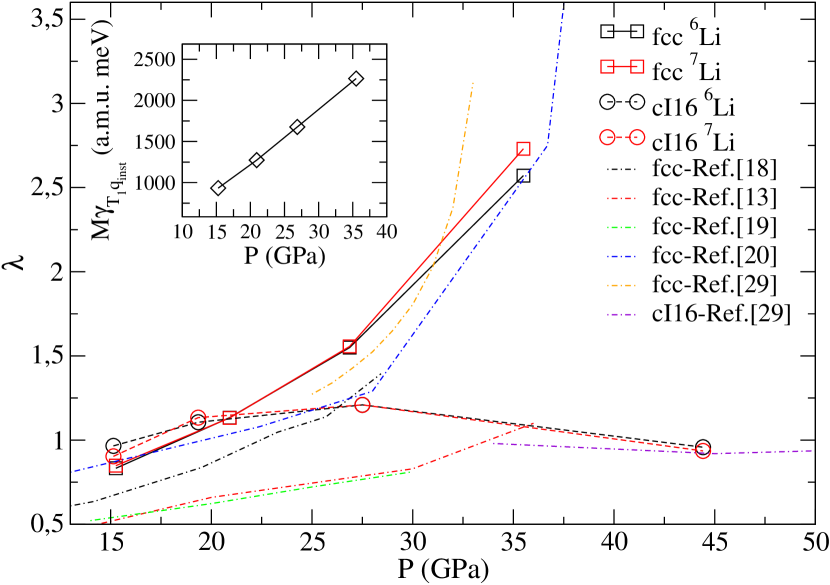
Our DFPT electron-phonon coupling calculations displayed in Fig. 3 show the total coupling constant rises abruptly with increasing pressure in the fcc phase. Starting from an already high value of 0.85 at 15 GPa and reaching a value as high as 2.6 at 36 GPa, this dramatic growth is directly related to the also rapid increase of the electron-phonon linewidth of the mode at , which doubles its value in the mentioned pressure range. The remarkable peak in the Eliashberg function and the associated abrupt growth of the integrated electron-phonon coupling constant around the frequency of the anomaly is another indicator of how relevant this softening is in the superconducting properties of fcc lithium. However, while the phonon renormalization of the mentioned mode due to anharmonicity is huge, is nearly identical for both isotopes at every pressure except at 35 GPa, where the difference is just 7%, even if anharmonicity is already really strong. As mentioned above, this is due to the fact that the frequency of the anomalous mode scales harmonically. Our values are slightly larger than the ones by Maheswari et al.Maheswari et al. (2005) and Profeta et al.Profeta et al. (2006) and quite larger than the ones by Akashi et al.Akashi and Arita (2013) and Bazhirov et al.Bazhirov et al. (2010). We attribute these disagreements to the large dependence of with the q-point grid. While we used a sampling of the BZ for the electron-phonon and lattice dynamics calculations, where is explicitly taken into account, the mentioned works use grids ( in the case of Maheswari et al.), where it is not. According to our convergence tests, those grids clearly underestimate due to the absence of in the grid (see Supplementary Material). Including this extremely anharmonic anomalous point is crucial for estimating the impact of anharmonicity in the electron-phonon coupling and, as a consequence, the superconducting .
Considering that for large electron-phonon coupling constants the McMillan equation underestimates the superconducting Allen and Dynes (1975), we solved the isotropic Migdal-Eliashberg equationsMigdal (1958); Eliashberg (1960). We estimated a value of 0.17 using the Morel-Anderson formulaMorel and Anderson (1962):
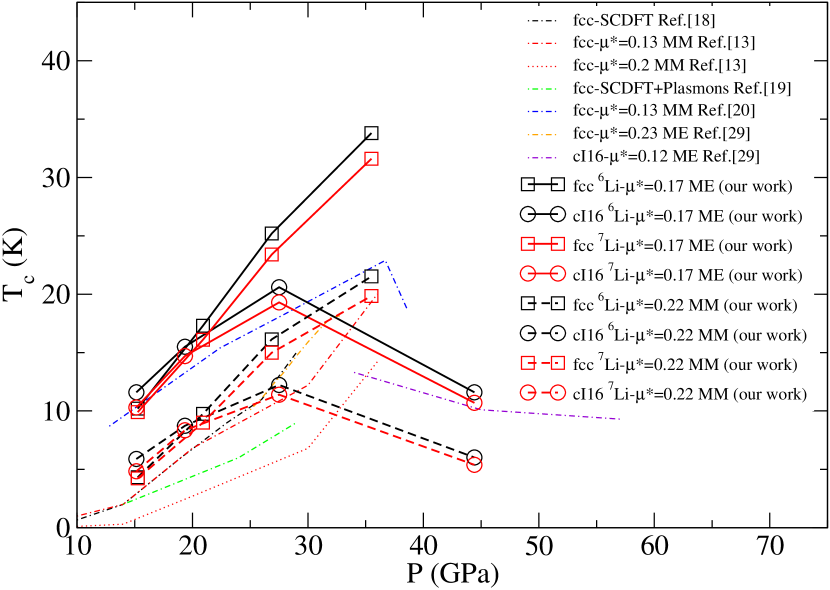
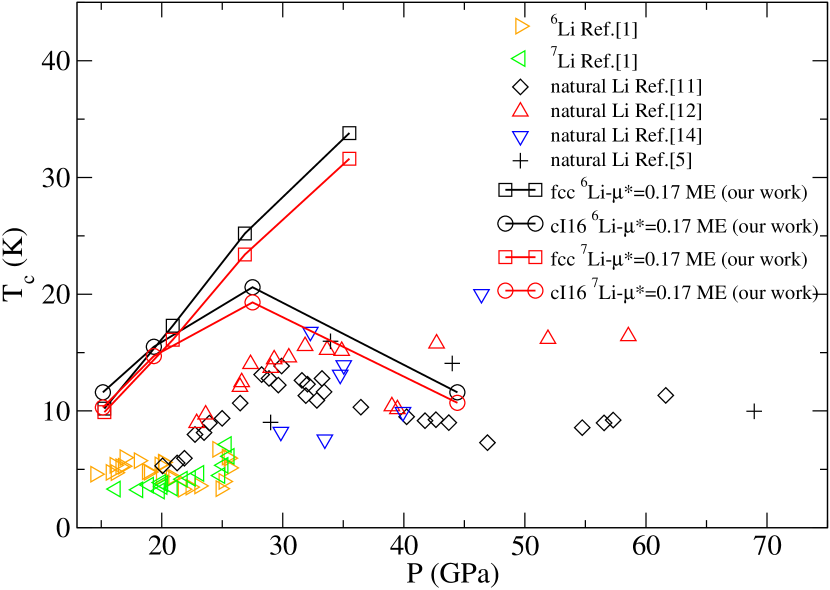
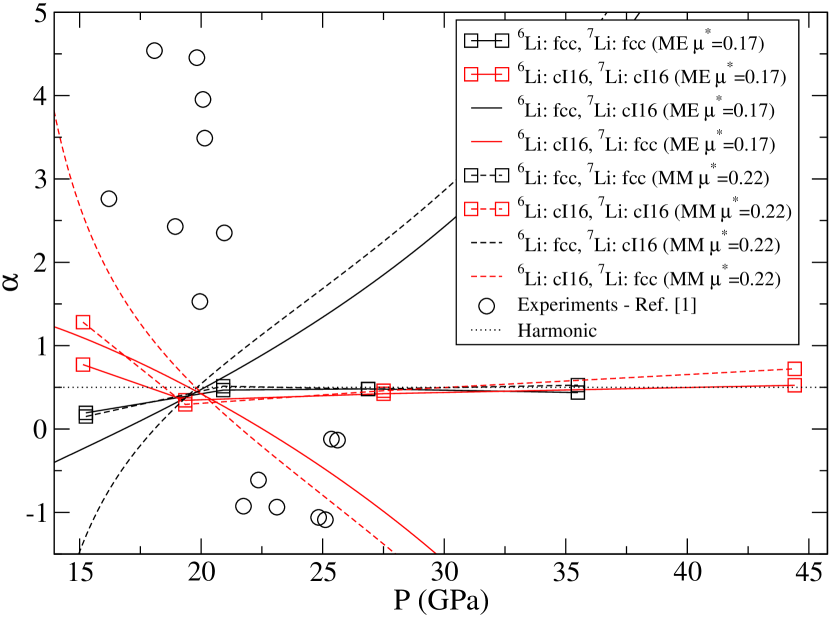
| (1) |
The average electron-electron Coulomb repulsion term was obtained from Thomas-Fermi screening theory, a free-electron Fermi energy was chosen, and the Debye cutoff phonon frequency was taken as the highest frequency of the longitudinal acoustic modes Chang et al. (1985). Changes in phonon frequencies and electronic density for different pressures and isotopes only alter the fourth significant digit of , so that differences in cannot explain the isotope effect anomalies and we assume the same value for both isotopes. Fig. 4 shows the superconducting critical temperature of fcc lithium for both isotopes at 15, 20, 26 and 36 GPa. We find increases monotonically with pressure the same way does, ranging from 11.2 K (10.7 K) at 15 GPa to 34.8 K (32.5 K) at 36 GPa for (). As in the case of , we do not see any anomalous scaling of the superconducting temperature with the isotopic mass; as it can be seen in Fig. 5, is close to the conventional harmonic BCS value of 0.5 within the entire pressure range except at 15 GPa where, even though it shows a lower value, it does not, in any case, explain the experimentally observed anomalous isotope effect. Using McMillan’s formula with 0.22 compares better with literature and experiments, even though values are still larger than in previous works due to the choice of the q-point grid as in the case of ; in any case, does not almost change, and the conclusion remains unaltered. The overestimation of could also indicate that vertex corrections in the electron-phonon coupling and anisotropic effects in the Migdal-Eliashberg equations might be important. However, anisotropic effects should not be isotope dependent and, due to the harmonic scaling of phonon frequencies, we do not expect vertex corrections to yield any anomalous isotope effect either. Therefore, we discard hypothesis (i).
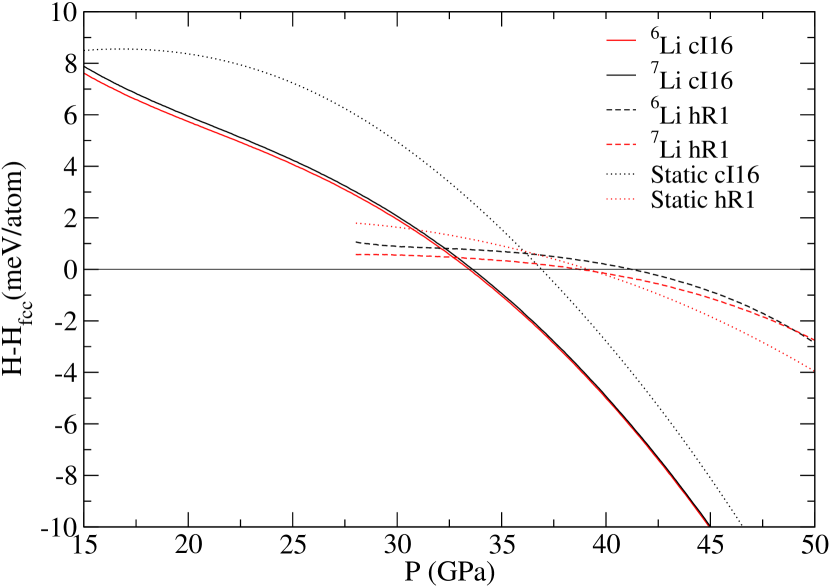
After discarding that the anomalous isotope effect comes from strong anharmonicity in the fcc phase, we analyzed the possibility of the two isotopes showing different structures at the same pressure in a thermodynamically stable way. Fig. 6 shows the enthalpies of the competing phases cI16 and hR1 relative to their respective fcc ones for the two isotopes. Our static calculations, i.e. not including zero-point energy (ZPE), compare well with literature (there are no previous works including ZPE)Ma et al. (2008) and just show the fcc to cI16 transition. No important changes are shown for both isotopes when anharmonic ZPE is included and, although in the pressure range where this phase transition happens the enthalpy difference with the hR1 is less than 1 meV per atom, that is, roughly the same as the error one assumes when converging total energy calculations within DFT, it remains metastable. Therefore, small changes in the calculation parameters or the choice of exchange and correlation potential might cause modifications in the transition pressures and phase sequence. Accordingly, when ZPE is included the fcc to cI16 transition pressure shifts from 37 GPa to 33 GPa for both isotopes, as the enthalpy difference is reduced by around 3 meV due to lattice vibrations. Additionally, in the 21-25 GPa pressure range, where the inverse isotope effect was observed, the enthalpy difference between cI16 and fcc structures is really small (around 4-6 meV/atom). In conclusion, our results do not support hypothesis (ii) as and isotopes are not expected to adopt different stable crystal structures.
Due to the extremely small enthalpy differences metastable coexistence of phases can not be discarded as it happens at ambient pressure for its martensitic transitionAckland et al. (2017). In order to see if and adopting different structures could lead to the observed anomalous isotope effect, we have also made lattice dynamics and electron-phonon coupling calculations in the cI16 structure. We do not further consider hR1 as a candidate because, according to our calculations, the local minimum in the total energy surface associated to hR1 disappears for pressures lower than 28 GPa (see Supplementary Material). In Fig. 3 we show the total electron-phonon coupling for cI16 Li at 15, 19, 27 and 44 GPa. does not vary with pressure as much as it does in the fcc phase, it varies only between 0.9 and 1.2 in the 15-44 GPa pressure range. is fairly similar for both isotopes, so that anharmonicity does not have almost any impact. Actually, at the lowest pressures, cI16 values differ more than the fcc ones from one isotope to the other. This is due to the fact that, while the overall phonon spectrum is very slightly modified by anharmonicity in the cI16 phase, anharmonic corrections occur mostly at the lowest frequencies, which are the ones that contribute most to the total electron-phonon coupling. In fact, our and estimations, with =0.17 obtained with the Morel-Anderson formula as in the fcc case, shown in Figs. 3 and 4 yield values higher than in fcc below 20 GPa, being the opposite at higher pressures. The isotope effect coefficient is close to the harmonic value at 27 and 44 GPa, with 0.42 and 0.57, respectively, while it deviates considerably from 0.5 at 15 and 19 GPa as it yields 0.77 and 0.34, respectively. All this agrees with the higher anharmonicity we found at lower pressures. Although our enthalpy calculations do not predict both isotopes can stabilize in different structures, we have also analyzed this metastability driven hypothetical scenario: stabilizing in the fcc phase and in the cI16, and viceversa. As shown in Fig. 5, in the pressure range where the inverse isotope effect was experimentally observed (21-25 GPa), experimental values would only be qualitatively reproduced if adopted the cI16 structure while were in the fcc phase. This qualitative picture does not vary much if one uses the McMillan formula with 0.22, but it could notably change if we used different values for the different phases.
IV Conclusions
According to our calculations, even though anharmonicity is crucial to stabilize the fcc phase in lithium under pressure, its remains almost the same for both isotopes and yields a conventional scaling of with isotopic mass and, therefore, it does not explain the experimentally observed anomalous isotope effect. On the other hand, including anharmonic ZPE in the enthalpy curve does not modify lithium phase diagram in the pressure range of interest, so that it is unexpected to have both isotopes in different structures. The anomalous isotope effect could only be qualitatively explained if adopted the fcc structure while adopted the cI16 one in a metastable way. All these, added to the large error bars and quite chaotic behavior of with pressure in Ref. Schaeffer et al., 2015a–with considerably different temperature values for the same pressure– puts in question the experimental observation of an anomalous isotope effect in lithium at high pressure. This way, our work encourages further research to determine the phase sequence and superconducting properties of the two stable isotopes of lithium.
Acknowledgments
The authors acknowledge financial support from the Spanish Ministry of Economy and Competitiveness (FIS2016-76617-P) and the Department of Education, Universities and Research of the Basque Government and the University of the Basque Country (IT756-13). M.B. is also thankful to the Department of Education, Language Policy and Culture of the Basque Government for a predoctoral fellowship (Grant No. PRE-2015-2-0269). Computer facilities were provided by PRACE and the Donostia International Physics Center (DIPC).
References
- Schaeffer et al. (2015a) A. M. Schaeffer, S. R. Temple, J. K. Bishop, and S. Deemyad, Proceedings of the National Academy of Sciences 112, 60 (2015a).
- Seitz (1935) F. Seitz, Physical Review 47, 400 (1935).
- Guillaume et al. (2011) C. L. Guillaume, E. Gregoryanz, O. Degtyareva, M. I. McMahon, M. Hanfland, S. Evans, M. Guthrie, S. V. Sinogeikin, and H.-K. Mao, Nature Physics 7, 211 (2011).
- Hanfland et al. (2000) M. Hanfland, K. Syassen, N. E. Christensen, and D. L. Novikov, Nature 408, 174 (2000).
- Matsuoka et al. (2008) T. Matsuoka, S. Onoda, M. Kaneshige, Y. Nakamoto, K. Shimizu, T. Kagayama, and Y. Ohishi, Journal of Physics: Conference Series 121, 052003 (2008).
- Schaeffer et al. (2015b) A. M. Schaeffer, W. Cai, E. Olejnik, J. J. Molaison, S. Sinogeikin, A. M. dos Santos, and S. Deemyad, Nature Communications 6, 8030 (2015b).
- Ackland et al. (2017) G. J. Ackland, M. Dunuwille, M. Martinez-Canales, I. Loa, R. Zhang, S. Sinogeikin, W. Cai, and S. Deemyad, Science 356, 1254 (2017).
- Rousseau et al. (2011) B. Rousseau, Y. Xie, Y. Ma, and A. Bergara, Eur. Phys. J. B 81, 1 (2011).
- Matsuoka and Shimizu (2009) T. Matsuoka and K. Shimizu, Nature 458, 186 (2009).
- Hernández et al. (2010) E. R. Hernández, A. Rodriguez-Prieto, A. Bergara, and D. Alfè, Phys. Rev. Lett. 104, 185701 (2010).
- Deemyad and Schilling (2003) S. Deemyad and J. S. Schilling, Phys. Rev. Lett. 91, 167001 (2003).
- Struzhkin et al. (2002) V. V. Struzhkin, M. I. Eremets, W. Gan, H.-k. Mao, and R. J. Hemley, Science 298, 1213 (2002).
- Bazhirov et al. (2010) T. Bazhirov, J. Noffsinger, and M. L. Cohen, Phys. Rev. B 82, 184509 (2010).
- Shimizu et al. (2002) K. Shimizu, H. Ishikawa, D. Takao, T. Yagi, and K. Amaya, Nature 419, 597 (2002).
- Ashcroft (2002) N. W. Ashcroft, Nature 419, 569 (2002).
- Silkin et al. (2007) V. M. Silkin, A. Rodriguez-Prieto, A. Bergara, E. V. Chulkov, and P. M. Echenique, Phys. Rev. B 75, 172102 (2007).
- Errea et al. (2010) I. Errea, A. Rodriguez-Prieto, B. Rousseau, V. M. Silkin, and A. Bergara, Phys. Rev. B 81, 205105 (2010).
- Profeta et al. (2006) G. Profeta, C. Franchini, N. N. Lathiotakis, A. Floris, A. Sanna, M. A. L. Marques, M. Lüders, S. Massidda, E. K. U. Gross, and A. Continenza, Phys. Rev. Lett. 96, 047003 (2006).
- Akashi and Arita (2013) R. Akashi and R. Arita, Phys. Rev. Lett. 111, 057006 (2013).
- Maheswari et al. (2005) S. U. Maheswari, H. Nagara, K. Kusakabe, and N. Suzuki, Journal of the Physical Society of Japan 74, 3227 (2005).
- Rodriguez-Prieto et al. (2006) A. Rodriguez-Prieto, A. Bergara, V. M. Silkin, and P. M. Echenique, Phys. Rev. B 74, 172104 (2006).
- Rodriguez-Prieto and Bergara (2005) A. Rodriguez-Prieto and A. Bergara, Phys. Rev. B 72, 125406 (2005).
- Errea et al. (2012) I. Errea, B. Rousseau, and A. Bergara, Journal of Applied Physics 111, 112604 (2012).
- Errea et al. (2013) I. Errea, M. Calandra, and F. Mauri, Phys. Rev. Lett. 111, 177002 (2013).
- Errea et al. (2016) I. Errea, M. Calandra, C. J. Pickard, J. R. Nelson, R. J. Needs, Y. Li, H. Liu, Y. Zhang, Y. Ma, and F. Mauri, Nature 532, 81 (2016).
- Leroux et al. (2015) M. Leroux, I. Errea, M. Le Tacon, S.-M. Souliou, G. Garbarino, L. Cario, A. Bosak, F. Mauri, M. Calandra, and P. Rodière, Phys. Rev. B 92, 140303 (2015).
- Borinaga et al. (2017) M. Borinaga, U. Aseginolaza, I. Errea, A. Bergara, U. Aseginolaza, I. Errea, and A. Bergara, JJAP Conference Proceedings 011103, 6 (2017).
- Ma et al. (2008) Y. Ma, A. R. Oganov, and Y. Xie, Phys. Rev. B 78, 014102 (2008).
- Yao et al. (2009) Y. Yao, J. S. Tse, K. Tanaka, F. Marsiglio, and Y. Ma, Phys. Rev. B 79, 054524 (2009).
- Perdew et al. (1996) J. P. Perdew, K. Burke, and M. Ernzerhof, Phys. Rev. Lett. 77, 3865 (1996).
- Baroni et al. (2001) S. Baroni, S. de Gironcoli, A. Dal Corso, and P. Giannozzi, Rev. Mod. Phys. 73, 515 (2001).
- Giannozzi et al. (2009) P. Giannozzi et al., J. Phys. Condens. Matter 21, 395502 (2009).
- Vanderbilt (1990) D. Vanderbilt, Phys. Rev. B 41, 7892 (1990).
- Errea et al. (2014) I. Errea, M. Calandra, and F. Mauri, Phys. Rev. B 89, 064302 (2014).
- Allen and Dynes (1975) P. B. Allen and R. C. Dynes, Phys. Rev. B 12, 905 (1975).
- Migdal (1958) A. B. Migdal, Sov. Phys. JETP 7, 996 (1958).
- Eliashberg (1960) G. M. Eliashberg, Sov. Phys. JETP 11, 696 (1960).
- Morel and Anderson (1962) P. Morel and P. W. Anderson, Phys. Rev. 125, 1263 (1962).
- Chang et al. (1985) K. J. Chang, M. M. Dacorogna, M. L. Cohen, J. M. Mignot, G. Chouteau, and G. Martinez, Phys. Rev. Lett. 54, 2375 (1985).