Imaging isodensity contours of molecular states with STM
Abstract
We present an improved way for imaging the local density of states with a scanning tunneling microscope, which consists in mapping the surface topography while keeping the differential conductance (d/d) constant. When archetypical C60 molecules on Cu(111) are imaged with this method, these so-called iso-d/d maps are in excellent agreement with theoretical simulations of the isodensity contours of the molecular orbitals. A direct visualization and unambiguous identification of superatomic C60 orbitals and their hybridization is then possible.
The ability of the scanning tunneling microscope (STM) to image and address conductive surfaces at the atomic-scale is the main reason of its impressive success over the last three decades. Of appealing interest is the possibility of probing the local density of states (DOS) of metallic or organic nanostructures adsorbed on surfaces. If the energy distribution of the local DOS is usually directly inferred from differential conductance (d/d) spectra, a strict comparison requires a renormalization of the experimental data Stroscio1986 ; Ukraintsev1996 ; Wagner2007 ; Koslowski2007 ; Passoni2009 . Measuring the spatial distribution of the DOS is even more demanding. Maps of the DOS are usually obtained by recording the d/d at a given target voltage () while keeping the tunneling current () constant Hasegawa1993 ; Kedong2003 ; Nilius2005 ; Temirov2006 ; Feng2008 ; Schull2008 ; Schull2009 ; Auwaerter2010 ; Mullegger2011 ; Ruffieux2012 ; Fahrendorf2013 ; Nacci2015 ; Pham2016 . However, these so-called constant-current d/d maps suffer from the fact that the tip–sample distance () varies during the scan and therefore do not properly reflect the local DOS of the probed nanostructure. This well-known limitation has been evidenced for surface–confined electronic states Hoermandinger1994 ; Li1997 , adatoms Ziegler2009 or molecules adsorbed on surface Lu2003 ; Krenner2013 ; Zhang2015 . To extract reliable information from these maps, a time-consuming image treatment is required after acquisition Li1997 ; Lu2003 ; Ziegler2009 ; Krenner2013 ; Zhang2015 .
An interesting alternative consists in recording the d/d while scanning the surface with an open feedback loop Ziegler2009 ; Heinrich2010 ; Krenner2013 ; Reecht2013 ; Zhang2015 ; Hajo2015 . In the case of a flat sample, the obtained image – the so-called constant-height d/d map – is an accurate representation of the local DOS. However, this method is limited in the case of corrugated objects, because the effective tip–sample distance varies as a function of the position of the tip. Moreover, since the data are acquired with a disabled feedback loop, this method requires small thermal drift during the acquisition of the conductance map, limiting the field of application to cryogenic measurements which provide sufficient thermal stability.
In this letter, we propose a different experimental approach that enables a direct visualization of DOS isosurfaces, independently of the corrugation of the sample, and that may be implemented at all working temperatures. This imaging technique consists in acquiring iso-d/d maps, in other words in scanning the tip across the surface while keeping the d/d signal constant (instead of the current) and recording changes in . Through a combination of experiments with density functional theory (DFT) calculations, we show that the iso-d/d maps of non-planar C60 molecules on a Cu(111) surface closely reflect theoretical representations of the molecule DOS isosurface unlike standard d/d maps, i.e., constant-current and constant-height, that exhibit misleading patterns for some of the C60 orbitals Lu2003 . We use this new method to provide a fresh insight into the recently reported superatomic orbitals of C60 monomers and dimers Feng2008 .
The experiments were performed with a STM operated at 4.6 K in UHV. Electrochemically etched W tips and Cu(111) samples were prepared by successive cycles of Ar+ bombardment and annealing. The C60 molecules were sublimated from an evaporator onto the cold ( 5 K) sample. The d/d spectra were recorded via a lock-in amplifier by applying an AC bias of 7 kHz modulation frequency and of 10 mV rms amplitude (50 mV rms for the maps). Except for Fig. 1b, the d/d spectra were acquired with a disabled feedback loop. To permit an unbiased comparison between the different imaging methods, the experimental maps were not processed, except for the pseudo-3D representations in Fig. 3, which were treated with a smoothing algorithm. All the images were prepared with the Nanotec Electronica WSxM software Horcas2007 . Details of the DFT calculations are provided in the Supplemental Material SI .
To start, we briefly describe the working principle of an iso-d/d map. At low temperature and assuming a constant tip DOS, the tunnel current can be expressed as Simmons1963 where is the surface DOS and the energy. Within the Wentzel-Kramer-Brillouin approximation, the transmission factor reads where is the local barrier height and (: free electron mass, : reduced Planck constant). The derivative of the current with respect to reads
| (1) |
In the following, we disregard the third term of Eq. (Imaging isodensity contours of molecular states with STM) as the lock-in modulation frequency of the AC bias is purposely chosen to be high compared to the time constant of the feedback loop (). We then find the usual expression Koslowski2007 ; Ziegler2009
where the second term can be neglected hereafter as discussed in Supplemental Material SI . Since the d/d signal is kept constant during the image acquisition, we then have at a given () position of the surface
| (2) |
In other words, Eq. (2) shows that it is possible in this way to directly measure the isodensity contours of the sample DOS at a given energy . We stress that the level of approximation employed here is the same generally used when discussing standard d/d maps.
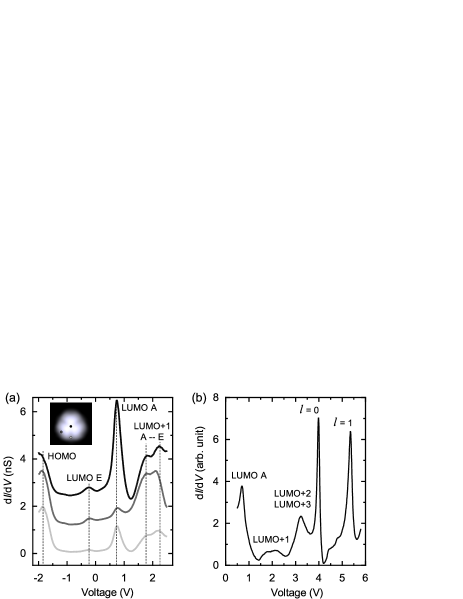
Next, to validate our imaging technique, we carry out a comparative study between standard d/d maps and iso-d/d maps by focusing our attention onto isolated C60 molecules on Cu(111). In the inset of Fig. 1a we present a standard STM image of a C60 where the characteristic threefold-symmetric shape of the molecule can be recognized, indicating that it is adsorbed with a hexagon oriented towards the tip Larsson2008 ; Heinrich2011 ; Shin2014 . The d/d spectra (Figs. 1a) acquired for different positions of the STM tip (dots in the STM image in the inset of Fig. 1a) reveal a variety of molecular resonances. Following Ref. Silien2004 , we identify the highest occupied molecular orbital (HOMO) and the two lowest unoccupied molecular orbitals (LUMO and LUMO+1). Because of the strong interaction with the Cu(111) substrate, the LUMO and LUMO+1 orbitals are split (A and E components). The spectrum in Fig. 1b reveals further resonances at higher energy. We assign the broad peak at V to the superposition of LUMO+2 and LUMO+3 states. The DFT calculations for the isolated, unstrained molecule reveal in fact that these states are separated by only 200 meV SI , which is below the lifetime broadening of the molecular states (meV). Additionally, two sharp resonances appear at V and V that correspond to superatomic = 0 and = 1 states Feng2008 , which can also be understood in the framework of whispering gallery modes Reecht2016 .
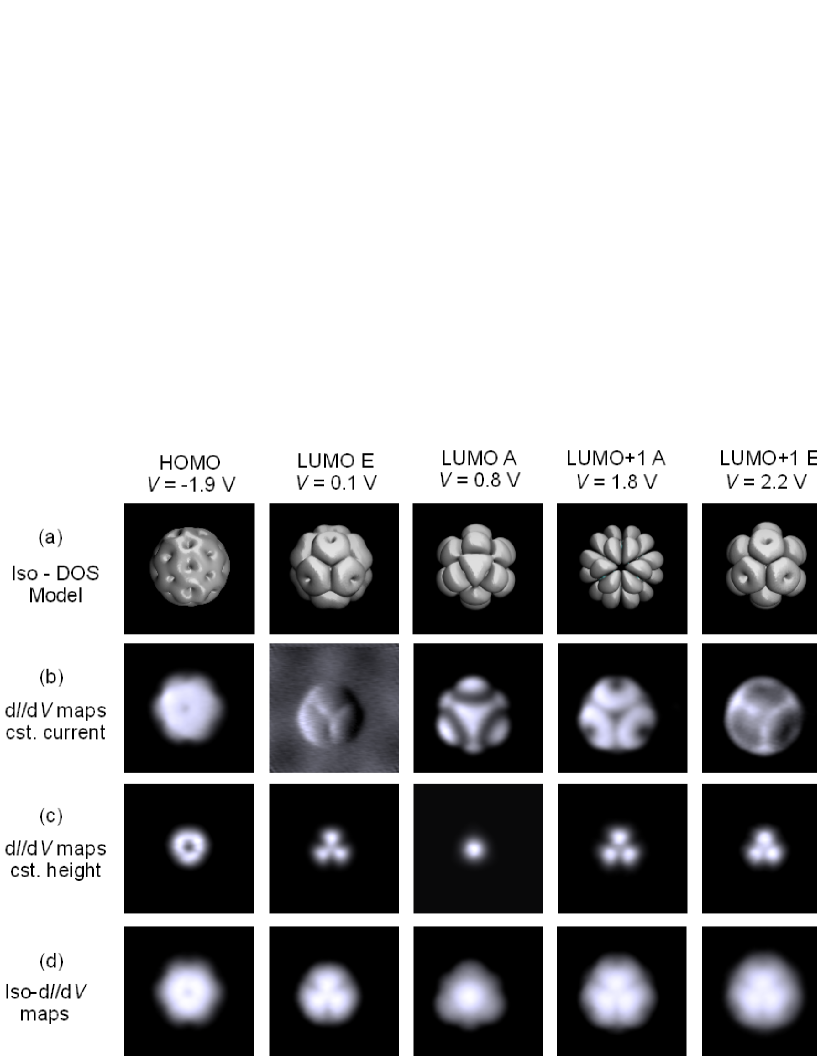
Knowing the molecular orbitals energies, we can now measure their spatial distribution. To start, we display in Fig. 2a the computed DOS isosurfaces for each molecular orbitals. These gas phase DFT calculations take into account the degeneracy lifting caused by the interaction with the surface SI . While the HOMO orbital does not split on the surface, the threefold degeneracy of the LUMO and of the LUMO+1 orbitals is partially lifted upon adsorption Lu2003 ; Silien2004 . Following simple symmetry arguments Hands2010 , we decomposed the computed LUMO and LUMO+1 orbitals into their A and E components. Finally, since the LUMO+2 and LUMO+3 orbitals cannot be distinguished in the d/d spectra, we consider only the sum over the LUMO+2 and LUMO+3 isosurfaces.
Experimentally, the spatial distributions of the above orbitals have been probed following three different approaches: with constant-current d/d maps (Fig. 2b), constant-height d/d maps (Fig. 2c), and iso-d/d maps (Fig. 2d). The agreement between these maps and the calculated DOS isosurfaces will be discuss separately. The constant-current d/d maps (Fig. 2b) agree well with the simulation for the HOMO, the LUMO A and the LUMO+1 A. At the energy of the LUMO E, the signal is very low and the pattern is asymmetric. For the E component of the LUMO+1, the constant-current d/d map reveals a pattern of inverted contrast compared to the calculation. This behavior, discussed in detail by Lu et al., is due to variations of the tip-sample distance during the data acquisition Lu2003 . Possible artifacts and the resulting inaccuracy of this method will be further discussed in the next section.
The d/d maps (Fig. 2c) recorded at a constant tip height respect the symmetry of the computed isosurfaces. However, the level of detail is reduced compared to the other approaches. More precisely, only the top part of the molecule is imaged. This is a direct consequence of the sphericity of C60 showing that, for a corrugated surface, constant-height measurements produce limited results.
In contrast, the iso-d/d maps in Fig. 2d provide a correct representation of the spatial variation of all states. Using this method, the STM tip directly follows the isosurface DOS of a molecular state. This largely facilitates the identification of the molecular orbitals and prevents possible misinterpretations. As an example, here we can clearly identify the LUMO A at V, an orbital whose assignement was always uncertain in previous measurements Silien2004 because of its similarity with the LUMO+1 E in constant-current d/d maps, and whose identification is not possible in constant-height maps where it only appears as a bright protrusion.
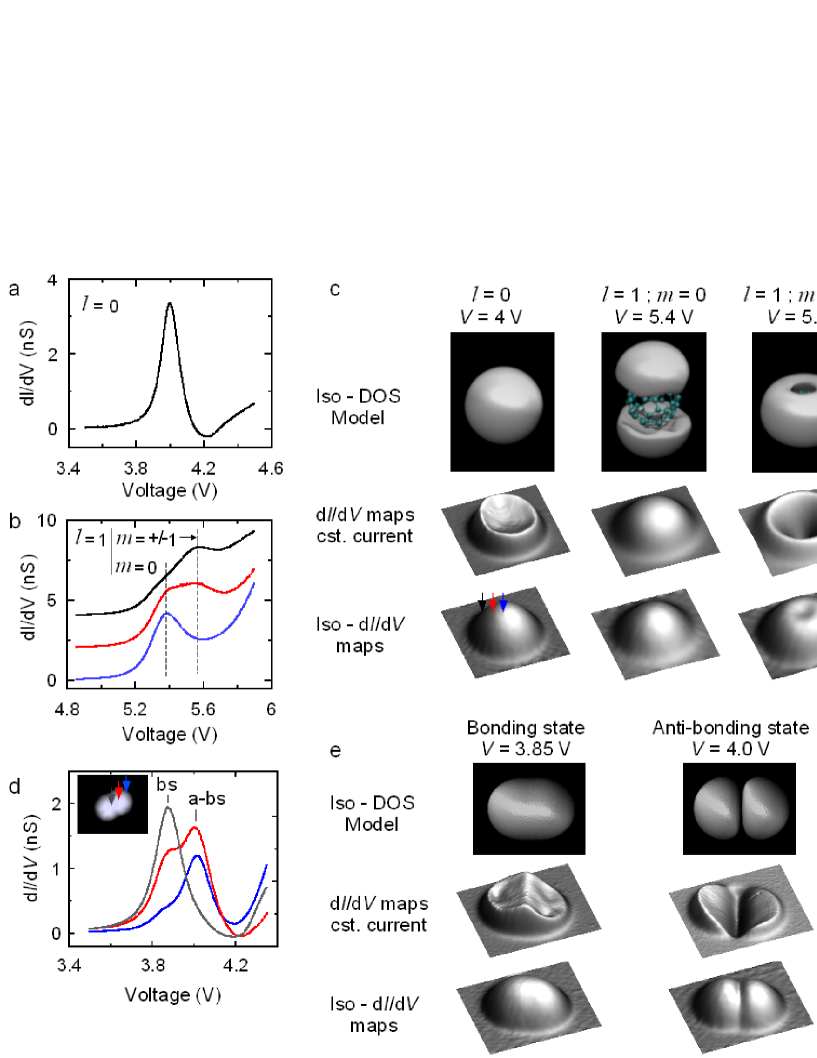
After this first proof of principle, we now use the iso-d/d maps to unveil the spatial distribution and composition of the resonances assigned to the = 0 and = 1 superatomic states. The corresponding d/d spectra of these states are displayed in Figs. 3a and 3b, respectively. The computed DOS isosurface for the = 0 state (Fig. 3c) reveals a uniform sphere corresponding to a state fully delocalized over the C60 cage. While the constant-current d/d map exhibits a hole-like structure that would suggest a hybridization between the = 0 and the = 1 orbitals Feng2008 , the iso-d/d map is instead in perfect agreement with the theoretical predictions.
The = 1 superatomic state is threefold degenerate () in vacuum, but the d/d spectra acquired at different positions above the molecule on copper (see arrows in Fig. 3c) reveal instead a split resonance for this state (Fig. 3b). This suggests that the interaction with the surface lifts the degeneracy among the states. Our DFT computations indicate that the state at V is associated to and the state at V to . In Fig. 3c, we present the d/d maps of these states along with their computed DOS isosurfaces. Again, it can be remarked that the iso-d/d maps are in good agreement with calculations. The constant-current d/d map, instead, unsatisfactorily reproduce the contribution: the ring diameter is too large, the signal fall-of towards the center steep, and the signal at the center of the molecule is lower than the signal on the substrate.
The discrepancy between constant-current and iso-d/d maps is even more striking for a C60 dimer (Figs. 3d and 3e). Here, the hybridization between the = 0 superatomic states of the molecules leads to a splitting of the orbital into a bonding state (bs) and an anti-bonding state (a-bs) (Figs. 3d). Contrary to constant-current d/d maps, the bounding and anti-bounding states can be readily visualized with iso-d/d maps, their pattern being self-explanatory and in perfect agreement with simulations.
To summarize, we presented a simple way to accurately map with STM the spatial variation of the DOS, which is well-suited for non-planar molecules and artificial nanostructures. Because the feedback loop is enabled during the data acquisition, our method is applicable to corrugated surfaces and in the presence of thermal drift. By imaging in this way individual C60 molecules on Cu(111) and comparing the results to DFT calculations, we could unambiguously identify the different resonances in the spectra, in particular the A component of the LUMO orbital. Furthermore, we were able to correctly visualize the spatial distribution of the superatomic states in the C60 monomer, as well as their hybridization in the dimer case. The iso-d/d maps are therefore an excellent error-free alternative to commonly DOS mapping techniques employed with STM.
We thank V. Speisser, J.-G. Faullumel and M. Romeo for technical support. The Agence National de la Recherche (Grant No. ANR-14-CE26-0016-01, ANR-15-CE09-0017, ANR-13-BS10-0016, ANR-10-LABX-0026 CSC, ANR-11-LABX-0058 NIE) and the International Center for Frontier Research in Chemistry are acknowledged for financial support. This work was performed using HPC resources from GENCI-IDRIS (Grant No. 2016097459). BWH gratefully acknowledges funding by the Deutsche Forschungsgemeinschaft through Grant HE7368/2.
References and Notes
- (1) J. A. Stroscio, R. M. Feenstra, and A. P. Fein, Phys. Rev. Lett. 57, 2579 (1986).
- (2) V.A. Ukraintsev, Phys. Rev. B 53, 11176 (1996).
- (3) C. Wagner, R. Franke, and T. Fritz, Phys. Rev. B 75, 235432 (2007).
- (4) B. Koslowski, C. Dietrich, A. Tschetschetkin, and P. Ziemann, Phys. Rev. B 75, 035421 (2007).
- (5) M. Passoni, F. Donati, A. Li Bassi, C. S. Casari, and C. E. Bottani, Phys. Rev. B 79, 045404 (2009).
- (6) Y. Hasegawa and P. Avouris, Phys. Rev. Lett. 71, 1071 (1993).
- (7) K. Wang, J. Zhao, S. Yang, L. Chen, Q. Li, B. Wang, S. Yang, J. Yang, J. G. Hou, and Q. Zhu, Phys. Rev. Lett. 91, 185504 (2003).
- (8) N. Nilius, T. Wallis, and W. Ho, Appl. Phys. A 80, 951 (2005).
- (9) R. Temirov, S. Soubatch, A. Luican, and F. Tautz, Nature 444, 350 (2006).
- (10) M. Feng, J. Zhao, and H. Petek, Science 320, 359 (2008).
- (11) G. Schull, N. Néel, M. Becker, J. Kröger and R. Berndt, New J. Phys. 10, 065012 (2008).
- (12) G. Schull, T. Frederiksen, M. Brandbyge and R. Berndt, Phys. Rev. Lett. 103, 206803 (2009).
- (13) W. Auwärter, K. Seufert, F. Klappenberger, J. Reichert, A. Weber-Bargioni, A. Verdini, D. Cvetko, M. Dell’Angela, L. Floreano, A. Cossaro, G. Bavdek, A. Morgante, A. P. Seitsonen, and J. V. Barth, Phys. Rev. B 81, 245403 (2010).
- (14) S. Müllegger, W. Schöfberger, M. Rashidi, T. Lengauer, F. Klappenberger, K. Diller, K. Kara, J. V. Barth, E. Rauls, W. G. Schmidt, et al., ACS Nano 5, 6480 (2011).
- (15) P. Ruffieux, J. Cai, N. C. Plumb, L. Patthey, D. Prezzi, A. Ferretti, E. Molinari, X. Feng, K. Müllen, C. A. Pignedoli, et al., ACS Nano 6, 6930 (2012).
- (16) S. Fahrendorf, N. Atodiresei, C. Besson, V. Caciuc, F. Matthes, S. Blügel, P. Kögerler, D. E. Bürgler, and C. M. Schneider, Nat. Commun. 4, 2425 (2013).
- (17) C. Nacci, F. Ample, D. Bleger, S. Hecht, C. Joachim, and L. Grill, Nat. Commun. 6, 8397 (2015).
- (18) V. D. Pham, V. Repain, C. Chacon, A. Bellec, Y. Girard, S. Rousset, A. Smogunov, Y. J. Dappe, and J. Lagoute, J. Phys. Chem. Lett. 7, 1416 (2016).
- (19) G. Hörmandinger, Phys. Rev. B 49, 13897 (1994).
- (20) J. Li, W.-D. Schneider, and R. Berndt, Phys. Rev. B 56, 7656 (1997).
- (21) M. Ziegler, N. Néel, A. Sperl, J. Kröger, and R. Berndt, Phys. Rev. B 80, 125402 (2009).
- (22) X. Lu, M. Grobis, K. H. Khoo, S. G. Louie, and M. F. Crommie, Phys. Rev. Lett. 90, 096802 (2003).
- (23) W. Krenner, D. Kühne, F. Klappenberger, and J. V. Barth, Sci. Rep. 3, 1454 (2013).
- (24) Y. Zhang, P. Liao, J. Kan, C. Yin, N. Li, J. Liu, Q. Chen, Y. Wang, W. Chen, G. Q. Xu, J. Jiang, R. Berndt, and K. Wu, Phys. Chem. Chem. Phys. 17, 27019 (2015).
- (25) B. W. Heinrich, C. Iacovita, T. Brumme, D.-J. Choi, L. Limot, M. V. Rastei, W. A. Hofer, J. Kortus, and J.-P. Bucher, J. Phys. Chem. Lett. 1, 1517 (2010).
- (26) G. Reecht, H. Bulou, F. Scheurer, V. Speisser, B. Carrière, F. Mathevet, and G. Schull, Phys. Rev. Lett. 110, 056802 (2013).
- (27) H. Söde, L. Talirz, O. Gröning, C. A. Pignedoli, R. Berger, X. Feng, K. Müllen, R. Fasel, and P. Ruffieux, Phys. Rev. B 91, 045429 (2015).
- (28) I. Horcas, R. Fernandez, J. M. Gomez-Rodriguez, J. Colchero, J. Gomez-Herrero, and A. M. Baro, Rev. Sci. Instr. 78, (2007).
- (29) See Supplemental Material at XX for a discussion of the validity of the approximations considered in the model and for details regarding the method used to compute the electron distribution of the fullerene molecule.
- (30) J. G. Simmons, J. Appl. Phys. 34, 1793 (1963).
- (31) J. A. Larsson, S. D. Elliott, J. C. Greer, J. Repp, G. Meyer, and R. Allenspach, Phys. Rev. B 77, 115434 (2008).
- (32) B. W. Heinrich, M. V. Rastei, D.-J. Choi, T. Frederiksen, and L. Limot, Phys. Rev. Lett. 107, 246801 (2011).
- (33) H. Shin, A. Schwarze, R.D. Diehl, K. Pussi, A. Colombier, E. Gaudry, J. Ledieu, G.M. McGuirk, L.N. Serkovic Loli, V. Fournee, L.-L. Wang, G. Schull and R. Berndt, Phys. Rev. B 89, 245428 (2014).
- (34) C. Silien, N. A. Pradhan, W. Ho, and P. A. Thiry, Phys. Rev. B 69, 115434 (2004).
- (35) G. Reecht, H. Bulou, G. Schull, and F. Scheurer, J. Phys. Condens. Matter. 28, 165001 (2016).
- (36) I. D. Hands, J. L. Dunn, and C. A. Bates, Phys. Rev. B 81, 205440 (2010).