44email: cazorla@astro.ulg.ac.be
Chemical abundances of fast-rotating massive stars ††thanks: Based on observations obtained with the Heidelberg Extended Range Optical Spectrograph (HEROS) at the Telescopio Internacional de Guanajuato (TIGRE) with the SOPHIE échelle spectrograph at the Haute-Provence Observatory (OHP; Institut Pytheas; CNRS, France), and with the Magellan Inamori Kyocera Echelle (MIKE) spectrograph at the Magellan II Clay telescope. Based also on archival data from the Galactic O-Star Spectroscopic Survey (GOSSS), the Anglo-Australian Telescope (AAT) equipped with the University College London Echelle Spectrograph (UCLES), the ESO/La Silla Observatory with the Fiber-fed Extended Range Optical Spectrograph (FEROS; programmes 70.D-0110, 075.D-0061, 076.C-0431, 081.D-2008, 083.D-0589, 086.D-0997, 087.D-0946, 089.D-0189, 089.D-0975, 179.C-0197, and the High Accuracy Radial velocity Planet Searcher (HARPS; programme 60.A-9036), the Pic du Midi Observatory equipped with the NARVAL spectropolarimeter, the San Pedro Mártir (SPM) observatory with the Echelle SPectrograph for Rocky Exoplanet and Stable Spectroscopic Observations (ESPRESSO), the OHP with the AURELIE and ELODIE échelle spectrographs, the Nordic Optical Telescope (NOT) with the FIbre-fed Echelle Spectrograph (FIES), the Canada-France-Hawaii Telescope (CFHT), with the Echelle SpectroPolarimetric Device for the Observation of Stars (ESPaDOnS) spectrograph, the Leonhard Euler Telescope with the CORALIE spectrograph.,††thanks: Table 3 is available in electronic form at the CDS via anonymous ftp to cdsarc.u-strasbg.fr (130.79.128.5) or via http://cdsweb.u-strasbg.fr/cgi-bin/qcat?J/A+A/
Abstract
Aims. Recent observations have challenged our understanding of rotational mixing in massive stars by revealing a population of fast-rotating objects with apparently normal surface nitrogen abundances. However, several questions have arisen because of a number of issues, which have rendered a reinvestigation necessary; these issues include the presence of numerous upper limits for the nitrogen abundance, unknown multiplicity status, and a mix of stars with different physical properties, such as their mass and evolutionary state, which are known to control the amount of rotational mixing.
Methods. We have carefully selected a large sample of bright, fast-rotating early-type stars of our Galaxy (40 objects with spectral types between B0.5 and O4). Their high-quality, high-resolution optical spectra were then analysed with the stellar atmosphere modelling codes DETAIL/SURFACE or CMFGEN, depending on the temperature of the target. Several internal and external checks were performed to validate our methods; notably, we compared our results with literature data for some well-known objects, studied the effect of gravity darkening, or confronted the results provided by the two codes for stars amenable to both analyses. Furthermore, we studied the radial velocities of the stars to assess their binarity.
Results. This first part of our study presents our methods and provides the derived stellar parameters, He, CNO abundances, and the multiplicity status of every star of the sample. It is the first time that He and CNO abundances of such a large number of Galactic massive fast rotators are determined in a homogeneous way.
Key Words.:
Stars: abundances – Stars: early-type – Stars: fundamental parameters – Stars: massive – Stars: rotation1 Introduction
Massive stars are defined as objects born with O or early B spectral types (subsequently evolving to later types during their life) and by their death as a supernova (thus having initial masses larger than 8 M⊙). These OB stars are the true cosmic engines of our Universe. They emit an intense ionising radiation and eject large quantities of material throughout their life, shaping the interstellar medium, affecting star formation, and largely contributing to the chemical enrichment of their surroundings. It is therefore of utmost importance to develop a good understanding of the physical processes at play in these objects and to properly model their evolution.
One important feature of massive stars is their high rotational velocities, which can be up to at least 400 km s-1 (Howarth et al. 1997; Dufton et al. 2011). Such a fast rotation can be produced by several mechanisms: it can be acquired at birth as a result of their formation or develop subsequently during their evolution as they interact with a companion (through tidal forces, mass accretion, or even merging; Zahn, 1975; Hut, 1981; Packet, 1981; Pols et al., 1991; Podsiadlowski et al., 1992; Langer et al., 2003; Petrovic et al., 2005a, b; de Mink et al., 2009, 2013; Dervişoǧlu et al., 2010; Tylenda et al., 2011; Song et al., 2013).
Despite the rotational velocity of OB stars, which can amount to a significant fraction of the critical (break up) velocity111The critical velocity of a star is reached when the centrifugal acceleration is equal to the gravitational one at the equator., rotation had been considered for a long time as a minor ingredient of stellar evolution until some important discrepancies between model predictions and observations were brought to light (e.g. Maeder, 1995). The importance of rotation on the evolution of massive stars is now considered to be comparable to that of stellar winds (Meynet & Maeder, 2000), influencing all aspects of stellar evolution models (Maeder & Meynet, 2015). For example, rotation increases the main-sequence (MS) lifetime by bringing fresh combustibles to the core. It also modifies the stellar temperature, thus the radiative flux.
Rotation also triggers the transport of angular momentum and chemicals in the interior (Maeder & Meynet, 1996). This can notably lead to a modification of the wind properties and to changes in the chemical abundances seen at the stellar surface. In this context, it might be useful to recall that massive stars burn their central hydrogen content through the CNO cycle, which can be partial or complete depending on the temperature. For stars whose mass does not exceed 40 M⊙, the abundance can be considered constant and that of depleted in the core. For more massive stars, the constancy applies to the abundance, while the core is depleted in . In all cases, the slow reaction rate of leads to an excess of nitrogen nuclei in the core. These elements may then be dredged up to the stellar surface, but the actual amount transported depends on the mixing efficiency, which is primarily a function of the rotation rate. Because it is the most affected, the nitrogen abundance at the stellar surface is considered the best indicator of rotational mixing (along with boron, but UV spectra are needed to study the abundance of this latter element; Proffitt & Quigley 2001). In contrast, slow rotation is expected in principle not to lead to any detectable nitrogen enrichment during the main-sequence phase, at least for stars in the mass range 5–60 M⊙ (Maeder et al., 2014).
However, recent observations of B stars in the Galaxy and the Magellanic Clouds (MCs) in the framework of the VLT-FLAMES Survey of Massive Stars (Evans et al., 2008) have revealed two stellar populations that exhibit surface nitrogen abundances not predicted by single-star evolutionary models incorporating rotational mixing (Hunter et al., 2007, 2009). For instance, in the LMC, the first population (15% of the sample) is composed of slow rotators that unexpectedly exhibit an excess of nitrogen, while stars of the second group (also 15% of the sample) are fast rotators with up to 330 km s-1 showing no strong nitrogen enrichment at their surface, if any (Brott et al., 2011b). Additional examples of the former category have been found amongst O stars in the LMC (Rivero González et al., 2012a, b; Grin et al., 2016). The origin of this population is a matter of speculation, but has been proposed to result from the action of magnetic fields (Meynet et al. 2011, Potter et al. 2012). On the other hand, it is conceivable that stars in the second group are binaries that have undergone an episode of highly non-conservative mass transfer, with transport of angular momentum, but little transfer of CNO-processed material (see Langer et al. 2008).
A clear interpretation of these observations is, however, hampered by the limited quality of the abundance determinations. The reported nitrogen abundance of the fast rotators frequently are upper limits and information is unavailable or uncertain for other key elements, such as helium or carbon (e.g. Hunter et al. 2009 in the case of carbon). Furthermore, Maeder et al. (2009) pointed out the different evolutionary stages (on and away from the main sequence) and the large range of masses (from 10 to 30 M⊙) of the stars studied in the VLT-FLAMES Survey. These authors found a better agreement with model predictions after the sample was split into groups of stars with similar properties (but see Brott et al. 2011b, who addressed this issue through population synthesis). Maeder et al. (2014) also questioned some results obtained by Hunter et al. (2007, 2009) based on a reanalysis of their data. Finally, Bouret et al. (2013) and Martins et al. (2015a) argued that the CNO abundances of most O stars in their studies are compatible with the expectations from single-star evolutionary models, although their samples only contain few fast rotators. The observed efficiency of rotational mixing thus appears unclear, and more data is required to make progress.
2 Rationale of our study
Up to now, only a few comprehensive investigations of the metal content of fast-rotating, Galactic OB stars have been undertaken. HD 191423 (ON9 II-IIIn, Sota et al. 2011; sin 420 km s-1) has been studied by Villamariz et al. (2002), Mahy et al. (2015), and Martins et al. (2015a). HD 149757 ( Oph; O9.2 IVnn, Sota et al. 2011; sin 378 km s-1) has been studied by Villamariz & Herrero (2005). In addition, the CNO abundances of two O-type supergiants, two O dwarfs, five additional O giants, and four other O-stars with sin km s-1 have been derived by Bouret et al. (2012), Martins et al. (2012b), Martins et al. (2015b), and Martins et al. (2015a), respectively. The small number of high-resolution studies combined with the heterogeneity of the analyses has motivated us to undertake an in-depth study of bright OB stars with high rotational velocities.
The stars in our sample span a limited range in rotational velocities and evolutionary status (as they are all core-hydrogen burning stars). This restricts the number of parameters potentially affecting the abundances and allows us to more easily interpret our results. Enhancement of the surface nitrogen abundance (and accompanying carbon depletion) arising from rotational mixing is expected to be more subtle at Galactic metallicities than in the MCs. However, the detailed study of fast rotators in the MCs (with typically mV 13 mag) would be a major observational undertaking (see Grin et al. 2016). In contrast, focussing on nearby stars permits a detailed abundance study with only a modest investment of telescope time. As we show below, a large body of spectroscopic data is even already available in public archives.
For all stars, we have self-consistently determined the stellar properties from high-resolution spectra: effective temperature, , surface gravity, , projected rotational velocity, sin , macroturbulence, , as well as He and CNO abundances. An interaction with a companion may dramatically affect the evolution of the rotational and chemical properties of stars in binary systems. However, little is known about the binary status of the fast rotators previously studied in the literature. Therefore, another important aspect of our analysis is the determination of the multiplicity as a result of a radial-velocity (RV) study of our targets. To reinforce the point made above, such an investigation for the faint MC targets is also too demanding in terms of observing resources.
The results of our spectroscopic study of fast rotators are presented in two parts. This first paper describes the methods that have been used and the numerous checks performed to ensure the quality of the results. It also presents the results obtained for each star, while a follow-up paper (Paper II; Cazorla et al. 2007) will focus on the global interpretation of these results.
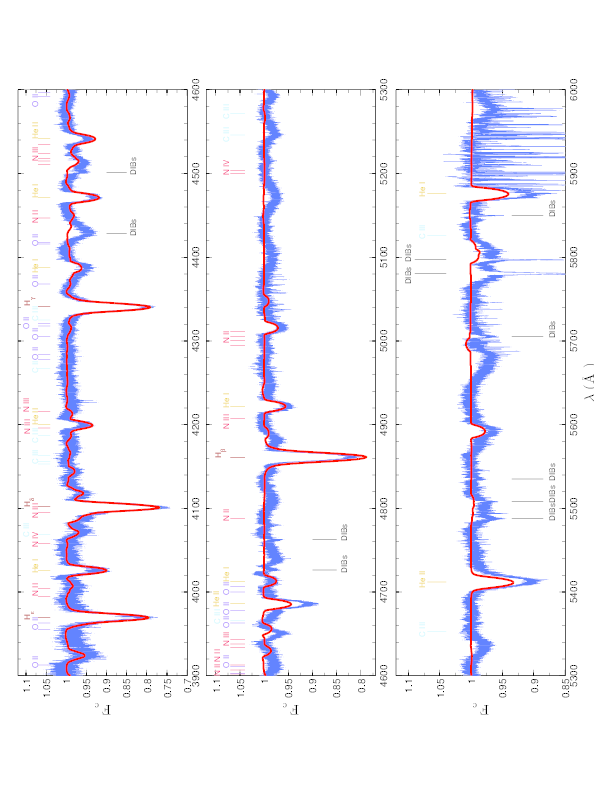
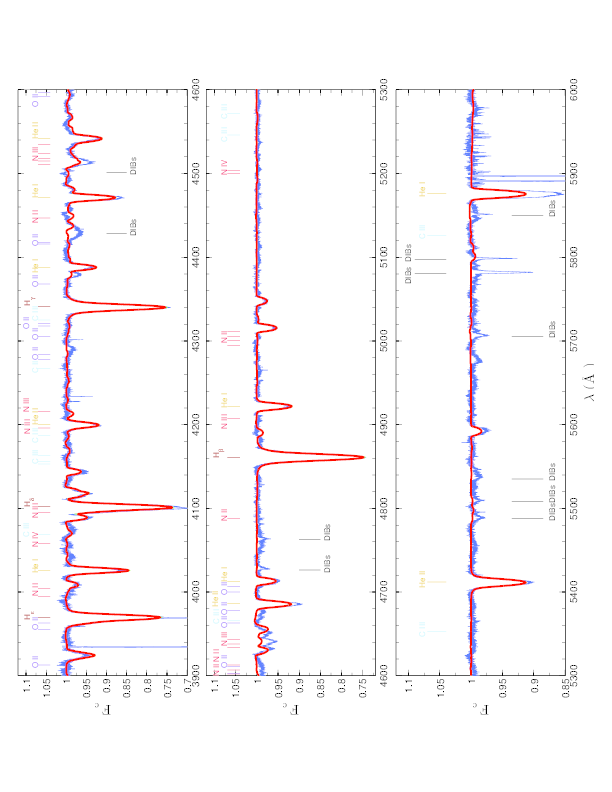
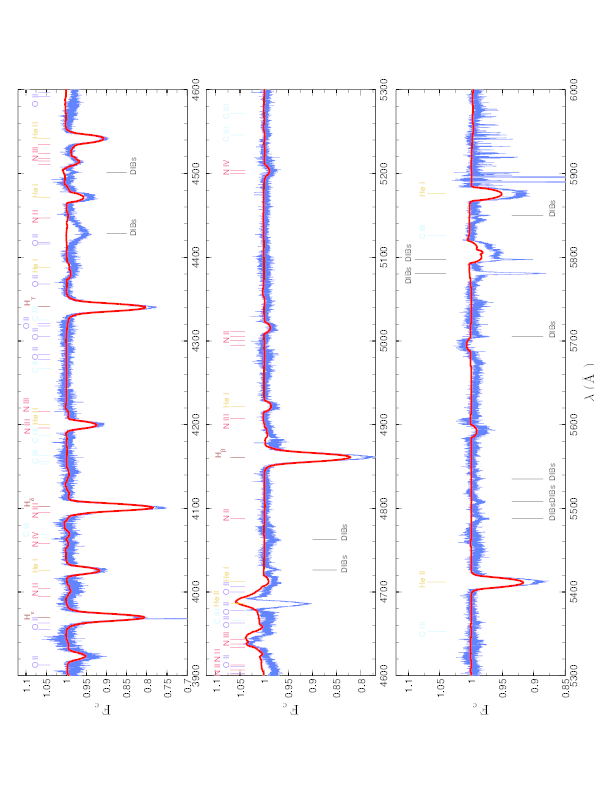
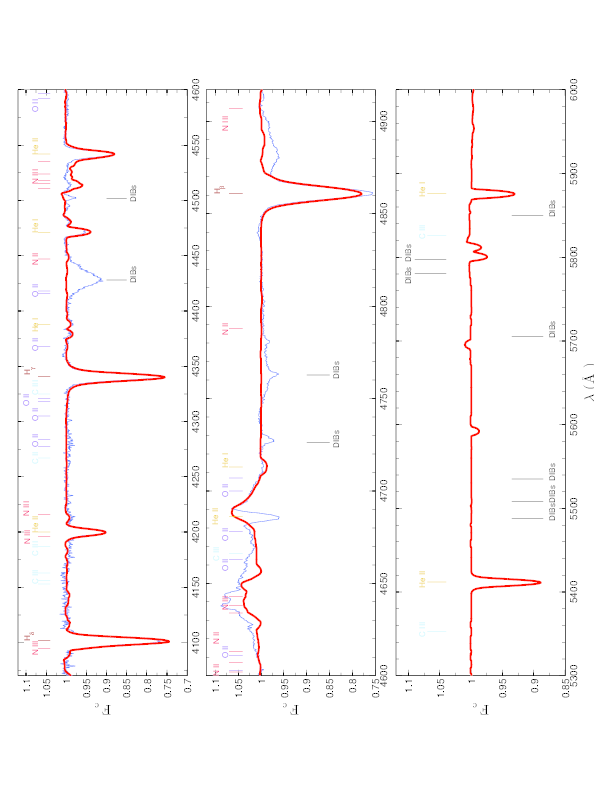
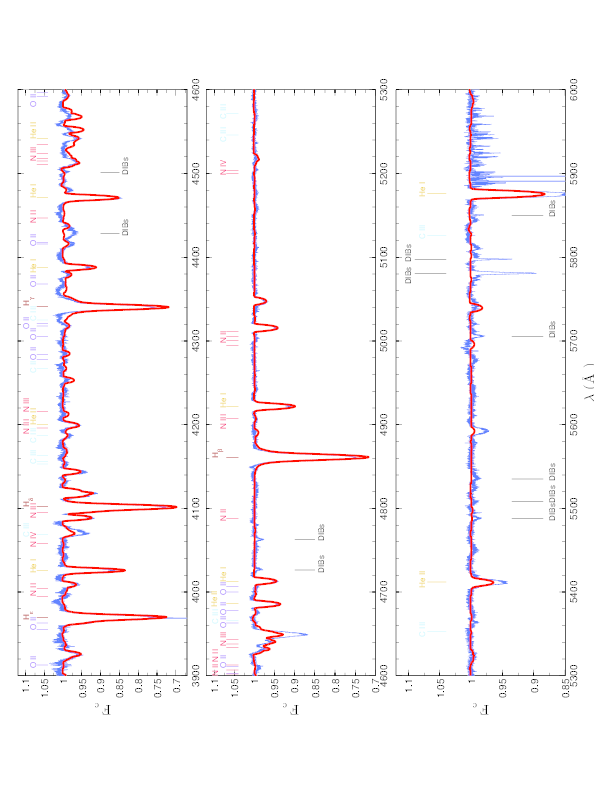
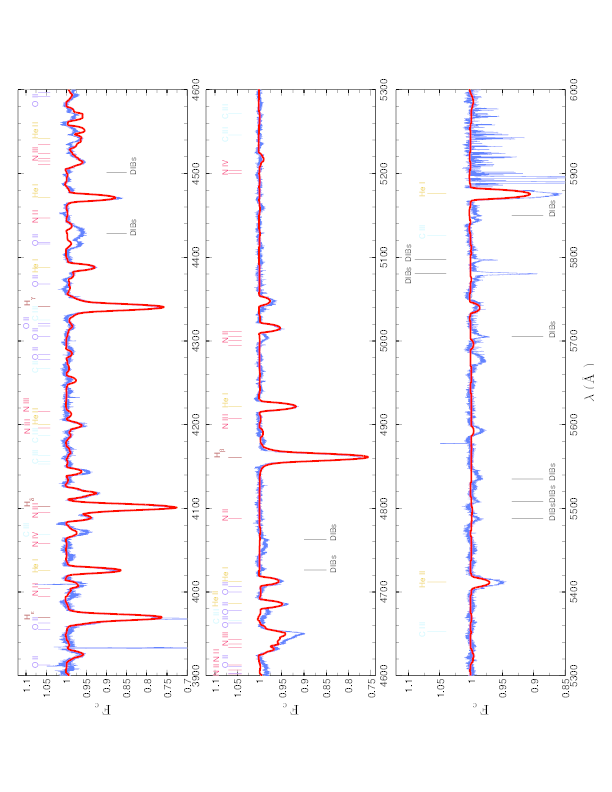
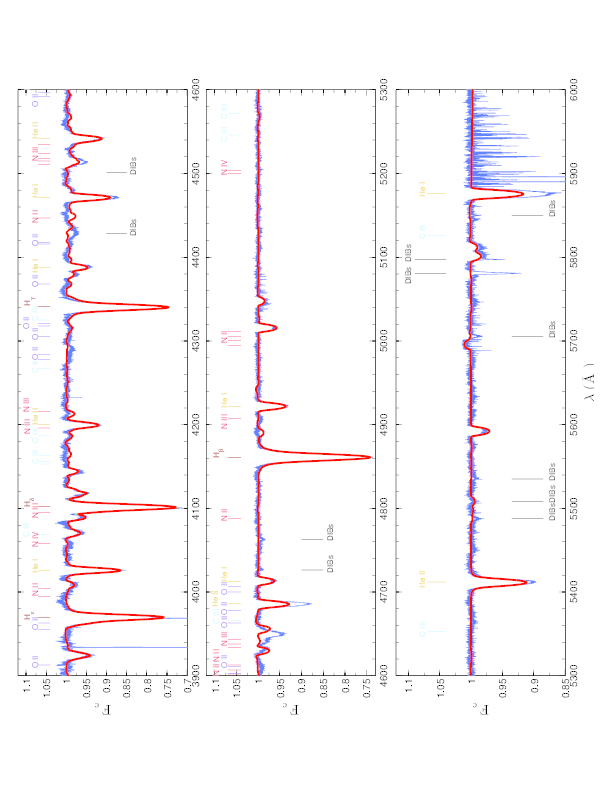
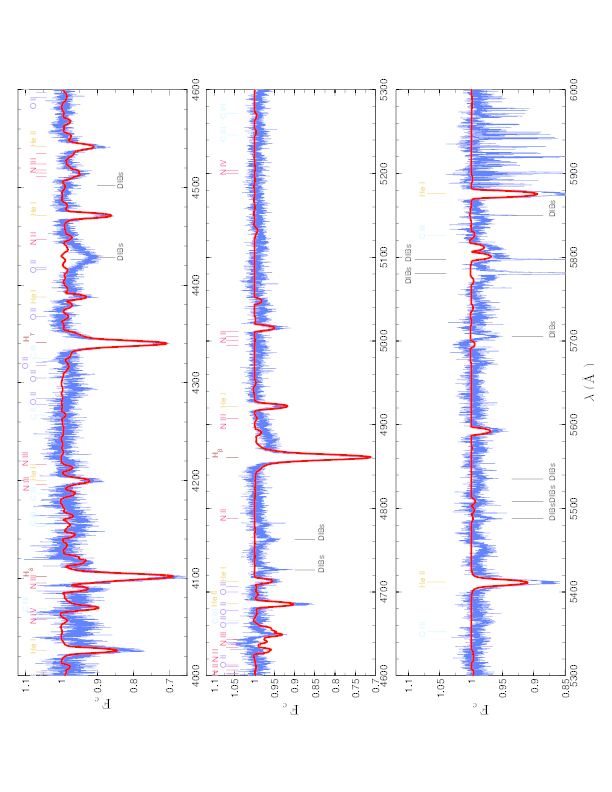
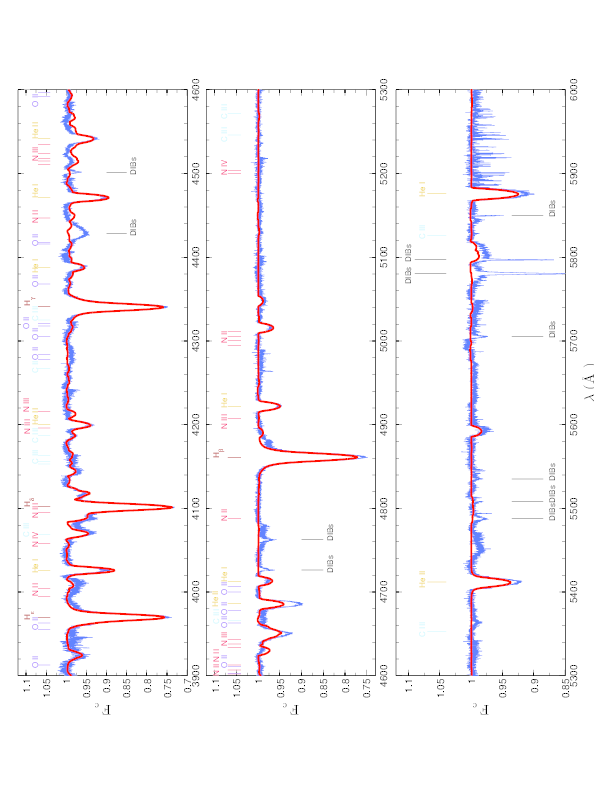
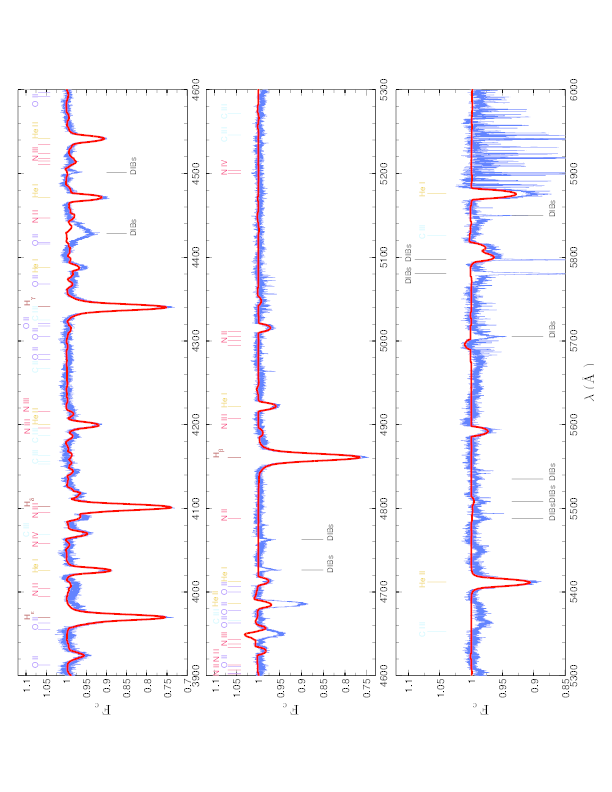
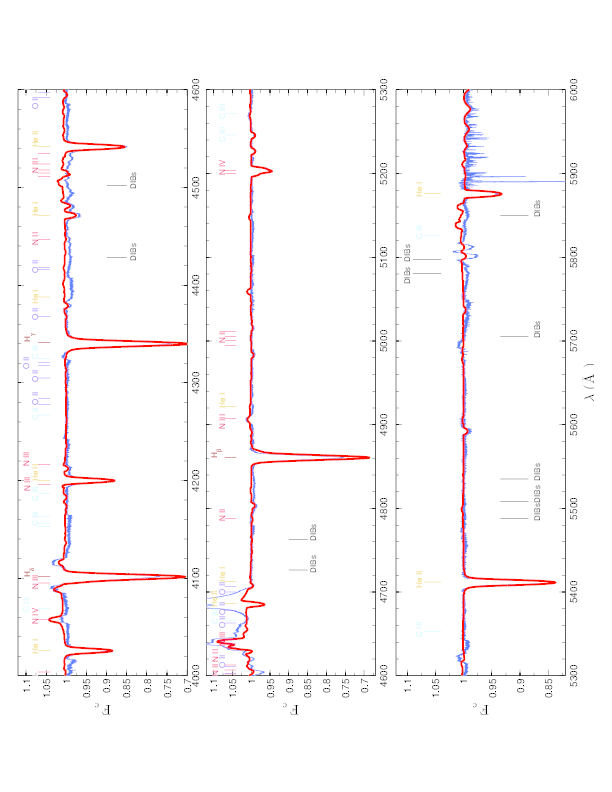
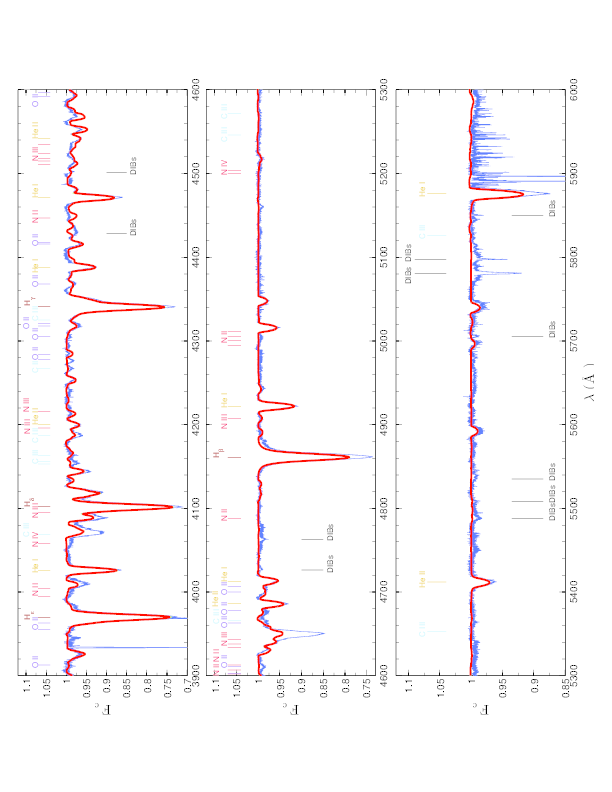
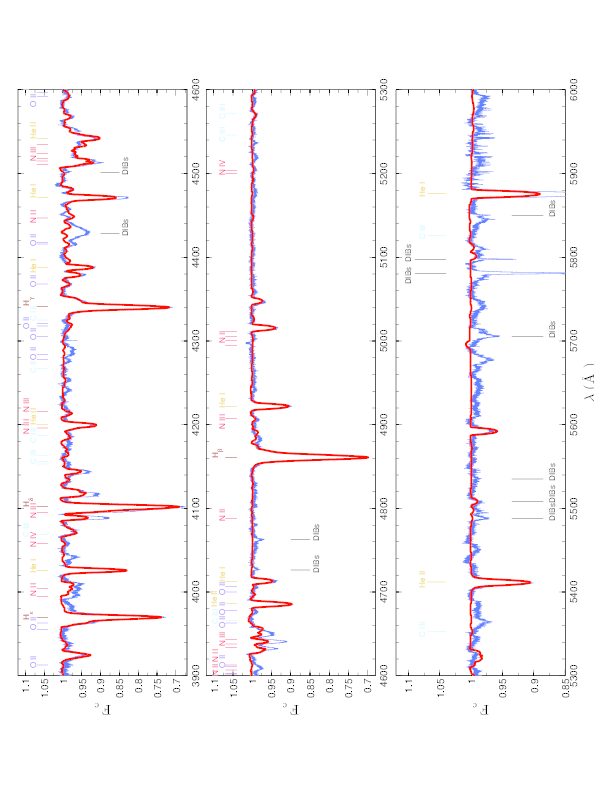
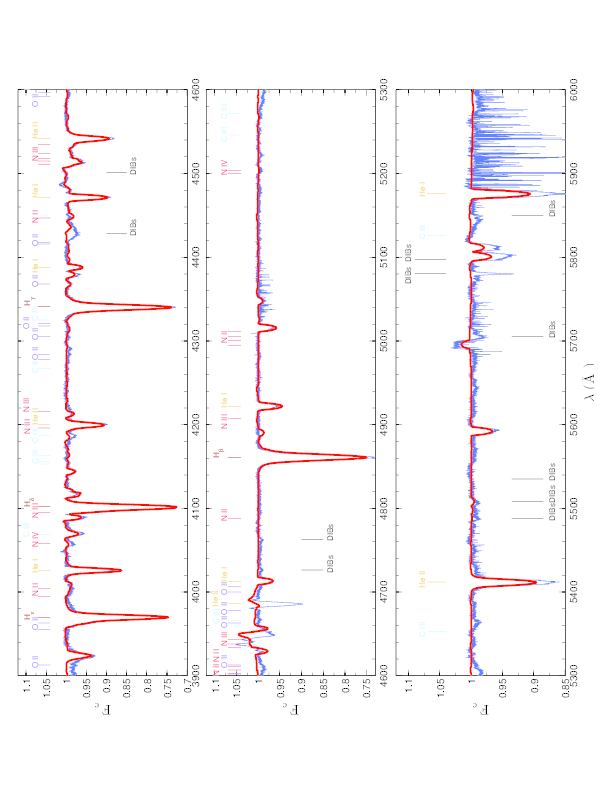
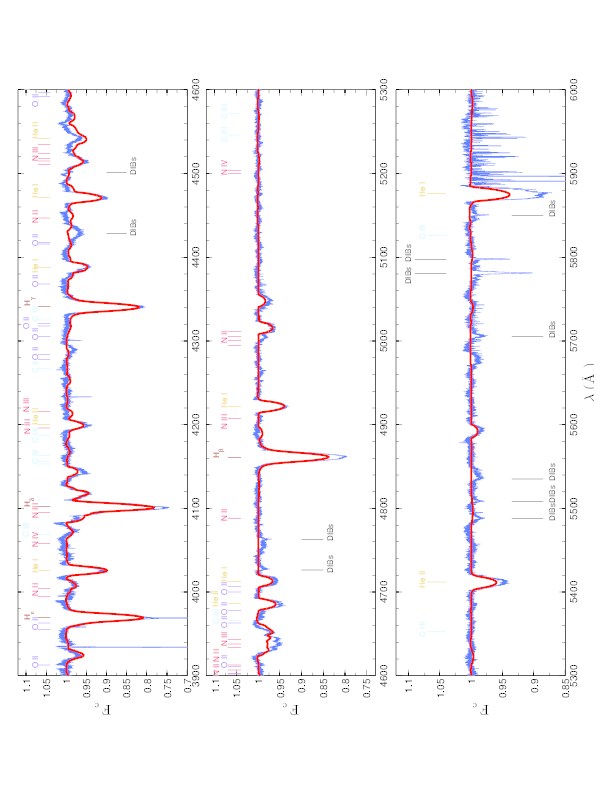
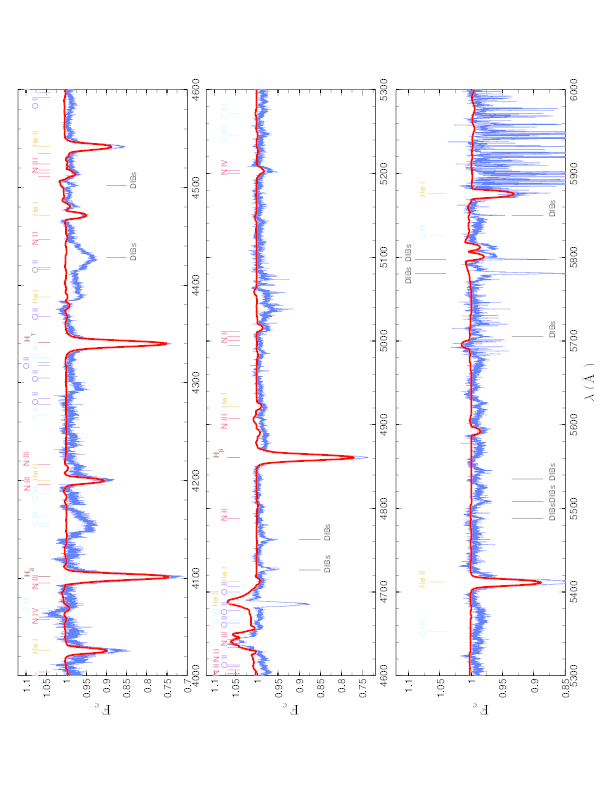
This paper is organised as follows. The sample, observations, and data reduction are outlined in Sect. 3; the spectroscopic analysis is described in Sect. 4; uncertainties in the derived physical parameters and abundances are discussed in Sect. 5; several checks of our methods are presented in Sect. 6; and conclusions are given in Sect. 7. Finally, Appendices A and B provide some individual information in tabular format, while notes on the binary and runaway status of individual stars are given in Appendix C, Appendix D compares our results to those in the literature and Appendix E provides a comparison between the observations of the hotter stars and their best-fit CMFGEN models.
3 Sample, observations, and data reduction
Our sample is composed of Galactic OB stars that have a projected rotational velocity exceeding 200 km s-1 ; the vast majority have mV 10 to ensure good quality spectra. This is further separated into two subsamples.
The first subsample comprises dwarfs and (sub)giants with spectral types between B0.5 and O9. The constraints on the spectral type and luminosity class arise from the applicability domain of our first analysis tool, DETAIL/SURFACE, which is only suitable for stars with weak winds. In addition, He II features must be present, which excludes cooler objects. The second subsample contains hotter stars with spectral types up to O4, which were studied with CMFGEN, as this code can treat stars with extended atmospheres. For the sake of homogeneity, it would have been relevant to analyse the whole sample with CMFGEN. However, it is intractable in practice because of the time-consuming nature of the CMFGEN analysis. To demonstrate the validity of our approach, in Sect. 6.3 we compare the results provided by the two codes for a few representative cases and show that they are consistent.
We excluded double-lined spectroscopic binaries because a correct extraction of each spectral component through disentangling techniques is very difficult when spectral lines are heavily broadened. Besides, it requires a large number of spectra with a good phase coverage, which are often not available. We also excluded classical Oe and Be stars because circumstellar discs cannot be modelled with the chosen tools. The weak H emission observed in a few stars rather originates from a stellar outflow (e.g. HD 184915; Rivinius et al. 2013). In addition, we also avoided confirmed Cephei stars (Stankov & Handler, 2005) for which revealing binarity can be challenging because of line-profile variations arising from pulsations. Furthermore, this peculiarity makes the atmospheric parameter and abundance determinations difficult.
We ended up with 40 targets (Table 1) that fulfilled the aforementioned criteria. While this sample of massive Galactic fast rotators is certainly not complete, it does represent a very large portion of those known in the solar vicinity. For example, SIMBAD lists only 50 stars with spectral type earlier than B0.5, m 13, and 200 km s-1, while Howarth et al. (1997) list 32 O-type stars with 200 km s-1 but it has to be noted that these catalogues include SB2 systems, Oe/Be stars, and pulsating stars that were discarded from our sample.
Part of the high-resolution spectra were obtained through our dedicated programmes on the following échelle spectrographs:
-
•
The CORALIE spectrograph mounted on the 1.2 m EULER Swiss telescope located at the ESO La Silla Observatory (Chile). CORALIE has the same optical design as ELODIE (Baranne et al., 1996). All the steps of the reduction were carried out with the dedicated pipeline called DRS. The spectra cover the wavelength range 3870–6890 with a resolving power, , of 60 000.
-
•
The HEROS spectrograph mounted on the 1.2 m TIGRE telescope at La Luz Observatory (Mexico; Schmitt et al., 2014). The spectral domain covered by HEROS spans from 3500 to 5600 and from 5800 to 8800 (blue and red channels, respectively) for . The spectra were automatically reduced with an Interactive Data Language (IDL) pipeline based on the reduction package REDUCE written by Piskunov & Valenti (2002).
-
•
The MIKE spectrograph mounted on the 6.5 m Magellan II Clay telescope located at the Las Campanas Observatory (LCO; Chile). MIKE is a double échelle spectrograph yielding blue (3350–5000 ) and red (4900–9500 ) spectra simultaneously. In the blue part, 53 000. The spectral reduction was carried out using the Carnegie Observatories python pipeline222http://obs.carnegiescience.edu/Code/mike (Bragança et al., 2012; Garmany et al., 2015).
-
•
The SOPHIE spectrograph at the 1.93 m telescope at Observatoire de Haute-Provence (OHP; France). The spectra cover the wavelength range 3872–6943 with (high-efficiency mode). The data were processed by the SOPHIE fully automatic data reduction pipeline. As a check, we reduced the raw data using standard IRAF333http://iraf.noao.edu routines, but found negligible differences with respect to the pipeline products.
The rest of the data were collected from several archives (unless otherwise noted, the spectra were reduced with the instrument pipeline):
-
•
The AURELIE spectrograph mounted on the 1.52 m telescope at OHP (Gillet et al., 1994). The spectra have 9 000 and either cover the wavelength range 4100–4950 (see De Becker & Rauw 2004) or 4450–4900 (see Mahy et al., 2013). The data reduction procedure is described in Rauw et al. (2003) and Rauw & De Becker (2004). Other reduced AURELIE data were retrieved from the Information Bulletin on Variable Stars (IBVS; De Becker et al. 2008)444http://ibvs.konkoly.hu/cgi-bin/IBVSetable?5841-t1.tex.
-
•
The ELODIE échelle spectrograph mounted on the 1.93 m telescope at OHP, which was operational from 1993 to 2006 (Baranne et al., 1996). This instrument555http://atlas.obs-hp.fr/elodie/ covers the spectral range from 3850 to 6800 and has .
-
•
The ESPaDOnS échelle spectrograph mounted on the Canada-France-Hawaii Telescope (CFHT) on Mauna Kea. Spectra were retrieved from the Canadian Astronomy Data Centre666http://www.cadc-ccda.hia-iha.nrc-cnrc.gc.ca and cover the wavelength range 3700–10500 with in “object only” spectroscopic mode.
-
•
The ESPRESSO échelle spectrograph mounted on the 2.12 m telescope at Observatory Astronómico Nacional of San Pedro Mártir (SPM; Mexico). The spectra cover the wavelength domain 3780–6950 with 18 000 (Mahy et al., 2013). The data reduction was completed using the échelle package included in the ESO-MIDAS software777http://www.eso.org/sci/software/esomidas/, as carried out by Mahy et al. (2013).
-
•
The FEROS échelle spectrograph mounted on the 2.2 m telescope at La Silla. The ESO archives provide already reduced data for most of the sample but, when this was not the case, we reduced the raw data with the standard dedicated ESO pipeline (except for the HD 52266 data taken in 2011 for which J. Pritchard’s personal pipeline888http://www.eso.org/~jpritcha/jFEROS-DRS/index.html was used). The FEROS spectrograph covers the spectral domain from 3500 to 9200 and provides spectra with .
-
•
The FIES échelle spectrograph at the 2.5 m Nordic Optical Telescope (NOT) located at the Observatorio del Roque de los Muchachos (La Palma, Spain). This spectrograph covers the spectral range 3700–7300 with (in medium-resolution mode) or 25 000 (in low-resolution mode). FIES data were reduced with the dedicated reduction software FIEStool999http://www.not.iac.es/instruments/fies/fiestool.
-
•
The Galactic O-Star Spectroscopic Survey (GOSSS). The normalised spectra were retrieved from the GOSSS database101010http://ssg.iaa.es/en/content/galactic-o-star-catalog/ (Maíz Apellániz et al., 2011). These spectra come from two facilities: the 1.5 m telescope at Observatorio de Sierra Nevada (OSN; Loma de Dilar, Spain) with the Albireo spectrograph (spectral range coverage: 3740–5090 ) and the 2.5 m du Pont telescope at LCO with the Boller & Chivens spectrograph (spectral range coverage: 3900–5510 ). Because the spectral resolution of both instruments () is much lower than that of the other spectrographs used in this work, GOSSS spectra were only used for the RV study (see Sect. 4.1).
-
•
The HARPS échelle spectrograph mounted on the 3.6 m telescope at La Silla. The spectrograph covers the spectral range 3780–6910 with .
-
•
The NARVAL spectropolarimeter mounted on the 2 m Telescope Bernard Lyot (TBL). NARVAL covers the wavelength range 3700–10 500 with in “object only” mode. Spectra were retrieved from the PolarBase database111111http://polarbase.irap.omp.eu.
-
•
The UCLES échelle spectrograph mounted on the 3.9 m Anglo-Australian Telescope (AAT; Siding Spring Observatory, Australia). UCLES covers the wavelength range 4340–6810 with a resolving power of at least 40 000, depending on the slit width. The raw data121212http://site.aao.gov.au/arc-bin/wdb/aat_database/user/query were reduced in a standard way with the IRAF échelle package.
Some spectra extracted from the archives were already normalised and, in that case, we simply checked that the normalisation was satisfactory. Otherwise, the spectra were normalised within IRAF using low-order polynomials in selected continuum windows. These “clean” windows were identified after a SOPHIE spectrum of the slow rotator 10 Lac (O9 V) was broadened131313This broadening was performed by the ROTIN3 programme that is part of the SYNSPEC routines; http://nova.astro.umd.edu/Synspec43/synspec.html with the sin value corresponding to each target.
All spectra were considered for the RV study. However, only a limited number were used to derive the parameters and abundances. The choice was based on several criteria (spectral resolution, wavelength coverage, S/N). Further details on this point can be found in Sect. 4.1.
4 Spectroscopic analysis
4.1 Radial velocities and binary analysis
For each stellar spectrum, the first step of our analysis was to determine the radial velocity with a cross-correlation technique available in the IRAF package RVSAO141414http://tdc-www.harvard.edu/iraf/rvsao (Kurtz & Mink, 1998). The closest TLUSTY synthetic spectrum (BSTAR06 and OSTAR02 grids; Lanz & Hubeny, 2003, 2007) for each star was determined by a analysis and used as template. The correlation was performed only in the wavelength range from about 4350 to 4730 . This region was chosen because of the relatively large number of spectral features (mostly helium lines), the absence of Balmer lines (which may be affected by emissions linked to stellar winds and colliding wind effects in binaries), and the fact that it was covered by all the spectrographs used in this work. Undesirable features (e.g. diffuse interstellar bands) were masked out. Table 10 provides the RVs measured for each spectrum alongside the observation date.
To get the best quality data for the determination of physical parameters, we then corrected the individual spectra for their radial velocity and, when necessary, averaged on an instrument-by-instrument basis with a weight depending on the signal-to-noise ratio. These spectra, which were subsequently used for the stellar parameters determination, are identified in boldface in Table 10.
To establish whether the measured RVs are variable or not, we adopt a criterion inspired by that of Sana et al. (2013): the maximum RV difference larger than 4 and above a given threshold (20 km s-1 as appropriate for O stars). The multiplicity status of our targets depends on the outcome of this test. If the differences are not significant, then the star is presumably considered to be single; otherwise the star is considered a RV variable (and thus a probable binary). Among the latter category, we further classify as SB1 those for which a full orbital solution can be calculated (see below). For some targets, additional information is available in the literature and the multiplicity status may then be revisited (see Appendix C for details).
Finally, when there were at least 15 RV measurements, including all available literature values (even if their error is unknown), we also analysed the RV datasets using the following period search algorithms: (1) the Fourier algorithm adapted to sparse/uneven datasets (Heck et al., 1985; Gosset et al., 2001; Zechmeister & Kürster, 2009); (2) two different string length methods (Lafler & Kinman, 1965; Renson, 1978); (3) three binned analyses of variances (Whittaker & Robinson 1944; Jurkevich 1971, which is identical, with no bin overlap, to the “pdm” method of Stellingwerf 1978; and Cuypers 1987, which is identical to the “AOV” method of Schwarzenberg-Czerny 1989); and (4) conditional entropy (Cincotta et al., 1999; Cincotta, 1999, see also Graham et al. 2013). Although the most trustworthy technique is the Fourier method, a reliable detection is guaranteed by the repeated recovery of the same signal with different methods. When a potential period was identified, an orbital solution was then calculated using the Liège Orbital Solution Package (LOSP; see Sana, 2013). The results of these variability tests and period searches are presented in Appendix C for each star.
4.2 Rotational velocities
The second step of our analysis was to derive the projected rotational velocity through Fourier techniques (Gray, 2005; Simón-Díaz & Herrero, 2007). In the Fourier space, the rotational broadening indeed expresses itself through a simple multiplication with the Fourier transform of the line profiles, hence providing a direct estimate of . We considered as many lines as possible (notably He I 4026, 4471, 4713, 4922, 5016, 5048, 5876, 6678; He II 4542, 5412; C IV 5801, 5812; and O III 5592) in order to enhance the precision of our determinations. We also made use of the iacob-broad tool (Simón-Díaz & Herrero, 2014) to determine the macroturbulent velocities. As this tool also provides an independent estimate of – albeit it is also based on Fourier techniques – it allows us to check the robustness of our values. These values were consistently recovered within the error bars. We caution that the derived macroturbulent velocities are upper limits only since they cannot be determined reliably for fast rotators (Simón-Díaz & Herrero, 2014). No significant change in stellar parameters and abundances was found whether or not the macroturbulence was considered in the computation of the synthetic spectra; the macroturbulence broadening of our synthetic spectra was performed with the macturb programme of the SPECTRUM suite of routines151515http://www.appstate.edu/~grayro/spectrum/spectrum276/node38.html that makes use of the formulation of Gray 2005. Furthermore, our spectral fits are already satisfactory when rotational velocity is the only source of broadening considered. After some preliminary tests, we therefore chose not to consider macroturbulence in our determination of the stellar parameters.
To further validate our method, we compared the for nine stars with those obtained by Bragança et al. (2012), Daflon et al. (2007), and Garmany et al. (2015) with a different method based on the full width at half-minimum [FWHM] of He I lines. The results are presented in Table 2: they show a good agreement within errors, although there is some indication of slightly larger values in our case. This might be attributed to differences in the normalisation.
4.3 Atmospheric parameters and abundances
Two methods were used to determine the atmospheric parameters (, ) and chemical abundances depending on the sample considered. They are both based on spectral synthesis whereby a search is made for the best match between each observed spectrum and a grid of synthetic profiles broadened with the appropriate instrumental and rotational velocity profiles. They are now presented in turn. Our full results can be found in Table 3, and a comparison with literature values, when available, is given in Table 14.
We provide , which is the surface gravity corrected for the effects of centrifugal forces: = + ()2/, where is the star radius (Repolust et al., 2004). The radius was always estimated, for consistency, from the gravity value ( = G/) taking the appropriate mass for each star (see Paper II for details) into account. Radii can also be computed from the temperatures (our best-fit ) and the luminosities, which are derived from the magnitude and distance of the target under consideration. While distances are not available for all our targets, two stars are believed to be part of clusters and, therefore, have their distance estimated: HD 46056 and HD 46485 in NGC 2244 ( = 1.4 kpc). Furthermore, the Hipparcos distances of HD 66811 and HD 149757 are known: 335 and 1123 pc, respectively (van Leeuwen et al., 1997; Maíz Apellániz et al., 2008). In addition, we used V magnitudes taken from SIMBAD, reddenings taken from WEBDA161616https://www.univie.ac.at/webda/ for the cluster members or from Bastiaansen (1992) and Morton (1975) for HD 66811 and HD 149757, respectively, as well as typical bolometric corrections for the appropriate spectral type (Martins et al., 2005). The radii derived from both methods agree well; however, a full comparison must await the availability of accurate distances from Gaia (Gaia Collaboration et al., 2016).
4.3.1 Method for the cooler stars
The synthetic spectra for the stars whose spectral types are comprised between B0.5 and O9 were computed using Kurucz LTE atmosphere models assuming a solar helium abundance and the non-LTE line-formation code DETAIL/SURFACE (Giddings, 1981; Butler & Giddings, 1985). The choice of a solar helium abundance was motivated by the fact that no appreciable differences in stellar parameters and CNO abundances were found when considering model atmospheres with a helium abundance that is twice solar, as is the case for some of our targets (Table 3). The model atoms implemented in DETAIL/SURFACE are the same as those employed in Morel et al. (2006). This combination of LTE atmospheric models and non-LTE line-formation computations has been shown to be adequate for late O- and early B-type stars for which wind effects can be neglected (Nieva & Przybilla, 2007; Przybilla et al., 2011).
We assumed a typical microturbulence to compute the synthetic spectra ( = 10 km s-1; e.g. Hunter et al., 2009). However, we explore the impact of this choice on our results in Sect. 5.3.1.
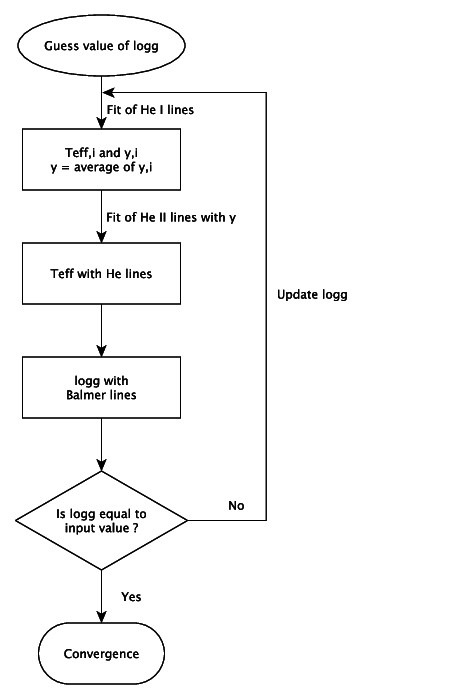
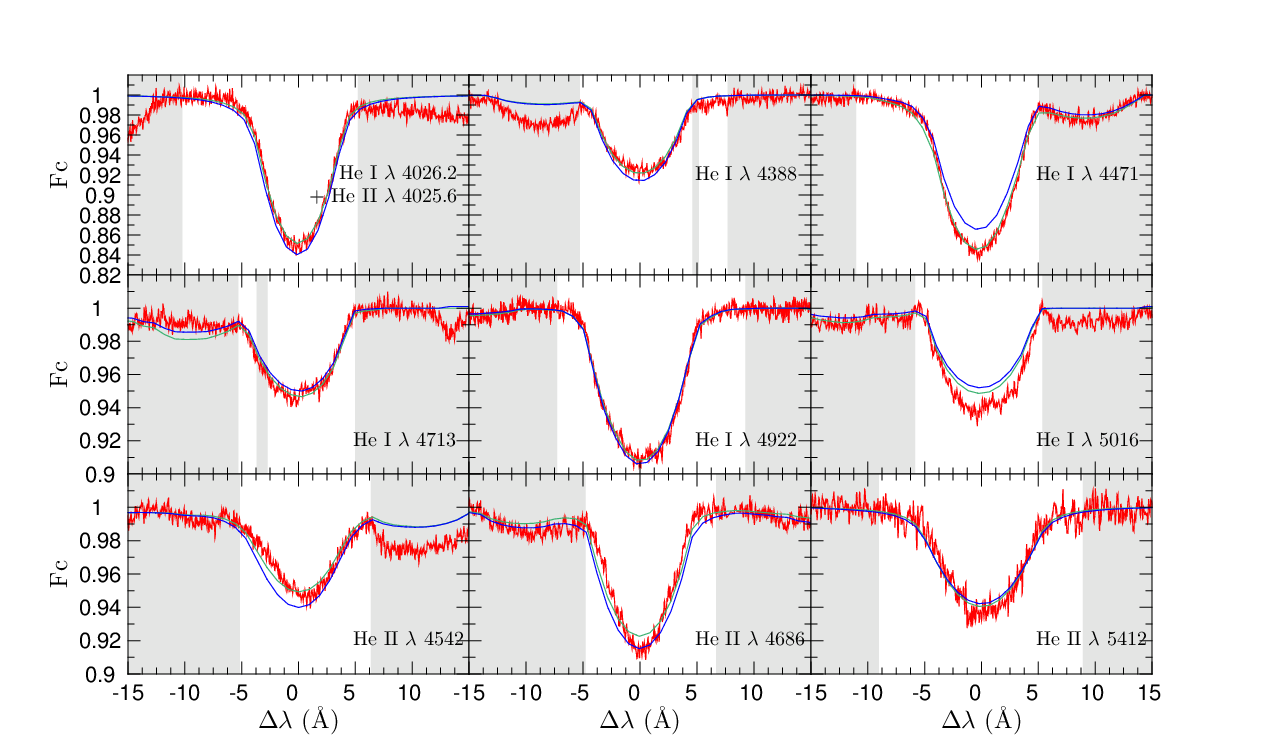
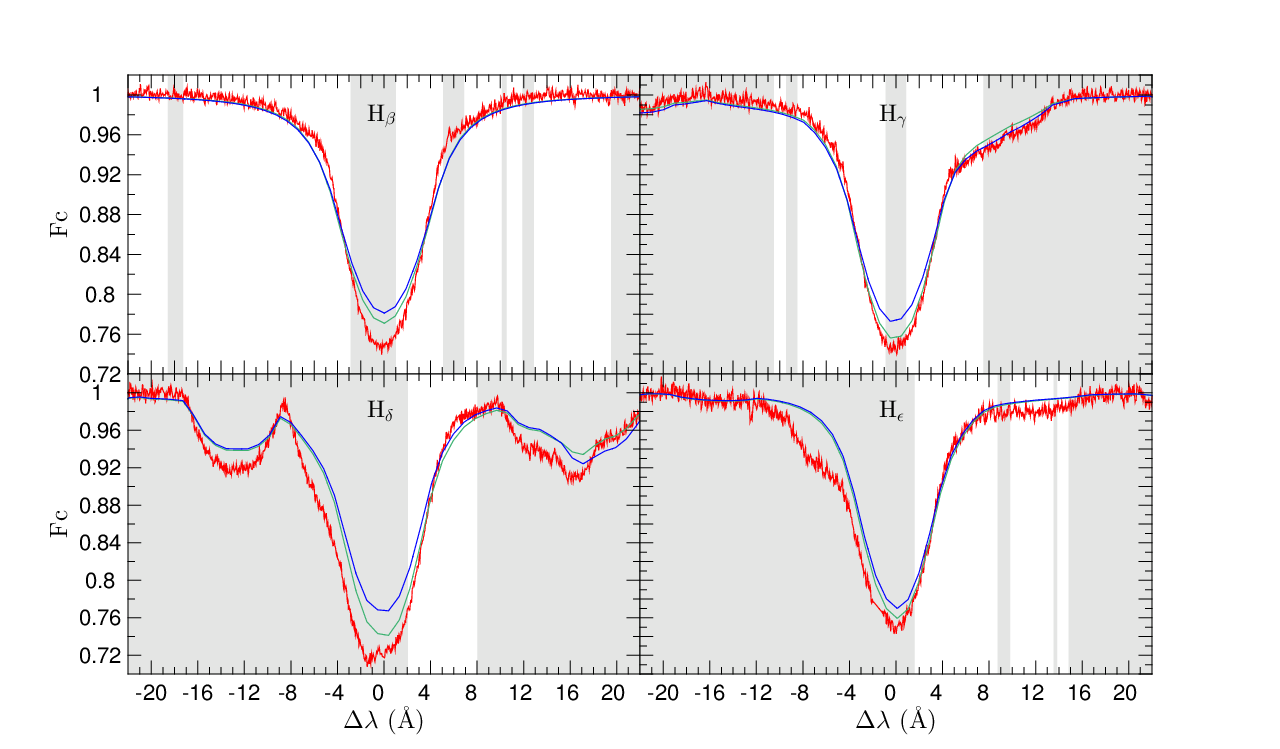
We performed the analysis in three steps (see Rauw et al. 2012 for further details). The stellar parameters and helium abundance (by number, noted ) were first determined for each star. We only summarise the procedure briefly here. The grid of synthetic spectra used was constructed by varying in the range 3.5–4.5 dex with a step of 0.1 dex, in the domain 27–35 kK with a step of 1 kK, and in the range 0.005–0.250 with a step of 0.005. A few models with both large and low are lacking because of convergence issues. We selected four Balmer lines (H , H , H , and H ) to derive the surface gravity, and we chose nine prominent helium lines (He I 4026, 4388, 4471, 4713, 4922, 5016, and He II 4542, 4686, 5412) because they are sensitive to both the stellar temperature, through the ionisation balance of He I and He II lines, and the abundance of helium. Metallic lines falling across the Balmer and He lines, but that are not modelled by DETAIL/SURFACE, were masked out during the fitting procedure. For the other metallic features, abundances typical of early-B stars determined with the same code were assumed (see Table 6 of Morel et al., 2008).
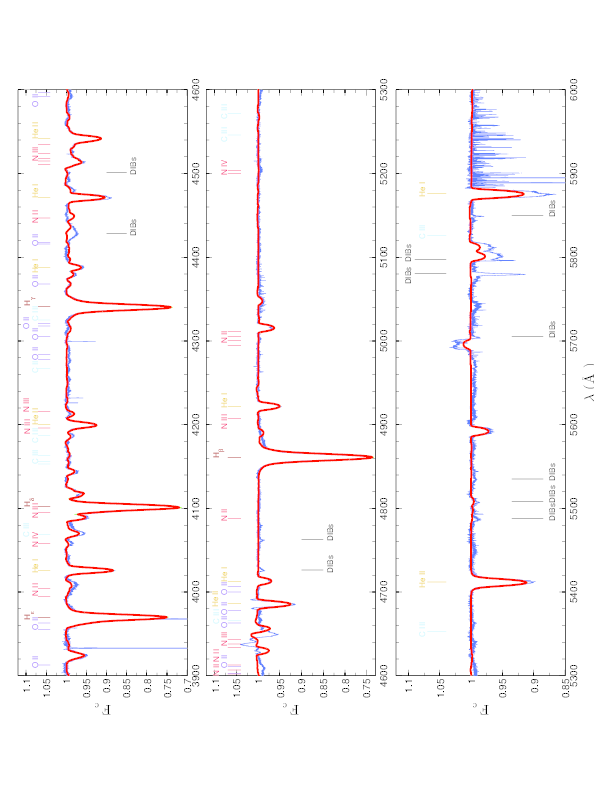
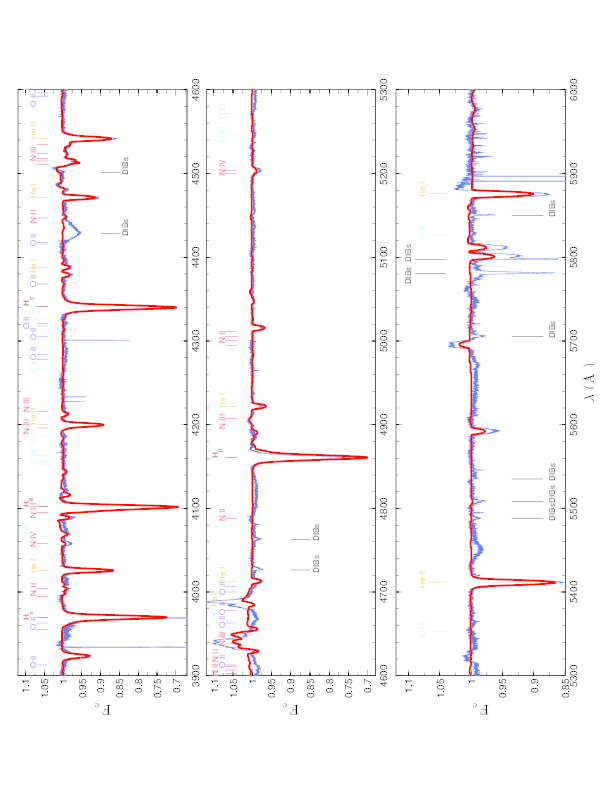
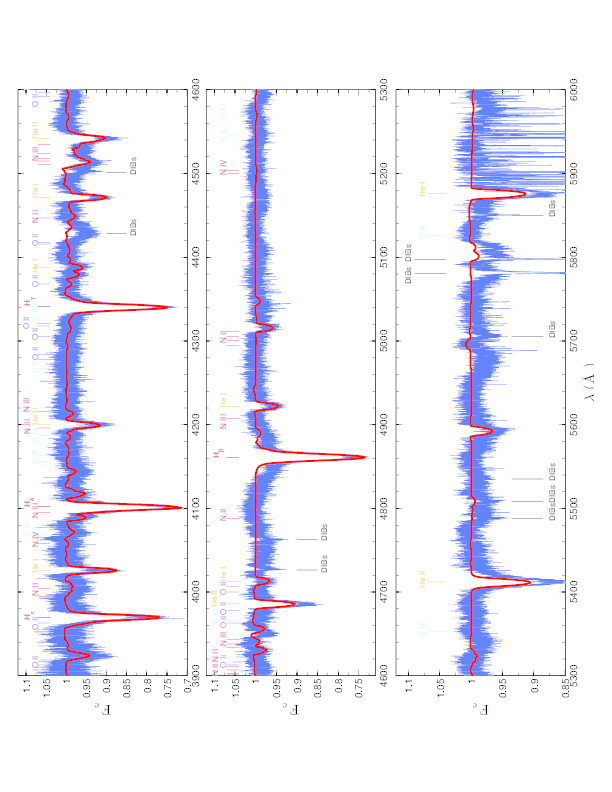
For the initial step, we chose a value of (either 3.5 or 4.0) as a first guess. Both values were tried and, if results differed after convergence, those associated with the input yielding the smallest residuals were kept. A comparison between the observed and synthetic spectra for the aforementioned He I lines provides values of and for each line. The helium abundances were then averaged by weighting the results according to the residuals. The value of the grid closest to this mean helium abundance was then fixed for the next step, the fit of the He II lines, which was performed in a similar way. We calculated the mean temperatures for each ion separately and results from individual lines were weighted according to their residuals. We then averaged the two mean values, considering equal weights for the two ions, to derive a new value. The values of and in the grid, which are closest to the values just derived, were then fixed to determine by fitting the wings of the Balmer lines. If the value of was not equal to the input value, we performed additional iterations until convergence (see sketch on Fig. 1). Caution must be exercised when fitting spectral regions where orders of the échelle spectra are connected, especially when this occurs over the broad Balmer lines. It should, however, be noted that no deterioration of the fit in these regions was apparent. An illustration of the fits of He line profiles is given in Fig. 2, demonstrating that the observed features are satisfactorily reproduced. Achieving a good fit for the Balmer lines using DETAIL/SURFACE is more challenging (Fig. 3), as found in previous studies (e.g. Firnstein & Przybilla 2012 for Galactic BA supergiants), but remains possible when carefully selecting the regions that are deemed reliable.
The next step is to determine the CNO abundances171717CNO abundances are given in the form (X) = 12 + , where X C, N, O.. To this end, we built a grid of CNO synthetic spectra for the (, ) pair determined previously. We created these grids by varying (C) in the range 7.24–8.94 dex, (N) in the range 7.24–8.64 dex, and (O) in the range 7.74–9.24 dex, with a step of 0.02 dex in each case. We used synthetic spectra linearly interpolated to the exact values because the CNO abundances may be very sensitive to the temperature in certain regimes.
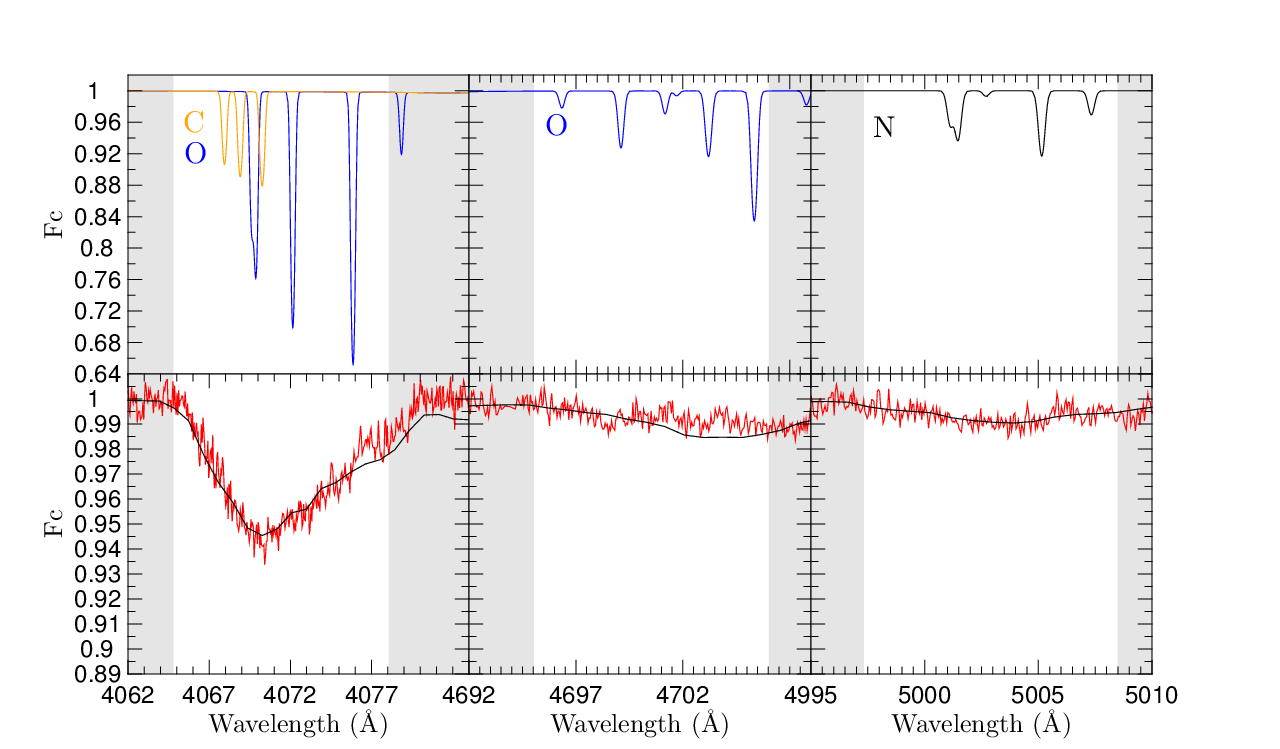
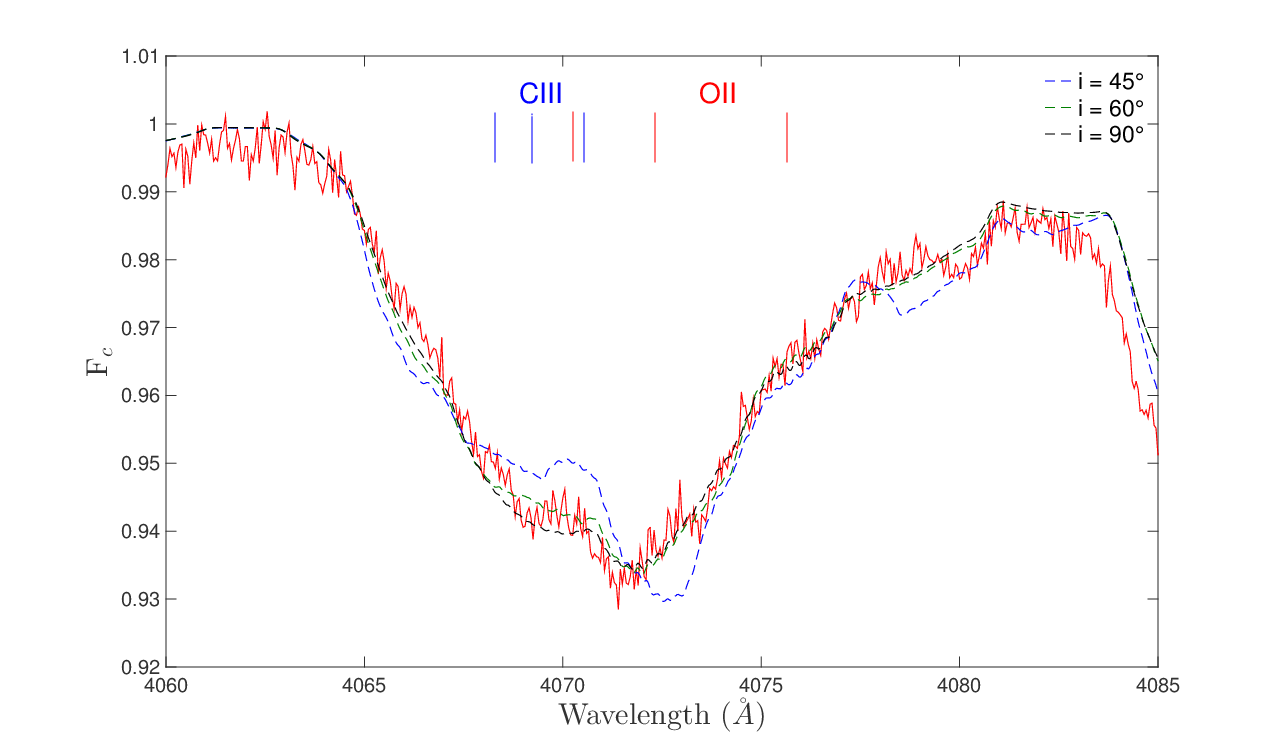
The choice of suitable CNO lines is complicated by the high rotation rates of our targets. We chose to consider some spectral domains that have been shown not to be significantly contaminated by lines of other species and to provide results that are consistent for a set of well-studied stars with those of more detailed and much more time consuming analyses (see Rauw et al. 2012 for a discussion). These regions are illustrated in Fig. 4: the features in the first region (4060–4082 ) are mostly C III and O II lines, whereas O II lines contribute predominantly to the second region (4691–4709 ) and N II to the third (4995–5011 ). The associated CNO abundances were then found by minimising the residuals between the observed and synthetic spectra.
| Name | Spectral type | Ref. | mV | Number of spectra | |||||||||||||||
|---|---|---|---|---|---|---|---|---|---|---|---|---|---|---|---|---|---|---|---|
| ALS/BD/HD | Other | AU | C | EL | ESPa | ESPR | FE | FI | G | HA | HE | M | N | S | U | ||||
| [mag] | Alb | B&C | |||||||||||||||||
| Slow rotators | |||||||||||||||||||
| HD 214680 | 10 Lac | O9V | 1 | 4.88 | 1 | ||||||||||||||
| HD 46328 | CMa | B0.5IV | 2 | 4.33 | 1 | ||||||||||||||
| HD 57682 | O9.2IV | 1 | 6.43 | 5 | |||||||||||||||
| HD 149438 | Sco | B0V | 3 | 2.81 | 2 | ||||||||||||||
| Fast rotators | |||||||||||||||||||
| ALS 864 | O9V | 4 | 10.63 | 1 | |||||||||||||||
| ALS 18675 | … | 1 | 13.60 | 1 | |||||||||||||||
| BD +60$^∘$594 | O9V | 3 | 9.30 | 1 | 1 | ||||||||||||||
| BD +34$^∘$1058 | O8nn | 2 | 8.84 | 1 | |||||||||||||||
| HD 13268 | ON8.5IIIn | 1 | 8.18 | 62 | 2 | 3 | |||||||||||||
| HD 14434 | O5.5Vnn((f))p | 1 | 8.49 | 6 | 8 | 1 | |||||||||||||
| HD 14442 | O5n(f)p | 1 | 9.27 | 38 | |||||||||||||||
| HD 15137 | O9.5II-IIIn | 1 | 7.86 | 1 | 3 | ||||||||||||||
| HD 15642 | O9.5II-IIIn | 1 | 8.55 | 3 | |||||||||||||||
| HD 28446A | 1 Cam A | B0IIIn | 2 | 5.77 | 14 | ||||||||||||||
| HD 41161 | O8Vn | 1 | 6.76 | 1 | 3 | 22 | |||||||||||||
| HD 41997 | O7.5Vn((f)) | 5 | 8.46 | 1 | |||||||||||||||
| HD 46056 | O8Vn | 1 | 8.16 | 8 | 1 | ||||||||||||||
| HD 46485 | O7V((f))nz | 1 | 8.27 | 1 | 1 | ||||||||||||||
| HD 52266 | O9.5IIIn | 1 | 7.23 | 6 | 2 | 1 | |||||||||||||
| HD 52533 | O8.5IVn | 1 | 7.68 | 1 | 2 | 2 | 1 | 1 | |||||||||||
| HD 53755 | V569 Mon | B0.5V | 6 | 6.49 | 1 | ||||||||||||||
| HD 66811 | Pup | O4I(n)fp | 1 | 2.25 | 2 | ||||||||||||||
| HD 69106 | O9.7IIn | 1 | 7.13 | 3 | 4 | 1 | |||||||||||||
| HD 74920 | O7.5IVn((f)) | 1 | 7.54 | 3 | 1 | ||||||||||||||
| HD 84567 | B0.5IIIn | 7 | 6.45 | 2 | |||||||||||||||
| HD 90087 | O9.2III(n) | 1 | 7.80 | 2 | |||||||||||||||
| HD 92554 | O9.5III | 8 | 9.50 | 2 | |||||||||||||||
| HD 93521 | O9.5IIInn | 1 | 7.03 | 20 | 2 | 1 | |||||||||||||
| HD 102415 | ON9IV:nn | 1 | 9.28 | 1 | 4 | ||||||||||||||
| HD 117490 | ON9.5IIInn | 1 | 8.89 | 8 | |||||||||||||||
| HD 124979 | O7.5IV(n)((f)) | 1 | 8.51 | 2 | |||||||||||||||
| HD 149757 | Oph | O9.2 IVnn | 1 | 2.56 | 1 | 1 | 1 | ||||||||||||
| HD 150574 | ON9III(n) | 1 | 8.50 | 2 | |||||||||||||||
| HD 163892 | O9.5IV(n) | 1 | 7.44 | 3 | 12 | 2 | |||||||||||||
| HD 172367 | B0V | 3 | 9.54 | 1 | |||||||||||||||
| HD 175876 | O6.5III(n)(f) | 1 | 6.94 | 1 | 11 | ||||||||||||||
| HD 184915 | Aql | B0.5III | 3 | 4.96 | 4 | 3 | 1 | ||||||||||||
| HD 188439 | V819 Cyg | B0.5IIIpvar | 3 | 6.28 | 4 | 5 | 1 | ||||||||||||
| HD 191423 | ON9II-IIInn | 1 | 8.03 | 7 | 2 | 2 | 2 | 1 | |||||||||||
| HD 192281 | V2011 Cyg | O4.5V(n)((f)) | 1 | 7.55 | 37 | 4 | 1 | ||||||||||||
| HD 198781 | B0.5V | 2 | 6.45 | 5 | |||||||||||||||
| HD 203064 | 68 Cyg | O7.5IIIn((f)) | 1 | 5.00 | 1 | 3 | 4 | ||||||||||||
| HD 210839 | Cep | O6.5I(n)fp | 1 | 5.05 | 1 | 6 | 1 | ||||||||||||
| HD 228841 | O6.5Vn((f)) | 1 | 9.01 | 1 | |||||||||||||||
| Star | sin [km s-1] | Reference | |
|---|---|---|---|
| This work | Literature | ||
| ALS 491 | 22815 | 22356 | 1 |
| ALS 535 | 20015 | 17914 | 1 |
| ALS 851 | 16715 | 16531 | 1 |
| ALS 897 | 18015 | 17510 | 1 |
| ALS 864 | 24915 | 23222 | 1 |
| ALS 18675 | 23615 | 21211 | 1 |
| HD 42259 | 25615 | 24925 | 2 |
| HD 52533 | 30515 | 29129 | 2 |
The final abundance of oxygen is the unweighted mean of the values found for the first and second regions. Since the C III lines allowing us to probe the carbon abundance are weak for the coolest stars in our sample and become a minor contributor to the blend with the nearby O II lines, carbon abundances cannot be reliably determined for the B0.5 stars.
4.3.2 Method for the hotter stars
For the hotter stars that possess strong winds, we used the non-LTE spherical atmosphere code CMFGEN to derive stellar parameters. Full details about this code (e.g. atomic data) can be found in Hillier & Miller (1998)202020See also http://kookaburra.phyast.pitt.edu/hillier/web/CMFGEN.htm for upgrades since the original publication..
As a starting point, CMFGEN makes use of a hydrodynamical structure, characterising the velocity and density profiles, which is created from TLUSTY models (Lanz & Hubeny, 2003). The wind is described by a mass-loss rate, , a -like velocity law, , where is the stellar radius, and the distance from the stellar centre, a parameter with typical values for massive stars close to 0.8–1, and the terminal velocity. We adopted a volume filling factor at terminal velocity of 0.1 and a clumping velocity factor of 100 km s-1; for the clumping formalism implemented in CMFGEN, see e.g. Raucq et al. (2016). The following elements are included in the calculations of our models: H, He, C, N, O, Ne, Mg, Al, Si, P, S, Ca, Fe, and Ni. Computing time was reduced thanks to the use of the super-level approach, but remains much longer than for DETAIL/SURFACE.
A synthetic spectrum was created after finding the formal solution of the radiative transfer equation. A microturbulent velocity varying linearly from the photosphere to at the top of the atmosphere was considered. The value at the photosphere depends on the luminosity class: 10 km s-1 for dwarfs, 12 km s-1 for (sub)giants, and 15 km s-1 for supergiants (Bouret et al., 2012). A typical X-ray flux corresponding to / 10-7 is considered in our models, as X-rays have an impact on the ionisation balance. After transforming vacuum wavelengths into air wavelengths, the spectrum was then broadened in order to take the appropriate instrumental resolution and object’s projected rotational velocity into account.
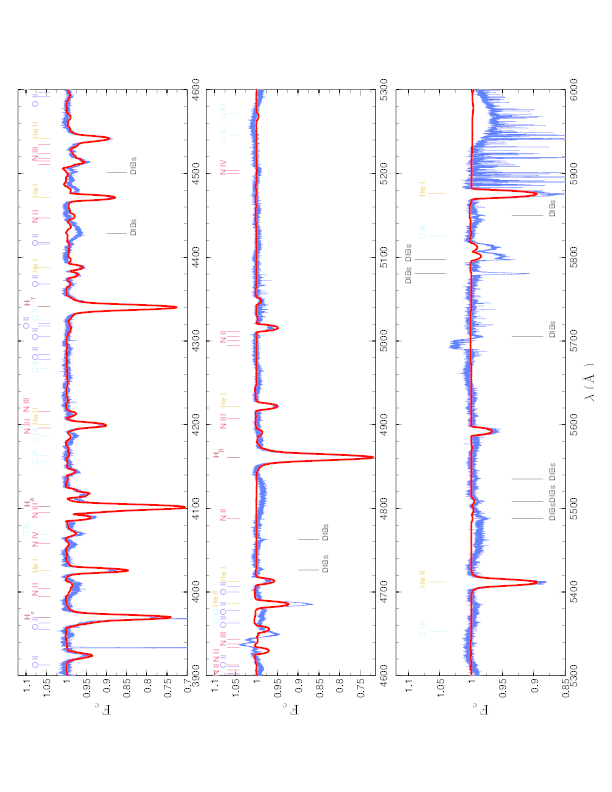
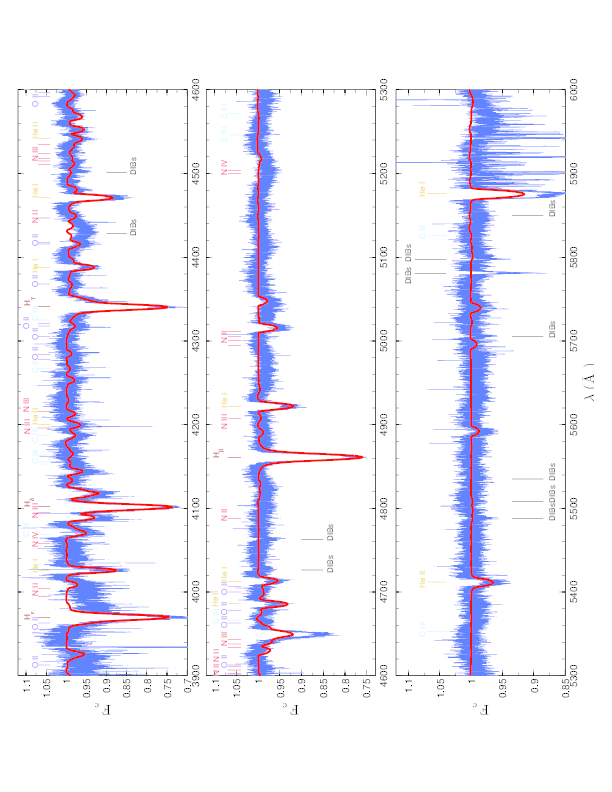
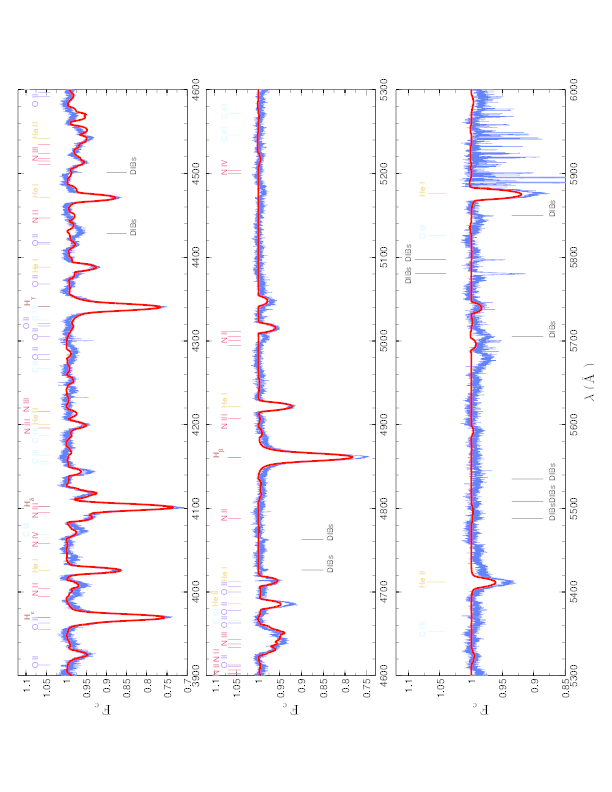
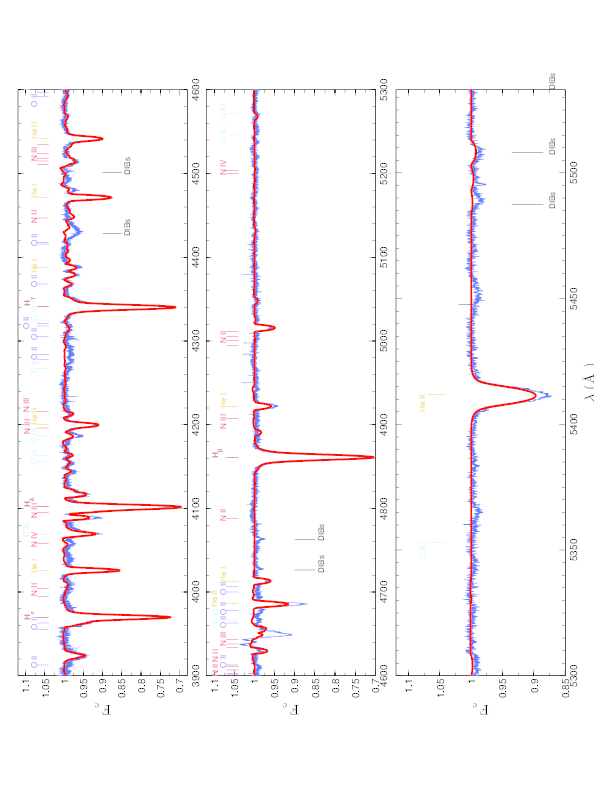
Given the large number of free input parameters entering the CMFGEN code and the fact that the computing time necessary to create a new model is in general very lengthy, computation of a complete grid of models is virtually impossible. We therefore adopted a procedure slightly different from that described in the previous subsection. A first guess of stellar parameters, wind parameters, and surface abundances for each star was adopted (either from the literature, if available, or from typical values for the considered spectral type given by Muijres et al., 2012). Wind parameters are not investigated in this study, hence they were not fitted since our main concern was to unveil surface abundances (an approach previously used by Martins et al. 2015b). In particular, is fixed, when possible, to values provided by Prinja et al. (1990). We nevertheless checked that the fits of wind-sensitive lines were reasonable, and the wind parameters were slightly modified for stars with strong outflows (e.g. HD 66811) when these fits were not deemed satisfactory. We calculated a small grid of CMFGEN spectra with five temperature ( = 500 K) and five gravity values ( = 0.125 dex) around the initial guesses. We then computed the residuals for each point of the grid between the observed spectrum and the synthetic spectra. This was performed over the same regions, encompassing the Balmer and He lines, as those used for the cooler objects (Sect. 4.3.1). A surface corresponding to a piecewise cubic interpolation was fitted to the results of this analysis. The best-fit values of and are at the minimum of this surface fit. The good agreement for the hotter stars between CMFGEN spectra and observations is illustrated in Appendix E.
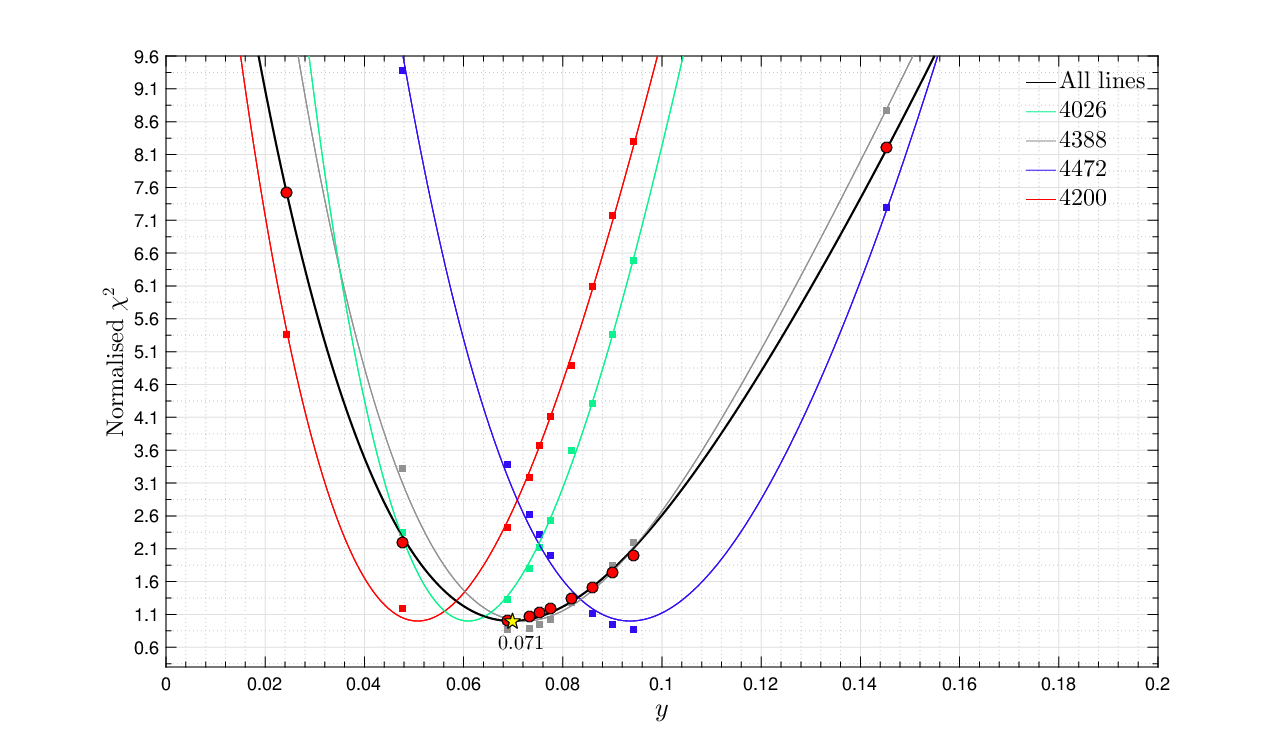
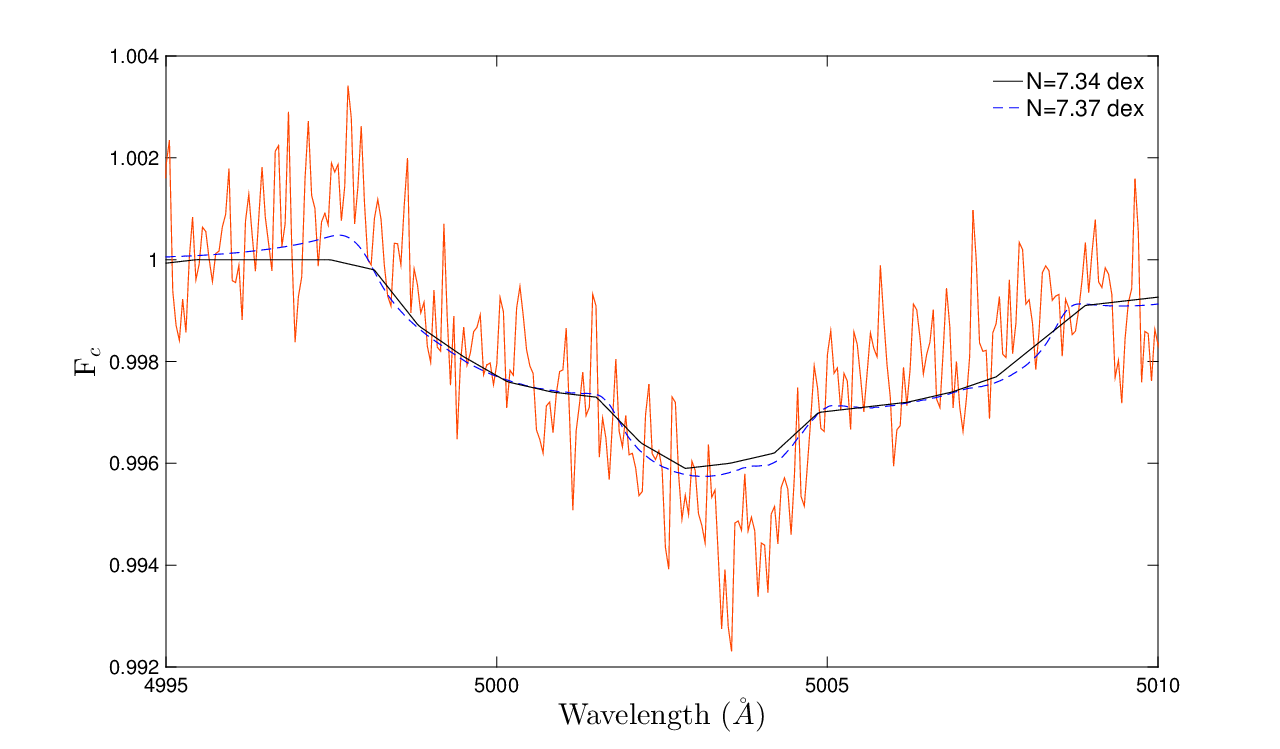
Next, we determined the helium abundance by performing a analysis similar to that of Martins et al. (2015b), considering the same helium lines as in Sect. 4.3.1, with the addition of He II 4200. This time points in the grid were separated by 0.025. A polynomial fit (of degree smaller than or equal to 4) of individual features first allowed us to identify discrepant lines (the fit quality was an additional criterion). Then, a global fit of the remaining lines enabled us to find the best value of (see illustration in Fig. 5).
The carbon, nitrogen, and oxygen abundances were derived following the same approach, with the grids usually having = 2 10-4, where X C, N, O. The initial line list used to derive the CNO abundances is taken from Martins et al. (2012a, 2015a, 2015b), and shown in plots of Appendix E, while the lines actually used for each star are listed in Table 11.
5 Uncertainties of the results
5.1 RVs
High-resolution spectrometers usually yield low errors on RVs. For example, RV dispersions below 1 km s-1 are commonly found for narrow interstellar features (Bates et al., 1992). In our case, however, the lines are very broad, generally leading to larger errors. Indeed, RVSAO calculates errors on RVs, which are of the order of 1–20 km s-1 (and typically 7 km s-1) for our sample stars, depending on noise level, spectral type, , and spectral resolving power. The uncertainty arising from the wavelength calibration ( km s-1, as determined from narrow interstellar lines) is generally negligible in comparison.
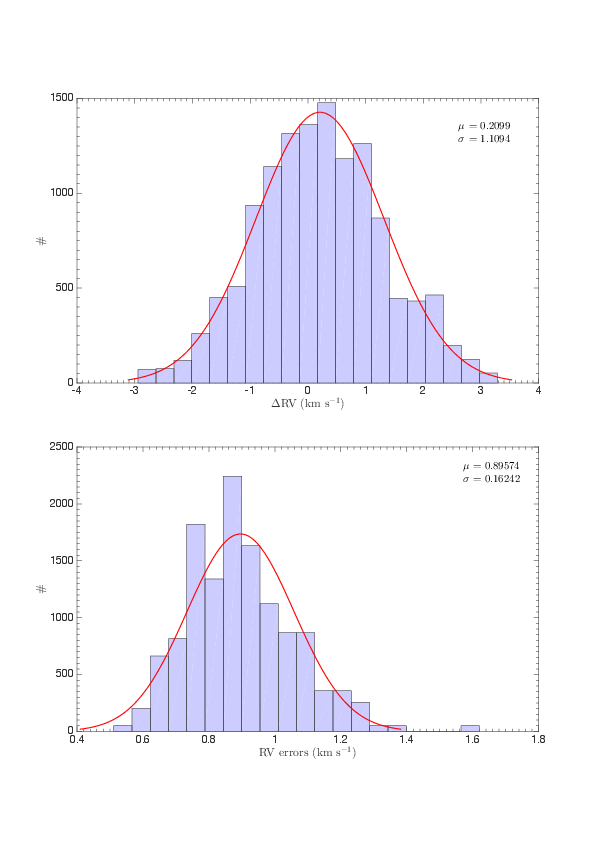
To check the RVSAO error values, we performed Monte Carlo simulations. Synthetic TLUSTY spectra of a typical B0.5 V and O5 V star were convolved with two rotational profiles ( = 200 and 400 km s-1, corresponding to the extreme values of our sample), blurred by noise (S/N 125, typical of our data), and shifted with different radial velocities (from –250 to 250 km s-1 with a step of 10 km s-1). Their RV was estimated as for real spectra and the dispersion of the difference between applied shifts and derived velocities examined. We found that the distributions of the velocity differences can be reasonably represented by Gaussians whose standard deviations agree well with the errors provided by RVSAO (e.g. 1 km s-1 found in both cases for a B0.5 V star with = 400 km s-1 and observed with = 50 000, see Fig. 6).
5.2
The errors on the projected rotational velocities can be empirically estimated by comparing results obtained for a star observed with various instruments and analysed using different diagnostic lines. Taking HD 149757 ( Oph) as a prototypical example, we found dispersions of values of 8 km s-1 when considering different lines (He I 4026, 4471, 4922), but the same instrument. Alternatively, this translates to 12 km s-1 for the same lines, but different instruments (ELODIE, FEROS, and HARPS). The overall dispersion considering all values amounts to 13 km s-1. We therefore consider a representative error of 15 km s-1 for our sample stars.
5.3 Atmospheric parameters and abundances
5.3.1 Cooler stars
To estimate the precision of our parameters (, ) and abundances, we first examined the dispersion of the results obtained for different spectra (ELODIE, FEROS, and HARPS) of the same star (HD 149757). The differences are expected to mainly reflect the uncertainties related to the nature of the data and their treatment, especially errors in the normalisation to the continuum. In the case of HD 149757, our procedure also accounts for line-profile variations arising from non-radial pulsations (e.g. Kambe et al. 1997). As a second step, we explored the impact of the choice of the microturbulence by repeating the analysis of HD 149757 after adopting = 5 rather than 10 km s-1.
To accommodate both sources of errors, we quadratically summed the derived dispersions to get the final uncertainties that are quoted in Table 4. These uncertainties typically amount to 1000 K for , 0.10 dex for , 0.025 for , and 0.12, 0.13, and 0.21 dex for the abundances of carbon, nitrogen, and oxygen, respectively. The errors on the nitrogen-to-carbon and nitrogen-to-oxygen abundance ratios ([N/C] and [N/O], defined as and , respectively) were then estimated to be 0.21 and 0.12 dex, respectively.
5.3.2 Hotter stars
Typical errors on and were assumed to be 1500 K and 0.15 dex, respectively, as generally adopted in CMFGEN analyses in the literature (Martins et al. 2015b; Raucq et al. 2016). These values are higher than those considered for DETAIL/SURFACE since stronger winds have an impact on the resultant spectrum, making the analysis more challenging. The chosen errors are also comparable to the differences found when comparing our values of and with those in the literature (Appendix D), which supports our choice. HD 41161, which is representative of the sample of hotter stars, was chosen to determine the typical errors on He and CNO abundances. These errors were derived from the unnormalised function, considering values corresponding to above its minimum. This approach is different from that of Martins et al. (2015a) who first normalised the function such that the minimum is equal to one before considering (a procedure less valid than ours, statistically speaking). We caution that the errors on He and CNO abundances do not take the uncertainties on atmospheric parameters into account so that they are likely underestimated.
6 Method validation
6.1 Comparison of atmospheric parameters and abundances with literature
Half of our targets had been previously investigated in some detail (though usually CNO abundances are missing; Table 14). We note a good agreement overall, considering error bars. In particular, we underline the study of Martins et al. (2015a, b), which has 11 objects in common with our analysis. On average, differences in stellar parameters (ours minus Martins et al.) amount to = +282627 K, = +0.020.12 dex, = –0.0100.044, (C) = 0.000.19 dex, (N) = –0.100.13 dex, and (O) = –0.120.18 dex, which are well within error bars. The largest differences are within, or close to, 2 : HD 46485 ( = 0.25 dex), HD 191423 ( = –0.066), and HD 13268 ((O) = –0.39 dex).
Some differences are nevertheless worth mentioning. Our lower limit for the oxygen abundance in HD 150574 is larger than the value derived by Martins et al. (2015b). For HD 191423, we derive an upper limit for the carbon abundance that is lower than the value derived by Villamariz et al. (2002) and a nitrogen abundance that is lower than the lower limit reported by Martins et al. (2015b). However, the differences for HD 191423 are below 2 , hence barely significant. In addition, this star has an extreme rotational velocity ( = 420 km s-1), which renders its analysis very difficult.
6.2 Comparison of DETAIL/SURFACE results with those previously obtained for well-studied slow rotators
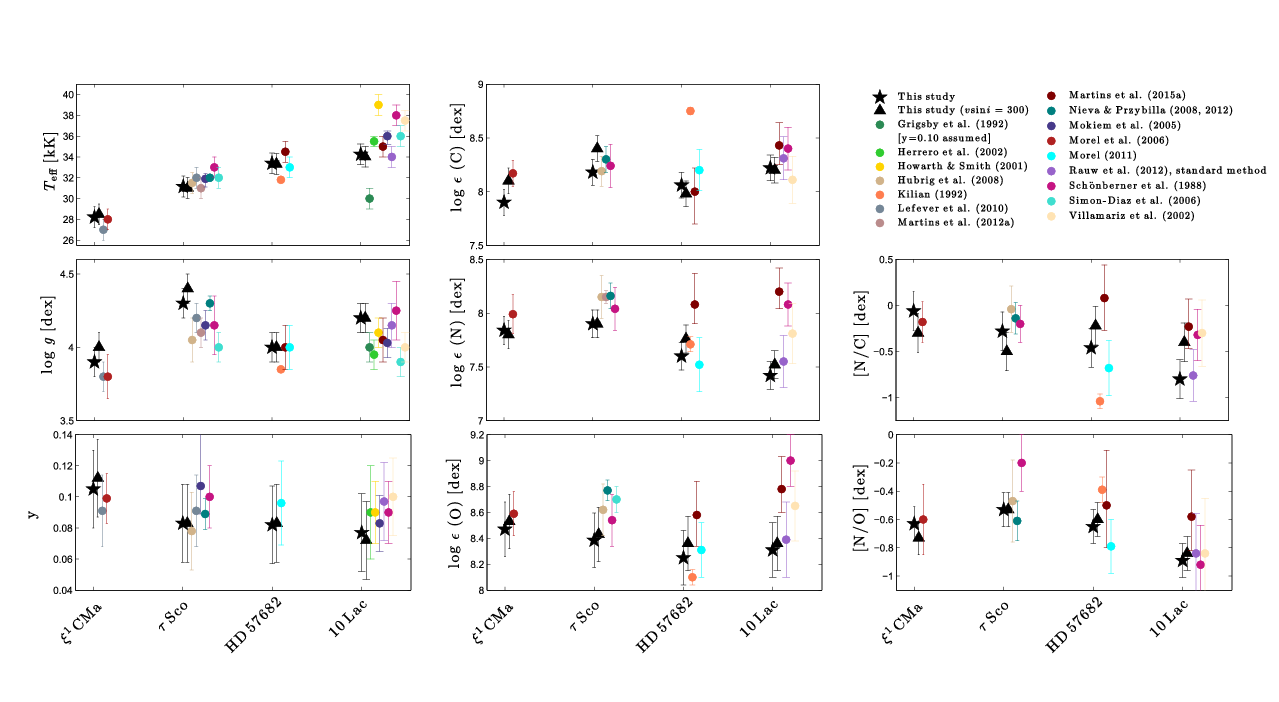
In order to validate the procedures used for the analysis of the cooler stars of our sample, the following four narrow-lined, well-studied objects were analysed (see Rauw et al., 2012; Morel et al., 2008): CMa (B0.5 IV; sin 10 km s-1), Sco (B0 V; sin 8 km s-1), HD 57682 (O9.2 IV; sin 25 km s-1), and 10 Lac (O9 V; sin 25 km s-1). For CMa, which is a well-known Cephei pulsator with slight variations of the physical parameters along the pulsation cycle (Morel et al., 2006), the HEROS exposure corresponding to the highest effective temperature was chosen.
A high rotation rate may bias our results because of, for example, blending issues or a more uncertain continuum placement. To assess the importance of these effects, we repeated the analysis after convolving the spectra with a rotational broadening function corresponding to 300 km s-1, which is a value representative of our sample.
Table 5 presents our results and Fig. 7 compares them to literature values. Some study-to-study scatter exists, but there is an overall good agreement between our values and those in the literature. In particular, there is no evidence for systematic differences compared to previous results despite the different techniques employed; in fact, 10 Lac displays a large dispersion in the literature values of , hence provides a less significant comparison point. Furthermore, our results appear largely insensitive to the amount of rotational broadening, thereby validating our method.
6.3 CMFGEN versus DETAIL/SURFACE
Previous studies have revealed a good agreement for main-sequence, early B-type stars between the parameters/abundances determined with DETAIL/SURFACE and the unified code FASTWIND (Lefever et al. 2010; Nieva & Simón-Díaz 2011). However, a full comparison of the results provided by DETAIL/SURFACE and CMFGEN was seldom performed. To our knowledge, only two stars have been analysed with both codes: Sco (studied with DETAIL/SURFACE by Hubrig et al. 2008 as well as by Nieva & Przybilla 2012, and with CMFGEN by Martins et al. 2012a) and HD 57682 (studied with DETAIL/SURFACE by Morel 2011 and with CMFGEN by Martins et al. 2015a). In these cases, the results appear to agree within the errors. The only exception is the nitrogen abundance in HD 57682, but the origin of this discrepancy is unclear.
Since we made use of these two different line-formation codes for the analysis, our results for the subsamples of cool and hot objects could be affected by systematic errors. To be able to fully assess the magnitude of such differences, if any, it is necessary to study at least a few objects with both codes. To this end, three objects have been chosen: HD 102415, HD 149757, and HD 163892. The three stars were selected because they exhibit different degrees of nitrogen enrichment, spanning the range observed in our sample.
Table 6 presents our results. The effective temperatures are in good agreement, within the error bars: the largest difference is K for HD 149757, which is still below the typical error bars of 1–1.5 kK. The differences in gravities are also generally small (¡ 0.1 dex), although the largest difference (for HD 102415) reaches 0.24 dex, which is slightly larger than the errors (estimated to be 0.10–0.15 dex). The helium abundances agree well with the largest difference, , found for HD 102415, being similar to the error bars. The CNO abundances yielded by the two codes also agree within the error bars. Therefore, we can conclude that there is no evidence for significant differences when analysing our targets with DETAIL/SURFACE or CMFGEN, ensuring that our overall results are to first order homogeneous.
| Star | Multiplicity | Runaway? | (C) | (N) | (O) | [N/C] | [N/O] | |||||||||||
| [km s-1] | [km s-1] | from spectroscopy | [K] | [km s-1] | 4060–4082 | 4691–4709 | Adopted | |||||||||||
| Cooler stars (DETAIL/SURFACE) | ||||||||||||||||||
| ALS 864 | 249 | ¡98 | … | No | 31 500 | 4.00 | 4.05 | … | … | … | 0.064 | 7.86 | 7.64 | 8.26 | 7.98 | 8.12 | –0.22 | –0.48 |
| ALS 18675 | 236 | ¡200 | … | No | 30 300 | 3.90 | 3.95 | … | … | … | 0.071 | 7.78 | 7.54 | 8.02 | 8.12 | 8.07 | –0.24 | –0.53 |
| BD +60$^∘$594 | 314 | ¡197 | RV var | No | 33 200 | 4.00 | 4.04 | … | … | … | 0.131 | 7.66 | 8.24 | 8.60 | 8.36 | 8.48 | 0.58 | –0.24 |
| HD 28446A | 275 | ¡169 | RV var | No | 29 400 | 3.70 | 3.78 | … | … | … | 0.126 | 8.30 | 7.48 | 8.76 | 8.28 | 8.52 | –0.82 | –1.04 |
| HD 52266 | 285 | ¡96 | SB1 | No | 30 100 | 3.60 | 3.70 | … | … | … | 0.187 | 7.78 | 7.74 | 8.08 | 7.92 | 8.00 | –0.04 | –0.26 |
| HD 52533 | 305 | ¡180 | SB1 | … | 34 100 | 4.10 | 4.16 | … | … | … | 0.065 | 7.76 | 7.78 | 8.08 | 8.22 | 8.15 | 0.02 | –0.37 |
| HD 53755a | 285 | ¡102 | … | No | 28 100 | 3.60 | 3.70 | … | … | … | 0.135 | … | 7.32 | … | 8.38 | 8.38 | … | –1.06 |
| HD 84567 | 261 | ¡105 | RV var | … | 27 700 | 3.50 | 3.59 | … | … | … | 0.204 | 7.84 | 7.98 | 8.62 | 8.16 | 8.39 | 0.14 | –0.41 |
| HD 90087 | 276 | ¡63 | Pres. single | No | 29 000 | 3.50 | 3.60 | … | … | … | 0.163 | 7.72 | 7.42 | 8.18 | 8.14 | 8.16 | –0.30 | –0.74 |
| HD 93521 | 405 | ¡88 | Pres. single | … | 30 000 | 3.60 | 3.78 | … | … | … | 0.166 | 7.68 | 8.10 | 8.50 | 8.16 | 8.33 | 0.42 | –0.23 |
| HD 102415 | 357 | ¡72 | Pres. single | No | 32 900 | 4.10 | 4.19 | … | … | … | 0.158 | 7.54 | 8.16 | 8.46 | 7.98 | 8.22 | 0.62 | –0.06 |
| HD 149757 | 378 | ¡104 | Pres. single | Yes | 31 500 | 3.87 | 3.99 | … | … | … | 0.135 | 8.07 | 7.85 | 8.47 | 8.27 | 8.37 | –0.22 | –0.52 |
| HD 163892 | 205 | ¡79 | SB1 | No | 32 000 | 3.80 | 3.84 | … | … | … | 0.082 | 8.24 | 7.34 | 8.44 | 8.32 | 8.38 | –0.90 | –1.04 |
| HD 172367 | 266 | ¡107 | … | No | 27 600 | 3.60 | 3.69 | … | … | … | 0.140 | 8.09 | 8.44 | 8.48 | 8.46 | 8.47 | 0.35 | –0.03 |
| HD 184915 | 252 | ¡62 | Pres. single | No | 27 800 | 3.70 | 3.77 | … | … | … | 0.183 | 8.18 | 8.46 | 8.86 | 8.62 | 8.62 | 0.28 | –0.16 |
| HD 188439 | 281 | ¡197 | RV var | … | 27 700 | 3.70 | 3.79 | … | … | … | 0.122 | 8.09 | 8.16 | 8.86 | 8.66 | 8.66 | 0.07 | –0.50 |
| HD 198781 | 222 | ¡103 | Pres. single | No | 29 100 | 3.90 | 3.94 | … | … | … | 0.230 | 8.09 | 8.62 | 8.98 | 8.58 | 8.78 | 0.53 | –0.16 |
| Typical errors | 15 | … | … | … | 1000 | 0.10 | 0.10 | … | … | … | 0.025 | 0.12 | 0.13 | … | … | 0.21 | 0.21 | 0.12 |
| Hotter stars (CMFGEN) | ||||||||||||||||||
| BD +34$^∘$1058 | 424 | ¡57 | … | No | 34 400 | 3.67 | 3.85 | –7.0 | 2035 | 1.03 | 0.119 | 7.90 | 8.14 | … | … | 8.68 | 0.24 | –0.54 |
| HD 13268 | 301 | ¡86 | RV var | Yes | 32 500 | 3.42 | 3.55 | –6.6 | 2266 | 0.80 | 0.206 | 7.50 | 8.61 | … | … | 8.10 | 1.11 | 0.51 |
| HD 14434 | 408 | ¡44 | Pres. single | No | 40 000 | 3.89 | 4.03 | –6.2 | 1960 | 0.84 | 0.103 | 7.96 | 8.81 | … | … | 8.10 | 0.85 | 0.71 |
| HD 14442b | 285 | ¡10 | Pres. single | No | 39 200 | 3.69 | 3.78 | –6.2 | 1960 | 0.84 | 0.097 | 7.10 | 8.61 | … | … | 8.10 | 1.51 | 0.51 |
| HD 15137 | 267 | ¡76 | RV var | Yes | 29 500 | 3.18 | 3.31 | –6.4 | 2575 | 0.89 | 0.112 | 7.63 | 8.27 | … | … | 8.30 | 0.64 | –0.03 |
| HD 15642 | 335 | ¡128 | Pres. single | No | 29 700 | 3.28 | 3.47 | –6.4 | 2575 | 0.89 | 0.150 | 7.55 | 8.43 | … | … | 7.93 | 0.88 | 0.50 |
| HD 41161 | 303 | ¡81 | RV var | Yes | 33 900 | 3.67 | 3.77 | –7.0 | 2035 | 1.03 | 0.123 | 7.87 | 8.09 | … | … | 8.67 | 0.22 | –0.58 |
| HD 41997 | 247 | ¡118 | … | Yes | 34 400 | 3.92 | 3.97 | –6.8 | 2700 | 1.03 | 0.110 | 8.59 | 8.21 | … | … | 8.79 | –0.38 | –0.58 |
| HD 46056 | 350 | ¡48 | Pres. single | No | 34 500 | 3.90 | 4.00 | –7.0 | 1305 | 1.03 | 0.088 | 8.34 | 7.78 | … | … | 8.32 | –0.56 | –0.54 |
| HD 46485 | 315 | ¡149 | Pres. single | No | 37 000 | 4.00 | 4.08 | –6.6 | 1780 | 1.03 | 0.076 | 8.46 | 7.95 | … | … | 8.72 | –0.51 | –0.77 |
| HD 66811 | 225 | ¡124 | Pres. single | Yes | 41 000 | 3.55 | 3.62 | –6.0 | 2485 | 0.92 | 0.148 | 7.00 | 8.94 | … | … | 8.20 | 1.94 | 0.74 |
| HD 69106 | 306 | ¡177 | Pres. single | No | 29 500 | 3.45 | 3.58 | –6.1 | 2700 | 1.03 | 0.091 | 7.88 | 7.74 | … | … | 8.47 | –0.14 | –0.73 |
| HD 74920 | 274 | ¡111 | Pres. single | No | 34 100 | 3.85 | 3.92 | –6.6 | 4410 | 1.20 | 0.134 | 7.78 | 8.34 | … | … | 8.51 | 0.56 | –0.17 |
| HD 92554 | 303 | ¡99 | … | Yes | 30 000 | 3.41 | 3.54 | –6.7 | 1260 | 0.99 | 0.091 | 7.57 | 7.30 | … | … | 8.53 | –0.27 | –1.23 |
| HD 117490 | 361 | ¡94 | Pres. single | No | 30 000 | 3.55 | 3.70 | –6.1 | 2970 | 0.95 | 0.141 | 7.39 | 8.50 | … | … | 8.15 | 1.11 | 0.35 |
| HD 124979 | 246 | ¡215 | RV var | Yes | 34 100 | 3.85 | 3.91 | –6.6 | 4410 | 1.20 | 0.091 | 8.48 | 7.92 | … | … | 8.74 | –0.56 | –0.82 |
| HD 150574 | 233 | ¡ 61 | Pres. single | No | 31 500 | 3.32 | 3.41 | –6.8 | 2960 | 0.90 | 0.172 | 7.48 | 9.08 | … | … | 8.93 | 1.60 | … |
| HD 175876 | 265 | ¡100 | Pres. single | … | 35 900 | 3.66 | 3.74 | –6.3 | 2430 | 1.07 | 0.110 | 8.04 | 8.36 | … | … | 8.42 | 0.32 | –0.06 |
| HD 191423 | 420 | ¡29 | Pres. single | No | 30 600 | 3.33 | 3.57 | –6.4 | 600 | 0.99 | 0.134 | 7.24 | 8.33 | … | … | 8.33 | 1.09 | 0.00 |
| HD 192281 | 276 | ¡99 | RV var | No | 39 000 | 3.64 | 3.73 | –6.2 | 1960 | 0.84 | 0.103 | 8.00 | 8.76 | … | … | 8.05 | 0.76 | 0.71 |
| HD 203064 | 298 | ¡104 | SB1 | Yes | 35 000 | 3.73 | 3.82 | –6.6 | 2340 | 1.03 | 0.076 | 7.92 | 8.23 | … | … | 8.46 | 0.31 | –0.23 |
| HD 210839 | 214 | ¡82 | SB1 | Yes | 36 000 | 3.50 | 3.56 | –6.0 | 2600 | 1.03 | 0.113 | 7.83 | 8.74 | … | … | 8.13 | 0.91 | 0.61 |
| HD 228841 | 305 | ¡189 | Pres. single | … | 34 000 | 3.50 | 3.62 | –7.1 | 2700 | 1.03 | 0.112 | 7.48 | 8.74 | … | … | 8.67 | 1.26 | 0.07 |
| Typical errors | 15 | … | … | … | 1500 | 0.15 | 0.15 | … | … | … | 0.030 | 0.27 | 0.34 | … | … | 0.21 | 0.43c | 0.40c |
| Parameter | |||
|---|---|---|---|
| [K] | 630 | 320 | 1000 |
| 0.06 | 0.07 | 0.10 | |
| 0.010 | 0.022 | 0.025 | |
| (C) | 0.10 | 0.06 | 0.12 |
| (N) | 0.12 | 0.04 | 0.13 |
| (O) | 0.13 | 0.16 | 0.21 |
| N/C] | 0.21 | 0.02 | 0.21 |
| N/O] | 0.01 | 0.12 | 0.12 |
| Star | (C) | (N) | (O) | [N/C] | [N/O] | |||||
|---|---|---|---|---|---|---|---|---|---|---|
| [K] | 4060–4082 | 4995–5011 | 4060–4082 | 4691–4709 | Adopted | |||||
| CMa | 28 200 | 3.90 | 0.105 | 7.90 | 7.84 | 8.40 | 8.54 | 8.47 | –0.06 | –0.63 |
| 28 500 | 4.00 | 0.112 | 8.10 | 7.80 | 8.46 | 8.60 | 8.53 | –0.30 | –0.73 | |
| Sco | 31 200 | 4.30 | 0.083 | 8.18 | 7.90 | 8.27 | 8.50 | 8.39 | –0.28 | –0.49 |
| 31 000 | 4.40 | 0.083 | 8.40 | 7.90 | 8.24 | 8.62 | 8.43 | –0.50 | –0.53 | |
| HD 57682 | 33 400 | 4.00 | 0.082 | 8.06 | 7.60 | 8.24 | 8.26 | 8.25 | –0.46 | –0.65 |
| 33 300 | 4.00 | 0.083 | 7.98 | 7.76 | 8.42 | 8.30 | 8.36 | –0.22 | –0.60 | |
| 10 Lac | 34 300 | 4.20 | 0.077 | 8.22 | 7.42 | 8.34 | 8.28 | 8.31 | –0.80 | –0.89 |
| 34 000 | 4.20 | 0.072 | 8.20 | 7.80 | 8.48 | 8.24 | 8.36 | –0.40 | –0.56 | |
| Typical errors | 1000 | 0.10 | 0.025 | 0.12 | 0.13 | … | … | 0.21 | 0.21 | 0.12 |
| Star | [K] | (C) | (N) | (O) | [N/C] | [N/O] | ||||||||||
|---|---|---|---|---|---|---|---|---|---|---|---|---|---|---|---|---|
| D/S | CMF | D/S | CMF | D/S | CMF | D/S | CMF | D/S | CMF | D/S | CMF | D/S | CMF | D/S | CMF | |
| HD 102415 | 32 900 | 33 000 | 4.10 | 3.86 | 0.158 | 0.124 | 7.54 | 7.32 | 8.16 | 8.51 | 8.22 | 8.02 | 0.62 | 1.19 | –0.06 | 0.49 |
| HD 149757 (FEROS) | 31 800 | 32 300 | 3.90 | 3.87 | 0.124 | 0.096 | 8.06 | 8.19 | 7.92 | 7.54 | 8.45 | 8.27 | –0.14 | –0.65 | –0.53 | –0.73 |
| HD 163892 | 32 000 | 32 400 | 3.80 | 3.80 | 0.082 | 0.071 | 8.24 | 8.15 | 7.34 | 7.44 | 8.38 | 8.40 | –0.90 | –0.71 | –1.04 | –0.96 |
| Typical errors | 1000 | 1500 | 0.10 | 0.15 | 0.025 | 0.030 | 0.12 | 0.27 | 0.13 | 0.34 | 0.21 | 0.21 | 0.21 | 0.43 | 0.12 | 0.40 |
6.4 Comparison with the CNO cycle predictions
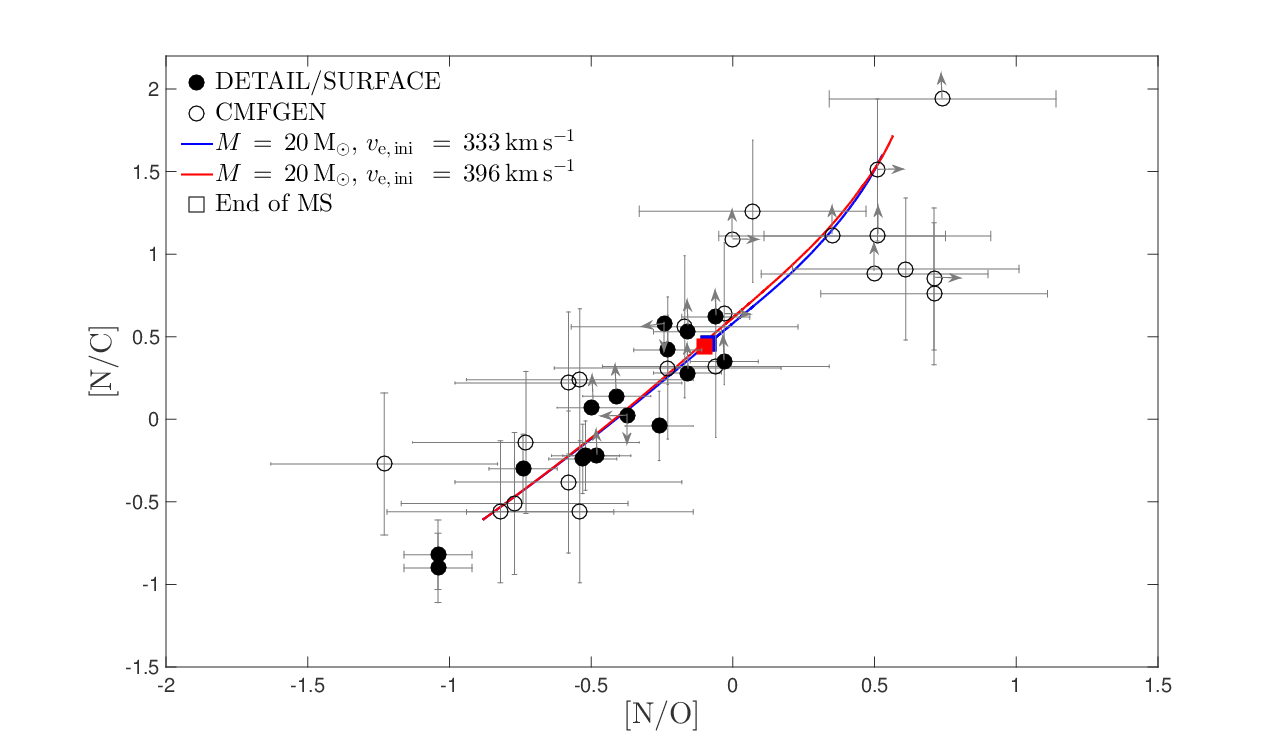
The abundance ratios [N/C] and [N/O] are very good indicators of rotational mixing in massive stars. The transformation of carbon into nitrogen is more efficient than that of oxygen into nitrogen for our sample stars. Hence, their surface carbon and nitrogen abundances should decrease and increase, respectively, whereas the surface abundance of oxygen should remain nearly constant as the star evolves. The loci in the [N/C] versus [N/O] diagram predicted by stellar evolution models reflect the efficiency of the mixing of the CNO material at equilibrium with the initial abundances (Przybilla et al., 2011; Maeder et al., 2014). Fig. 8 shows very good consistency between our results and theoretical predictions for most of our targets. The consistent behaviour is preserved when comparing our results with predictions of models covering the full range of initial rotational velocities and masses spanned by our targets. Therefore, the abundances of fast rotators are in agreement with the predictions of CNO cycle nucleosynthesis.
6.5 Effect of stellar shape
Rotation affects the stellar shape, increasing the equatorial radius while decreasing the polar one. This distortion implies that the equipotentials are closer in polar regions than near the equator. The local effective gravity, which is a measure of the gradient between equipotentials, is thus stronger at the pole than at the equator. As the energy passing through an equipotential is conserved in the absence of local energy production or destruction, polar regions are hotter than equatorial regions and more flux is emitted from the pole compared to the equator. This gravity darkening effect implies that the lines of a fast rotator can be created from different regions around the star; thus, He II lines are preferentially formed near the poles, while He I lines originate from a larger area of the stellar surface.
We used the Code of Massive Binary Spectral Computation (CoMBISpeC; Palate & Rauw, 2012; Palate et al., 2013) to examine the effect of gravity darkening and stellar rotational flattening on the determination of stellar parameters. To this aim, two stars representing the extreme sin values encountered in our sample (HD 149757, sin 378 km s-1 and HD 163892, sin = 205 km s-1) were considered.
We first determine the polar effective temperatures, , and the polar radii, , of the stars depending on the inclination of the rotation axis, , in such a way that and averaged over the visible hemisphere are equal to the values found with the method described in Sect. 4.3.1. This was carried out by fixing some parameters: the stellar mass was chosen to be 20 M⊙ since HD 149757 and HD 163892 are close to the corresponding evolutionary tracks in the – diagram (Paper II), the gravity darkening exponent was chosen to be 0.1875, as suggested by interferometric observations of rapidly rotating B stars (Kraus et al., 2012), and finally the projected rotational velocities were fixed to the values that we derived (Table 3). In these calculations, the sin is held fixed. As a result, the true rotation rate varies as a function of (star intrinsically more rapidly rotating as decreases). Table 7 presents the resulting parameters. Once these parameters are known, we then explore how spectra of those flattened stars change with the CNO abundances. As both He I and He II line-formation zones are always seen, the helium abundance is correctly determined and we thus do not need to explore changes in . Table 8 illustrates how the resulting abundances vary for the various cases considered. For HD 163892, we observe that different combinations of inclinations and rotation rates yield very similar best-fitting abundances (Fig. 9). Furthermore, the results are similar to those found with spherically symmetric models, yielding strong support to our methodology. The other star, HD 149757, is an apparently faster rotator. As expected, this translates into larger differences in the emerging spectrum. Fig. 10 shows an example of the variations affecting the C and O line profiles for a fixed abundance set. In fact, as inclination increases, cooler surface regions come into view and the true rotational velocity decreases (as is kept constant), modifying the strength of C III, N II, and O II lines, which are our abundance diagnostics (see Sect. 4.3.1). For low inclinations, it appears that all CNO abundances of HD 149757 are lower than those derived in the spherical case, while these abundances increase with inclination, reaching values similar to the spherical case when ; it should be noted that the carbon abundance is, however, difficult to pinpoint precisely. Whatever the inclination, however, the differences remain well within the error bars and we therefore conclude that the spherically symmetric models used in this work are suitable to study our sample stars.
6.6 Impact of binarity
A few of our targets are firmly identified as SB1 systems. To examine the impact of the contamination of the spectrum by the secondary, we considered the system with by far the largest mass function hence the largest potential contamination (HD 52533; see Table 12). Assuming an edge-on orbit and a primary mass of 20 M⊙ (Paper II), we infer that the companion is a B1-B2 star. We repeated the analysis described in Sect. 4.3.1 assuming for simplicity that the companion is on the zero age main sequence (ZAMS) and rotates at the same speed as the primary. We further adopted the following parameters: = 28 000 K, = 4.3, = 10 km s-1 and abundances typical of nearby B-type dwarfs (Table 6 of Morel et al. 2008). Grids of composite, synthetic spectra similar to those discussed in Sect. 4.3.1 were computed assuming at each mesh point an appropriate flux ratio between the two components (typically 0.1-0.2 for the default parameters of the primary).
As can be seen in Table 9, taking the cooler secondary in HD 52533 into account would result in modest differences, close to or below the uncertainties. In any event, this more sophisticated approach strengthens the case for a lack of a He and N excess in this star. Furthermore, as the companions are less massive and much fainter for the other SB1 systems (Table 12), even more negligible differences are expected for the parameters of these binaries.
7 Summary
The importance of rotational mixing was recently questioned after the discovery of a population of fast rotators with no or little evidence for a nitrogen enrichment.
| Star | |||
|---|---|---|---|
| [∘] | [K] | [R⊙] | |
| HD 149757 | 45 | 34 800 | 6.38 |
| 60 | 33 800 | 6.91 | |
| (HARPS) | 90 | 33 300 | 7.20 |
| HD 163892 | 45 | 33 300 | 7.89 |
| 60 | 33 000 | 8.12 | |
| (FEROS) | 90 | 32 800 | 8.24 |
| Star | [∘] | Abundances | ||||
|---|---|---|---|---|---|---|
| C | N | O | ||||
| (1) | (2) | Av. | ||||
| Sph. case | 7.98 | 7.92 | 8.50 | 8.36 | 8.43 | |
| HD 149757 | 45 | 7.82 | 7.82 | 8.45 | 8.30 | 8.38 |
| (HARPS) | 60 | 8.06 | 7.91 | 8.50 | 8.35 | 8.43 |
| 90 | 7.98 | 7.92 | 8.50 | 8.35 | 8.43 | |
| Sph. case | 8.24 | 7.34 | 8.44 | 8.32 | 8.38 | |
| HD 163892 | 45 | 8.24 | 7.37 | 8.45 | 8.33 | 8.39 |
| (FEROS) | 60 | 8.24 | 7.37 | 8.45 | 8.33 | 8.39 |
| 90 | 8.24 | 7.37 | 8.45 | 8.33 | 8.39 | |
| Difference | Typical error | |
|---|---|---|
| [K] | +313 | 1000 |
| –0.10 | 0.10 | |
| +0.007 | 0.025 | |
| (C) | +0.08 | 0.12 |
| (N) | –0.24 | 0.13 |
| (O) | –0.13 | 0.21 |
| NC | –0.32 | 0.21 |
| NO | –0.11 | 0.12 |
We decided to revisit this issue by performing an in-depth study of the physical properties of a large sample of massive, fast rotators. Their properties were derived in several steps. First, the RVs were estimated with a cross-correlation technique, while a Fourier transform method yielded the projected rotational velocity. Then, a comparison with synthetic spectra, calculated either with DETAIL/SURFACE for the 17 late-type (B0.5-O9 V-III) stars or with CMFGEN for the 23 objects with earlier types, was performed in a homogeneous way within the two subgroups. This provided the effective temperatures, surface gravities, and the He and CNO abundances for each object.
We performed several checks to validate our method and, hence, its results. First, we studied a sample of well-known slow rotators and showed that our results are in good agreement with previous studies. Furthermore, after convolving the spectra of these stars to mimic a broadening typical of our sample stars, we again obtained similar results, demonstrating the limited impact of broadening on our derivation of physical parameters. Second, the synthetic spectra used in this work correspond to spherically symmetric stars, while fast rotators are flattened objects. We therefore compared our results with those obtained with CoMBISpeC, which takes the stellar deformation into account. Again, results were similar, within errors, further validating our method. Finally, a few targets could be analysed by both CMFGEN and DETAIL/SURFACE models, again showing a good agreement. Further confidence in our results comes from the fact that the [N/C] and [N/O] abundance ratios correlate along the theoretical locus expected for the CNO cycle.
This paper presents the stellar parameters and CNO abundances of 40 fast rotators, along with their multiplicity status, including two new and three revised orbital solutions (see Appendix C). The second paper of this series will compare these results to predictions of evolutionary models of single stars or of interacting binaries with the aim to assess the impact of rotational mixing in hot stars.
Acknowledgements.
We are very grateful to the referee for providing useful comments. We thank John Pritchard from the User Support Department of the European Southern Observatory and the FIES team for their precious help in the reduction of data. We also thank Dr. Keith Butler, Dr. John Hillier, Dr. Hugues Sana, and Dr. Matthieu Palate for making their codes available to us. We acknowledge the support from the Universities of Hamburg, Guanajuato, and Liège for the TIGRE telescope. We thank the team that proposed, observed, and reduced the MIKE data: Marcelo Borges, Gustavo Bragança, Thomas Bensby, Katia Cunha, Katy Garmany, and John Glaspey. To get SOPHIE observations, the authors received funding from the European Community’s Seventh Framework Programme (FP7/2013-2016) under grant agreement number 312430 (OPTICON). We thank Dr. Sergi Blanco-Cuaresma and Dr. Maroussia Roelens for obtaining CORALIE observations. CC also acknowledges funding from ‘Patrimoine de l’ULg’ for his stay at Rio de Janeiro and people at the Observatório Nacional for their kind hospitality during his stay in Rio. This research has made use of the WEBDA database, operated at the Department of Theoretical Physics and Astrophysics of the Masaryk University. Computational resources have been provided by the Consortium des Équipements de Calcul Intensif (CÉCI), funded by the Fonds de la Recherche Scientifique (F.R.S.-FNRS) under Grant No. 2.5020.11. The Liège team also acknowledges support from the Fonds National de la Recherche Scientifique (Belgium), the Communauté Française de Belgique, the PRODEX XMM and GAIA-DPAC contracts (Belspo), and an ARC grant for concerted research actions financed by the French community of Belgium (Wallonia-Brussels Federation). ADS and CDS were used for preparing this document.References
- Abt et al. (1972) Abt, H. A., Levy, S. G., & Gandet, T. L. 1972, AJ, 77, 138
- Aldoretta et al. (2015) Aldoretta, E. J., Caballero-Nieves, S. M., Gies, D. R., et al. 2015, AJ, 149, 26
- Alduseva et al. (1982) Alduseva, V. I., Aslanov, A. A., Kolotilov, E. A., & Cherepashchuk, A. M. 1982, Soviet Astronomy Letters, 8, 717
- Asplund et al. (2009) Asplund, M., Grevesse, N., Sauval, A. J., & Scott, P. 2009, ARA&A, 47, 481
- Bates et al. (1992) Bates, B., Wood, K. D., Catney, M. G., & Gilheany, S. 1992, MNRAS, 254, 221
- Baranne et al. (1996) Baranne, A., Queloz, D., Mayor, M., et al. 1996, A&AS, 119, 373
- Barannikov (1993) Barannikov, A. A. 1993, Astronomy Letters, 19, 420
- Barbá et al. (2010) Barbá, R. H., Gamen, R., Arias, J. I., et al. 2010, Revista Mexicana de Astronomia y Astrofisica Conference Series, 38, 30
- Bastiaansen (1992) Bastiaansen, P. A. 1992, A&AS, 93, 449
- Bekenstein & Bowers (1974) Bekenstein, J. D., & Bowers, R. L. 1974, ApJ, 190, 653
- Blaauw (1961) Blaauw, A. 1961, Bull. Astron. Inst. Netherlands, 15, 265
- Bohannan & Garmany (1978) Bohannan, B., & Garmany, C. D. 1978, ApJ, 223, 908
- Bouret et al. (2012) Bouret, J.-C., Hillier, D. J., Lanz, T., & Fullerton, A. W. 2012, A&A, 544, A67
- Bouret et al. (2013) Bouret, J.-C., Lanz, T., Martins, F., et al. 2013, A&A, 555, A1
- Boyajian et al. (2005) Boyajian, T. S., Beaulieu, T. D., Gies, D. R., et al. 2005, ApJ, 621, 978
- Bragança et al. (2012) Bragança, G. A., Daflon, S., Cunha, K., et al. 2012, AJ, 144, 130
- Brott et al. (2011b) Brott, I., Evans, C. J., Hunter, I., et al. 2011b, A&A, 530, A116
- Butler & Giddings (1985) Butler, K., & Giddings, J. R. 1985, in Newsletter of Analysis of Astronomical Spectra, No. 9 (Univ. London)
- Carrasco & Creze (1978) Carrasco, L., & Creze, M. 1978, A&A, 65, 279
- Cazorla et al. (2007) Cazorla, C., Nazé, Y., Morel, T., Georgy, G., Godart, M., & Langer, N. 2017, A&A, submitted (Paper II)
- Cherepashchuk & Aslanov (1984) Cherepashchuk, A. M., & Aslanov, A. A. 1984, Ap&SS, 102, 97
- Cincotta et al. (1999) Cincotta, P. M., Helmi, A., Mendez, M., Nunez, J. A., & Vucetich, H. 1999, MNRAS, 302, 582
- Cincotta (1999) Cincotta, P. M. 1999, MNRAS, 307, 941
- Conti et al. (1977) Conti, P. S., Leep, E. M., & Lorre, J. J. 1977, ApJ, 214, 759
- Cuypers (1987) Cuypers, J. 1987, A&AS, 69, 445
- Daflon et al. (2007) Daflon, S., Cunha, K., de Araújo, F. X., Wolff, S., & Przybilla, N. 2007, AJ, 134, 1570
- De Becker & Rauw (2004) De Becker, M., & Rauw, G. 2004, A&A, 427, 995
- De Becker et al. (2008) De Becker, M., Linder, N., & Rauw, G. 2008, Information Bulletin on Variable Stars, 5841, 1
- de Mink et al. (2009) de Mink, S. E., Cantiello, M., Langer, N., et al. 2009, A&A, 497, 243
- de Mink et al. (2013) de Mink, S. E., Langer, N., Izzard, R. G., Sana, H., & de Koter, A. 2013, ApJ, 764, 166
- Dervişoǧlu et al. (2010) Dervişoǧlu, A., Tout, C. A., & Ibanoǧlu, C. 2010, MNRAS, 406, 1071
- de Wit et al. (2005) de Wit, W. J., Testi, L., Palla, F., & Zinnecker, H. 2005, A&A, 437, 247
- Dufton et al. (2011) Dufton, P. L., Dunstall, P. R., Evans, C. J., et al. 2011, ApJ, 743, L22
- Eggleton & Tokovinin (2008) Eggleton, P. P., & Tokovinin, A. A. 2008, MNRAS, 389, 869
- Evans et al. (2008) Evans, C., Hunter, I., Smartt, S., et al. 2008, The Messenger, 131, 25
- Feast et al. (1957) Feast, M. W., Thackeray, A. D., & Wesselink, A. J. 1957, MmRAS, 68, 1
- Feast & Thackeray (1963) Feast, M. W., & Thackeray, A. D. 1963, MmRAS, 68, 173
- Firnstein & Przybilla (2012) Firnstein, M., & Przybilla, N. 2012, A&A, 543, A80
- Fitzgerald & Moffat (1975) Fitzgerald, M. P., & Moffat, A. F. J. 1975, A&AS, 20, 289
- Frémat et al. (2005) Frémat, Y., Zorec, J., Hubert, A.-M., & Floquet, M. 2005, A&A, 440, 305
- Frost et al. (1926) Frost, E. B., Barrett, S. B., & Struve, O. 1926, ApJ, 64, 1
- Gaia Collaboration et al. (2016) Gaia Collaboration, Prusti, T., de Bruijne, J. H. J., et al. 2016, A&A, 595, A1
- Garmany et al. (1980) Garmany, C. D., Conti, P. S., & Massey, P. 1980, ApJ, 242, 1063
- Garmany et al. (2015) Garmany, C. D., Glaspey, J. W., Bragança, G. A., et al. 2015, AJ, 150, 41
- Garrison et al. (1977) Garrison, R. F., Hiltner, W. A., & Schild, R. E. 1977, ApJS, 35, 111
- Garrison et al. (1983) Garrison, R. F., Schild, R. E., & Hiltner, W. A. 1983, ApJS, 52, 1
- Gies & Bolton (1986) Gies, D. R., & Bolton, C. T. 1986, ApJS, 61, 419
- Giddings (1981) Giddings, J. R. 1981, Ph.D. Thesis
- Gillet et al. (1994) Gillet, D., Burnage, R., Kohler, D., et al. 1994, A&AS, 108, 181
- Gosset et al. (2001) Gosset, E., Royer, P., Rauw, G., Manfroid, J., & Vreux, J.-M. 2001, MNRAS, 327, 435
- Graham et al. (2013) Graham, M. J., Drake, A. J., Djorgovski, S. G., Mahabal, A. A., & Donalek, C. 2013, MNRAS, 434, 2629
- Grigsby et al. (1992) Grigsby, J. A., Morrison, N. D., & Anderson, L. S. 1992, ApJS, 78, 205
- Grin et al. (2016) Grin, N. J., Ramirez-Agudelo, O. H., de Koter, A., et al. 2016, arXiv:1609.00197
- Gray (2005) Gray, D. F. 2005, ”The Observation and Analysis of Stellar Photospheres”, 3rd Edition, ISBN 0521851866, Cambridge University Press
- Heck et al. (1985) Heck, A., Manfroid, J., & Mersch, G. 1985, A&AS, 59, 63
- Herrero et al. (2000) Herrero, A., Puls, J., & Villamariz, M. R. 2000, A&A, 354, 193
- Herrero et al. (1992) Herrero, A., Kudritzki, R. P., Vilchez, J. M., et al. 1992, A&A, 261, 209
- Herrero et al. (2002) Herrero, A., Puls, J., & Najarro, F. 2002, A&A, 396, 949
- Hillier & Miller (1998) Hillier, D. J., & Miller, D. L. 1998, ApJ, 496, 407
- Hillwig et al. (2006) Hillwig, T. C., Gies, D. R., Bagnuolo, W. G., Jr., et al. 2006, ApJ, 639, 1069
- Hiltner et al. (1969) Hiltner, W. A., Garrison, R. F., & Schild, R. E. 1969, ApJ, 157, 313
- Hoogerwerf et al. (2001) Hoogerwerf, R., de Bruijne, J. H. J., & de Zeeuw, P. T. 2001, A&A, 365, 49
- Howarth et al. (1997) Howarth, I. D., Siebert, K. W., Hussain, G. A. J., & Prinja, R. K. 1997, MNRAS, 284, 265
- Howarth & Smith (2001) Howarth, I. D., & Smith, K. C. 2001, MNRAS, 327, 353
- Huang & Gies (2008) Huang, W., & Gies, D. R. 2008, ApJ, 683, 1045-1051
- Hubrig et al. (2008) Hubrig, S., Briquet, M., Morel, T., et al. 2008, A&A, 488, 287
- Humphreys (1973) Humphreys, R. M. 1973, A&AS, 9, 85
- Humphreys (1978) Humphreys, R. M. 1978, ApJS, 38, 309
- Hunter et al. (2007) Hunter, I., Dufton, P. L., Smartt, S. J., et al. 2007, A&A, 466, 277
- Hunter et al. (2009) Hunter, I., Brott, I., Langer, N., et al. 2009, A&A, 496, 841
- Hut (1981) Hut, P. 1981, A&A, 99, 126
- Jerzykiewicz (1993) Jerzykiewicz, M. 1993, A&AS, 97, 421
- Jurkevich (1971) Jurkevich, I. 1971, Ap&SS, 13, 154
- Kaper et al. (1996) Kaper, L., Henrichs, H. F., Nichols, J. S., et al. 1996, A&AS, 116, 257
- Kambe et al. (1997) Kambe, E., Hirata, R., Ando, H., et al. 1997, ApJ, 481, 406
- Kendall et al. (1996) Kendall, T. R., Dufton, P. L., & Lennon, D. J. 1996, A&A, 310, 564
- Kilian (1992) Kilian, J. 1992, A&A, 262, 171
- Kilkenny & Hill (1975) Kilkenny, D., & Hill, P. W. 1975, MNRAS, 172, 649
- Kirsten et al. (2015) Kirsten, F., Vlemmings, W., Campbell, R. M., Kramer, M., & Chatterjee, S. 2015, A&A, 577, A111
- Koen & Eyer (2002) Koen, C., & Eyer, L. 2002, MNRAS, 331, 45
- Kraus et al. (2012) Kraus, S., Monnier, J. D., Che, X., et al. 2012, ApJ, 744, 19
- Kurtz & Mink (1998) Kurtz, M. J., & Mink, D. J. 1998, PASP, 110, 934
- Lafler & Kinman (1965) Lafler, J., & Kinman, T. D. 1965, ApJS, 11, 216
- Langer et al. (2008) Langer, N., Cantiello, M., Yoon, S.-C., et al. 2008, Massive Stars as Cosmic Engines, 250, 167
- Lanz & Hubeny (2003) Lanz, T., & Hubeny, I. 2003, ApJS, 146, 417
- Langer et al. (2003) Langer, N., Wellstein, S., & Petrovic, J. 2003, A Massive Star Odyssey: From Main Sequence to Supernova, 212, 275
- Lanz & Hubeny (2007) Lanz, T., & Hubeny, I. 2007, ApJS, 169, 83
- Lefever et al. (2010) Lefever, K., Puls, J., Morel, T., et al. 2010, A&A, 515, A74
- Lennon et al. (1991) Lennon, D. J., Dufton, P. L., Keenan, F. P., & Holmgren, D. E. 1991, A&A, 246, 175
- Lesh (1968) Lesh, J. R. 1968, ApJS, 17, 371
- Lozinskaya & Lyuty (1981) Lozinskaya, T. A., & Lyuty, V. M. 1981, Astronomicheskij Tsirkulyar, 1196, 1
- Lynds (1959) Lynds, C. R. 1959, ApJ, 130, 577
- Lyubimkov et al. (2004) Lyubimkov, L. S., Rostopchin, S. I., & Lambert, D. L. 2004, MNRAS, 351, 745
- Maeder (1995) Maeder, A. 1995, IAU Colloq. 155: Astrophysical Applications of Stellar Pulsation, 83, 1
- Maeder & Meynet (1996) Maeder, A., & Meynet, G. 1996, A&A, 313, 140
- Maeder et al. (2009) Maeder, A., Meynet, G., Ekström, S., & Georgy, C. 2009, Communications in Asteroseismology, 158, 72
- Maeder et al. (2014) Maeder, A., Przybilla, N., Nieva, M.-F., et al. 2014, A&A, 565, A39
- Maeder & Meynet (2015) Maeder, A., & Meynet, G. 2015, IAU Symposium, 307, 9
- Mahy et al. (2009) Mahy, L., Nazé, Y., Rauw, G., et al. 2009, A&A, 502, 937
- Mahy et al. (2013) Mahy, L., Rauw, G., De Becker, M., Eenens, P., & Flores, C. A. 2013, A&A, 550, A27
- Mahy et al. (2015) Mahy, L., Rauw, G., De Becker, M., Eenens, P., & Flores, C. A. 2015, A&A, 577, A23
- Maíz Apellániz et al. (2008) Maíz Apellániz, J., Alfaro, E. J., & Sota, A. 2008, arXiv:0804.2553
- Maíz Apellániz et al. (2011) Maíz Apellániz, J., Sota, A., Walborn, N. R., et al. 2011, Highlights of Spanish Astrophysics VI, 467
- Marcolino et al. (2009) Marcolino, W. L. F., Bouret, J.-C., Martins, F., et al. 2009, A&A, 498, 837
- Martins et al. (2005) Martins, F., Schaerer, D., & Hillier, D. J. 2005, A&A, 436, 1049
- Martins et al. (2012a) Martins, F., Escolano, C., Wade, G. A., et al. 2012a, A&A, 538, A29
- Martins et al. (2012b) Martins, F., Mahy, L., Hillier, D. J., & Rauw, G. 2012b, A&A, 538, A39
- Martins et al. (2015a) Martins, F., Hervé, A., Bouret, J.-C., et al. 2015a, A&A, 575, A34
- Martins et al. (2015b) Martins, F., Simón-Díaz, S., Palacios, A., et al. 2015b, A&A, 578, A109
- Mason et al. (1998) Mason, B. D., Gies, D. R., Hartkopf, W. I., et al. 1998, AJ, 115, 821
- Mason et al. (2004) Mason, B. D., Hartkopf, W. I., Wycoff, G. L., et al. 2004, AJ, 128, 3012
- Mason et al. (2009) Mason, B. D., Hartkopf, W. I., Gies, D. R., Henry, T. J., & Helsel, J. W. 2009, AJ, 137, 3358
- Mason et al. (2011) Mason, B. D., Hartkopf, W. I., & Wycoff, G. L. 2011, AJ, 141, 157
- Mayer et al. (1994) Mayer, P., Chochol, D., Hanna, M. A.-M. ., & Wolf, M. 1994, Contributions of the Astronomical Observatory Skalnate Pleso, 24, 65
- Mayer et al. (1998) Mayer, P., Hanna, M. A., Wolf, M., & Chochol, D. 1998, Ap&SS, 262, 163
- Mayer et al. (2014) Mayer, P., Drechsel, H., & Irrgang, A. 2014, A&A, 565, A86
- McSwain et al. (2007) McSwain, M. V., Boyajian, T. S., Grundstrom, E. D., & Gies, D. R. 2007, ApJ, 655, 473
- McSwain et al. (2010) McSwain, M. V., De Becker, M., Roberts, M. S. E., et al. 2010, AJ, 139, 857
- Meurs et al. (2005) Meurs, E. J. A., Fennell, G., & Norci, L. 2005, ApJ, 624, 307
- Meynet & Maeder (2000) Meynet, G., & Maeder, A. 2000, A&A, 361, 101
- Meynet et al. (2011) Meynet, G., Eggenberger, P., & Maeder, A. 2011, A&A, 525, L11
- Mokiem et al. (2005) Mokiem, M. R., de Koter, A., Puls, J., et al. 2005, A&A, 441, 711
- Morel et al. (2006) Morel, T., Butler, K., Aerts, C., Neiner, C., & Briquet, M. 2006, A&A, 457, 651
- Morel et al. (2008) Morel, T., Hubrig, S., & Briquet, M. 2008, A&A, 481, 453
- Morel (2011) Morel, T. 2011, Bulletin de la Societe Royale des Sciences de Liege, 80, 405
- Morgan et al. (1955) Morgan, W. W., Code, A. D., & Whitford, A. E. 1955, ApJS, 2, 41
- Morton (1975) Morton, D. C. 1975, ApJ, 197, 85
- Motch et al. (1998) Motch, C., Guillout, P., Haberl, F., et al. 1998, A&AS, 132, 341
- Muijres et al. (2012) Muijres, L. E., Vink, J. S., de Koter, A., Müller, P. E., & Langer, N. 2012, A&A, 537, A37
- Murphy (1969) Murphy, R. E. 1969, AJ, 74, 1082
- Nieva & Przybilla (2007) Nieva, M. F., & Przybilla, N. 2007, A&A, 467, 295
- Nieva & Przybilla (2008) Nieva, M. F., & Przybilla, N. 2008, A&A, 481, 199
- Nieva & Przybilla (2012) Nieva, M.-F., & Przybilla, N. 2012, A&A, 539, A143
- Nieva & Simón-Díaz (2011) Nieva, M.-F., & Simón-Díaz, S. 2011, A&A, 532, A2
- Packet (1981) Packet, W. 1981, A&A, 102, 17
- Palate & Rauw (2012) Palate, M., & Rauw, G. 2012, A&A, 537, A119
- Palate et al. (2013) Palate, M., Rauw, G., Koenigsberger, G., & Moreno, E. 2013, A&A, 552, A39
- Penny (1996) Penny, L. R. 1996, ApJ, 463, 737
- Peri et al. (2012) Peri, C. S., Benaglia, P., Brookes, D. P., Stevens, I. R., & Isequilla, N. L. 2012, A&A, 538, A108
- Petrovic et al. (2005a) Petrovic, J., Langer, N., Yoon, S.-C., & Heger, A. 2005a, A&A, 435, 247
- Petrovic et al. (2005b) Petrovic, J., Langer, N., & van der Hucht, K. A. 2005b, A&A, 435, 1013
- Philp et al. (1996) Philp, C. J., Evans, C. R., Leonard, P. J. T., & Frail, D. A. 1996, AJ, 111, 1220
- Piskunov & Valenti (2002) Piskunov, N. E., & Valenti, J. A. 2002, A&A, 385, 1095
- Plaskett & Pearce (1931) Plaskett, J. S., & Pearce, J. A. 1931, Publications of the Dominion Astrophysical Observatory Victoria, 5, 1
- Podsiadlowski et al. (1992) Podsiadlowski,P., Joss, P. C., & Hsu, J. J. L. 1992, ApJ, 391, 246
- Pols et al. (1991) Pols, O. R., Cote, J., Waters, L. B. F. M., & Heise, J. 1991, A&A, 241, 419
- Potter et al. (2012) Potter, A. T., Chitre, S. M., & Tout, C. A. 2012, MNRAS, 424, 2358
- Prinja et al. (1990) Prinja, R. K., Barlow, M. J., & Howarth, I. D. 1990, ApJ, 361, 607
- Proffitt & Quigley (2001) Proffitt, C. R., & Quigley, M. F. 2001, ApJ, 548, 429
- Przybilla et al. (2011) Przybilla, N., Nieva, M.-F., & Butler, K. 2011, Journal of Physics Conference Series, 328, 012015
- Puls et al. (1996) Puls, J., Kudritzki, R.-P., Herrero, A., et al. 1996, A&A, 305, 171
- Raucq et al. (2016) Raucq, F., Rauw, G., Gosset, E., et al. 2016, A&A, 588, A10
- Rauw et al. (2003) Rauw, G., De Becker, M., & Vreux, J.-M. 2003, A&A, 399, 287
- Rauw & De Becker (2004) Rauw, G., & De Becker, M. 2004, A&A, 421, 693
- Rauw et al. (2012) Rauw, G., Morel, T., & Palate, M. 2012, A&A, 546, A77
- Renson (1978) Renson, P. 1978, A&A, 63, 125
- Repolust et al. (2004) Repolust, T., Puls, J., & Herrero, A. 2004, A&A, 415, 349
- Repolust et al. (2005) Repolust, T., Puls, J., Hanson, M. M., Kudritzki, R.-P., & Mokiem, M. R. 2005, A&A, 440, 261
- Rivero González et al. (2012a) Rivero González, J. G., Puls, J., Najarro, F., & Brott, I. 2012, A&A, 537, A79
- Rivero González et al. (2012b) Rivero González, J. G., Puls, J., Massey, P., & Najarro, F. 2012, A&A, 543, A95
- Rivinius et al. (2013) Rivinius, T., Carciofi, A. C., & Martayan, C. 2013, A&A Rev., 21, 69
- Sana (2013) Sana, H. 2013, Astrophysics Source Code Library, 1309.003
- Sana et al. (2013) Sana, H., de Koter, A., de Mink, S. E., et al. 2013, A&A, 550, A107
- Sana et al. (2014) Sana, H., Le Bouquin, J.-B., Lacour, S., et al. 2014, ApJS, 215, 15
- Schmitt et al. (2014) Schmitt, J. H. M. M., Schröder, K.-P., Rauw, G., et al. 2014, Astronomische Nachrichten, 335, 787
- Schönberner et al. (1988) Schönberner, D., Herrero, A., Becker, S., et al. 1988, A&A, 197, 209
- Schwarzenberg-Czerny (1989) Schwarzenberg-Czerny, A. 1989, MNRAS, 241, 153
- Simón-Díaz et al. (2006) Simón-Díaz, S., Herrero, A., Esteban, C., & Najarro, F. 2006, A&A, 448, 351
- Simón-Díaz & Herrero (2007) Simón-Díaz, S., & Herrero, A. 2007, A&A, 468, 1063
- Simón-Díaz & Herrero (2014) Simón-Díaz, S., & Herrero, A. 2014, A&A, 562, A135
- Song et al. (2013) Song, H. F., Maeder, A., Meynet, G., et al. 2013, A&A, 556, A100
- Sota et al. (2011) Sota, A., Maíz Apellániz, J., Walborn, N. R., et al. 2011, ApJS, 193, 24
- Sota et al. (2014) Sota, A., Maíz Apellániz, J., Morrell, N. I., et al. 2014, ApJS, 211, 10
- Stankov & Handler (2005) Stankov, A., & Handler, G. 2005, ApJS, 158, 193
- Stellingwerf (1978) Stellingwerf, R. F. 1978, ApJ, 224, 953
- Stickland & Lloyd (2001) Stickland, D. J., & Lloyd, C. 2001, The Observatory, 121, 1
- Straižys & Laugalys (2007) Straižys, V., & Laugalys, V. 2007, Baltic Astronomy, 16, 167
- Tetzlaff et al. (2010) Tetzlaff, N., Neuhäuser, R., Hohle, M. M., & Maciejewski, G. 2010, MNRAS, 402, 2369
- Tetzlaff et al. (2011) Tetzlaff, N., Neuhäuser, R., & Hohle, M. M. 2011, MNRAS, 410, 190
- Tokovinin et al. (2010) Tokovinin, A., Mason, B. D., & Hartkopf, W. I. 2010, AJ, 139, 743
- Turner et al. (2008) Turner, N. H., ten Brummelaar, T. A., Roberts, L. C., et al. 2008, AJ, 136, 554
- Tylenda et al. (2011) Tylenda, R., Hajduk, M., Kamiński, T., et al. 2011, A&A, 528, A114
- Underhill & Gilroy (1990) Underhill, A. B., & Gilroy, K. K. 1990, ApJ, 364, 626
- van Buren & McCray (1988) van Buren, D., & McCray, R. 1988, ApJ, 329, L93
- van Leeuwen et al. (1997) van Leeuwen, F., Evans, D. W., Grenon, M., et al. 1997, A&A, 323, L61
- van Rensbergen et al. (1996) van Rensbergen, W., Vanbeveren, D., & De Loore, C. 1996, A&A, 305, 825
- Villamariz et al. (2002) Villamariz, M. R., Herrero, A., Becker, S. R., & Butler, K. 2002, A&A, 388, 940
- Villamariz & Herrero (2005) Villamariz, M. R., & Herrero, A. 2005, A&A, 442, 263
- Walborn (1973) Walborn, N. R. 1973, AJ, 78, 1067
- Walborn et al. (2011) Walborn, N. R., Maíz Apellániz, J., Sota, A., et al. 2011, AJ, 142, 150
- Whittaker & Robinson (1944) Whittaker, E. T., & Robinson, G. 1944, The calculus of observations; a treatise on numerical mathematics, by Whittaker, E. T.; Robinson, George. London, Blackie [1944],
- Williams et al. (2011) Williams, S. J., Gies, D. R., Hillwig, T. C., McSwain, M. V., & Huang, W. 2011, AJ, 142, 146
- Zahn (1975) Zahn, J.-P. 1975, A&A, 41, 329
- Zechmeister & Kürster (2009) Zechmeister, M., Kürster, M. 2009, A&A, 496, 577
Appendix A Journal of observations and radial velocities of our targets
Table 10 provides the journal of observations and RVs of our sample stars. The RVs taken from the literature are not included.
| Name | Instrument | Mid-exp. (HJD | RV |
| – 2,450,000 | [km s-1] | ||
| Slow rotators | |||
| HD 214680 | HEROS | 6561.713 | –7.30.5 |
| (10 Lac) | |||
| HD 46328 | HEROS | 7017.855 | 21.90.5 |
| ( CMa) | |||
| HD 57682 | HEROS | 6565.951 | 28.30.3 |
| 6644.722 | 24.90.3 | ||
| 6644.736 | 24.90.4 | ||
| 6667.769 | 27.70.4 | ||
| 6667.783 | 28.00.4 | ||
| HD 149438 | HEROS | 6685.022 | 3.00.7 |
| ( Sco) | 6685.022 | 3.30.7 | |
| Fast rotators | |||
| ALS 864 | MIKE | 4468.750 | 94.36.9 |
| ALS 18675 | MIKE | 4466.681 | 64.65.1 |
| BD +60$^∘$594 | ELODIE | 3682.540 | –50.94.7 |
| SOPHIE | 7267.549 | –14.68.9 | |
| BD +34$^∘$1058 | SOPHIE | 7267.617 | 41.211.7 |
| HD 13268 | ELODIE | 2238.280 | –87.97.6 |
| 3328.321 | –86.07.3 | ||
| AURELIE | 3286.512 | –110.3 7.1 | |
| 3289.595 | –112.0 6.9 | ||
| 3290.490 | –108.7 6.5 | ||
| 3294.634 | –110.0 6.6 | ||
| 3295.482 | –108.2 7.0 | ||
| 3295.672 | –107.4 7.0 | ||
| 3296.597 | –104.6 6.7 | ||
| 3648.620 | –114.7 6.7 | ||
| 3652.586 | –112.7 7.0 | ||
| 3654.456 | –107.8 7.0 | ||
| 3982.621 | –117.4 6.6 | ||
| 3984.575 | –121.3 7.4 | ||
| 4034.408 | –104.6 6.3 | ||
| 4034.466 | –103.5 7.0 | ||
| 4034.524 | –105.3 6.6 | ||
| 4034.585 | –110.1 6.4 | ||
| 4035.386 | –113.2 6.4 | ||
| 4396.369 | –99.5 6.7 | ||
| 4396.392 | –99.0 6.7 | ||
| 4396.414 | –98.5 6.8 | ||
| 4396.462 | –104.3 6.4 | ||
| 4396.484 | –102.8 6.8 | ||
| 4396.505 | –104.3 6.7 | ||
| 4396.551 | –103.7 6.5 | ||
| 4396.574 | –105.2 6.6 | ||
| 4396.595 | –106.6 6.2 | ||
| 4407.364 | –102.7 6.7 | ||
| 4407.381 | –100.8 6.8 | ||
| 4407.399 | –100.0 6.5 | ||
| 4407.418 | –100.1 6.9 | ||
| 4407.436 | –98.9 6.7 | ||
| 4407.454 | –97.3 7.2 | ||
| 4407.473 | –100.7 6.6 | ||
| 4407.490 | –98.8 6.5 | ||
| 4407.553 | –97.8 6.5 | ||
| 4407.570 | –98.7 6.8 | ||
| 4407.691 | –98.6 6.4 | ||
| 4421.613 | –96.2 6.9 | ||
| 4421.350 | –94.0 6.7 | ||
| 4421.370 | –95.1 6.5 | ||
| 4421.393 | –94.3 6.9 | ||
| 4421.433 | –96.2 6.9 | ||
| 4421.454 | –94.6 6.8 | ||
| 4421.475 | –91.9 6.7 | ||
| Name | Instrument | Mid-exp. (HJD | RV |
| – 2,450,000) | [km s-1] | ||
| HD 13268 | AURELIE | 4421.499 | –90.1 6.6 |
| 4421.549 | –94.3 6.4 | ||
| 4421.573 | –95.1 6.3 | ||
| 4421.598 | –91.0 6.8 | ||
| 4422.356 | –94.1 6.9 | ||
| 4422.373 | –100.0 7.1 | ||
| 4422.388 | –96.7 6.8 | ||
| 4422.402 | –95.5 6.5 | ||
| 4422.439 | –99.2 6.7 | ||
| 4422.454 | –96.5 6.5 | ||
| 4422.469 | –97.0 6.8 | ||
| 4422.484 | –97.4 6.8 | ||
| 4422.516 | –93.5 6.4 | ||
| 4422.533 | –92.3 6.9 | ||
| 4422.557 | –95.6 6.8 | ||
| 4422.570 | –94.9 6.5 | ||
| 4422.594 | –92.6 6.5 | ||
| 4422.608 | –92.2 6.2 | ||
| FIES | 5574.347 | –94.28.2 | |
| 6321.398 | –94.18.3 | ||
| 6322.390 | –90.98.0 | ||
| HD 14434 | AURELIE | 2916.489 | 0.313.7 |
| 2918.511 | –6.212.7 | ||
| 2919.538 | –21.413.3 | ||
| 2925.512 | –12.213.5 | ||
| 2925.570 | –21.115.0 | ||
| 2922.539 | –29.612.3 | ||
| ESPaDOnS | 6702.713 | –22.413.8 | |
| 6702.733 | –17.812.7 | ||
| 6702.754 | –18.112.7 | ||
| 6702.775 | –21.312.2 | ||
| 6708.720 | –27.613.1 | ||
| 6708.730 | –23.312.9 | ||
| 6708.761 | –23.313.6 | ||
| 6708.782 | –24.412.9 | ||
| SOPHIE | 7267.535 | –8.612.5 | |
| HD 14442 | AURELIE | 1375.584 | –52.112.6 |
| 1376.578 | –55.712.2 | ||
| 1377.574 | –52.212.0 | ||
| 1378.576 | –48.218.9 | ||
| 1379.597 | –38.612.8 | ||
| 1396.628 | –40.111.3 | ||
| 1397.627 | –61.612.4 | ||
| 1399.567 | –47.213.6 | ||
| 1402.568 | –61.413.6 | ||
| 1405.625 | –59.312.9 | ||
| 1408.619 | –40.311.8 | ||
| 1409.623 | –48.513.6 | ||
| 1810.614 | –53.012.0 | ||
| 1811.593 | –42.912.4 | ||
| 1812.613 | –59.811.8 | ||
| 1813.624 | –47.115.3 | ||
| 1814.615 | –57.311.3 | ||
| 1815.620 | –64.112.3 | ||
| 1819.634 | –47.913.0 | ||
| 1820.618 | –59.010.5 | ||
| 1821.581 | –49.712.6 |
| Name | Instrument | Mid-exp. (HJD | RV |
| – 2,450,000) | [km s-1] | ||
| HD 14442 | AURELIE | 2163.526 | –73.414.0 |
| 2163.550 | –72.215.6 | ||
| 2164.550 | –41.915.1 | ||
| 2164.572 | –41.415.1 | ||
| 2165.532 | –72.313.4 | ||
| 2165.555 | –71.313.4 | ||
| 2167.501 | –40.213.9 | ||
| 2167.526 | –44.413.2 | ||
| 2169.502 | –57.317.2 | ||
| 2169.535 | –50.318.3 | ||
| 2170.533 | –60.912.3 | ||
| 2170.555 | –60.412.4 | ||
| 2916.525 | –59.815.6 | ||
| 2918.470 | –53.313.8 | ||
| 2919.503 | –36.614.1 | ||
| 2923.474 | –75.614.0 | ||
| 2922.506 | –59.815.9 | ||
| HD 15137 | ELODIE | 3325.451 | –27.74.5 |
| FIES | 5148.663 | –40.64.7 | |
| 5814.603 | –18.63.7 | ||
| 6287.430 | –34.94.1 | ||
| HD 15642 | FIES | 5812.628 | –12.910.3 |
| 5815.652 | –13.49.5 | ||
| 6287.580 | –11.48.4 | ||
| HD 28446A | HEROS | 6560.966 | 10.18.2 |
| 6568.944 | 10.37.5 | ||
| 6644.622 | 7.39.7 | ||
| 6662.687 | 8.35.6 | ||
| 6672.588 | 4.45.3 | ||
| 6673.652 | 8.75.9 | ||
| 6674.683 | 11.110.6 | ||
| 6676.656 | 5.610.5 | ||
| (1 Cam A) | 6677.802 | 11.57.9 | |
| 6684.618 | 7.610.4 | ||
| 6693.633 | 5.77.8 | ||
| 6700.676 | 11.14.7 | ||
| 6707.570 | 12.74.8 | ||
| 6717.614 | 9.83.5 |
| Name | Instrument | Mid-exp. (HJD | RV |
| – 2,450,000) | [km s-1] | ||
| HD 41161 | ELODIE | 3330.687 | –18.46.1 |
| FIES | 4779.634 | –23.35.3 | |
| 5577.688 | –20.35.6 | ||
| 5815.715 | –16.45.5 | ||
| HEROS | 6563.745 | –22.04.8 | |
| 6574.779 | –23.05.9 | ||
| 6579.781 | –27.17.1 | ||
| 6580.758 | –22.66.5 | ||
| 6581.784 | –29.07.0 | ||
| 6592.701 | –22.36.7 | ||
| 6606.653 | –26.56.6 | ||
| 6640.593 | –32.08.0 | ||
| 6642.548 | –33.311.1 | ||
| 6643.574 | –31.811.5 | ||
| 6644.533 | –24.54.9 | ||
| 6646.577 | –30.09.4 | ||
| 6662.521 | –26.66.6 | ||
| 6663.401 | –25.68.2 | ||
| 6663.496 | –28.87.3 | ||
| 6675.535 | –26.36.3 | ||
| 6676.409 | –26.76.6 | ||
| 6688.408 | –29.410.5 | ||
| 6688.413 | –20.66.4 | ||
| 6690.452 | –20.95.3 | ||
| 6691.453 | –26.39.1 | ||
| 6692.462 | –30.46.9 | ||
| HD 41997 | ELODIE | 3683.515 | –19.26.9 |
| HD 46056 | ESPRESSO | 4545.673 | 31.15.4 |
| ESPaDOnS | 4809.072 | 28.75.3 | |
| 4809.083 | 28.75.5 | ||
| 4809.094 | 27.45.6 | ||
| 4809.103 | 28.85.4 | ||
| 4809.116 | 29.35.6 | ||
| 4809.126 | 30.05.4 | ||
| 4809.136 | 29.65.7 | ||
| 4809.148 | 29.65.7 | ||
| HD 46485 | ELODIE | 3683.640 | 10.77.3 |
| FEROS | 3740.629 | 28.46.1 | |
| HD 52266 | Boller & Chivens | 4942.495 | 10.84.8 |
| FEROS | 2656.728 | 13.65.1 | |
| 3739.610 | 20.24.9 | ||
| 4541.608 | 21.65.0 | ||
| 4956.528 | 25.84.9 | ||
| 5606.536 | 18.24.6 | ||
| 5641.579 | 25.04.4 | ||
| FIES | 5576.578 | 31.15.0 | |
| 6339.488 | 36.35.0 | ||
| HD 52533 | Boller & Chivens | 4942.502 | 24.411.1 |
| CORALIE | 7443.627 | 126.310.8 | |
| FEROS | 2657.743 | 88.213.1 | |
| 4953.481 | 23.69.3 | ||
| FIES | 5576.625 | 149.515.8 | |
| 6339.500 | 33.29.23 | ||
| MIKE | 4109.658 | 116.810.8 | |
| HD 53755 | UCLES | 3776.992 | 34.66.6 |
| (V 569 Mon) |
| Name | Instrument | Mid-expo. (HJD | RV |
| – 2,450,000) | [km s-1] | ||
| HD 66811 | ESPaDOnS | 5971.798 | –10.63.9 |
| ( Pup) | 6701.928 | –4.44.0 | |
| HD 69106 | Boller & Chivens | 5646.564 | 8.24.9 |
| CORALIE | 7443.743 | 14.15.3 | |
| 7447.562 | 26.95.4 | ||
| 7501.568 | 4.95.5 | ||
| ESPaDOnS | 5937.013 | 1.012.0 | |
| 5937.033 | 19.95.9 | ||
| 5937.053 | 21.55.8 | ||
| 5937.073 | 20.26.0 | ||
| HD 74920 | Boller & Chivens | 5647.584 | 14.74.7 |
| CORALIE | 7441.634 | 14.54.7 | |
| 7443.774 | 12.74.6 | ||
| 7447.575 | 10.44.7 | ||
| HD 84567 | CORALIE | 7441.542 | 36.44.6 |
| 7536.585 | 0.44.7 | ||
| HD 90087 | FEROS | 4955.528 | –7.52.5 |
| 6098.524 | –1.42.3 | ||
| HD 92554 | CORALIE | 7536.608 | –56.56.9 |
| 7536.640 | –61.26.9 | ||
| HD 93521 | ELODIE | 3123.414 | 5.013.2 |
| 3126.377 | 8.512.9 | ||
| 3126.400 | 18.612.9 | ||
| 3126.423 | 16.912.5 | ||
| 3126.446 | 6.513.5 | ||
| 3126.471 | 5.614.9 | ||
| 3126.556 | 5.520.4 | ||
| 3127.322 | 5.313.5 | ||
| 3127.345 | 10.915.3 | ||
| 3127.367 | 15.214.7 | ||
| 3127.390 | 11.813.7 | ||
| 3127.413 | –1.713.7 | ||
| 3127.435 | 2.513.5 | ||
| 3127.458 | –3.413.3 | ||
| 3127.480 | 4.012.6 | ||
| 3127.516 | 22.919.3 | ||
| 3127.539 | 16.715.8 | ||
| 3128.411 | 6.313.3 | ||
| 3128.446 | 1.613.9 | ||
| 3128.468 | 7.915.6 | ||
| HEROS | 6671.803 | –0.412.6 | |
| 6671.825 | 4.711.4 | ||
| SOPHIE | 5517.710 | 13.311.0 | |
| HD 102415 | CORALIE | 7536.723 | –45.611.7 |
| FEROS | 4599.689 | –11.712.3 | |
| 4627.648 | –10.712.1 | ||
| 5698.689 | –35.212.7 | ||
| 5699.730 | –30.712.7 | ||
| HD 117490 | FEROS | 4627.675 | 6.419.8 |
| 4600.665 | 7.518.9 | ||
| 5696.780 | 12.219.2 | ||
| 5697.686 | 9.718.8 | ||
| 6068.667 | 11.818.9 | ||
| 7115.784 | 8.119.8 | ||
| 7116.650 | 7.919.9 | ||
| 7118.995 | 11.919.0 | ||
| HD 124979 | FEROS | 6067.740 | –71.42.4 |
| 6098.632 | –76.31.6 | ||
| HD 149757 | ELODIE | 976.454 | 15.28.6 |
| ( Oph) | FEROS | 4955.716 | –10.96.9 |
| HARPS | 5979.400 | –6.06.8 | |
| HD 150574 | FEROS | 4599.773 | –36.810.0 |
| 4627.692 | –38.29.9 |
| Name | Instrument | Mid-expo. [(HJD | RV |
| – 2,450,000) | [km s-1] | ||
| HD 163892 | CORALIE | 7441.865 | 55.12.6 |
| 7530.880 | –34.82.3 | ||
| 7536.832 | 15.42.2 | ||
| FEROS | 3546.882 | 30.63.5 | |
| 4600.887 | –49.03.5 | ||
| 4626.849 | –1.53.0 | ||
| 4953.925 | –50.03.0 | ||
| 4954.871 | –30.83.1 | ||
| 4955.725 | –6.33.0 | ||
| 4956.801 | 24.03.3 | ||
| 4976.843 | –48.13.0 | ||
| 5697.813 | –53.63.3 | ||
| 6059.816 | –25.53.0 | ||
| 6067.906 | –18.53.0 | ||
| 6097.845 | –50.02.7 | ||
| FIES | 5812.354 | 26.72.3 | |
| 5816.380 | –39.52.8 | ||
| HD 172367 | SOPHIE | 7267.332 | –4.56.0 |
| HD 175876 | FEROS | 3546.941 | 0.27.9 |
| 3856.895 | 4.28.2 | ||
| 3912.913 | 3.77.4 | ||
| 3913.923 | 9.78.3 | ||
| 3914.907 | 2.38.0 | ||
| 4625.932 | –2.28.7 | ||
| 4625.938 | –2.88.7 | ||
| 4626.935 | 8.68.2 | ||
| 4626.956 | 6.68.4 | ||
| 5698.950 | 6.78.4 | ||
| 6067.955 | 1.88.0 | ||
| CORALIE | 7529.925 | 16.69.9 | |
| HD 184915 | FIES | 5448.350 | –7.95.1 |
| 6468.611 | –12.44.2 | ||
| 6468.608 | –13.34.6 | ||
| 6468.614 | –14.75.9 | ||
| HEROS | 6569.659 | –12.22.6 | |
| ( Aql) | 6787.970 | –9.43.7 | |
| 6792.953 | –13.93.9 | ||
| SOPHIE | 7267.384 | –7.97.5 | |
| HD 188439 | FIES | 5812.552 | –76.36.6 |
| 6468.500 | –77.58.2 | ||
| 6468.504 | –76.97.9 | ||
| 6468.506 | –78.18.2 | ||
| HEROS | 6568.744 | –69.46.1 | |
| 6795.941 | –78.512.2 | ||
| (V 819 Cyg) | 6798.944 | –67.77.2 | |
| 6810.915 | –75.17.6 | ||
| 6820.907 | –75.87.8 | ||
| SOPHIE | 7267.389 | –78.96.7 |
| Name | Instrument | Mid-exp. (HJD | RV |
| – 2,450,000) | [km s-1] | ||
| HD 191423 | Albireo | 5014.482 | 38.521.4 |
| AURELIE | 4711.496 | –34.820.3 | |
| 4712.551 | –23.620.2 | ||
| 4717.444 | –27.220.6 | ||
| 4718.588 | –18.321.8 | ||
| 4743.328 | –30.220.4 | ||
| 5418.419 | –28.020.6 | ||
| 5421.593 | –25.020.1 | ||
| ELODIE | 3247.311 | –31.419.0 | |
| 3247.322 | –27.719.6 | ||
| ESPRESSO | 4986.858 | –12.925.1 | |
| 4991.939 | –42.327.2 | ||
| FIES | 5802.562 | –14.322.8 | |
| 5815.547 | –14.720.9 | ||
| HD 192281 | AURELIE | 1065.387 | –42.38.8 |
| 1065.387 | –45.78.7 | ||
| 1067.390 | –44.89.0 | ||
| 1069.386 | –42.49.4 | ||
| 1071.396 | –31.98.5 | ||
| 1073.364 | –37.68.4 | ||
| 1373.422 | –47.87.2 | ||
| 1374.448 | –41.77.5 | ||
| 1375.366 | –36.77.5 | ||
| 1376.357 | –45.88.6 | ||
| 1377.369 | –41.88.0 | ||
| 1378.367 | –29.69.3 | ||
| 1379.406 | –33.27.9 | ||
| 1399.532 | –39.28.1 | ||
| 1404.461 | –41.97.8 | ||
| 1406.557 | –53.08.3 | ||
| 1407.457 | –39.08.0 | ||
| 1410.513 | –42.714.2 | ||
| 2163.430 | –29.87.5 | ||
| 2164.416 | –39.17.1 | ||
| 2164.430 | –39.87.0 | ||
| 2165.395 | –40.17.7 | ||
| (V 2011 Cyg) | 2165.410 | –40.68.0 | |
| 2167.418 | –43.07.5 | ||
| 2167.432 | –41.77.7 | ||
| 2168.415 | –43.29.2 | ||
| 2168.436 | –48.28.6 | ||
| 2168.464 | –48.38.3 | ||
| 2169.421 | –39.27.7 | ||
| 2169.444 | –37.87.4 | ||
| 2170.387 | –42.87.3 | ||
| 2170.409 | –45.67.9 | ||
| 2918.427 | –42.38.4 | ||
| 2919.450 | –46.48.0 | ||
| 2923.383 | –44.57.5 | ||
| 2925.460 | –34.47.5 | ||
| 2922.446 | –44.27.4 | ||
| ELODIE | 1733.604 | –40.37.4 | |
| 1800.345 | –45.113.4 | ||
| 3246.417 | –34.47.6 | ||
| 3600.453 | –40.67.8 | ||
| SOPHIE | 7267.400 | –30.97.9 |
| Name | Instrument | Mid-exp. (HJD | RV |
| – 2,450,000) | [km s-1] | ||
| HD 198781 | HEROS | 6568.690 | –17.07.3 |
| 6580.597 | –10.17.4 | ||
| 6592.576 | –22.07.9 | ||
| 6860.864 | –26.77.1 | ||
| 6860.885 | –25.56.9 | ||
| HD 203064 | ESPaDOnS | 6200.773 | 32.68.0 |
| FIES | 4779.428 | 6.79.4 | |
| 5812.582 | 25.58.4 | ||
| 6285.318 | 31.38.7 | ||
| NARVAL | 4086.329 | 23.99.1 | |
| (68 Cyg) | 4354.542 | 9.38.3 | |
| 4358.413 | 9.59.0 | ||
| 4417.275 | 44.58.9 | ||
| HD 210839 | ESPaDOnS | 3605.079 | –55.68.1 |
| NARVAL | 4083.316 | –54.27.6 | |
| 5371.550 | –60.57.6 | ||
| 5385.588 | –55.87.5 | ||
| 5784.532 | –57.87.1 | ||
| ( Cep) | 5801.577 | –56.37.8 | |
| 5802.543 | –61.67.9 | ||
| SOPHIE | 7256.476 | –43.57.4 | |
| HD 228841 | SOPHIE | 7267.431 | –62.39.8 |
Appendix B Diagnostic lines used for the CNO abundance determinations with CMFGEN
Table 11 gives the spectral lines used to derive the carbon, nitrogen, and oxygen abundances with CMFGEN.
| Line | BD | HD | |||||||||||
| +34∘1058 | 13268 | 14434 | 14442 | 15137 | 15642 | 41161 | 41997 | 46056 | 46485 | 66811 | 69106 | 74920 | |
| C II 4267 | |||||||||||||
| C III 4068–70 | |||||||||||||
| C III 4153 | |||||||||||||
| C III 4156 | |||||||||||||
| C III 4163 | |||||||||||||
| C III 4187 | |||||||||||||
| C III 4325 | |||||||||||||
| C III 4666 | |||||||||||||
| C III 5246 | |||||||||||||
| C III 5272 | |||||||||||||
| C III 5353 | |||||||||||||
| C III 5826 | |||||||||||||
| C III 6205 | |||||||||||||
| Line | HD | ||||||||||||
| 92554 | 102415 | 117490 | 124979 | 149757 | 150574 | 163892 | 175876 | 191423 | 192281 | 203064 | 210839 | 228841 | |
| C II 4267 | |||||||||||||
| C III 4068–70 | |||||||||||||
| C III 4153 | |||||||||||||
| C III 4156 | |||||||||||||
| C III 4163 | |||||||||||||
| C III 4187 | |||||||||||||
| C III 4325 | |||||||||||||
| C III 4666 | |||||||||||||
| C III 5246 | |||||||||||||
| C III 5272 | |||||||||||||
| C III 5353 | |||||||||||||
| C III 5826 | |||||||||||||
| C III 6205 | |||||||||||||
| Line | BD | HD | |||||||||||
|---|---|---|---|---|---|---|---|---|---|---|---|---|---|
| +34∘1058 | 13268 | 14434 | 14442 | 15137 | 15642 | 41161 | 41997 | 46056 | 46485 | 66811 | 69106 | 74920 | |
| N II 3995 | |||||||||||||
| N III 4004 | |||||||||||||
| N IV 4058 | |||||||||||||
| N III 4095 | |||||||||||||
| N III 4196 | |||||||||||||
| N III 4216 | |||||||||||||
| N II 4447 | |||||||||||||
| N III 4511 | |||||||||||||
| N III 4515 | |||||||||||||
| N III 4518 | |||||||||||||
| N III 4524 | |||||||||||||
| N III 4535 | |||||||||||||
| N II 4602 | |||||||||||||
| N II 4607 | |||||||||||||
| N II 4613 | |||||||||||||
| N III 4634–4643 | |||||||||||||
| N II 4788 | |||||||||||||
| N III 4907 | |||||||||||||
| N II 4995 | |||||||||||||
| N II 5001 | |||||||||||||
| N II 5005 | |||||||||||||
| N II 5011 | |||||||||||||
| N IV 5200 | |||||||||||||
| N IV 5204 | |||||||||||||
| Line | HD | ||||||||||||
|---|---|---|---|---|---|---|---|---|---|---|---|---|---|
| 92554 | 102415 | 117490 | 124979 | 149757 | 150574 | 163892 | 175876 | 191423 | 192281 | 203064 | 210839 | 228841 | |
| N II 3995 | |||||||||||||
| N III 4004 | |||||||||||||
| N IV 4058 | |||||||||||||
| N III 4095 | |||||||||||||
| N III 4196 | |||||||||||||
| N III 4216 | |||||||||||||
| N II 4447 | |||||||||||||
| N III 4511 | |||||||||||||
| N III 4515 | |||||||||||||
| N III 4518 | |||||||||||||
| N III 4524 | |||||||||||||
| N III 4535 | |||||||||||||
| N II 4602 | |||||||||||||
| N II 4607 | |||||||||||||
| N II 4613 | |||||||||||||
| N III 4634–4643 | |||||||||||||
| N II 4788 | |||||||||||||
| N III 4907 | |||||||||||||
| N II 4995 | |||||||||||||
| N II 5001 | |||||||||||||
| N II 5005 | |||||||||||||
| N II 5011 | |||||||||||||
| N IV 5200 | |||||||||||||
| N IV 5204 | |||||||||||||
| Line | BD | HD | |||||||||||
| +34∘1058 | 13268 | 14434 | 14442 | 15137 | 15642 | 41161 | 41997 | 46056 | 46485 | 66811 | 69106 | 74920 | |
| O II 3792 | |||||||||||||
| O II 3913 | |||||||||||||
| O II 3955 | |||||||||||||
| O II 3963 | |||||||||||||
| O II 4277–78 | |||||||||||||
| O II 4284 | |||||||||||||
| O II 4305 | |||||||||||||
| O II 4318 | |||||||||||||
| O II 4321 | |||||||||||||
| O II 4368 | |||||||||||||
| O II 4416 | |||||||||||||
| O II 4418 | |||||||||||||
| O II 4592 | |||||||||||||
| O II 4597 | |||||||||||||
| O II 4603 | |||||||||||||
| O II 4611 | |||||||||||||
| O II 4663 | |||||||||||||
| O II 4678 | |||||||||||||
| O II 4700 | |||||||||||||
| O II 4707 | |||||||||||||
| Line | HD | ||||||||||||
| 92554 | 102415 | 117490 | 124979 | 149757 | 150574 | 163892 | 175876 | 191423 | 192281 | 203064 | 210839 | 228841 | |
| O II 3792 | |||||||||||||
| O II 3913 | |||||||||||||
| O II 3955 | |||||||||||||
| O II 3963 | |||||||||||||
| O II 4277–78 | |||||||||||||
| O II 4284 | |||||||||||||
| O II 4305 | |||||||||||||
| O II 4318 | |||||||||||||
| O II 4321 | |||||||||||||
| O II 4368 | |||||||||||||
| O II 4416 | |||||||||||||
| O II 4418 | |||||||||||||
| O II 4592 | |||||||||||||
| O II 4597 | |||||||||||||
| O II 4603 | |||||||||||||
| O II 4611 | |||||||||||||
| O II 4663 | |||||||||||||
| O II 4678 | |||||||||||||
| O II 4700 | |||||||||||||
| O II 4707 | |||||||||||||
Appendix C Binary and runaway status
We determined the multiplicity status of our targets using our own RV measurements (Table 10) complemented with literature information. Whenever possible, new or improved orbital elements are presented (Table 12).
Table 13 summarises the detection status of visual companion(s) in the close vicinity of our targets, when available. The widely different field of view and sensitivity in terms of magnitude differences and angular separations may explain why some close companions are detected in some surveys, but not in others. It should be noted that the presence of such companions is not reflected in RV variations, considering our error bars, as they are too distant.
C.1 ALS 864
There is only a little information about this object in the literature and only one spectrum is available in our dataset. Therefore, we could not assess its multiplicity.
C.2 ALS 18675
The literature provides no additional information and we have only one spectrum of this object, hence its multiplicity status cannot be established.
C.3 BD +60$^∘$594
Hillwig et al. (2006) claimed that this star is probably a single-lined spectroscopic binary with an orbital period of the order of 20 days. Indeed, Conti et al. (1977) gave a RV value of –50 km s-1, while Hillwig et al. (2006) quoted decreasing RVs (from –60 to –110 km s-1) on a timescale of 4 d. Our measurements further yield 51 and 15 km s-1. Accordingly, we classify this star as RV variable.
C.4 BD +34$^∘$1058
As we have only a single spectrum of this star and no additional RV measurements are available in the literature, therefore, we cannot assess its multiplicity status.
C.5 HD 13268
Low-amplitude, short-term (a few hours) periodic line-profile variations have been detected by De Becker et al. (2008). They attributed these variations to non-radial pulsations or structures associated with material in the circumstellar environment. Bekenstein & Bowers (1974) further suggested that this star is a runaway with a peculiar velocity greater than 89 km s-1 and Kendall et al. (1996) proposed that it was ejected from within Per OB1.
The variability test indicates no significant variation of the RVs in our dataset, but variations are clearly detected when literature values are added. Indeed, all recent RVs (HJD ¿ 2,450,000) fall inside the interval to km s-1, while much older data (HJD 2,440,500; Abt et al. 1972) provide RVs typically ranging from to km s-1. As there are 78 RV measurements in total, we attempted a period determination. A search performed on all or only the recent data yields no clear periodicity, simply favouring variations occurring on long timescales, hence we thus simply – and tentatively – classify the star as RV variable.
C.6 HD 14434
Significant line-profile variability of the He II 4686 double-peaked emission and the H absorption line has been reported by De Becker & Rauw (2004), but we found no significant RV variation for this star, even when considering literature values (Conti et al., 1977). Hence we classify it as presumably single.
C.7 HD 14442
Significant line-profile variability of the He II 4686 double-peaked emission and of the H absorption line has been interpreted as co-rotating features formed in the wind (De Becker & Rauw, 2004). In our data, we found no significant RV variation so we classify HD 14442 as presumably single.
C.8 HD 15137
HD 15137 is a known runaway with a peculiar space velocity = 62.711.8 km s-1 (McSwain et al., 2007). This star was proposed to be an SB1 system that was probably expelled from the open cluster NGC 654 (Boyajian et al., 2005). The high eccentricity of the system ( 0.5) can be explained by the widening of the orbit during the supernova event that also imparted the velocity kick. The mass of the companion star must be low (1.4 M M⊙; McSwain et al., 2010), as indicated by the mass function of the system. It may also be noted that this system is a faint X-ray emitter, although it could still be a high mass X-Ray binary (HMXB) with a very low accretion rate (Boyajian et al., 2005).
We re-investigated the system with our dataset, complemented by literature data (Conti et al. 1977; Boyajian et al. 2005; McSwain et al. 2007, 2010) and found evidence for significant RV variations. An error of 8.5 km s-1 is considered for RV values from McSwain et al. (2007) and Boyajian et al. (2005), as in McSwain et al. (2010). Analysing the RVs with period search algorithms yields, however, no clear periodicity, simply favouring variations occurring on long timescales; we do not find significant peaks at the periods proposed by these authors. Furthermore, when we fold all data with the 28.61 d period of Boyajian et al. (2005), the RVs appear scattered. Folding them with the 55.40 d period of McSwain et al. (2010) results in slightly more coherent variations, although no convincing peak is seen in the periodograms at this orbital period. Therefore, we simply classify the star as RV variable. Eliminating the oldest data point (HJD = 2,440,074.970; Conti et al. 1977) does not modify our conclusions.
C.9 HD 15642
Our RVs do not show any significant variations and no other information is available in the literature. Therefore, we classify this star as presumably single.
C.10 HD 28446A
HD 28446 was first suggested to be a spectroscopic binary by Frost et al. (1926). In this context, Plaskett & Pearce (1931) claimed that HD 28446 is an SB2 with a large velocity amplitude ( 140 km s-1). However, the spectra of Mayer et al. (1994) show no trace of a secondary and these authors only found a RV variability with a period of 1.3 d. More recently, Straižys & Laugalys (2007) suggested that HD 28446 is a triple system with three visual components surrounded by a H II region of 1.5–2∘ diameter, while Eggleton & Tokovinin (2008) found only two components separated by 10 For our HEROS observations, we made sure that the brightest component of this system was observed (HD 28446A).
Jerzykiewicz (1993) reported small variations in the photometric data of HD 28446A, which is consistent with a period of 0.22132 day and suggesting a Cephei nature for this star. Stankov & Handler (2005) rather proposed it to be a slowly pulsating B star (SPB). Our RVs do not significantly vary, but when combined with literature values (Mayer et al., 1998), evidence for variability is found. Period searches on the full RV set yield peaks near 1.5 or 3 d, with numerous close aliases. Phasing the RVs with such periods yields a noisy RV curve with variation amplitude of 10 km s-1. It must, however, be noted that Mayer’s values appear mostly below ours with an offset of 20 km s-1 between both datasets. Furthermore, the existence of line-profile variations arising from the non-radial pulsations and the possible presence of a gravitationally bound tertiary might lead to such noisy RV curves. Therefore, more data are needed to clarify the source of the RV variations. We thus refrain from calculating an orbital solution, simply classifying the star as RV variable.
C.11 HD 41161
HD 41161 is a runaway star located about 355 pc above the Galactic plane (de Wit et al., 2005). It is also a bow shock candidate (Peri et al., 2012).
Significant RV changes are found when all data (our work + literature; Conti et al. 1977; Garmany et al. 1980) are combined, with a maximum RV difference of 35 km s-1 (corresponding to a 5 variation). All periodograms have some peaks around a period of 3 d – the best Fourier value is d (Fig. 11). The period error is certainly underestimated. In fact, there are numerous close aliases of that period because the data consist of widely separated observing blocks. The amplitude of the variations, however, is very small, i.e. only 6 km s-1. This is not formally significant since peaks with this amplitude are typically found in periodograms calculated based on Monte Carlo simulations (using only the observing dates and noise). Besides, such a small amplitude could arise from line-profile variations, and we thus do not attempt to calculate an orbital solution, waiting for more data taken with a more appropriate sampling, to solve the issue. In the meantime, we classify this object as RV variable.
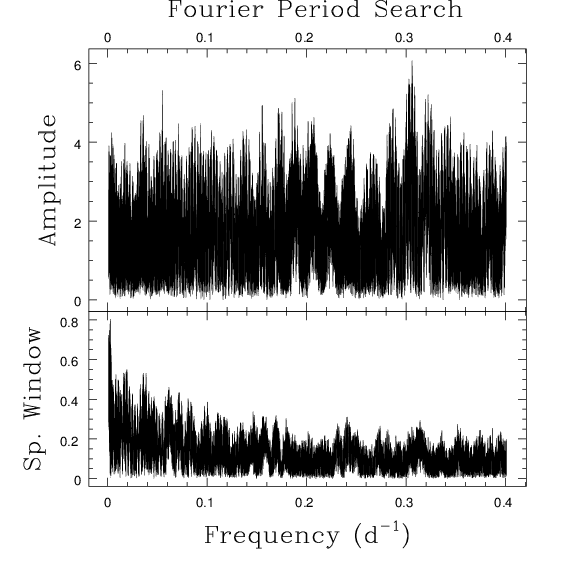
C.12 HD 41997
HD 41997 is a runaway star with a peculiar RV of –40 km s-1 (Carrasco & Creze, 1978). Only one spectrum is available for this star and no further RV measurements are available in the literature, so its multiplicity cannot be assessed.
C.13 HD 46056
HD 46056 was suggested to be an SB1 (Walborn, 1973; Underhill & Gilroy, 1990). Mahy et al. (2009) rather found it to be single. These authors noticed variations of the line profiles, which could have led to a spurious detection of RV changes. In line with this result, we do not find any significant RV variation in the ESPaDOnS and ESPRESSO spectra, and we thus classify this star as presumably single. Feast et al. (1957) observed a large RV variation (from –21 to +65 km s-1), but this needs to be confirmed because of the low precision of measurements on photographic plates.
C.14 HD 46485
We find a RV difference of 20 km s-1 between our two spectra of this star, which are separated by about two months. A similar difference was reported by Feast et al. (1957) over two years. However, it corresponds only to a 1.9 variation, which is not significant. Therefore, we classify this star as presumably single. Adding a value from Conti et al. (1977) does not change this multiplicity status (maximum RV difference of 27 km s-1 corresponding to a 3.5 variation).
C.15 HD 52266
The peculiar velocity of HD 52266 is not very large (19.49.0 km s-1) and it is thus presumably not a runaway star (McSwain et al., 2007). McSwain et al. (2007) further suggested that HD 52266 is likely an SB1 system, but they could not determine an orbital period. They only constrained it to be longer than the time span of their data (i.e. RV variation from 12 to 39 km s-1 over 40 days). We obtained many additional observations and our RV measurements span the range 14–36 km s-1, confirming previous results. The RV changes are found to be significant when all data (our work + literature; Conti et al. 1977; McSwain et al. 2007) are combined. We decided to search for a period and a clear signal was found: d for the modified Fourier algorithm (Fig. 12). The associated semi-amplitude is moderate (13 km s-1) and the period error is certainly underestimated; there are numerous close aliases of that period because the data consist of widely separated observing blocks. Adopting the period mentioned above, we nevertheless derived an orbital solution with LOSP (see Table 12 and Fig. 13). We caution, however, that the sampling is far from perfect, implying that this solution is still preliminary and requires confirmation.
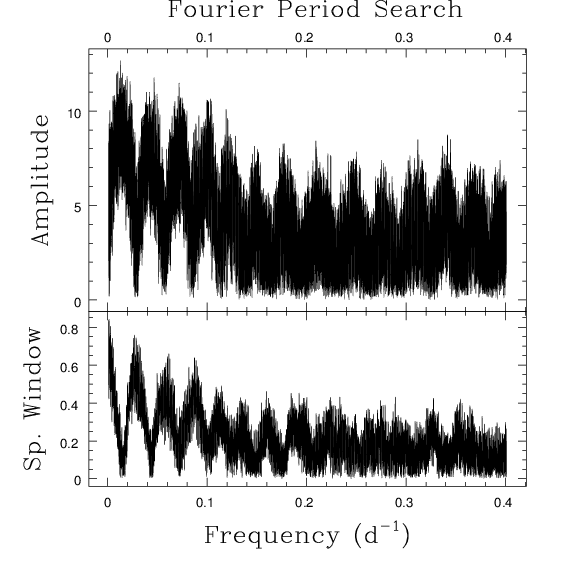
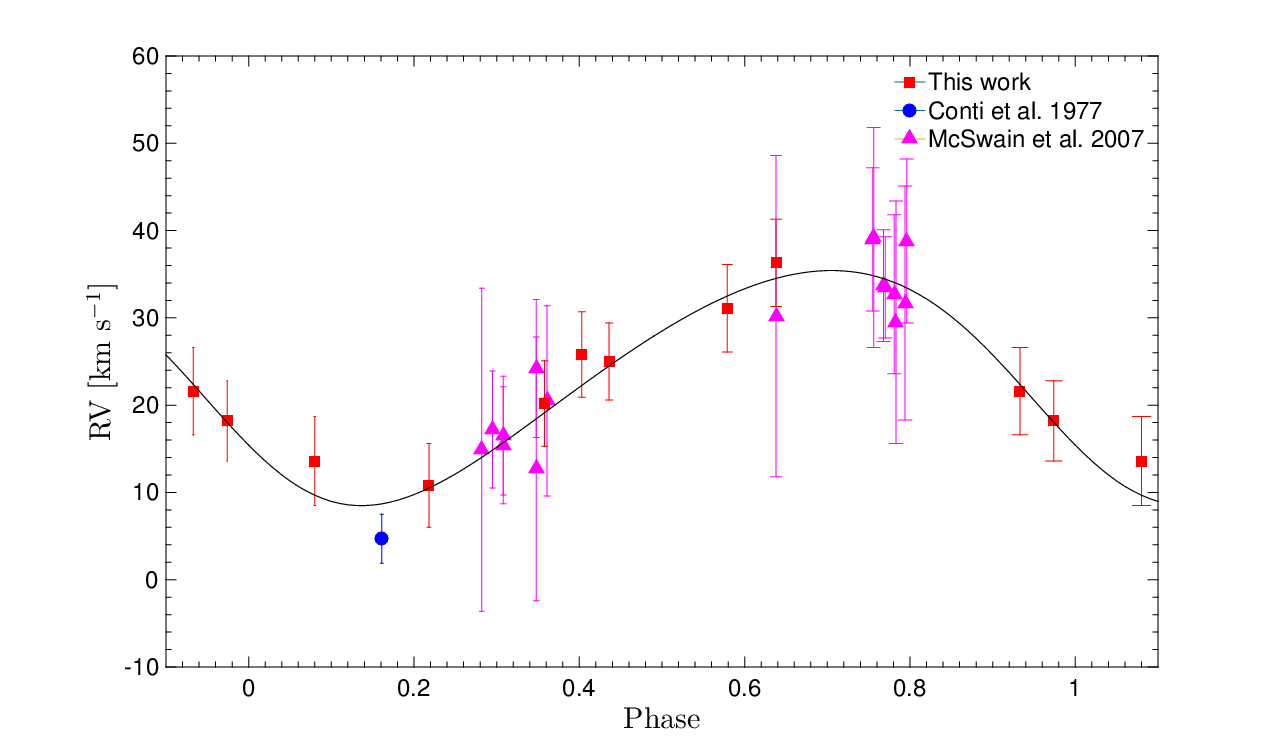
C.16 HD 52533
Gies & Bolton (1986) found an SB1 solution for HD 52533 with a 3.29 d period, while McSwain et al. (2007) suggested that it might be an SB3. The He II lines would originate from the primary O star, while a distant B companion would contribute to He I and Balmer line profiles. McSwain et al. (2007) found a period of 22.18610.0002 d from the lines associated with the O star, while the B-star lines appeared stationary. In addition, the peculiar velocity of HD 52533 is 47.027.9 km s-1, suggesting that it might be a runaway star (McSwain et al., 2007). In this context, the invisible companion of the O star could be a compact object, but its X-ray emission is typical of that of single O stars (Motch et al., 1998). A modest accretion rate could render the presence of a compact companion undetectable, however (Meurs et al., 2005). A search for radio emission originating from a pulsar was unsuccessful (Philp et al., 1996).
Our RV values, which are significantly variable, indicate a phase shift relative to McSwain et al. (2007) ephemeris. This leads us to recalculate an orbital solution, adding values from literature (Conti et al. 1977; D.R. Gies 2006 – private communication, although these values were also used in McSwain et al. 2007). To this aim, we first use period search algorithms and found d (Fig. 14; again, because of the imperfect sampling with long intervals without observations, the period error is certainly underestimated). The large amplitude of this peak makes it highly significant (significance level SL%). Using this period as first guess, we then derived an orbital solution thanks to the LOSP programme (Table 12). This solution, illustrated in Fig. 15, agrees well with that of McSwain et al. (2007), but it would certainly be improved by collecting data with a better phase coverage.
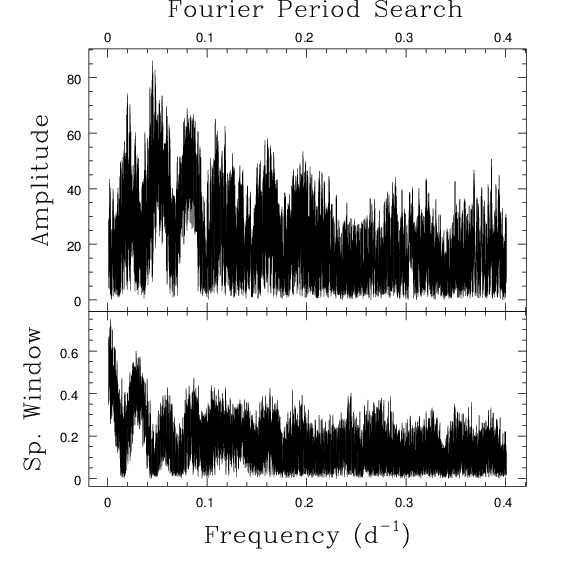
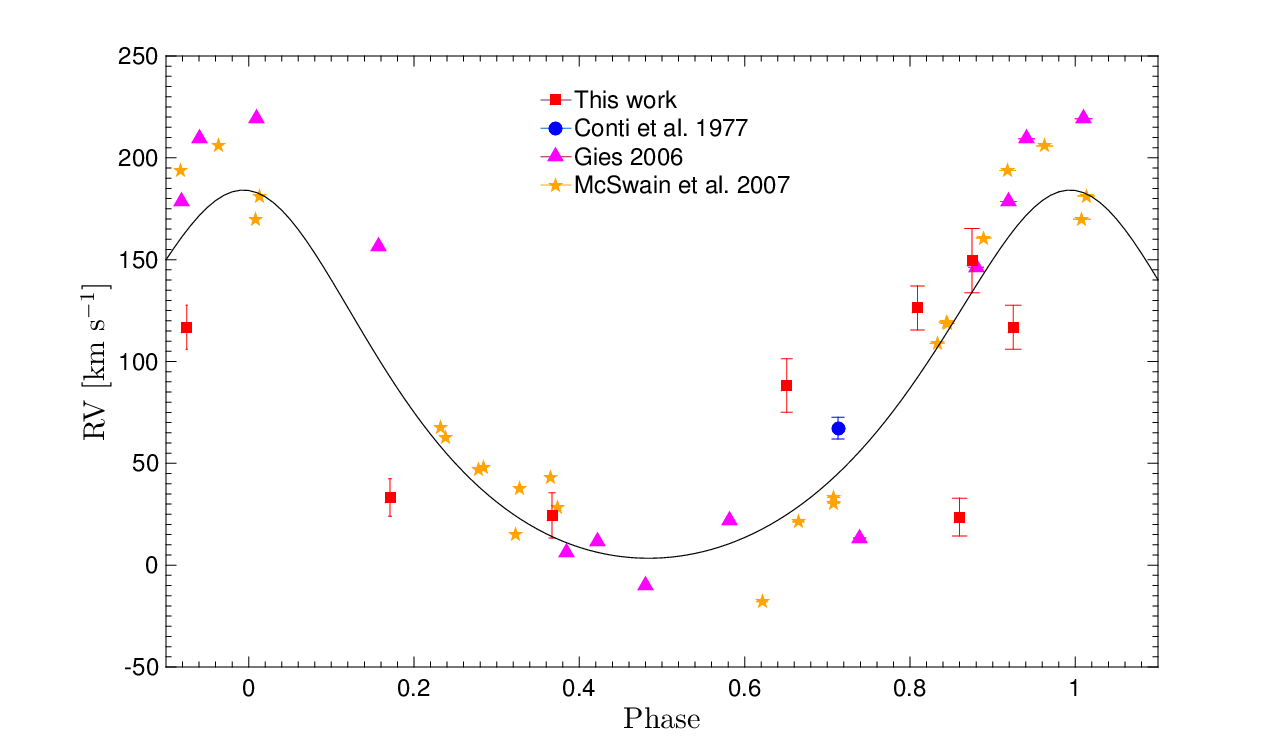
C.17 HD 53755
HD 53755 is a candidate Cephei according to Stankov & Handler (2005). Our sole UCLES spectrum of HD 53755, along with the lack of other RV measurements in the literature, does not allow us to investigate the multiplicity of this star.
C.18 HD 66811
This star is a runaway with a peculiar RV of km s-1 (Carrasco & Creze, 1978). The RVs derived in our two spectra separated by about two years appear compatible within the error bars, but those reported by Garmany et al. (1980) range from –11 to –28 km s-1, which leads to a maximum RV difference of 24 km s-1 corresponding to 3.5; the RV changes are thus only on the verge of being significant. Therefore, in view of current data, we are forced to keep a presumably single status for this star.
C.19 HD 69106
Feast et al. (1957) noticed that two Balmer lines (H and H) were double on one photographic plate, but no further study of this object was performed since then. In our data, we see no doubling of the lines and detect a maximum RV difference of 26 km s-1, corresponding only to a 2.9 variation. Feast et al. (1957) provided additional RV measurements that are all in agreement with our data except one discrepant point at –31 km s-1. Without further information, we discard this value as outlier and we tentatively classify the star as presumably single.
C.20 HD 74920
We found no significant RV variation for this star in our data. Hence we classify it as presumably single.
C.21 HD 84567
HD 84567 is a runaway star candidate ( = 33.4 km s-1; Tetzlaff et al., 2011). A difference of 36 km s-1 is found between our two RV measurements separated by 3 months, corresponding to a 5.5 variation. We hence classify this star as RV variable.
C.22 HD 90087
The two sole RV measurements taken about three years apart (Table 10) are compatible within the error bars. We therefore consider this star as presumably single.
C.23 HD 92554
As we only have two exposures of this star that are separated by less than one hour, and since no additional RV measurements are available in the literature, we cannot assess its multiplicity status.
C.24 HD 93521
No significant RV variation is found for this star in our data and, while Rauw et al. (2012) reported line-to-line RV variations and RV changes between different observing years, they attributed these changes to non-radial pulsations. Therefore, we concur with their classification of a presumably single object. This also agrees with the fact that no significant variation is found when examining values from Garmany et al. (1980) and ours; the maximum RV difference of 71 km s-1 corresponds only to a 3.6 variation in view of the large error bars. The runaway status of this star is still uncertain, but no evidence for an accreting compact companion has been found in X-rays (Rauw et al., 2012).
C.25 HD 102415
C.26 HD 117490
Some RV variability has previously been reported for this star (Martins et al., 2015b), but all our RV values are similar within the error bars, hence our choice of a presumably single status.
C.27 HD 124979
HD 124979 is a runaway star characterised by a peculiar velocity of 74.4 km s-1 (Mason et al., 1998; Tetzlaff et al., 2011). It was suggested to be an SB2 (Penny, 1996; Barbá et al., 2010; Sota et al., 2014). However, we do not observe the usual line doubling in our spectra. All recent data (our work and literature – Williams et al. 2011) are very similar with RVs between 70 and 90 km s-1; old RV measurements (Feast & Thackeray, 1963; Kilkenny & Hill, 1975) differ from these, reaching higher and lower values. However, even after discarding them, the RV changes are found to be significant hence we classify this star as RV variable. Period searches yield no clear periodicity; we therefore need more data to assess the timescale of this variability.
C.28 HD 149757
HD 149757, best known as Oph, is a runaway star (Blaauw, 1961; Tetzlaff et al., 2011, = 25 km s-1) as testified by the bow shock in its vicinity (e.g. van Buren & McCray 1988). It was claimed that this star was part of a binary and was ejected when its companion (now the pulsar PSR B1929+10) exploded as a supernova about 1 Myr ago (van Rensbergen et al., 1996; Hoogerwerf et al., 2001; Tetzlaff et al., 2010), but Kirsten et al. (2015) recently refuted this hypothesis. In any case, it appears to be currently single; we found no significant RV variation in the data.
C.29 HD 150574
Garrison et al. (1977, 1983) suggested HD 150574 to be an SB2 based on the observation of double lines in the spectrum, although we do not detect any signature of a secondary in our high-resolution spectra. Furthermore, these new spectra do not reveal any significant RV variations, hence we classify this object as presumably single.
C.30 HD 163892
This star is a member of the Sgr OB1 association (Humphreys, 1978). It has long been recognised as an SB1 system (Feast et al. 1957; Conti et al. 1977), as recently confirmed by Stickland & Lloyd (2001) and the OWN Survey (Barbá et al. 2010; Sota et al. 2014). An orbital solution for the SB1 was presented by Mayer et al. (2014) who found a 7.8 d period. In the context of this work, we redetermined the RVs of the FEROS spectra used by Mayer et al. and complemented the set of RV values thanks to another FEROS spectrum, three CORALIE, and two FIES spectra (Table 10). Our RVs appear systematically lower by 10 km s-1 than those reported by Mayer et al. (2014). This difference is not surprising as they used Gaussian fits of individual lines to derive their values, which can differ from correlation results by about 10 km s-1, depending on the chosen rest wavelength of the fitted lines. It may further be noted that lowering by 10 km s-1 the primary systemic velocity given by Mayer et al. (2014) yields a value more consistent with the average RV of the Sgr OB1 members that they quote ( –10 km s-1). Such a change in the orbital solution, however, implies that two out of the three RV measurements of Feast & Thackeray (1963) and the Stickland & Lloyd (2001) measurement do not fit well the RV curve anymore; but these RVs were measured on photographic plates, hence have a larger error than ours based on high-resolution échelle spectra. We performed a period search on all available RVs and one peak slightly stands out in the periodograms (e.g. Fig. 16) with a period d, although the long gaps without observations lead to the presence of numerous close aliases that increase the actual error on that value. The large amplitude of this peak makes it highly significant (SL%). Furthermore, when folded with this period, RVs yield a clear sinusoidal variation with phase. The best-fit orbital solution was derived with the LOSP programme (Table 12 and Fig. 17); this orbital solution was computed with an eccentricity fixed to zero after it was found to be compatible with this value within the error bars. This orbital solution is in good agreement with the solution of Mayer et al. (2014) within the error bars, except for the primary systemic velocity ( vs –3.1 km s-1).
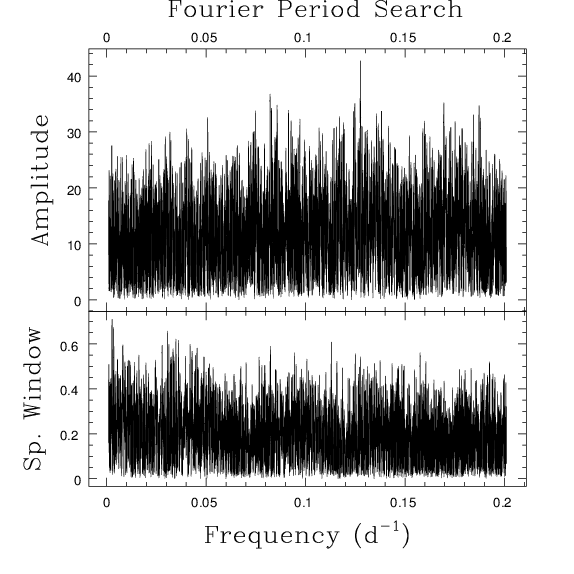
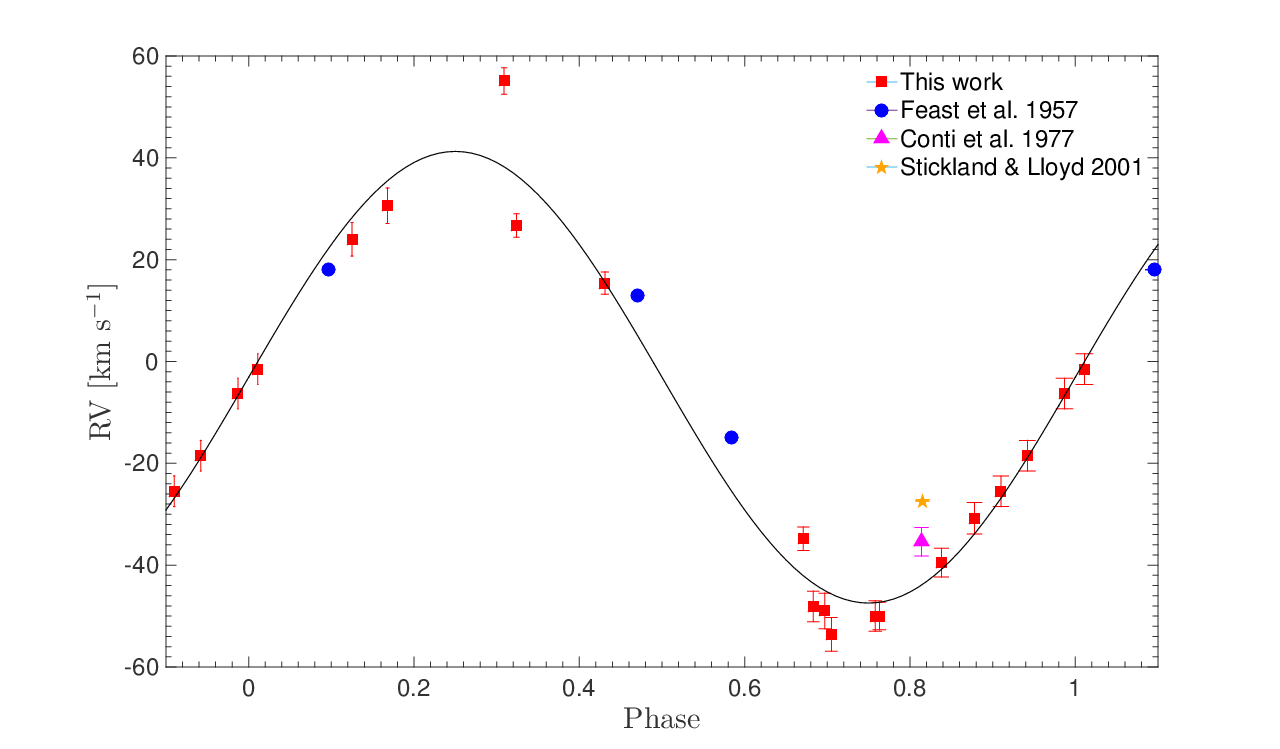
C.31 HD 172367
We cannot investigate the multiplicity status because we only have one spectrum and no previous investigation of the RVs exists.
C.32 HD 175876
Tetzlaff et al. (2011) suggested that HD 175876 is a runaway star candidate; their value for the peculiar spatial velocity is 22.2 km s-1. The analysis of the RVs (ours complemented by literature values; Kilkenny & Hill 1975; Conti et al. 1977; Bohannan & Garmany 1978; Garmany et al. 1980) leads us to reject RV variability. We nevertheless investigated the extensive RV set with period search algorithms, but without conclusive results. We thus conclude that this star is presumably single.
C.33 HD 184915
Weak emission is noticed in both wings of H, but according to Rivinius et al. (2013) this emission is not produced in a circumstellar disc (as in Be stars), but arises from a stellar outflow. We found no significant RV variation for this star in our data. Hence we classify it as presumably single.
C.34 HD 188439
HD 188439, or V819 Cyg, is a runaway star candidate with a peculiar velocity of 61.9 km s-1 (Tetzlaff et al., 2011). According to Stankov & Handler (2005), it is not a Cephei star even though its photometric variations have been associated with pulsational activity with periods of 0.3775 d (Lynds, 1959) or 0.7137 d (Koen & Eyer, 2002). Lynds (1959) also suggested that HD 188439 might be a very short-period binary in which the stars are partially merged.
Our RV values do not present significant variations, but the full RV dataset (our work + literature; Gies & Bolton 1986) indicates the presence of significant changes. In addition, we performed a period search on our data combined to those of Gies & Bolton (1986), excluding an outlier value (–50.14.6 km s-1 at HJD = 2,444,803.737), but no significant period could be derived. We therefore classify the star as RV variable, requiring more data to constrain the periodicity.
C.35 HD 191423
HD 191423, also known as “Howarth’s star”, is considered as one of the fastest rotators known amongst O stars since its rotation rate is believed to be close to critical (/ = 0.9; Howarth & Smith 2001). From spectroscopic time series, Mahy et al. (2013) argued that HD 191423 is probably single. Excluding one deviant RV measured on the GOSSS spectrum, the RV differences in our data are not significant (maximum RV of 29 km s-1 corresponding to a 0.8 difference because of the large error bars). Furthermore, while no clear periodicity can be identified in the whole RV dataset, a potential variability timescale of about 2.1 d is apparently detected in the Fourier periodogram when excluding the GOSSS measurement. However, the large RV uncertainties imply that this peak is totally insignificant after comparison with simulated data. The sampling is not at all adapted to identify such a timescale and the phased RVs do not result in a convincing diagram, hence we keep the presumably single status until further information becomes available.
C.36 HD 192281
Significant variability of the He II 4686 double-peaked emission and of the H absorption line was found by De Becker & Rauw (2004): they interpreted them as an effect of co-rotating features present in the wind. Barannikov (1993) found RV variations with a period of 5.48 d compatible with the presence of a low-mass companion. This was challenged by De Becker & Rauw (2004). These authors, after showing that this star is not a runaway, derived instead a 9.57 d period for the RV variability, but with a so small amplitude that it was not considered significant. We do detect a significant variability in the RVs when combining our measurements with those in the literature. However, there is a clear outlier: one measurement by Barannikov (1993) is positive while all others are clearly negative. Eliminating it, though, does not modify our conclusions, i.e. there is evidence for variability. However, there is no convincing detection of periodicity. We therefore classify this star as RV variable.
C.37 HD 198781
Our RVs do not display significant variations and no other measurements are available in the literature; we thus classify this star as presumably single.
C.38 HD 203064
HD 203064, or 68 Cyg, is a known runaway ( = 59.4 km s-1; Gies & Bolton, 1986; Tetzlaff et al., 2011). Lozinskaya & Lyuty (1981) further detected a small photometric variability with a 3.34 d period. It is also a known SB1 presenting discrete absorption components (DACs; Kaper et al. 1996). From the study of H , Alduseva et al. (1982, see also ) derived an orbital solution with a period of 5.1 d. The amplitude of our RVs is large (RV 38 km s-1), but this corresponds to a 2.9 variation only. However, a significant RV variability is detected when literature values (Conti et al. 1977; Bohannan & Garmany 1978; Garmany et al. 1980; Alduseva et al. 1982; Cherepashchuk & Aslanov 1984; Gies & Bolton 1986) are added; we find a maximum RV of 117 km s-1 or a 14 difference. In our period searches, one peak slightly stands out from the Fourier periodogram (Fig. 18), with a period =5.022900.00016 d. Its rather large amplitude, seldom reached in periodograms derived from Monte Carlo simulations, makes it highly significant (SL%). We tentatively calculated an orbital solution for this period using the LOSP programme. The derived orbital elements are presented in Table 12 and the orbital solution is shown in Fig. 19; this orbital solution was computed with an eccentricity fixed to zero since it was found to be compatible with this value within the error bars. There is an indication for systematically lower RVs derived from H , which leads to the noisy appearance of the RV curve. Our derived orbital period is slightly shorter and our velocity amplitude is smaller than previous solutions (Alduseva et al., 1982; Cherepashchuk & Aslanov, 1984). However, since the sampling is far from being perfectly adequate for a 5 d period, new data are required to confirm this tentative solution.
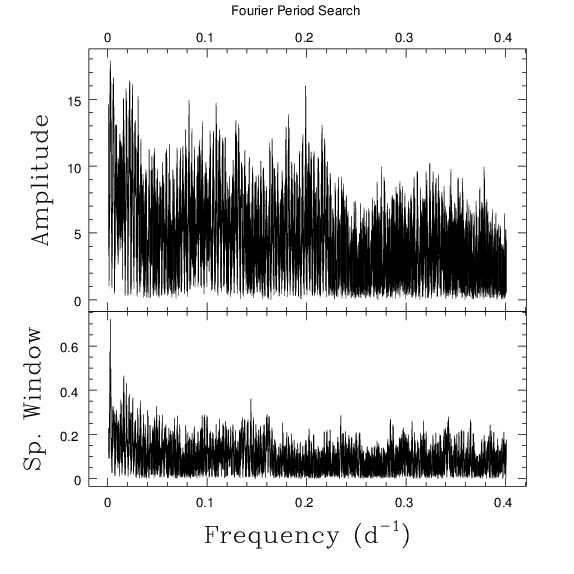
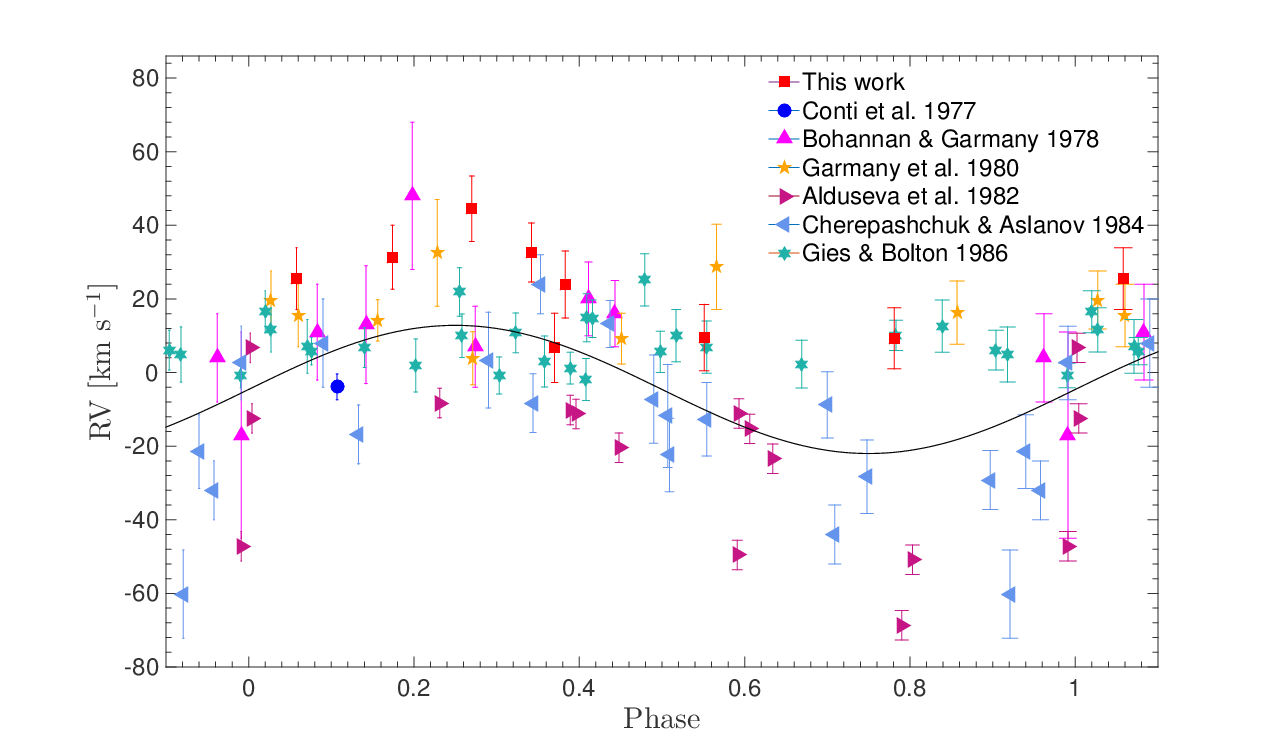
C.39 HD 210839
HD 210839 is a runaway star with a peculiar space velocity of 66.4 km s-1 (Tetzlaff et al., 2011). No significant RV variation is detected in our dataset, but adding the literature values (Garmany et al. 1980; Gies & Bolton 1986) results in a clear detection of RV variability; in this case, we find a maximum RV of 52 km s-1 or a difference. Our period searches yield a small but significant peak in the periodograms at low frequencies, corresponding to =186.40.2 d (Fig. 20). Although this period is tentative, we used LOSP to calculate a preliminary orbital solution (see Table 12 and Fig. 21); this orbital solution was computed with an eccentricity fixed to zero since it was found to be compatible with this value within the error bars. It requires new data to be confirmed.
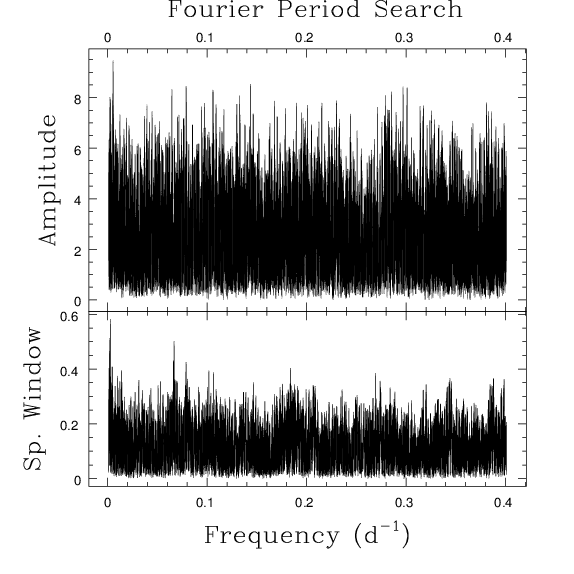
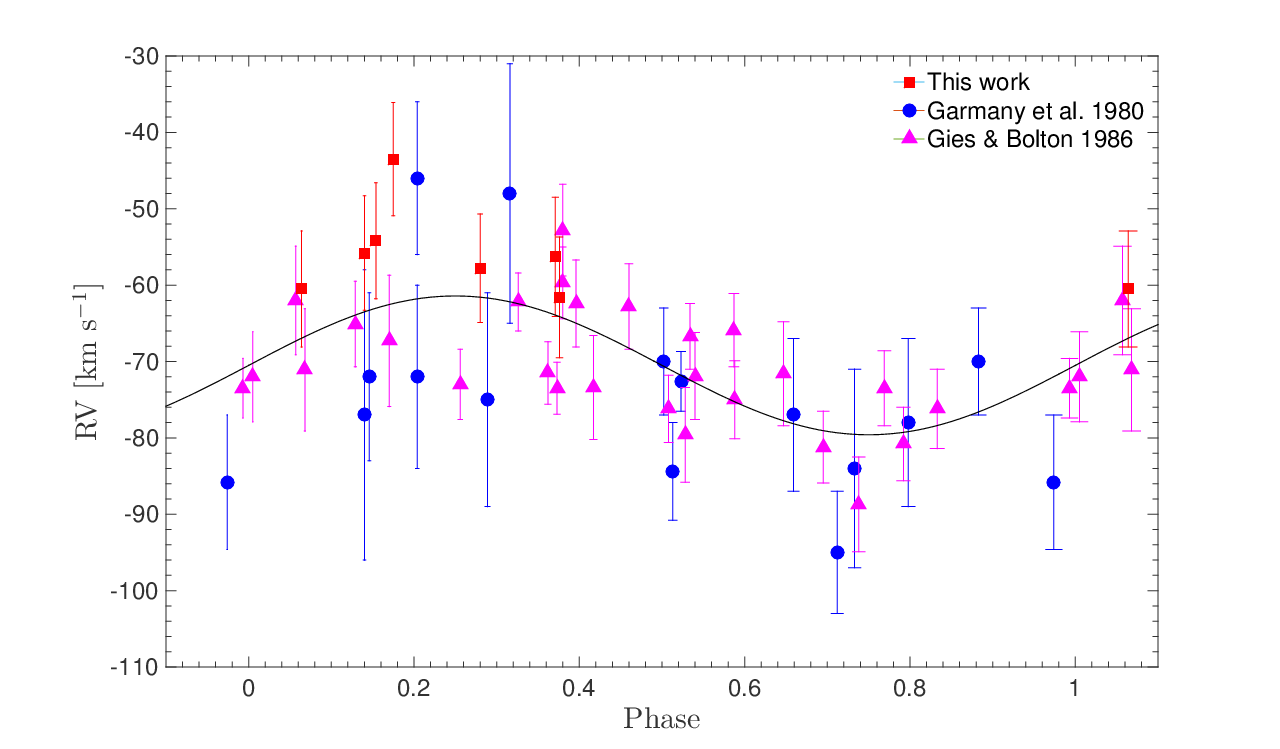
C.40 HD 228841
Williams et al. (2011) suggested that it is a runaway star (with a peculiar space velocity of 87 km s-1). Following a short-term RV monitoring, Mahy et al. (2013) found no significant variability and thus favoured a single status for HD 228841. Having a single spectrum of this star, we cannot assess this statement in detail, but our RV measurement agrees well with those of Mahy et al. (2013) for He I. Therefore, we simply adopt their presumably “single” status.
| Elements | HD 52266 | HD 52533 | HD 163892 | HD 203064 | HD 210839 |
|---|---|---|---|---|---|
| [d] | 75.840.04 | 22.2440.003 | 7.83480.0003 | 5.022920.00016 | 186.40.2 |
| [HJD–2,400,000] | 53560.86.9 | 51130.71.7 | 50842.60.1 | 56284.40.1 | 41191.15.4 |
| 0.120.07 | 0.230.13 | 0 (Fixed) | 0 (Fixed) | 0 (Fixed) | |
| [∘] | 119.033.2 | 3.828.9 | … | … | … |
| [km s-1] | 13.50.8 | 90.411.8 | 44.42.0 | 17.43.8 | 9.11.5 |
| [km s-1] | 22.80.6 | 73.37.3 | –3.11.6 | –4.62.2 | –70.51.2 |
| (m) [M⊙] | 0.01880.0035 | 1.570.63 | 0.07080.0095 | 0.00270.0018 | 0.01450.0074 |
| [R⊙] | 20.021.26 | 38.675.20 | 6.860.31 | 1.730.38 | 33.465.70 |
| rms [km s-1] | 2.7 | 36.6 | 6.7 | 19.7 | 8.1 |
| Reference | |||||||||
|---|---|---|---|---|---|---|---|---|---|
| Star | [1] | [2] | [3] | [4] | [5] | [6] | [7] | [8] | Comments |
| HD 14434 | … | … | N | … | … | … | … | … | |
| HD 14442 | … | … | N | … | … | … | … | … | |
| HD 15137 | N | … | N | … | N | … | … | N | |
| HD 15642 | … | … | N | … | … | … | … | … | |
| HD 28446A | … | … | … | Y | … | … | … | … | = 10.32′′ [4] |
| HD 41161 | Y | … | N | … | N | … | … | N | = 9.8′′, 243,000 yrs assuming = 1.5 kpc [1] |
| HD 41997 | … | … | N | … | … | … | … | N | |
| HD 46056 | … | … | N | … | … | … | … | N | |
| HD 46485 | … | … | N | … | … | … | N | N | |
| HD 52266 | N | … | N | … | N | … | N | N | 2MASS companion at 7.1′′ [5] |
| HD 52533 | Y | … | N | … | … | … | Y | Y | A-B with = 2.5′′ ( 40,000 yrs assuming = 2.0 kpc) + A-C with = 22.6′′ [1] |
| Aa-Ab with = 0.64′′ ( 3.50 mag) + A-B with = 2.64′′ ( 5.02 mag) + | |||||||||
| A-G with = 2.86′′ ( 6.37 mag) [7] | |||||||||
| Aa-Ab with = 0.6259′′ ( 3.812 mag) [8] | |||||||||
| HD 53755 | … | Y | … | … | … | … | … | … | A-B with = 6.42′′ + A-C with = 35.77′′ [2] |
| HD 66811 | N | … | N | … | N | … | N | … | |
| HD 74920 | … | … | … | … | … | … | N | … | |
| HD 90087 | N | … | N | … | … | … | … | … | |
| HD 93521 | N | … | N | … | N | … | … | N | |
| HD 102415 | … | … | N | … | … | … | … | N | |
| HD 117490 | … | … | N | … | … | … | … | … | |
| HD 124979 | N | … | N | … | … | … | … | … | |
| HD 149757 | N | … | N | … | N | N | N | … | |
| HD 150574 | … | … | N | … | … | … | … | … | |
| HD 163892 | N | … | N | … | N | … | Y | N | A-B with = 2.01′′ ( 5.31 mag) + A-C with = 2.45′′ ( 5.87 mag) + |
| A-D with = 6.45′′ ( 6.31 mag) + A-E with = 6.50′′ ( 5.05 mag) [7] | |||||||||
| 2MASS companion at 6.4′′ [5] | |||||||||
| HD 175876 | Y | … | N | … | N | … | N | … | = 17.0′′ [1] |
| HD 184915 | … | … | N | … | … | N | … | … | |
| HD 191423 | … | … | N | … | … | … | … | … | |
| HD 192281 | N | … | N | … | N | … | … | N | |
| HD 203064 | N | … | N | … | Y | … | … | N | = 3.84′′ ( 9.48 mag) [5] |
| HD 210839 | N | … | N | … | N | … | … | … | |
| HD 228841 | … | … | N | … | … | … | … | … | |
Appendix D Comparison with literature data
Table 14 compares our stellar parameters with those in the literature.
| Star | (C) | (N) | (O) | [N/C] | [N/O] | Source | |||||
| [km s-1] | [K] | ||||||||||
| Cooler stars (DETAIL/SURFACE) | |||||||||||
| HD 93521 | 40515 | 30 0001000 | 3.600.10 | 3.780.10 | 0.1660.025 | 7.680.12 | 8.100.13 | 8.330.21 | 0.420.21 | –0.230.12 | This work |
| 40025 | 33 5001500 | … | 3.800.20 | 0.2000.050 | … | … | … | … | … | Lennon et al. (1991) | |
| 43520 | 33 5001500 | … | … | 0.1800.030 | … | … | … | … | … | Howarth & Smith (2001) | |
| 39010 | 30 900700 | 3.670.12 | … | 0.1780.020 | 7.56 | 7.97 | 8.24 | 0.41 | –0.27 | Rauw et al. (2012) | |
| HD 102415 | 35715 | 32 9001000 | 4.100.10 | 4.190.10 | 0.1580.025 | 7.54 | 8.160.13 | 8.220.21 | 0.62 | –0.060.12 | This work |
| 37610 | 31 0001500 | 3.500.15 | 3.70 | 0.1740.068 | 7.78 | 8.88 | 8.48 | 1.10 | 0.40 | Martins et al. (2015b) | |
| HD 149757 | 37815 | 31 5001000 | 3.870.10 | 3.990.10 | 0.1350.025 | 8.070.12 | 7.850.13 | 8.370.21 | –0.220.21 | –0.520.12 | This work |
| 400 | 32 500 | 3.70 | 3.85 | 0.160 | … | … | … | … | … | Puls et al. (1996) | |
| 39920 | 34 3001500 | … | … | 0.2000.030 | … | … | … | … | … | Howarth & Smith (2001) | |
| 400 | 32 5001500 | 3.500.10 | 3.77 | 0.1600.030 | … | … | … | … | … | Herrero et al. (2002) | |
| 400 | 32 0001000 | 3.650.10 | 3.85 | 0.1450.022 | … | … | … | … | … | Repolust et al. (2004) | |
| 34025 | 26 400700 | 3.800.09 | 4.050.07 | … | … | … | … | … | … | Frémat et al. (2005) | |
| ( Oph) | 400 | 32 100700 | 3.62 | 3.83 | 0.099 | … | … | … | … | … | Mokiem et al. (2005) |
| … | 33 5001700 | … | 3.850.10 | 0.145 | … | … | … | … | … | Repolust et al. (2005)b | |
| 40020 | 34 0001000 | 3.700.10 | … | 0.1100.028 | 7.860.30 | 8.340.30 | 8.690.30 | 0.48 | –0.35 | Villamariz & Herrero (2005) | |
| 400 | 32 0002000 | 3.600.20 | 3.80 | … | … | … | … | … | … | Marcolino et al. (2009) | |
| 40010 | 31 0001000 | 3.600.15 | … | … | … | … | … | … | … | Martins et al. (2015a) | |
| HD 184915 | 25215 | 27 8001000 | 3.700.10 | 3.770.10 | 0.1830.025 | 8.18 | 8.460.13 | 8.620.21 | 0.28 | –0.16 | This work |
| 270 | 26 800 | 3.56 | … | 0.1600.011 | … | … | … | … | … | Lyubimkov et al. (2004)a | |
| ( Aql) | 22913 | 27 100500 | 3.490.05 | 3.530.06 | … | … | … | … | … | … | Frémat et al. (2005) |
| 2497 | 26 700750 | 3.590.07 | … | … | … | … | … | … | … | Huang & Gies (2008) | |
| HD 198781 | 22215 | 29 1001000 | 3.900.10 | 3.940.10 | 0.2300.025 | 8.09 | 8.620.13 | 8.780.21 | 0.53 | –0.160.12 | This work |
| 224 | 24 400 | 3.50 | … | 0.1480.011 | … | … | … | … | … | Lyubimkov et al. (2004)a | |
| Hotter stars (CMFGEN) | |||||||||||
| HD 13268 | 30115 | 32 5001500 | 3.420.15 | 3.550.15 | 0.2060.030 | 7.50 | 8.610.34 | 8.100.21 | 1.11 | 0.510.40 | This work |
| 300 | 36 0002000 | 3.700.30 | … | … | … | … | … | … | … | Kendall et al. (1996) | |
| 320 | 35 000 | 3.30 | 3.50 | 0.200 | … | … | … | … | … | Puls et al. (1996) | |
| 320 | 35 0001500 | 3.300.10 | 3.42 | 0.200 | … | … | … | … | … | Herrero et al. (1992) | |
| 300 | 33 0001000 | 3.250.10 | 3.48 | 0.2000.019 | … | … | … | … | … | Repolust et al. (2004) | |
| … | 33 0001650 | … | 3.480.10 | 0.200 | … | … | … | … | … | Repolust et al. (2005)b | |
| 31010 | 32 0001500 | 3.500.15 | 3.63 | 0.1670.069 | 7.70 | 8.70 | 8.49 | 1.00 | 0.21 | Martins et al. (2015b) | |
| HD 14434 | 40815 | 40 0001500 | 3.890.15 | 4.030.15 | 0.1030.030 | 7.960.27 | 8.810.34 | 8.10 | 0.850.43 | 0.71 | This work |
| 380 | 43 0002000 | 3.800.20 | … | … | … | … | … | … | … | Kendall et al. (1996) | |
| HD 14442 | 28515 | 39 2001500 | 3.690.15 | 3.780.15 | 0.0970.030 | 7.100.27 | 8.610.34 | 8.10 | 1.510.43 | 0.51 | This work |
| 260 | 43 0002000 | 3.600.20 | … | … | … | … | … | … | … | Kendall et al. (1996) | |
| HD 15137 | 26715 | 29 5001500 | 3.180.15 | 3.310.15 | 0.1120.030 | 7.630.27 | 8.270.34 | 8.30 | 0.640.43 | –0.03 | This work |
| 23410 | 29 700700 | 3.500.10 | … | … | … | … | … | … | … | McSwain et al. (2007) | |
| 25820 | 29 7001700 | 3.500.25 | … | … | … | … | … | … | … | McSwain et al. (2010) | |
| HD 46056 | 35015 | 34 5001500 | 3.900.15 | 4.000.15 | 0.0880.030 | 8.340.27 | 7.780.34 | 8.320.21 | –0.560.43 | –0.540.40 | This work |
| 33010 | 34 5001000 | 3.750.15 | … | … | 8.280.07 | 7.780.14 | 8.450.28 | –0.50 | –0.67 | Martins et al. (2015a) | |
| HD 46485 | 31515 | 37 0001500 | 4.000.15 | 4.080.15 | 0.0760.030 | 8.460.27 | 7.950.34 | 8.720.21 | –0.510.43 | –0.770.40 | This work |
| 30010 | 36 0001000 | 3.750.15 | … | … | 8.43 | 7.950.10 | 8.64 | –0.48 | –0.69 | Martins et al. (2015a) | |
| Star | (C) | (N) | (O) | [N/C] | [N/O] | Source | |||||
| [km s-1] | [K] | ||||||||||
| HD 66811 | 22515 | 41 0001500 | 3.550.15 | 3.620.15 | 0.1480.030 | 7.00 | 8.940.34 | 8.200.21 | 1.94 | 0.74 | This work |
| 220 | 42 000 | 3.50 | 3.60 | 0.107 | … | … | … | … | … | Puls et al. (1996) | |
| 220 | 39 0001500 | 3.550.10 | 3.590.09 | 0.1670.021 | … | … | … | … | … | Repolust et al. (2004) | |
| ( Pup) | … | 39 0001950 | … | 3.590.10 | 0.145 | … | … | … | … | … | Repolust et al. (2005)b |
| 210 | 40 0001000 | … | 3.640.10 | 0.140 | 6.600.25 | 9.100.17 | 8.130.30 | 2.50 | 0.97 | Bouret et al. (2012) | |
| 21010 | 40 0001000 | 3.640.15 | … | … | 6.600.22 | 9.100.17 | 8.130.29 | 2.50 | 0.97 | Martins et al. (2015a) | |
| HD 69106 | 30615 | 29 5001500 | 3.450.15 | 3.580.15 | 0.0910.030 | 7.880.27 | 7.740.34 | 8.470.21 | –0.140.43 | –0.730.40 | This work |
| 32010 | 29 0001000 | 3.400.15 | … | … | 7.60 | 8.00 | 8.40 | 0.40 | –0.40 | Martins et al. (2015a) | |
| HD 117490 | 36115 | 30 0001500 | 3.550.15 | 3.700.15 | 0.1410.030 | 7.39 | 8.500.34 | 8.150.21 | 1.11 | 0.350.40 | This work |
| 37510 | 30 5001500 | 3.500.15 | 3.66 | 0.138 | 7.48 | 8.88 | 8.40 | 1.40 | 0.48 | Martins et al. (2015b) | |
| HD 150574 | 23315 | 31 5001500 | 3.320.15 | 3.410.15 | 0.1720.030 | 7.480.27 | 9.08 | 8.93 | 1.60 | … | This work |
| 24010 | 31 0001500 | 3.400.15 | 3.49 | 0.1870.040 | 7.70 | 9.00 | 8.78 | 1.30 | 0.22 | Martins et al. (2015b) | |
| HD 191423 | 42015 | 30 6001500 | 3.330.15 | 3.570.15 | 0.1340.030 | 7.24 | 8.330.34 | 8.33 | 1.09 | 0.00 | This work |
| 450 | 34 0001500 | 3.400.10 | 3.68 | 0.200 | … | … | … | … | … | Herrero et al. (1992) | |
| 450 | 34 000 | 3.40 | 3.70 | 0.200 | … | … | … | … | … | Puls et al. (1996) | |
| 435 | 34 300 | … | … | 0.1900.030 | … | … | … | … | … | Howarth & Smith (2001) | |
| 450 | 35 0001000 | 3.400.10 | … | 0.1200.030 | 7.570.24 | 8.360.17 | 8.230.48 | 0.79 | 0.13 | Villamariz et al. (2002)c | |
| 400 | 32 5001000 | 3.350.10 | 3.60 | 0.1670.021 | … | … | … | … | … | Repolust et al. (2004) | |
| … | 32 0001600 | … | 3.560.10 | 0.167 | … | … | … | … | … | Repolust et al. (2005)b | |
| 410 | 30 6001000 | 3.500.10 | 3.67 | … | … | 8.730.20 | … | … | … | Mahy et al. (2015) | |
| 44510 | 31 5001500 | 3.500.15 | 3.72 | 0.2000.051 | … | 8.70 | … | … | … | Martins et al. (2015b) | |
| HD 192281 | 27615 | 39 0001500 | 3.640.15 | 3.730.15 | 0.1030.030 | 8.000.27 | 8.760.34 | 8.050.21 | 0.760.43 | 0.710.40 | This work |
| (V819 Cyg) | 24510 | 39 0001000 | 3.650.15 | … | … | 8.11 | 8.92 | 8.150.09 | 0.81 | 0.77 | Martins et al. (2015a) |
| HD 203064 | 29815 | 35 0001500 | 3.730.15 | 3.820.15 | 0.0760.030 | 7.920.27 | 8.230.34 | 8.460.21 | 0.310.43 | –0.230.40 | This work |
| 315 | 37 500 | 3.50 | 3.65 | 0.123 | … | … | … | … | … | Puls et al. (1996) | |
| 315 | 37 5001000 | 3.500.10 | 3.62 | 0.1200.030 | … | … | … | … | … | Herrero et al. (1992) | |
| (68 Cyg) | 300 | 34 5001000 | 3.500.10 | 3.60 | 0.0910.017 | … | … | … | … | … | Repolust et al. (2004) |
| … | 34 5001700 | … | 3.600.10 | 0.167 | … | … | … | … | … | Repolust et al. (2005)b | |
| 30010 | 34 0001000 | 3.600.15 | … | … | 8.200.11 | 8.200.19 | … | 0.00 | … | Martins et al. (2015a) | |
| HD 210839 | 21415 | 36 0001500 | 3.500.15 | 3.560.15 | 0.1130.030 | 7.830.27 | 8.740.34 | 8.130.21 | 0.910.43 | 0.610.40 | This work |
| 100 | 38 000 | 3.60 | 3.65 | 0.091 | … | … | … | … | … | Puls et al. (1996) | |
| 250 | 37 0001500 | 3.550.10 | … | 0.2500.030 | … | … | … | … | … | Herrero et al. (2000) | |
| (Cep) | 200 | 36 0001500 | 3.550.10 | 3.580.09 | 0.0910.017 | … | … | … | … | … | Repolust et al. (2004) |
| 210 | 36 0001000 | … | 3.540.10 | 0.107 | 8.220.21 | 8.700.15 | 8.480.14 | 0.48 | 0.22 | Bouret et al. (2012) | |
| 21010 | 36 0001000 | 3.500.15 | … | … | 7.780.15 | 8.78 | 8.400.35 | 1.00 | 0.38 | Martins et al. (2015a) | |
| HD 228841 | 30515 | 34 0001500 | 3.500.15 | 3.620.15 | 0.1120.030 | 7.480.27 | 8.740.34 | 8.670.21 | 1.260.43 | 0.070.40 | This work |
| 317 | 34 5001000 | 3.500.10 | 3.62 | … | … | 8.730.22 | … | … | … | Mahy et al. (2015) |
Appendix E Comparison with CMFGEN spectra
This appendix provides a comparison between the observations of the hotter stars and their best-fit CMFGEN models. Lines useful for the abundance derivations are indicated (see Sect. 4.3.2 for details on the fitting procedure and Table 11 for the actual list of lines used for each star). Finally, in the caption we mention the remaining fitting imperfections for each star. In this context, we recall that the wind parameters were not derived, explaining why wind-sensitive lines (e.g. N III 4634–4643, He II 4686) may not be perfectly fitted.
