Shift Aggregate Extract Networks
Abstract
We introduce an architecture based on deep hierarchical decompositions to learn effective representations of large graphs. Our framework extends classic -decompositions used in kernel methods, enabling nested part-of-part relations. Unlike recursive neural networks, which unroll a template on input graphs directly, we unroll a neural network template over the decomposition hierarchy, allowing us to deal with the high degree variability that typically characterize social network graphs. Deep hierarchical decompositions are also amenable to domain compression, a technique that reduces both space and time complexity by exploiting symmetries. We show empirically that our approach is competitive with current state-of-the-art graph classification methods, particularly when dealing with social network datasets.
1 Introduction
Structured data representations are common in application domains such as chemistry, biology, natural language, and social network analysis. In these domains, one can formulate a supervised learning problem where the input portion of the data is a graph, possibly with attributes on vertices and edges. While learning with graphs of moderate size (tens up to a few hundreds of nodes) can be afforded with many existing techniques, scaling up to large networks poses new significant challenges that still leave room for improvement, both in terms of predictive accuracy and in terms of computational efficiency.
Devising suitable representations for graph learning is crucial and nontrivial. A large body of literature exists on the subject, where graph kernels (gks) and recurrent neural networks (rnns) are among the most common approaches. gks follow the classic -decomposition approach of Haussler (1999). Different kinds of substructures (e.g., shortest-paths (Borgwardt & Kriegel, 2005), graphlets (Shervashidze et al., 2009) or neighborhood subgraph pairs (Costa & De Grave, 2010)) can used to compute the similarity between two graphs in terms of the similarities of the respective sets of parts. rnns (Sperduti & Starita, 1997; Goller & Kuchler, 1996; Scarselli et al., 2009) unfold a template (with shared weights) over each input graph and construct the vector representation of a node by recursively composing the representations of its neighbors. These representations are typically derived from a loss minimization procedure, where gradients are computed by the backpropagation through structure algorithm (Goller & Kuchler, 1996). One advantage of rnns over gks is that the vector representations of the input graphs are learned rather than handcrafted.
Most of gk- and rnn-based approaches have been applied to relatively small graphs, such as those derived from molecules (Ralaivola et al., 2005; Bianucci et al., 2000; Borgwardt & Kriegel, 2005), natural language sentences (Socher et al., 2011) or protein structures (Vullo & Frasconi, 2004; Baldi & Pollastri, 2003; Borgwardt et al., 2005b). On the other hand, large graphs (especially social networks) typically exhibit a highly skewed degree distribution that originates a huge vocabulary of distinct subgraphs. This scenario makes finding a suitable representation much harder: kernels based on subgraph matching would suffer diagonal dominance (Schoelkopf et al., 2002), while rnns would face the problem of composing a highly variable number of substructure representations in the recursive step. A recent work by Yanardag & Vishwanathan (2015) proposes deep graph kernels (dgk) to upgrade existing graph kernels with a feature reweighing schema that employs cbow/Skip-gram embedding of the substructures. Another recent work by Niepert et al. (2016) casts graphs into a format suitable for learning with convolutional neural networks (cnns). These methods have been applied successfully to small graphs but also to graphs derived from social networks.
In this paper, we introduce a novel architecture for supervised graph learning, called shift-aggregate-extract network (saen). The architecture operates on hierarchical decompositions of structured data. Like the flat -decompositions commonly used to define kernels on structured data (Haussler, 1999), -decompositions are based on the part-of relation, but allow us to introduce a deep recursive notion of parts of parts. At the top level of the hierarchy lies the whole data structure. Objects at each intermediate level are decomposed into parts that form the subsequent level of the hierarchy. The bottom level consists of atomic objects, such as, for example, individual vertices or edges of a graph.
saen compensates some limitations of recursive neural networks by adding two synergetic degrees of flexibility. First, it unfolds a neural network over a hierarchy of parts rather than using the edge set of the input graph directly; this makes it easier to deal with very high degree vertices. Second, it imposes weight sharing and fixed size of the learned vector representations on a per level basis instead of globally; in this way, more complex parts may be embedded into higher dimensional vectors, without forcing to use excessively large representations for simpler parts.
A second contribution of this paper is a domain compression algorithm that can significantly reduce memory usage and runtime. It leverages mathematical results from lifted linear programming (Mladenov et al., 2012) in order to exploit symmetries and perform a lossless compression of -decompositions.
The paper is organized as follows. In Section 2 we introduce -decompositions, a generalization of Haussler’s (Haussler, 1999) -decomposition relations. In Section 3 we describe saen, a neural network architecture for learning vector representations of -decompositions. Furthermore, in Section 4 we explain how to exploit symmetries in -decompositions in order to reduce memory usage and runtime. In Section 5 we report experimental results on several number of real-world datasets. Finally, in Section 6 we discuss some related works and draw some conclusions in Section 7.
2 -decompositions
We define here a deep hierarchical extension of Haussler’s (Haussler, 1999) -decomposition relation. An -decomposition represents structured data as a hierarchy of -parametrized parts. It is formally defined as the triple where:
-
•
are disjoint sets of objects called levels of the hierarchy. The bottom level contains atomic (i.e. non-decomposable) objects, while the other levels contain compound objects, , whose parts belong to the preceding level, .
-
•
is a set of -parametrized -convolution relations. Where is a membership type from a finite alphabet of size . At the bottom level, . A pair belongs to iff is part of with membership type . For notational convenience, the parts of are denoted as .
-
•
is a set of -dimensional vectors of attributes assigned to the elements the bottom layer .
The membership type is used to represent the roles of the parts of an object. For example, we could decompose a graph as a multiset of -neighborhood subgraphs 111The -neighborhood subgraph (or ego graph) of a vertex in a graph is the induced subgraph of consisting of all vertices whose shortest-path distance from is at most . in which is the radius of the neighborhoods. Another possible use of the -membership type is to distinguish the root from the other vertices in a rooted neighborhood subgraph. Both uses -membership type are shown in Figure 2.
An -decomposition is a multilevel generalization of -convolution relations, and it reduces to an -convolution relation for .
For example we could produce a -levels decomposition by decomposing graph into a set of -neighborhood subgraphs and employ their radius as membership type. Furthermore, we could extract shortest paths from the -neighborhood subgraphs and use their length as membership type. Finally, each shortest path could be decomposed in vertices using their index in the shortest path as membership type.
Another example of decomposition could come from text processing, documents could be decomposed in sentences which are themselves represented as graphs of dependency relations and further decomposed as bags of shortest paths in the dependency graph. Finally, the words (which are the vertices of the dependency graph) constitute the bottom layer and can be represented in attributed form as word vectors.
3 Learning representations with saen
A shift-aggregate-extract network (saen) is a composite function that maps objects at level of an -decomposition into -dimensional real vectors. It uses a sequence of parametrized functions , for example a sequence of neural networks with parameters . At each level, , each function operates as follows:
-
1.
It receives as input the aggregate vector defined as:
(1) where is the vector of attributes for object .
-
2.
It extracts the vector representation of as
(2)
The vector is obtained in two steps: first, previous level representations are shifted via the Kronecker product using an indicator vector . This takes into account of the membership types . Second, shifted representations are aggregated with a sum. Note that all representation sizes , are hyperparameters that need to be chosen or adjusted.
The shift and aggregate steps are identical to those used in kernel design when computing the explicit feature of a kernel derived from a sum of base kernels . In principle, it would be indeed possible to turn saen into a kernel method by removing the extraction step. However, such an approach would increase the dimensionality of the feature space by a multiplicative factor for each level of the -decomposition, thus leading to an exponential number of features. When using saen, the feature space growth is prevented by exploiting a distributed representation (via a multilayered neural network) during the extraction step. As a result, saen can easily cope with -decompositions consisting of multiple levels.
4 Exploiting symmetries for domain compression
In this section we propose a technique, called domain compression, which allows us to save memory and speedup the saen computation. Domain compression exploits symmetries in -decompositions by collapsing equivalent objects in each level. Domain compression requires that the attributes of the elements in the bottom level are categorical.
Two objects , in a level are collapsible, denoted , if they share the same representation, i.e., for all the possible values of . A compressed level is the quotient set of level with respect to the collapsibility relation . Objects in the bottom level are collapsible when their attributes are identical. Objects at any level are collapsible if they are made of the same sets of parts for all the membership types .
In Figure 1 we provide a pictorial representation of the domain compression of an -decomposition (egnn, described in Section 5.2). On the left we show the -decomposition of a graph taken from the imdb-binary dataset (see Section 5.1) together with its compressed version on the right.
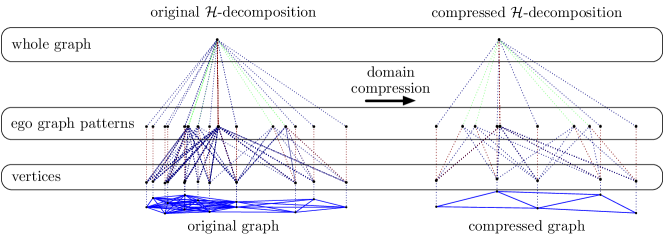
In order to compress -decompositions we adapt the lifted linear programming technique proposed by (Mladenov et al., 2012) to the saen architecture. A matrix with distinct rows can be decomposed as the product where is a compressed version of in which the distinct rows of appear exactly once. The Boolean decompression matrix, , encodes the collapsibility relation among the rows of so that iff the row of falls in the equivalence class of . A pseudo-inverse of can be computed by dividing the rows of by their sum (where is the transpose of ).
Example 1
If define matrix as in Eq. 3 we notice that row and share the encoding , rows and share the encoding while the encoding appears only once at row . So matrix can be compressed to matrix .
| (3) |
Matrix can be expressed as the matrix product between the decompression matrix and the compressed version of (i.e. ), while the matrix multiplication between the compression matrix and the leads to the compressed matrix (i.e.).
We rewrite Eq. 1 as:
| (4) |
where:
-
•
is the matrix that represents the shift-aggregated vector representations of the object of level ;
-
•
is the matrix that represents the -dimensional encodings of the vertex attributes in (i.e. the rows of are the of Eq. 1);
-
•
is the concatenation
(5) of the matrices which represent the -convolution relations of Eq. 1 whose elements are if and otherwise.
-
•
is a block-diagonal matrix
(6) whose blocks are formed by matrix repeated times. The rows of are the vector representations in Eq. 1.
Eq. 2 is simply rewritten to where is unchanged w.r.t. Eq. 2 and is applied to its input matrix row-wise.
-
1 2 3 4for to 5 6 7 for to 8 9return
Domain compression on Eq. 4 is performed by the domain-compression procedure (see Algorithm 1). which takes as input the attribute matrix and the part-of matrices and returns their compressed versions and the respectively. The algorithm starts by invoking (line 1) the procedure compute-cd on to obtain the compression and decompression matrices and respectively. The compression matrix is used to compress (line 1) then we start iterating over the levels of the -decomposition (line 1) and compress the matrices. The compression of the matrices is done by right-multiplying them by the decompression matrix of the previous level (line 1). In this way we collapse the parts of relation (i.e. the columns of ) as these were identified in level as identical objects (i.e. those objects corresponding to the rows of or collapsed during the previous step). The result is a list of column compressed matrices. We proceed collapsing equivalent objects in level , i.e. those made of identical sets of parts: we find symmetries in by invoking compute-cd (line 1) and obtain a new pair , of compression, and decompression matrices respectively. Finally the compression matrix is applied to the column-compressed matrices in in order to obtain the compressed matrices of level (line 1).
Algorithm 1 allows us to compute the domain compressed version of Eq. 4 which can be obtained by replacing: with , with and with . Willing to recover the original encodings we just need to employ the decompression matrix on the compressed encodings , indeed .
As we can see by substituting with , the more are the symmetries (i.e. when ) the greater the domain compression will be.
5 Experimental evaluation
We perform an exhaustive experimental evaluation and answer the following questions:
- Q1
-
How does saen compare to the state of the art?
- Q2
-
Can saen exploit symmetries in social networks to reduce the memory usage and the runtime?
5.1 Datasets
In order to answer the experimental questions we tested our method on six publicly available datasets first proposed by Yanardag & Vishwanathan (2015) and some bioinformatic datasets.
- collab
-
is a dataset where each graph represent the ego-network of a researcher, and the task is to determine the field of study of the researcher between High Energy Physics, Condensed Matter Physics and Astro Physics.
- imdb-binary, imdb-multi
-
are datasets derived from IMDB where in each graph the vertices represent actors/actresses and the edges connect people which have performed in the same movie. Collaboration graphs are generated from movies belonging to genres Action and Romance for imdb-binaryand Comedy, Romance and Sci-Fi for imdb-multi, and for each actor/actress in those genres an ego-graph is extracted. The task is to identify the genre from which the ego-graph has been generated.
Table 1: Statistics of the datasets used in our experiments. dataset size avg. avg. max. nodes degree collab imdb-binary imdb-multi reddit-binary reddit-multi5k reddit-multi12k mutag ptc nci1 proteins d&d - reddit-binary, reddit-multi5k, reddit-multi12k
-
are datasets where each graph is derived from a discussion thread from Reddit. In those datasets each vertex represent a distinct user and two users are connected by an edge if one of them has responded to a post of the other in that discussion. The task in reddit-binary is to discriminate between threads originating from a discussion-based subreddit (TrollXChromosomes, atheism) or from a question/answers-based subreddit (IAmA, AskReddit). The task in reddit-multi5k and reddit-multi12k is a multiclass classification problem where each graph is labeled with the subreddit where it has originated (worldnews, videos, AdviceAnimals, aww, mildlyinteresting for reddit-multi5k and AskReddit, AdviceAnimals, atheism, aww, IAmA, mildlyinteresting, Showerthoughts, videos, todayilearned, worldnews, TrollXChromosomes for reddit-multi12k).
- mutag, ptc, nci1, proteins and d&d
-
are bioinformatic datasets. mutag (Debnath et al., 1991) is a dataset of mutagenic aromatic and heteroaromatic nitro compounds labeled according to whether or not they have a mutagenic effect on the Gramnegative bacterium Salmonella typhimurium. ptc (Toivonen et al., 2003) is a dataset of chemical compounds that reports the carcinogenicity for male and female rats and it has discrete labels. nci1 (Wale et al., 2008) is a dataset of examples and is a subset of balanced datasets of chemical compounds screened for ability to suppress or inhibit the growth of a panel of human tumor cell lines, and has discrete labels. proteins (Borgwardt et al., 2005a) is a binary classification dataset made of proteins. Each protein is represented as a graph where nodes are secondary structure elements (i.e. helices, sheets and turns). Edges connect nodes if they are neighbors in the amino-acid sequence or in the 3D space. d&d is a binary classification dataset of graphs. Each graph represents a protein nodes are amino acids which are connected by an edge if they are less than Angstroms apart.
5.2 Experiments
| dataset | dgk | patchy-san | saen |
|---|---|---|---|
| (Yanardag & Vishwanathan, 2015) | (Niepert et al., 2016) | (our method) | |
| collab | |||
| imdb-binary | |||
| imdb-multi | |||
| reddit-binary | |||
| reddit-multi5k | |||
| reddit-multi12k |
| dataset | radiuses | hidden units | ||
|---|---|---|---|---|
| collab | ||||
| imdb-binary | ||||
| imdb-multi | ||||
| reddit-binary | ||||
| reddit-multi5k | ||||
| reddit-multi12k | ||||
| mutag | ||||
| ptc | ||||
| nci1 | ||||
| proteins | ||||
| d&d | ||||
In our experiments we chose an -decomposition called Ego Graph Neural Network (egnn) (shown in Figure 2), that mimics the graph kernel nspdk with the distance parameter set to . Before applying egnn we turn unattributed graphs into attributed graphs by annotating their vertices with attributes . We label vertices of with their degree and encode this information into the attributes by employing the -hot encoding.
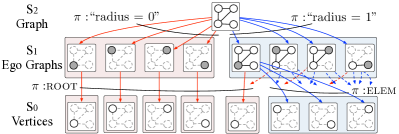
egnn decomposes attributed graphs into a level -decomposition with the following levels:
-
•
level contains objects that are in one-to-one correspondence with the vertices .
-
•
level contains -rooted -neighborhood subgraphs (i.e. ego graphs) of radius and has part-of alphabet . Objects are “elem-part-of” ego graph if , while the are “root-part-of” ego graph if .
-
•
level contains the graph that we want to classify and has part-of alphabet which correspond to the radius of the ego graphs of which is made of.
The egnn decomposition is exemplified for a small graph shown in Figure 2.
| dataset | size (mb) | runtime | ||||
|---|---|---|---|---|---|---|
| original | comp. | ratio | original | comp. | speedup | |
| collab | 1190 | 448 | 0.38 | 43’ 18” | 8’ 20” | |
| imdb-binary | 68 | 34 | 0.50 | 3’ 9” | 0’ 30” | |
| imdb-multi | 74 | 40 | 0.54 | 7’ 41” | 1’ 54” | |
| reddit-binary | 326 | 56 | 0.17 | to | 2’ 35” | |
| reddit-multi5k | 952 | 162 | 0.17 | oom | 9’ 51” | – |
| reddit-multi12k | 1788 | 347 | 0.19 | oom | 29’ 55” | – |
- E1
-
We experimented with saen applying the egnn -decomposition on all the datasets. For each dataset, we manually chose the parameters of saen, i.e. the number of hidden layers for each level, the size of each layer and the maximum radius . We used the Leaky ReLU (Maas et al., 2013) activation function on all the units. In Table 3 we report for each dataset the radiuses of the neighborhood subgraphs used in the egnn decomposition and the number of units in the hidden layers for each level.
In all our experiments we trained the neural networks by using the Adam algorithm to minimize a cross entropy loss.
The classification accuracy of saen was measured with -times -fold cross-validation. We manually chose the number of layers and units for each level of the part-of decomposition; the number of epochs was chosen manually for each dataset and we kept the same value for all the runs of the -times -fold cross-validation.
The mean accuracies and their standard deviations obtained by applying our method on social network datasets are reported in Table 2, where we compare these results with those obtained by Yanardag & Vishwanathan (2015) and by Niepert et al. (2016). In Table 5 we compare the results obtained by our method on bioinformatic datasets with the those obtained by Niepert et al. (2016).
- E2
-
In Table 4 we show the file sizes of the preprocessed datasets before and after the compression together with the data compression ratio. 222The size of the uncompressed files are shown for the sole purpose of computing the data compression ratio. Indeed the last version of our code compresses the files on the fly. We also estimate the benefit of the relational compression from a computational time point of view and report the measurement of the runtime for run with and without compression together with the speedup factor.
| dataset | patchy-san | saen |
|---|---|---|
| (Niepert et al., 2016) | (our method) | |
| mutag | ||
| ptc | ||
| nci1 | ||
| proteins | ||
| d&d |
For the purpose of this experiment, all tests were run on a computer with two 8-cores Intel Xeon E5-2665 processors and 94 GB ram. Uncompressed datasets which exhausted our server’s memory during the test are marked as “oom” (out of memory) in the table, while those who exceeded the time limit of times the time needed for the uncompressed version are marked as “to” (timeout). saen was implemented in Python with the TensorFlow library.
5.3 Discussion
- A1
-
As shown in Table 2, egnn performs consistently better than the other two methods on all the social network datasets. This confirms that the chosen -decomposition is effective on this kind of problems. Table 1 shows that the average maximum node degree (amnd) 333The amnd for a given dataset is obtained by computing the maximum node degree of each graph and then averaging over all graphs. of the social network datasets is in the order of . saen can easily cope with highly skewed node degree distributions by aggregating distributed representation of patterns while this is not the case for dgk and patchy-san. dgk uses the same patterns of the corresponding non-deep graph kernel used to match common substructures. If the pattern distribution is affected by the degree distribution most of those patterns will not match, making it unlikely for dgk to work well on social network data. patchy-san employs as patterns neighborhood subgraphs truncated or padded to a size in order to fit the size of the receptive field of a cnn. However, since Niepert et al. (2016) experiment with , it is not surprising that they perform worst than saen on collab, imdb-multi, reddit-multi5k and reddit-multi12k since a small causes the algorithm to throw away most of the subgraph; a more sensible choice for would have been the amnd of each graph (i.e. , , and respectively, cf. Tables 1 and 2).
Table 5 compares the results of saen with the best patchy-san instance on chemoinformatics and bioinformatics datasets. saen is in line with the results of Niepert et al. (2016) on proteins and d&d, two datasets where the degree is in the order of 10 (see Table 1). Small molecules, on the other hand, have very small degrees. Indeed, in nci1, mutag and ptc saen does not perform very well and is outperformed by patchy-san, confirming that saen is best suited for graphs with large degrees. Incidentally, we note that for small molecules, graph kernels attain even better accuracies (e.g. the Weisfeiler-Lehman graph kernel (Shervashidze et al., 2011) achieves 80.13% accuracy on nci1).
- A2
-
The compression algorithm has proven to be effective in improving the computational cost of our method. Most of the datasets improved their runtimes by a factor of at least while maintaining the same expressive power. Moreover, experiments on reddit-multi5k and reddit-multi12k have only been possible thanks to the size reduction operated by the algorithm as the script exhausted the memory while executing the training step on the uncompressed files.
6 Related works
When learning with graph inputs two fundamental design aspects that must be taken into account are: the choice of the pattern generator and the choice of the matching operator. The former decomposes the graph input in substructures while the latter allows to compare the substructures.
Among the patterns considered from the graph kernel literature we have paths, shortest paths, walks (Kashima et al., 2003), subtrees (Ramon & Gärtner, 2003; Shervashidze et al., 2011) and neighborhood subgraphs (Costa & De Grave, 2010). The similarity between graphs and is computed by counting the number of matches between their common the substructures (i.e. a kernel on the sets of the substructures). The match between two substructures can be defined by using graph isomorphism or some other weaker graph invariant.
When the number of substructures to enumerate is infinite or exponential with the size of the graph (perhaps this is the case for random walks and shortest paths respectively) the kernel between the two graphs is computed without generating an explicit feature map. Learning with an implicit feature map is not scalable as it has a space complexity quadratic in the number of training examples (because we need to store in memory the gram matrix).
Other graph kernels such as the Weisfeiler-Lehman subtree kernel (wlst) (Shervashidze et al., 2011) and the Neighborhood Subgraph Pairwise Distance Kernel (nspdk) (Costa & De Grave, 2010) deliberately choose a pattern generator that scales polynomially and produces an explicit feature map. However the vector representations produced by wlst and nspdk are handcrafted and not learned.
Deep graph kernels (dgk) (Yanardag & Vishwanathan, 2015) upgrade existing graph kernels with a feature reweighing schema. dgks represent input graphs as a corpus of substructures (e.g. graphlets, Weisfeiler-Lehman subtrees, vertex pairs with shortest path distance) and then train vector embeddings of substructures with cbow/Skip-gram models. 444 The cbow/Skip-gram models receive as inputs cooccurrences among substructures sampled from the input graphs. Each graph-kernel feature (i.e. the number of occurrences of a substructure) is reweighed by the -norm of the vector embedding of the corresponding substructure. Experimental evidence shows that dgks alleviate the problem of diagonal dominance in gks. However, dgks inherit from gks a flat representation (i.e. just one layer of depth) of the input graphs and the vector representations of the substructures are not trained end-to-end as saen would do.
patchy-san (Niepert et al., 2016) casts graphs into a format suitable for learning convolutional neural networks (cnns): 1) graphs are decomposed into a fixed number of neighborhood subgraphs; 2) which are then casted to a fixed-size receptive field. Both 1) and 2) involve either padding or truncation in order to meet the fixed-size requirements. The truncation operation can be detrimental for the statistical performance of the downstream cnn since it throws away part of the input graph. On the other hand saen is able to handle structured inputs of variable sizes without throwing away part of the them. And this is one of the reasons because saen has better statistical performance than patchy-san (See § 5).
7 Conclusions
Hierarchical decompositions introduce a novel notion of depth in the context of learning with structured data, leveraging the nested part-of-parts relation. In this paper, we defined a simple architecture based on neural networks for learning representations of these hierarchies. We showed experimentally that the approach is particularly well-suited for dealing with graphs that are large and have high degree, such as those that naturally occur in social network data. Our approach is also effective for learning with smaller graphs, such as those occurring in chemoinformatics and bioinformatics, although in these cases the performance of saen does not exceed the state-of-the-art established by other methods. A second contribution of this paper is the domain compression algorithm, which greatly reduces memory usage and allowed us to speedup the training time of a factor of at least .
References
- Baldi & Pollastri (2003) Baldi, P and Pollastri, G. The principled design of large-scale recursive neural network architectures–dag-rnns and the protein structure prediction problem. J Mach Learn Res, 4(Sep):575–602, 2003.
- Bianucci et al. (2000) Bianucci, Anna Maria, Micheli, Alessio, Sperduti, Alessandro, and Starita, Antonina. Application of cascade correlation networks for structures to chemistry. Applied Intelligence, 12(1-2):117–147, 2000.
- Borgwardt & Kriegel (2005) Borgwardt, K M and Kriegel, H-P. Shortest-path kernels on graphs. In Proc. of the ICDM-05, pp. 8–pp. IEEE, 2005.
- Borgwardt et al. (2005a) Borgwardt, Karsten M, Ong, Cheng Soon, Schönauer, Stefan, Vishwanathan, SVN, Smola, Alex J, and Kriegel, Hans-Peter. Protein function prediction via graph kernels. Bioinformatics, 21(suppl 1):i47–i56, 2005a.
- Borgwardt et al. (2005b) Borgwardt, Karsten M., Ong, Cheng Soon, Sch nauer, Stefan, Vishwanathan, S. V. N., Smola, Alex J., and Kriegel, Hans-Peter. Protein function prediction via graph kernels. Bioinformatics, 21(suppl 1):i47–i56, 2005b. 00313.
- Costa & De Grave (2010) Costa, F and De Grave, K. Fast neighborhood subgraph pairwise distance kernel. In Proc. of the ICML-10, pp. 255–262. Omnipress, 2010.
- Debnath et al. (1991) Debnath, Asim Kumar, Lopez, de Compadre RL, Debnath, Gargi, Shusterman, Alan J, and Hansch, Corwin. Structure-activity relationship of mutagenic aromatic and heteroaromatic nitro compounds. correlation with molecular orbital energies and hydrophobicity. J. Med. Chem., 34(2):786–797, 1991.
- Goller & Kuchler (1996) Goller, C and Kuchler, A. Learning task-dependent distributed representations by backpropagation through structure. In Neural Networks, 1996., IEEE International Conference on, volume 1, pp. 347–352. IEEE, 1996.
- Haussler (1999) Haussler, D. Convolution kernels on discrete structures. Technical report, Citeseer, 1999.
- Kashima et al. (2003) Kashima, H, Tsuda, K, and Inokuchi, A. Marginalized kernels between labeled graphs. In n Proc. of the ICML-03, volume 3, pp. 321–328, 2003.
- Maas et al. (2013) Maas, Andrew L, Hannun, Awni Y, and Ng, Andrew Y. Rectifier nonlinearities improve neural network acoustic models. In Proc. ICML, volume 30, 2013.
- Mladenov et al. (2012) Mladenov, M, Ahmadi, B, and Kersting, K. Lifted linear programming. In AISTATS-12, pp. 788–797, 2012.
- Niepert et al. (2016) Niepert, M, Ahmed, M, and Kutzkov, K. Learning convolutional neural networks for graphs. arXiv preprint arXiv:1605.05273, 2016.
- Ralaivola et al. (2005) Ralaivola, Liva, Swamidass, Sanjay J., Saigo, Hiroto, and Baldi, Pierre. Graph kernels for chemical informatics. Neural Networks, 18(8):1093–1110, 2005. 00251.
- Ramon & Gärtner (2003) Ramon, J and Gärtner, T. Expressivity versus efficiency of graph kernels. In First International Workshop on Mining Graphs, Trees and Sequences, pp. 65–74. Citeseer, 2003.
- Scarselli et al. (2009) Scarselli, Franco, Gori, Marco, Tsoi, Ah Chung, Hagenbuchner, Markus, and Monfardini, Gabriele. The graph neural network model. Neural Networks, IEEE Transactions on, 20(1):61–80, 2009. 00073.
- Schoelkopf et al. (2002) Schoelkopf, Bernhard, Weston, Jason, Eskin, Eleazar, Leslie, Christina, and Noble, William Stafford. A kernel approach for learning from almost orthogonal patterns. In European Conference on Machine Learning, pp. 511–528. Springer, 2002.
- Shervashidze et al. (2009) Shervashidze, N, Vishwanathan, SVN, Petri, T, Mehlhorn, K, and Borgwardt, K M. Efficient graphlet kernels for large graph comparison. In AISTATS-09, volume 5, pp. 488–495, 2009.
- Shervashidze et al. (2011) Shervashidze, N, Schweitzer, P, Leeuwen, E J van, Mehlhorn, K, and Borgwardt, K M. Weisfeiler-lehman graph kernels. J Mach Learn Res, 12(Sep):2539–2561, 2011.
- Socher et al. (2011) Socher, R, Lin, C C, Manning, C, and Ng, A Y. Parsing natural scenes and natural language with recursive neural networks. In Proc. of the ICML-11, pp. 129–136, 2011.
- Sperduti & Starita (1997) Sperduti, A and Starita, A. Supervised neural networks for the classification of structures. IEEE Transactions on Neural Networks, 8(3):714–735, 1997.
- Toivonen et al. (2003) Toivonen, Hannu, Srinivasan, Ashwin, King, Ross D, Kramer, Stefan, and Helma, Christoph. Statistical evaluation of the predictive toxicology challenge 2000–2001. Bioinformatics, 19(10):1183–1193, 2003.
- Vullo & Frasconi (2004) Vullo, A and Frasconi, P. Disulfide connectivity prediction using recursive neural networks and evolutionary information. Bioinformatics, 20(5):653–659, 2004.
- Wale et al. (2008) Wale, Nikil, Watson, Ian A, and Karypis, George. Comparison of descriptor spaces for chemical compound retrieval and classification. Knowledge and Information Systems, 14(3):347–375, 2008.
- Yanardag & Vishwanathan (2015) Yanardag, P and Vishwanathan, SVN. Deep graph kernels. In Proc. of KDD-15, pp. 1365–1374, 2015.