Amplitude sensing below the zero-point fluctuations with a two-dimensional trapped-ion mechanical oscillator
Abstract
We present a technique to measure the amplitude of a center-of-mass (COM) motion of a two-dimensional ion crystal of 100 ions. By sensing motion at frequencies far from the COM resonance frequency, we experimentally determine the technique’s measurement imprecision. We resolve amplitudes as small as 50 pm, 40 times smaller than the COM mode zero-point fluctuations. The technique employs a spin-dependent, optical-dipole force to couple the mechanical oscillation to the electron spins of the trapped ions, enabling a measurement of one quadrature of the COM motion through a readout of the spin state. We demonstrate sensitivity limits set by spin projection noise and spin decoherence due to off-resonant light scattering. When performed on resonance with the COM mode frequency, the technique demonstrated here can enable the detection of extremely weak forces (1 yN) and electric fields (1 nV/m), providing an opportunity to probe quantum sensing limits and search for physics beyond the standard model.
pacs:
Measuring the amplitude of mechanical oscillators has engaged physicists for more than 50 years (Weber, 1966; Caves, 1980) and, as the limits of amplitude sensing have dramatically improved, produced exciting advances both in fundamental physics and in applied work. Examples include the detection of gravitational waves (Abbott et al., 2016), the coherent quantum control of mesoscopic objects (Aspelmeyer et al., 2014), improved force microscopy (Butt et al., 2005), and the transduction of quantum signals (Palomaki et al., 2013). During the past decade, optomechanical systems have facilitated increasingly sensitive techniques for reading out the amplitude of a mechanical oscillator (Teufel et al., 2009; Anetsberger et al., 2009; Westphal et al., 2012; Schreppler et al., 2014; Kampel et al., 2017), with a recent demonstration obtaining a measurement imprecision more than two orders of magnitude below , the amplitude of the ground-state zero-point fluctuations (Wilson et al., 2014). Optomechanical systems have assumed a wide range of physical systems, including toroidal resonators, nanobeams, and membranes, but the basic principle involves coupling the amplitude of a mechanical oscillator to the resonant frequency of an optical cavity mode (Aspelmeyer et al., 2014).
Crystals of laser-cooled, trapped ions behave as atomic-scale mechanical oscillators (Jost et al., 2009; Biercuk et al., 2010; Sawyer et al., 2012) with tunable oscillator modes and high quality factors (). Furthermore, laser cooling enables ground-state cooling and non-thermal state generation of these oscillators. Trapped-ion crystals therefore provide an ideal experimental platform for investigating the fundamental limits of amplitude sensing. Prior work has demonstrated the detection of coherently driven amplitudes larger than the zero-point fluctuations of the trapped ion oscillator (Biercuk et al., 2010; Sawyer et al., 2012; Shaniv and Ozeri, 2017), and reported impressive force sensing by injection locking an optically amplified oscillation of a single trapped ion (Knünz et al., 2010).
In this Letter we experimentally and theoretically analyze a technique to measure the center-of-mass (COM) motion of a two-dimensional, trapped-ion crystal of 100 ions with a sensitivity below . We employ a time-varying spin-dependent force that couples the amplitude of the COM motion with the internal spin degree of freedom of the ions (Bollinger et al., 2013; Sawyer et al., 2014; Ivanov, 2016). When the frequency matches the frequency of a driven COM oscillation, , spin precession proportional to occurs. The amplitude-dependent spin precession is analogous to the optomechanical frequency shift of a cavity mode. In contrast to the continuous measurement typical of optomechanics experiments, we measure the spin precession only at the end of the experimental sequence, with a precision imposed by spin projection noise (Itano et al., 1993).
To determine the read-out imprecision in a regime free from thermal noise, we perform measurements where is far from resonance with the trap axial frequency . Additionally, we implement a protocol where the phase of the measured quadrature randomly varies from one iteration of the experiment to the next, appropriate for sensing a force whose phase is unknown or not stable. For ions and , we detect amplitudes pm in a single implementation of the experimental sequence, and as small as 50 pm after averaging over 3,000 iterations of the sequence.
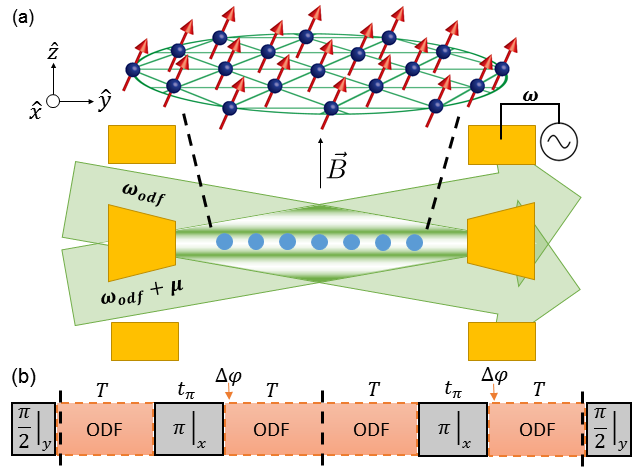
Our experimental apparatus, described in Fig. 1 and (Bollinger et al., 2013; Sawyer et al., 2014; Bohnet et al., 2016), consists of 9Be+ ions laser-cooled to the Doppler limit of 0.5 mK and confined to a single-plane Coulomb crystal in a Penning trap. The spin-1/2 degree of freedom is the ground-state valence electron spin . In the magnetic field of the Penning trap, the spin-flip frequency is 124 GHz. A resonant microwave source is used to perform global rotations of the spin ensemble. A pair of laser beams, detuned from the nearest optical transitions by 20 GHz, interfere to form a one-dimensional (1D) traveling-wave potential that produces a spin-dependent optical-dipole force (ODF). Optical pumping prepares the initial state with high fidelity. At the end of the experiment we measure the probability for an ion spin to be in from a global measurement of state-dependent resonance fluorescence on the Doppler cooling transition, where spin () is bright (dark).
If the ions are localized axially over an extent small compared with the wavelength of the 1D traveling-wave potential (Lamb-Dicke confinement), then the ODF couples the spin and motional degrees of freedom through the interaction (Bohnet et al., 2016)
| (1) |
Here is the magnitude of the ODF, where is the zero-to-peak potential (wave vector) of the 1D traveling-wave, is the frequency difference between the ODF beams, and and are the position operator and Pauli spin matrix for ion . The Debye-Waller factor reduces due to the departure from the Lamb-Dicke confinement regime (Wineland et al., 1998); for the conditions of this work. The potential , and therefore , is determined from AC Stark shift measurements on the ions (Britton et al., 2012). Typical maximum values for this work are kHz) resulting in yN.
Equation (1) describes a dependence of the spin transition frequency on the axial position of the ions and the ODF frequency . We excite a small, classically driven COM motion of constant amplitude with a weak RF drive on a trap endcap electrode (see Fig. 1(a)) at a frequency far from . If , Eq. (1) produces an approximately constant shift in the spin transition frequency. With , this shift is given by
| (2) |
For , the static shift of the spin transition frequency is simply .
We measure from the resulting spin precession in an experiment like that shown in Fig. 1(b). Ideally, spin precession can be measured using a Ramsey-type experiment. First, the ions are prepared in the state, followed by a microwave pulse about that rotates the spins to the axis. The spins precess for an interaction time so that the resulting spin precession on resonance is , where . After a final pulse about , the final state readout measures the population of the spins in , . Here is the decay rate from spontaneous emission from the off-resonant ODF laser beams (Uys et al., 2010). To detect small amplitudes with the available in our set-up, we extend the spin-precession time to ms. To avoid decoherence due to magnetic field fluctuations and coherently accumulate spin precession, we use a quantum lock-in (Kotler et al., 2011) sequence where during the interaction time the spin precession is interrupted by a train of -pulses that are synchronized with phase jumps enforced on the ODF beams (Sup, ). In particular, we use a Carr-Purcell-Meiboom-Gill (CPMG) sequence with ODF--ODF segments (, see Fig. 1(b)).
We ensure the phase randomly varies from one iteration of the CPMG sequence to the next, effectively measuring a random quadrature of the motion for each experimental trial. Different experimental trials therefore result in a different precession , as indicated in Fig. 3. We measure the collective dephasing (or decoherence) averaged over many experimental trials . Here the brackets denote an average over many iterations of the CPMG sequence. Averaging over the random phase yields (Kotler et al., 2013)
| (3) |
with the zeroth-order Bessel function of the first kind.
To create the steady-state COM axial oscillation , we applied a continuous AC voltage to an endcap of the Penning trap at a frequency near 400 kHz. This frequency was chosen because it was far from any motional mode frequencies of the ion crystal, and there were no observed noise sources. Thus, the background, i.e. the signal without the driven COM axial motion such that , was fully characterized by decoherence due to spontaneous emission and is given by . We calibrated the displacement of the ions due to a static voltage applied to the endcap by measuring the resulting movement of the ion crystal in the side-view imaging system. From this calibration, we determined that a 1 V offset results in a 0.97(5) m displacement of the ions. We estimate that the corrections for using this DC calibration to estimate for an kHz drive is less than 10.
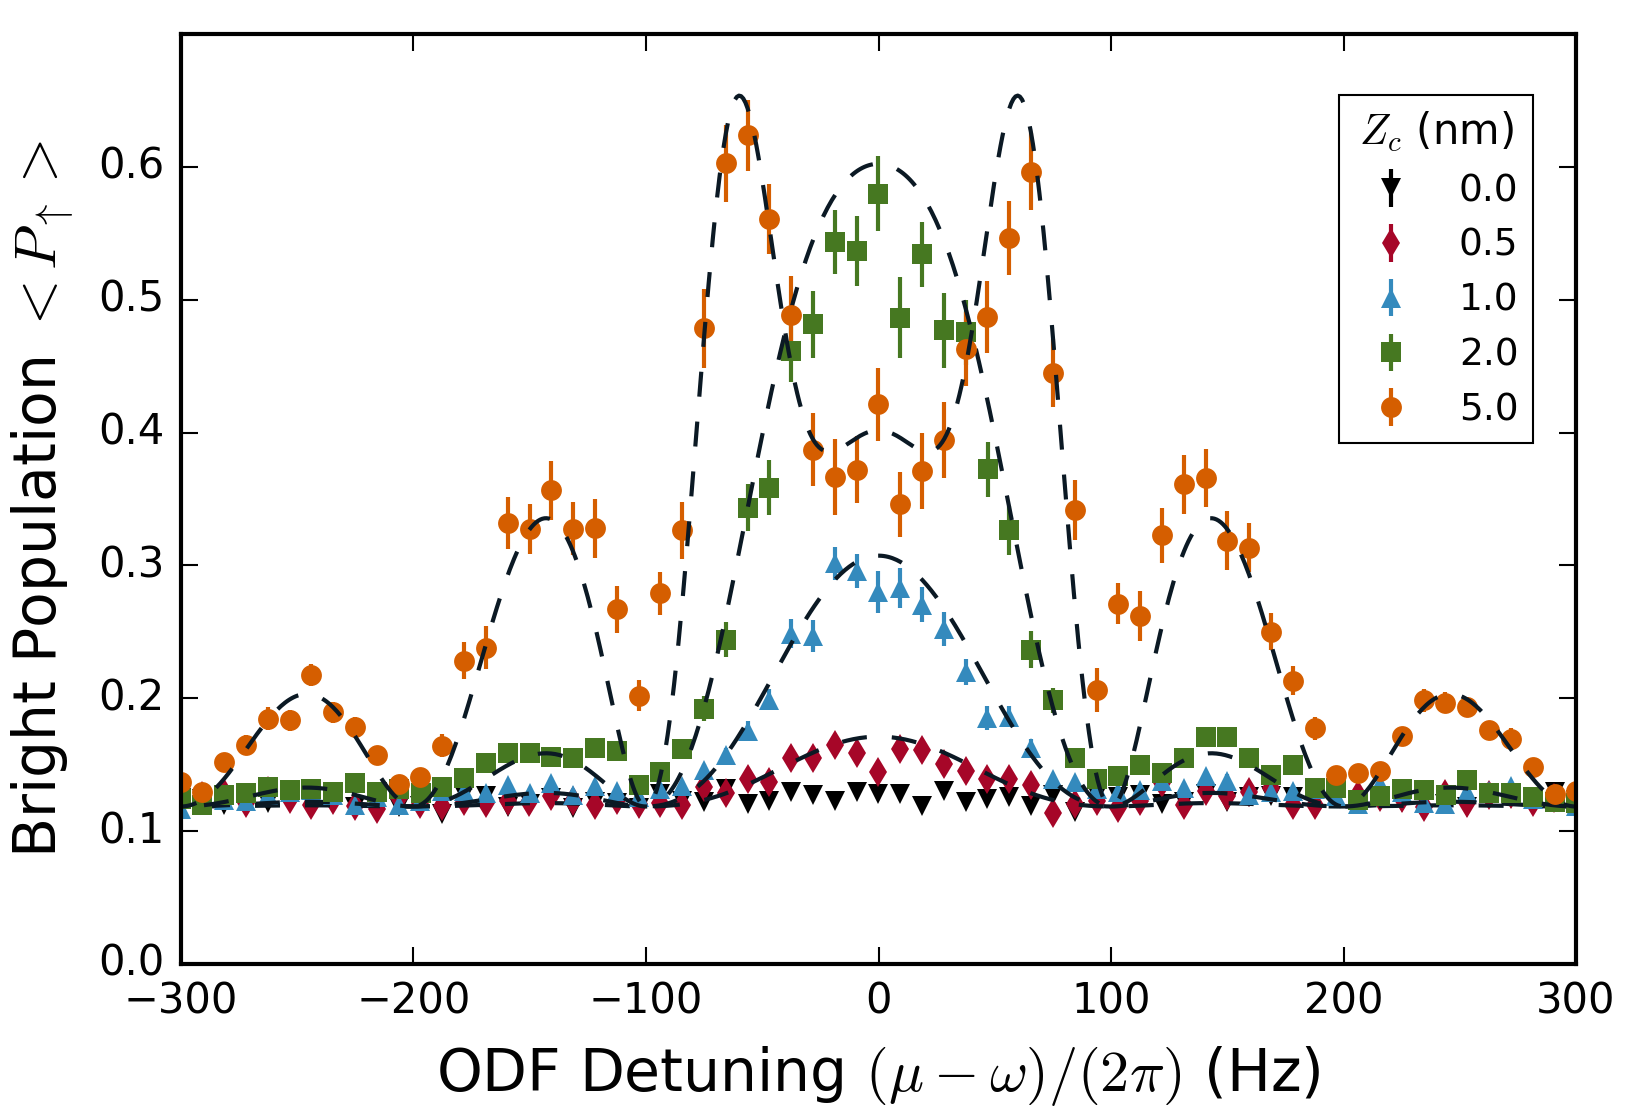
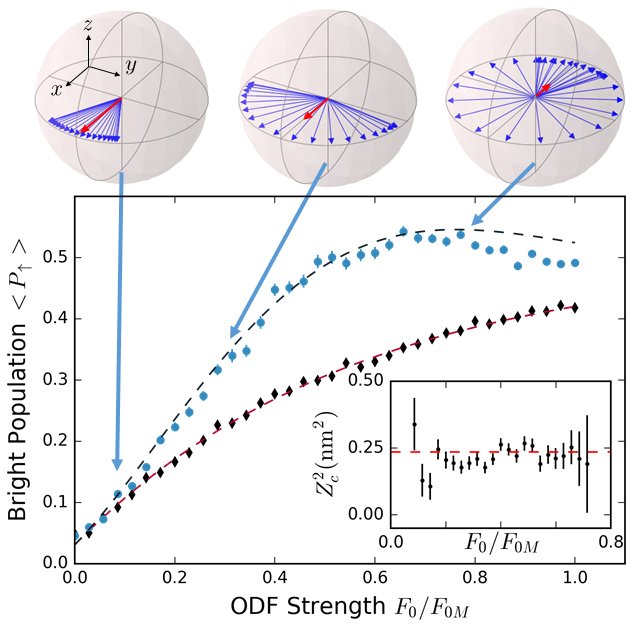
Figure 2 shows the emergence of the measured spin precession signal out of the background as the amplitude is increased from 500 pm to 5 nm. The measured lineshape agrees well with the prediction, detailed in (Sup, ), involving no free parameters. Figure 3 shows the background and the measured resonant () response to a = 485 pm oscillation for a range of ODF strengths , where is the maximum possible with our current set-up ( yN). Agreement with Eq. (3) involving no free parameters is excellent. For both Figs. 2 and 3 the background is within of that determined by independent measurements of the spontaneous emission decay rates of each ODF beam (Britton et al., 2012). The amplitude can be determined from the difference (Sup, ). We note that depends on . Therefore, the sensing protocol described here directly measures . The inset of Fig. 3 shows a determination of for a range of ODF strengths. The uncertainties were calculated from the measured noise of the measurements using standard error propagation. These uncertainties go through a minimum, indicating an optimum value for determining .
To explore the ultimate amplitude sensing limits of our protocol, we performed repeated pairs of measurements, first with to get the background, and then with . For a given , 3,000 pairs of measurements were used to determine the average difference and the standard deviation of the difference for a single pair of measurements. For each , was set close to the value that maximizes the signal-to-noise ratio for determining . This occurs for relatively small such that . Then, the signal-to-noise ratio for determining from a single pair of measurements is approximately
| (4) |
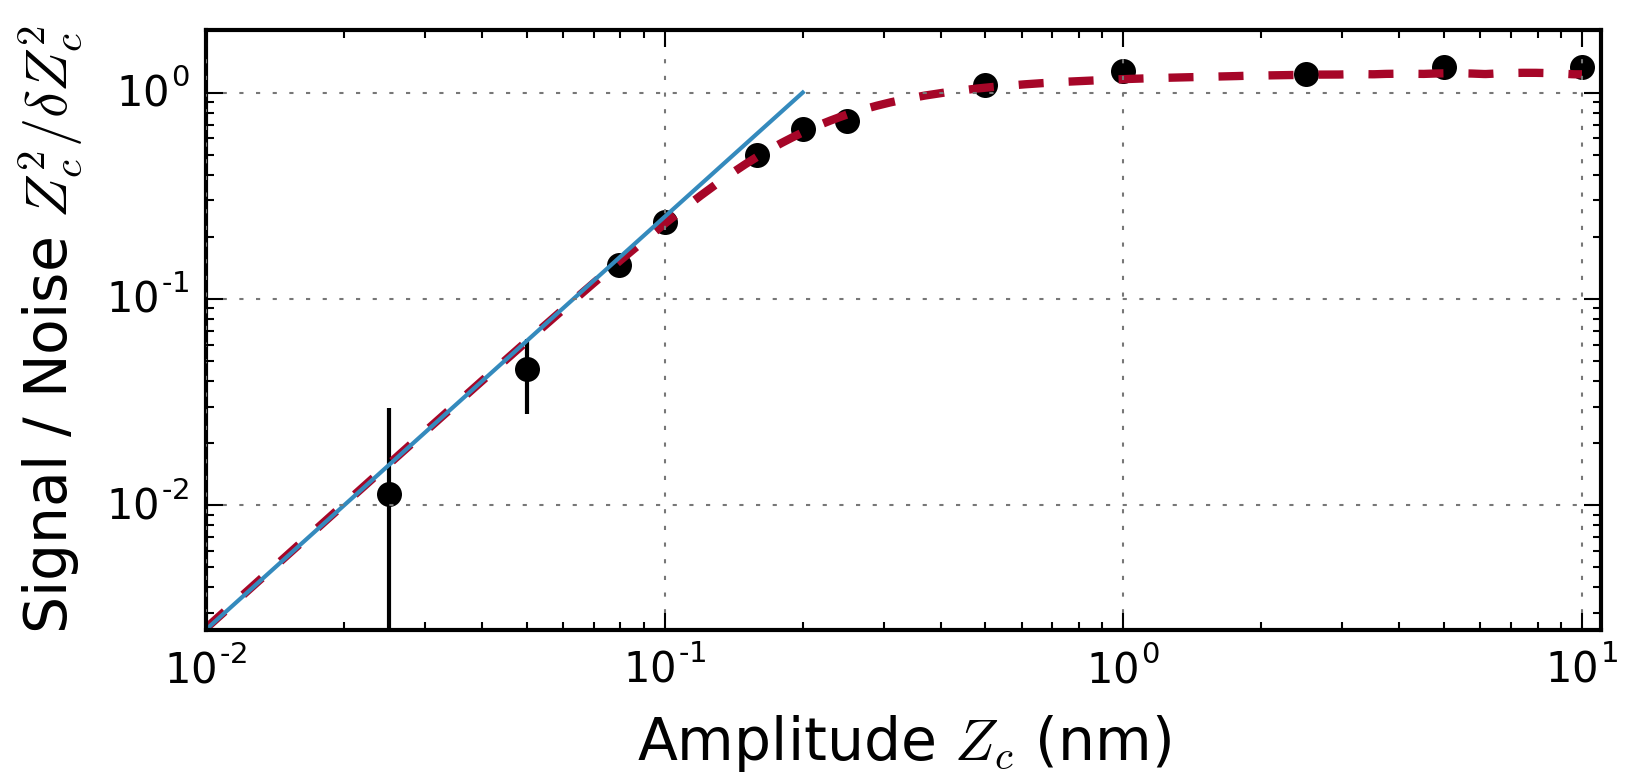
Figure 4 displays Eq. (4) from measurements acquired with ranging from 10 nm to as small as 0.025 nm. Excellent agreement is observed with a model (dashed red line) that assumes the only noise sources are projection noise in the spin-state detection and fluctuations in produced by random variation in the phase from one experimental trial to the next.
For amplitudes , fluctuations in due to the random variation of the phase for different experimental trials dominates. This situation is depicted by the middle Bloch sphere of Fig. 3. Here the fluctuations in are comparable to the difference , limiting the signal-to-noise of a single determination of to . As decreases, this noise and the signal decrease while projection noise stays approximately the same, resulting in a decreasing . For small , we show the sensitivity is determined by , , and the ratio of the spontaneous decay rate to the optical potential (Sup, ), according to
| (5) |
For and values of , , and relevant for our set-up, Eq. (5) predicts , displayed as the blue line in Fig. 4. On the log-log plot the slope of 2 is the result of a signal proportional to along with a constant readout noise of the spins (here projection noise). We perform 16 pairs of measurements in 1 s, so the signal-to-noise for a single pair of measurements corresponds to a long averaging time sensitivity of (recall that our protocol measures ).
Figure 4 documents a good understanding of the sensing limits of our protocol, indicating how the measurement can be improved in the future. Equation (5) scales as , resulting in significant improvements for set-ups with less spontaneous decay. By stabilizing the ODF beatnote phase with respect to the classical drive (Hume et al., 2011; Biercuk et al., 2011) we could repeatedly measure the same quadrature of motion and realize a substantial improvement in sensitivity. For this phase-coherent protocol, assuming and current parameters of our set-up, we estimate (Sup, ) a measurement imprecision of 74 pm for a single implementation of the experimental sequence. This is times smaller than , producing a long averaging time sensitivity of . The use of spin-squeezed states, recently demonstrated in this system (Bohnet et al., 2016), can provide an additional enhancement by reducing the projection noise of the readout.
The 50 pm amplitude detected in Fig. 4 at a frequency far from resonance corresponds to an electric field detection of 0.46 mV/m or 73 yN/ion. These force and electric field sensitivities can be improved by the of the COM mode by probing near resonance with . Quality factors should be possible with trapped-ion COM modes. The detection of a 20 pm amplitude resulting from a 100 ms coherent drive on the 1.57 MHz COM mode is sensitive to a force/ion of corresponding to an electric field of . Electric field sensing below nV/m enables searches for hidden-photon dark matter (Arias et al., 2012; Chaudhuri et al., 2015), although shielding effects must be carefully considered. Ion traps typically operate with frequencies between 50 kHz and 5 MHz, providing a sensitivity to hidden-photon masses from eV to eV.
By sensing COM motion far from resonance, we calibrate the measurement imprecision of our protocol in the absence of thermal noise and back action. Probing on resonance with a measurement imprecision below will be sensitive to thermal fluctuations and back action due to spin-motion entanglement (Sawyer et al., 2014). This motivates the investigation of potential back-action-evading protocols with trapped ion set-ups. For the phase coherent measurement of a single quadrature, back action due to spin-motion entanglement can be evaded through the introduction of the appropriate correlations between spin and motion (Hempel et al., 2013).
In summary, we have presented a technique for amplitude sensing below of a trapped ion mechanical oscillator. By employing a spin-dependent force to couple the spin and motional degrees of freedom of the ions, the amplitude of the COM motion may be determined. We detected a 500 pm amplitude in a single experimental trial and demonstrated a long measurement time sensitivity of with a protocol where the phase of the measured quadrature randomly varies. Modifications of our set-up should enable repeated measurements of the same quadrature, with a measurement imprecision of 74 pm for a single experimental trial with ions, providing opportunities for trapped ion mechanical oscillators to explore the quantum limits of amplitude and force sensing, and enable new tools in the search for physics beyond the standard model.
Acknowledgements.
We thank V. Sudhir, R. Ozeri, S. Kotler, J. Teufel, J. Jaeckel, J. E. Jordan, and D. Kienzler for stimulating discussions. K.G. is supported by NSF grant PHY 1521080. This manuscript is a contribution of NIST and not subject to U.S. copyright.References
- Weber (1966) J. Weber, Physical Review Letters 17, 1228 (1966).
- Caves (1980) C. M. Caves, Physical Review Letters 45, 75 (1980).
- Abbott et al. (2016) B. P. Abbott et al. (LIGO Scientific Collaboration and Virgo Collaboration), Physical Review Letters 116, 061102 (2016).
- Aspelmeyer et al. (2014) M. Aspelmeyer, T. J. Kippenberg, and F. Marquardt, Reviews of Modern Physics 86, 1391 (2014).
- Butt et al. (2005) H.-J. Butt, B. Cappella, and M. Kappl, Surface Science Reports 59, 1 (2005).
- Palomaki et al. (2013) T. A. Palomaki, J. W. Harlow, J. D. Teufel, R. W. Simmonds, and K. W. Lehnert, Nature 495, 210 (2013).
- Teufel et al. (2009) J. D. Teufel, T. Donner, M. A. Castellanos-Beltran, J. W. Harlow, and K. W. Lehnert, Nature Nanotechnology 4, 820 (2009).
- Anetsberger et al. (2009) G. Anetsberger, O. Arcizet, Q. P. Unterreithmeier, R. Rivière, A. Schliesser, E. M. Weig, J. P. Kotthaus, and T. J. Kippenberg, Nature Physics 5, 909 (2009).
- Westphal et al. (2012) T. Westphal, D. Friedrich, H. Kaufer, K. Yamamoto, S. Goßler, H. Müller-Ebhardt, S. L. Danilishin, F. Y. Khalili, K. Danzmann, and R. Schnabel, Physical Review A 85, 063806 (2012).
- Schreppler et al. (2014) S. Schreppler, N. Spethmann, N. Brahms, T. Botter, M. Barrios, and D. M. Stamper-Kurn, Science 344, 1486 (2014).
- Kampel et al. (2017) N. S. Kampel, R. W. Peterson, R. Fischer, P.-L. Yu, K. Cicak, R. W. Simmonds, K. W. Lehnert, and C. A. Regal, Phys. Rev. X 7, 021008 (2017).
- Wilson et al. (2014) D. J. Wilson, V. Sudhir, N. Piro, R. Schilling, a. Ghadimi, and T. J. Kippenberg, Nature 524, 325 (2014).
- Jost et al. (2009) J. D. Jost, J. P. Home, J. M. Amini, D. Hanneke, R. Ozeri, C. Langer, J. J. Bollinger, D. Leibfried, and D. J. Wineland, Nature 459, 683 (2009).
- Biercuk et al. (2010) M. J. Biercuk, H. Uys, J. W. Britton, A. P. VanDevender, and J. J. Bollinger, Nature Nanotechnology 5, 646 (2010).
- Sawyer et al. (2012) B. C. Sawyer, J. W. Britton, A. C. Keith, C.-C. J. Wang, J. K. Freericks, H. Uys, M. J. Biercuk, and J. J. Bollinger, Physical Review Letters 108, 213003 (2012).
- Shaniv and Ozeri (2017) R. Shaniv and R. Ozeri, Nature Communications 8, 14157 (2017).
- Knünz et al. (2010) S. Knünz, M. Herrmann, V. Batteiger, G. Saathoff, T. W. Hänsch, K. Vahala, and T. Udem, Physical Review Letters 105, 013004 (2010).
- Bollinger et al. (2013) J. J. Bollinger, J. W. Britton, and B. C. Sawyer, AIP Conference Proceedings 1521, 200 (2013).
- Sawyer et al. (2014) B. C. Sawyer, J. W. Britton, and J. J. Bollinger, Physical Review A 89, 033408 (2014).
- Ivanov (2016) P. A. Ivanov, Physical Review A 94, 022330 (2016).
- Itano et al. (1993) W. M. Itano, J. C. Bergquist, J. J. Bollinger, J. M. Gilligan, D. J. Heinzen, F. L. Moore, M. G. Raizen, and D. J. Wineland, Physical Review A 47, 3554 (1993).
- Bohnet et al. (2016) J. G. Bohnet, B. C. Sawyer, J. W. Britton, M. L. Wall, A. M. Rey, M. Foss-Feig, and J. J. Bollinger, Science 352, 1297 (2016).
- (23) See Supplemental Material for technical details and derivations .
- Wineland et al. (1998) D. J. Wineland, C. Monroe, W. M. Itano, D. Leibfried, B. E. King, and D. M. Meekhof, Journal of Research of the National Institute of Standards and Technology 103, 259 (1998).
- Britton et al. (2012) J. W. Britton, B. C. Sawyer, A. C. Keith, C.-C. J. Wang, J. K. Freericks, H. Uys, M. J. Biercuk, and J. J. Bollinger, Nature 484, 489 (2012).
- Uys et al. (2010) H. Uys, M. J. Biercuk, A. P. VanDevender, C. Ospelkaus, D. Meiser, R. Ozeri, and J. J. Bollinger, Physical Review Letters 105, 200401 (2010).
- Kotler et al. (2011) S. Kotler, N. Akerman, Y. Glickman, A. Keselman, and R. Ozeri, Nature 473, 61 (2011).
- Kotler et al. (2013) S. Kotler, N. Akerman, Y. Glickman, and R. Ozeri, Physical Review Letters 110, 110503 (2013).
- Johansson et al. (2012) J. R. Johansson, P. D. Nation, and F. Nori, Computer Physics Communications 183, 1760 (2012).
- Hume et al. (2011) D. B. Hume, C. W. Chou, D. R. Leibrandt, M. J. Thorpe, D. J. Wineland, and T. Rosenband, Physical Review Letters 107, 243902 (2011).
- Biercuk et al. (2011) M. J. Biercuk, H. Uys, J. W. Britton, A. P. VanDevender, and J. J. Bollinger, Optics Express 19, 10304 (2011).
- Arias et al. (2012) P. Arias, D. Cadamuro, M. Goodsell, J. Jaeckel, J. Redondo, and A. Ringwald, Journal of Cosmology and Astroparticle Physics 2012, 013 (2012).
- Chaudhuri et al. (2015) S. Chaudhuri, P. W. Graham, K. Irwin, J. Mardon, S. Rajendran, and Y. Zhao, Physical Review D 92, 075012 (2015).
- Hempel et al. (2013) C. Hempel, B. P. Lanyon, P. Jurcevic, R. Gerritsma, R. Blatt, and C. F. Roos, Nature Photonics 7, 630 (2013).