Detection of faint broad emission lines in type 2 AGN: II. On the measurement of the BH mass of type 2 AGN and the unified model
Abstract
We report the virial measurements of the BH mass of a sample of 17 type 2 AGN, drawn from the Swift/BAT 70-month 14-195 keV hard X-ray catalogue, where a faint BLR component has been measured via deep NIR (0.8-2.5 m) spectroscopy. We compared the type 2 AGN with a control sample of 33 type 1 AGN. We find that the type 2 AGN BH masses span the 5 log( /) 7.5 range, with an average log(/M☉) = 6.7, which is 0.8 dex smaller than found for type 1 AGN. If type 1 and type 2 AGN of the same X-ray luminosity log(/erg s-1) 43.5 are compared, type 2 AGN have 0.5 dex smaller BH masses than type 1 AGN. Although based on few tens of objects, this result disagrees with the standard AGN unification scenarios in which type 1 and type 2 AGN are the same objects observed along different viewing angles with respect to a toroidal absorbing material.
keywords:
galaxies: active — infrared: galaxies — quasars: emission lines — quasars: supermassive black hole1 Introduction
In the last decade, by using hard X-ray (2-10 keV) selected Active Galactic Nuclei (AGN) samples, it has been possible to accurately derive the AGN luminosity function up to (e.g. Ueda et al., 2014). Moreover, by using virial based techniques in the optical band on samples of broad line, type 1, AGN (AGN1), it has been possible to estimate the super massive Black Hole (BH) mass function (e.g. Greene & Ho, 2007; Kelly et al., 2010; Schulze et al., 2015). However, the BH mass () measurements are affected by several selection biases against the narrow line, type 2, AGN (AGN2), or low luminosity AGN, where the Broad Line Region (BLR) is not visible in the rest-frame optical band because of either dust absorption or dilution by the host galaxy spectra (see e.g. Baldassare et al., 2016).
According to the original standard unified model (Antonucci, 1993), the different observational classes of AGN (AGN1 and AGN2) are believed to be the same kind of objects observed under different conditions (e.g. different orientations of the observer with respect to a dusty torus). In the framework of the AGN phenomenon and co-evolution, this implies that AGN with the same luminosity should share, on average, the same properties (e.g same masses, same accretion rates and, then, same Eddington ratios ).
Nevertheless, nowadays there is growing evidence that AGN1 and AGN2 could belong to intrinsically different populations (see e.g. Elitzur, 2012; Lanzuisi et al., 2015), having, on average, different luminosities (lower for AGN2; Ueda et al., 2003; La Franca et al., 2005; Ueda et al., 2014), different accretion rates (smaller for AGN2, Winter et al., 2010; Lusso et al., 2012), different host galaxy properties (more late type for AGN2), different clustering, environment and halo mass properties (Allevato et al., 2014).
The observed difference in the luminosity distributions of AGN1 and AGN2 could however still comply with an orientation-based unified model in which the torus opening angle (or the absorbing material covering factor) depends on luminosity. In this scenario many of the observed differences between the AGN1 and the AGN2 population can be attributed to selection effects. On the contrary, if a difference is measured in the average (or host halo mass and clustering properties) of AGN1 and AGN2 sharing the same intrinsic (corrected for absorption) luminosity, then AGN1 and AGN2 should be intrinsically different objects and the unified model should be revised.
We have therefore started a project aimed at measuring the BH mass in AGN2 (La Franca et al., 2015; La Franca et al., 2016; Ricci et al., 2017; Onori et al., 2017). In those few studies where AGN2 BH masses have been derived (e.g. Heckman et al., 2004, from SDSS), the authors used the -host scaling relations that have not yet been proven to hold for such a population (see Graham, 2008; Kormendy et al., 2011). Several studies have shown that many AGN2 exhibit faint broad line components if observed with high (20) S/N in the near-infrared (NIR; 0.8-2.5 m), where the dust absorption is less severe than in the optical (Veilleux et al., 1997; Riffel et al., 2006; Cai et al., 2010). Moreover observation in the NIR of AGN1, whose were measured using reverberation mapping techniques (RM; Blandford & McKee, 1982; Peterson, 1993), have demonstrated that the virial method to measure can be efficiently used with the NIR Pa 1.875 m and Pa 1.282 m lines (Kim et al., 2010; Landt et al., 2011).
Following the above studies and, as it is observed for the optical continuum luminosity, the empirical relation between the X-ray luminosity and the dimension of the BLR (; Maiolino et al., 2007; Greene et al., 2010), Ricci et al. (2017) have calibrated new virial relations between the of the most relevant NIR emission lines (Pa, Pa, HeI 1.083 m) and the intrinsic hard X-ray luminosity, , of the type . These relations can be used to measure of either AGN2 or obscured and low luminosity AGN1 (see also La Franca et al., 2015; La Franca et al., 2016).
In this paper we present the measurement for of a sample of AGN2 selected from the Swift/BAT 70-month catalogue (Baumgartner et al., 2013) where a faint BLR component in the NIR emission line was found (Onori et al., 2017). We compare the resulting distribution with that of a control sample of AGN1 selected from the Swift/BAT 70-month catalogue and whose have been measured via RM techniques. We adopt a , and H0 = 70 km s-1Mpc-1 cosmology. Unless otherwise stated, all the quoted uncertainties are at 68% confidence level.
2 Data and samples
In order to measure the BH mass of the AGN2, we have carried out NIR spectroscopic observations of 41 obscured and intermediate class AGN (type 2, 1.9 and 1.8; all named AGN2 in the following) at redshift 0.1, randomly selected from the Swift/BAT 70-month catalogue. Thanks to the very hard X-ray band (14-195 keV) that has been used to build the catalogue, the parent AGN sample is free of absorption selection effects up to log cm-2 (see e.g. Figure 11 in Burlon et al., 2011). The observations have been carried out in the framework of a systematic study of the AGN2 NIR spectral properties and have been executed using ISAAC/VLT, X-shooter/VLT and LUCI/LBT spectrometers, with a spectral resolution of 65 km s-1, 20-78 km s-1and 220 km s-1, respectively, and reaching an average S/N ratio of 30 per resolution element. A BLR component showing 800 FWHM 3500 km s-1, significantly larger than the NLR component measured in the same spectra, has been identified in 13 out of 41 AGN2 ( 30% of the total sample). The data reduction, spectral analysis and line fitting parameters (FWHM and fluxes of the most relevant emission lines) have been published in a companion paper (Onori et al., 2017). The sample has been extended with 4 AGN2 included in the Swift/BAT 70-month catalogue whose FWHM NIR lines, or spectra, were available in the literature. The spectral data, when available, have been fitted using the technique described in Onori et al. (2017). In Table 1 we list the FWHM of the BLR components of the HeI and Pa lines of the AGN2 sample (in the following called AGN2/BLR sample).
In Figure 1 (top) we show the distributions of all the AGN2 included in the Swift/BAT 70-month catalogue (red dot-dashed line) as well as the distributions of the 17 AGN2/BLR (red continuous line). The average X-ray luminosity is log = 43.5 with a spread (log)=0.9 and log =42.9 erg s with a spread (log)=0.9, for the Swift/BAT AGN2 and the AGN2/BLR, respectively.
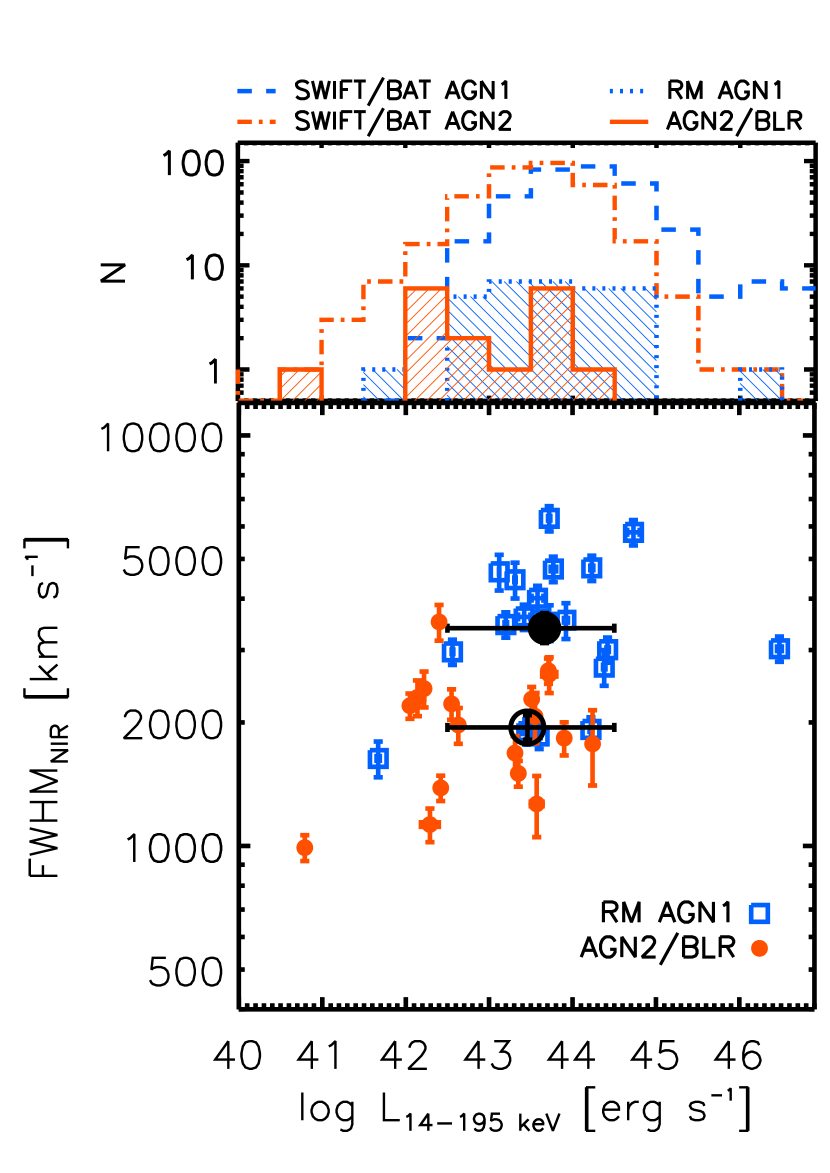
In order to build a control sample of AGN1 to be compared with the results obtained from the AGN2 population we have used 33 AGN1 included in the Swift/BAT 70-month catalogue and whose have been measured via RM techniques. This sample includes those 31 AGN1 selected by Ricci et al. (2017, Table 1) plus two additional RM AGN1, namely 3C 390.3 (=44.88 erg s, M⊙) and Mrk 50 (=43.45 erg s, M⊙) (see Table 1 in Ho & Kim, 2014, and references therein). In Figure 1 (top) we show the distribution of all the AGN1 included in the Swift/BAT 70-month catalogue (blue dashed line) as well as the distribution of the control sample of 33 AGN1 (blue dotted line). The average X-ray luminosity is log = 44.3 with a spread (log)=1.0 and log = 43.8 with a spread (log)=1.0, for the Swift/BAT AGN1 and the control sample of AGN1, respectively.
| FWHM | |||||||||||
| Object Name | class | W2-W4 | log() | NIR | log() | log | |||||
| mag | mag | erg s-1 | km s-1 | km s-1 | km s-1 | M⊙ | erg s-1 | ||||
| (1) | (2) | (3) | (4) | (5) | (6) | (7) | (8) | (9) | (10) | (11) | (12) |
| 2MASX J05054575–2351139 | 0.0350 | 2 | … | 5.80 | 44.24 | 1772 | … | 1772 | 7.37 0.18 | 45.50 | 0.849 |
| 2MASX J18305065+0928414 | 0.0190 | 2 | … | 4.45 | 42.40 | 3513 | … | 3513 | 7.04 0.09 | 43.09 | 0.009 |
| ESO 234-G-050 | 0.0088 | 2 | 0.8 | 6.30 | 42.29 | 1110 | 1304 | 1128 | 6.00 0.10 | 42.98 | 0.076 |
| ESO 374-G-044 | 0.0284 | 2 | … | 6.96 | 43.57 | 1123 | 1412 | 1265 | 6.74 0.15 | 44.71 | 0.742 |
| MCG -01-24-12 | 0.0196 | 2 | … | 6.32 | 43.55 | … | 2069 | 2069 | 7.16 0.12 | 44.24 | 0.096 |
| MCG -05-23-16 | 0.0085 | 2 | 6.8 | 5.84 | 43.51 | 2474 | 2133 | 2278 | 7.22 0.06 | 44.20 | 0.075 |
| Mrk 1210 | 0.0135 | 2 | … | 6.92 | 43.35 | 1305 | 1936 | 1502 | 6.78 0.06 | 44.36 | 0.303 |
| NGC 1052 | 0.0050 | 2 | 1.5a | 5.12 | 42.22 | 2417 | … | 2417 | 6.63 0.09 | 42.91 | 0.015 |
| NGC 1365 | 0.0055 | 1.8 | 5.2 | 7.31 | 42.63 | … | 1971 | 1971 | 6.65 0.09 | 43.32 | 0.037 |
| NGC 2992 | 0.0077 | 2 | 5.1a | 6.25 | 42.55 | 3157 | 2055 | 2218 | 6.72 0.08 | 43.24 | 0.026 |
| NGC 4395 | 0.0013 | 1.9 | 4.0 | 6.32 | 40.79 | 1332 | 851 | 990 | 5.14 0.07 | 41.48 | 0.017 |
| NGC 6221 | 0.0050 | 2 | 3.2 | 7.41 | 42.05 | 2141 | 2256 | 2195 | 6.46 0.06 | 42.74 | 0.015 |
| NGC 7314 | 0.0048 | 1.9 | 4.4 | 5.70 | 42.42 | 1427 | 1347 | 1384 | 6.24 0.06 | 43.11 | 0.058 |
| NIR data taken from the literature | |||||||||||
| IRAS F 05189-2524 | 0.0426 | 2 | … | 6.26 | 43.72 | … | 2619b | 2619 | 7.45 0.10 | 44.41 | 0.073 |
| Mrk 348c | 0.0150 | 2/FSRQ | … | 5.51 | 43.90 | 1917 | 1514 | 1830 | 7.23 0.08 | 44.98 | 0.448 |
| NGC 1275c | 0.0176 | 2 | … | 6.91 | 43.71 | 2547 | 2824 | 2671 | 7.46 0.06 | 44.40 | 0.069 |
| NGC 7465 | 0.0065 | 2 | … | 5.78 | 42.14 | … | 2300d | 2300 | 6.54 0.10 | 42.83 | 0.015 |
Notes: (1) AGN name; (2-3) redshift, source classification (from Baumgartner et al., 2013); (4) optical-NIR extinction; (5) mid-IR 4.6-22 m color; (6) 14-195 keV intrinsic luminosity (from Baumgartner et al., 2013); (7)-(8) intrinsic (corrected for instrumental resolution) FWHM of the broad emission line component of He I and Pa from Onori et al. (2017); (9) Average FWHM of the HeI and Pa lines; (10) derived with the virial relation a3 of Table 4 from Ricci et al. (2017). A constant virial factor (Grier et al., 2013) has been adopted. An uncertainty dex, due to the spread of the population, should also be taken into account (Ricci et al., 2017). (11)-(12) bolometric luminosity and corresponding Eddington ratio, both calculated adopting the K-correction of Vasudevan & Fabian (2007). a) From Burtscher et al. (2015) b) Measure of the FWHM of the Pa line from Cai et al. (2010). c) The FWHM have been measured applying the fitting procedure described by Onori et al. (2017) on the data published by Riffel et al. (2006). d) From Ramos Almeida et al. (2009).
3 Comparison between the AGN1 and AGN2 populations
As discussed by Landt et al. (2008); Onori et al. (2017); Ricci et al. (2017), the most relevant NIR emission lines of the BLR (Pa, Pa, HeI 1.083 m) have, within the errors, the same FWHM. Therefore, a more robust BLR FWHM measure can be obtained using the average width (FWHMNIR) of these lines (when available). In Figure 1 (bottom) we show the FWHMNIR of the BLR, derived using the HeI and Pa lines, as a function of the intrinsic X-ray luminosity for both the AGN1 (blue open squares) and the AGN2/BLR (red filled circles) samples. Of the 33 AGN1, only the 20 with NIR emission-line measurements are plotted. As expected from the studies of the AGN X-ray LF (e.g. Ueda et al., 2003; La Franca et al., 2005; Ueda et al., 2014) AGN1 have on average larger luminosities than AGN2. However, in the luminosity range where the two distributions overlap, 42.5 log44.5, AGN1 show significantly larger FWHM than AGN2: 3400 km s-1 instead of 1970 km s-1(log(FWHM)=3.5310.036 and log(FWHM)=3.2940.032 for AGN1 and AGN2/BLR, respectively).
In order to compute the AGN2 we have used the relation
| (1) |
which is based on the measure of the average FWHM observed in the NIR and the hard X-ray 14-195 keV luminosity. The relation has been calibrated by Ricci et al. (2017, see solution a3 in their Table 4) assuming a common virial factor (Grier et al., 2013, but see the discussion about this assumption in Sec. 4). According to the above equation, the measure of depends on the square root of the luminosity (as typical in the single epoch virial relations, Vestergaard, 2002) and the square power of the FWHM. Therefore the observed narrower (by a factor 0.25 dex) FWHM in the AGN2 sample implies (a factor dex) smaller for AGN2, if compared with AGN1 of the same luminosity.
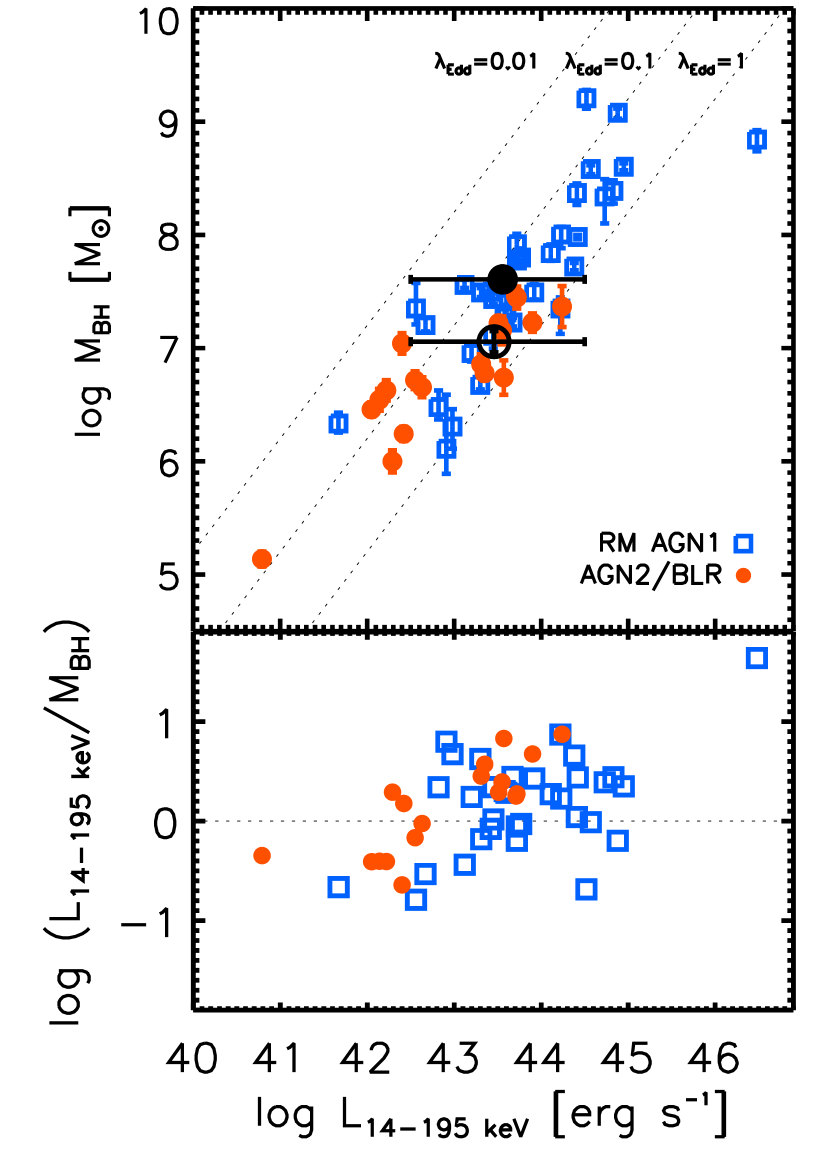
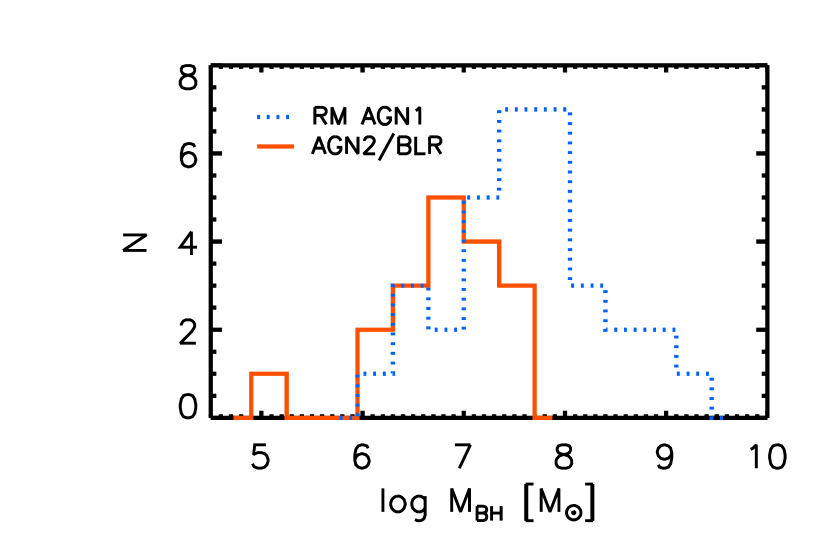
In Figure 2 the as a function of of the AGN1 (blue open squares) and AGN2/BLR (red filled circles) samples is shown. For the AGN1 sample, has been derived using the RM technique. As also shown in Figure 3, the of AGN2/BLR (red continuous line) are typically smaller than AGN1 (blue dotted line). The average (largest) is log(/M☉) () in the AGN2 sample, while in the control AGN1 sample is log(/M☉) (). In the 42.5 log( / )44.5 luminosity bin the average of the AGN2 sample is 0.5 dex smaller than that measured in the AGN1 sample (log(/M☉) and log(/M☉) , for AGN2/BLR and AGN1, respectively). For the sub-sample of 20 AGN1 for which the FWHMNIR measurements are available, the average obtained using eq. 1, instead of using the RM measurements, is very similar: log(/) 111Indeed eq. 1 has been calibrated by Ricci et al. (2017) using almost the same RM AGN1 of the control sample (31 out of 37 objects are in common)..
The above result is also illustrated in Figure 2 (bottom), where the / ratio (which is a proxy of the Eddington ratio ), plus a constant, is shown as a function of . We computed the Eddington ratio assuming the bolometric correction of Vasudevan & Fabian (2007)222As parameterized by Shankar et al. (2013, eq. 22, in which, because of a typo, log should read log). No significant difference in the results was found by using the bolometric correction of Marconi et al. (2004). (see Table 1). In the overlapping luminosity bin 42.5log(/)44.5, AGN2 have on average 0.3 dex larger than AGN1 (log and log, for AGN2/BLR and AGN1, respectively).
4 Analysis of possible selection effects
Although based on few tens of objects, at face value our results imply that AGN2 have on average about 0.25 dex lower BLR FWHM, and 0.5 dex lower (larger ) than AGN1 of the same luminosity. In Onori et al. (2017) we have investigated whether our FWHM measurements could be affected by some selection biases. No dependence was found in the sample where the BLR was measured on both the X-ray and NIR fluxes, on the orientation angle of the host galaxy or on the hydrogen column density, , measured in the X-ray band.
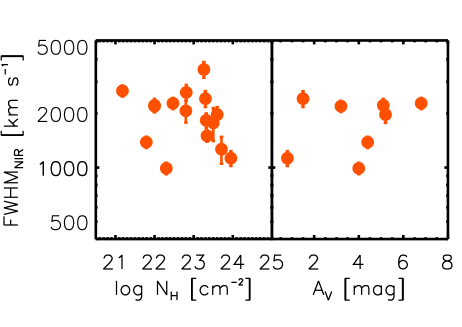
A possible selection could be originated by the effects of the absorption/reddening medium along the line of sight, which is obviously present as it is at the origin of the AGN2 classification, and then large values ( 1021 cm-2 s-1) are typically measured in AGN2. One scenario could be that the most central parts of the BLR are embedded in a region of absorbing material and the broad components that we have detected originate in the outer, and therefore slower, part of the BLR. In this case a trend should be visible where the largest FWHM are detected in the less X-ray absorbed and/or less reddened objects. As shown in Figure 4, where we plot the FWHM as a function of and as a function of the extinction , we do not find such trends in our AGN2 sample. The extinction has been estimated in 8 AGN2 using either the BLR Paschen and Balmer line ratios (when available), assuming a Milky Way reddening law (Allen, 1976) and RV=3.1, or the values derived by Burtscher et al. (2015) using a “dust color” method (see Table 1). The measured - distribution of our AGN2 sample is typical of the AGN2 population (see e.g. Burtscher et al., 2016, Fig. 3).
The presence of dust inside the BLR is unlikely as it would disagree with the results obtained through dust RM at K-band wavelength, that the time lag of the inner radius of the torus is three to four times longer than the H time lag (Burtscher et al., 2013; Vazquez et al., 2015, and references therein). The dust, instead, is consistent with being originated at the distance of the predicted graphite sublimation radius (Netzer & Laor, 1993; Netzer, 2015). This implies that the BLR is indeed bound by the dust distribution, as also observationally confirmed by Landt et al. (2014, but see () for a different scenario in which the BLR is originated in regions where dust could co-exist).
We can therefore conclude that, once a BLR component is detected, the dusty region (maybe clumpy, according to recent studies; Marinucci et al., 2016, and references therein) that surrounds the AGN should have been completely penetrated. Note that a possible consequence of dust absorption could be the reduction of the line intensity (but not of the BLR FWHM; see also Kim et al., 2015a). This could affect the estimation of the BH mass, if the line luminosity were to be used, as it is the case of some virial relations for type 1 AGN. Therefore, in the case of obscured AGN, instead than the Optical/NIR line luminosities it is better to use the hard X-ray luminosities as a proxy of the BLR radius in the virial relations for the estimation of the BH mass.
Another possible bias could be due to the fact that in the standard unification model obscured AGN are viewed, on average, at larger angles relative to the accretion disk axis than unobscured AGN. Therefore the estimation of the BLR FWHM could be affected by projection effects. Indeed the dependence of BLR line widths in term of orientation is observationally well known (Wills & Browne, 1986). Recently, Bisogni et al. (2017), using the EW of the [OIII] 5007 Å line as an inclination indicator, have found that the more inclined AGN1 have on average larger FWHM of the BLR H line. These results match with those of Pancoast et al. (2014), who found that the virial f factor decreases with increasing inclination (see also Risaliti et al., 2011). A smaller f factor is needed to compensate the increasing broadening of the FWHM with the inclination of the observed emission line width. These results have been interpreted as a hint at a possible disc-like shape for the BLR (Bisogni et al., 2017).
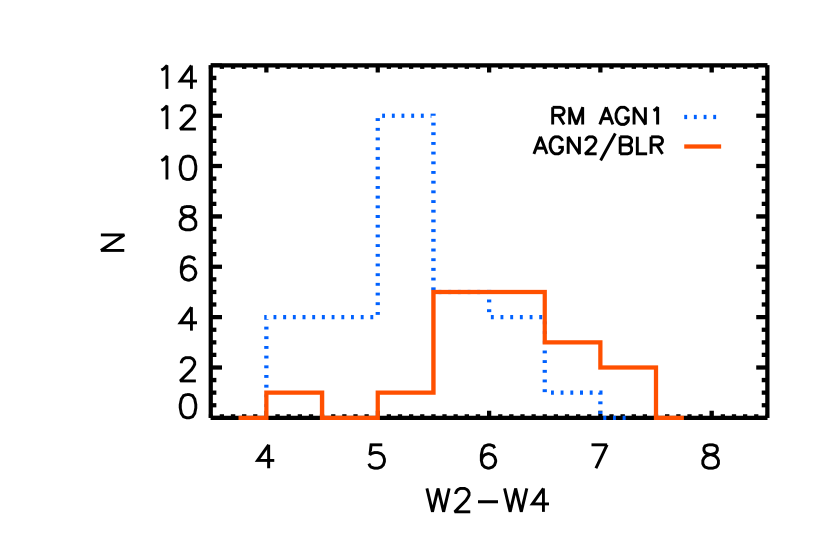
However, the EW of the [OIII] line is not a good indicator of the orientation for AGN2, as the AGN continuum component is suppressed and overwhelmed by the host galaxy contribution. Therefore, following Rose et al. (2015), we have used the W2-W4 (4.6-22 m) mid-IR color, as measured by the Wide-Field Infrared Survey Explorer (WISE, Wright et al., 2010), to roughly estimate the orientation of our samples of AGN. In Table 1 the W2-W4 colors of the AGN2/BLR sample are listed. The more inclined AGN2 should show redder W2-W4 colors than AGN1 because the hottest dust emission of the inner regions of the torus should be less visible as the inclination increases (Rose et al., 2015, and references therein). Our AGN2/BLR show a red W2-W4 distribution, typical of the AGN2 population, having an average W2-W4=6.2 with a (1) spread of 0.8, while the AGN1 control sample has W2-W4=5.2 with a (1) spread of 0.7 (see Fig. 5 and, for comparison, Fig. 2 in Rose et al., 2015). If the common luminosity bin 42.5logL14-195/44.5 is considered, AGN2/BLR (AGN1) have W2-W4=6.4 (5.4) with a (1) spread of 0.6 (0.7).
We can conclude that the smaller BLR FWHM and lower of our sample of AGN2 with respect to the AGN1 of the same luminosity should not be ascribed to orientation effects. Indeed the larger inclination of the AGN2 should cause larger FWHM to be observed, and even smaller f factors to be used. Therefore, following Pancoast et al. (2014), even smaller could be derived for the AGN2/BLR sample than those obtained in this work where a common factor, for both AGN1 and AGN2, is assumed.
5 Conclusions
Determining the distribution of of AGN is of paramount importance in order to understand the AGN phenomenon.
Using deep NIR spectroscopic observations we have detected faint BLR components in a sample of 17 AGN2 (Onori et al., 2017) drawn from the 14-195 keV X-ray Swift/BAT 70-month catalogue, which is free of biases against absorbed sources up to log (Burlon et al., 2011). No dependence was found of the BLR detection success rate, or FWHM of the lines, on either the X-ray or NIR fluxes, or on orientation angle of the host galaxy, on the hydrogen column density and on the extinction.
In this work we have found that the average AGN2 FWHM of the BLR is dex smaller than measured in a control sample of AGN1 having the same average X-ray intrinsic luminosity. Using new virial relations calibrated by Ricci et al. (2017), which are based on the FWHM of the most relevant BLR NIR emission lines and the intrinsic hard X-ray luminosity, we have measured the of the AGN2 in our sample. The of the AGN2 are on average dex smaller than measured in the control sample of AGN1. If AGN1 and AGN2 of the same luminosity log(L14-195 / erg s-1) 43.5 are compared, AGN2 have 0.5 dex smaller BH masses than the AGN1.
Our findings are based on small samples and more observations are needed for more robust statistical grounds. However, at face value our result disagrees with the standard AGN unification scenarios in which AGN1 and AGN2 are the same objects observed along different viewing angles with respect to a toroidal absorbing material.
Our findings could instead fit in an evolutionary scenario (see e.g. Hopkins et al., 2005) in which AGN2 represents the preceding stage of a type 1 AGN. In this picture, AGN2 are dust enshrouded “buried”, low mass () BH which accrete at high Eddington ratios. When feedback from the accretion drives away the obscuring material a window is created in which the AGN is seen as an optical type 1. In this evolutionary path highly accreting red quasars, as those observed by Kim et al. (2015b), could belong to an intermediate population. Eventually, the activity ends when the accretion rate drops below that required to maintain the typical AGN luminosities.
Acknowledgments
We thank the referee for her/his very useful comments which improved the manuscript. We also thank Robert Antonucci, Ryan Hickox and Cesare Perola for useful discussions. Based on observations made with ESO telescopes at the Paranal Observatory and the Large Binocular Telescope (LBT) at Mt. Graham, Arizona. We acknowledge funding from PRIN-MIUR 2010 and from PRIN-INAF 2011. MB acknowledges support from the FP7 Career Integration Grant “eEASy” (CIG 321913). RM acknowledges support from the ERC Advanced Grant 695671 “QUENCH” and from the Science and Technology Facilities Council (STFC).
References
- Allen (1976) Allen C. W., 1976, Astrophysical Quantities
- Allevato et al. (2014) Allevato V., et al., 2014, ApJ, 796, 4
- Antonucci (1993) Antonucci R., 1993, ARA&A, 31, 473
- Baldassare et al. (2016) Baldassare V. F., et al., 2016, ApJ, 829, 57
- Baumgartner et al. (2013) Baumgartner W. H., Tueller J., Markwardt C. B., Skinner G. K., Barthelmy S., Mushotzky R. F., Evans P. A., Gehrels N., 2013, ApJS, 207, 19
- Bisogni et al. (2017) Bisogni S., Marconi A., Risaliti G., 2017, MNRAS, 464, 385
- Blandford & McKee (1982) Blandford R. D., McKee C. F., 1982, ApJ, 255, 419
- Burlon et al. (2011) Burlon D., Ajello M., Greiner J., Comastri A., Merloni A., Gehrels N., 2011, ApJ, 728, 58
- Burtscher et al. (2013) Burtscher L., et al., 2013, A&A, 558, A149
- Burtscher et al. (2015) Burtscher L., et al., 2015, A&A, 578, A47
- Burtscher et al. (2016) Burtscher L., et al., 2016, A&A, 586, A28
- Cai et al. (2010) Cai H.-B., Shu X.-W., Zheng Z.-Y., Wang J.-X., 2010, Research in Astronomy and Astrophysics, 10, 427
- Czerny & Hryniewicz (2011) Czerny B., Hryniewicz K., 2011, A&A, 525, L8
- Elitzur (2012) Elitzur M., 2012, ApJ, 747, L33
- Graham (2008) Graham A. W., 2008, ApJ, 680, 143
- Greene & Ho (2007) Greene J. E., Ho L. C., 2007, ApJ, 667, 131
- Greene et al. (2010) Greene J. E., et al., 2010, ApJ, 723, 409
- Grier et al. (2013) Grier C. J., et al., 2013, ApJ, 773, 90
- Heckman et al. (2004) Heckman T. M., Kauffmann G., Brinchmann J., Charlot S., Tremonti C., White S. D. M., 2004, ApJ, 613, 109
- Ho & Kim (2014) Ho L. C., Kim M., 2014, ApJ, 789, 17
- Hopkins et al. (2005) Hopkins P. F., Hernquist L., Martini P., Cox T. J., Robertson B., Di Matteo T., Springel V., 2005, ApJ, 625, L71
- Kelly et al. (2010) Kelly B. C., Vestergaard M., Fan X., Hopkins P., Hernquist L., Siemiginowska A., 2010, ApJ, 719, 1315
- Kim et al. (2010) Kim D., Im M., Kim M., 2010, ApJ, 724, 386
- Kim et al. (2015a) Kim D., et al., 2015a, ApJS, 216, 17
- Kim et al. (2015b) Kim D., Im M., Glikman E., Woo J.-H., Urrutia T., 2015b, ApJ, 812, 66
- Kormendy et al. (2011) Kormendy J., Bender R., Cornell M. E., 2011, Nature, 469, 374
- La Franca et al. (2005) La Franca F., et al., 2005, ApJ, 635, 864
- La Franca et al. (2015) La Franca F., et al., 2015, MNRAS, 449, 1526
- La Franca et al. (2016) La Franca F., Onori F., Ricci F., Bianchi S., Marconi A., Sani E., Vignali C., 2016, Frontiers in Astronomy and Space Sciences, 3
- Landt et al. (2008) Landt H., Bentz M. C., Ward M. J., Elvis M., Peterson B. M., Korista K. T., Karovska M., 2008, ApJS, 174, 282
- Landt et al. (2011) Landt H., Bentz M. C., Peterson B. M., Elvis M., Ward M. J., Korista K. T., Karovska M., 2011, MNRAS, 413, L106
- Landt et al. (2014) Landt H., Ward M. J., Elvis M., Karovska M., 2014, MNRAS, 439, 1051
- Lanzuisi et al. (2015) Lanzuisi G., et al., 2015, A&A, 573, A137
- Lusso et al. (2012) Lusso E., et al., 2012, MNRAS, 425, 623
- Maiolino et al. (2007) Maiolino R., Shemmer O., Imanishi M., Netzer H., Oliva E., Lutz D., Sturm E., 2007, A&A, 468, 979
- Marconi et al. (2004) Marconi A., Risaliti G., Gilli R., Hunt L. K., Maiolino R., Salvati M., 2004, MNRAS, 351, 169
- Marinucci et al. (2016) Marinucci A., et al., 2016, MNRAS, 456, L94
- Netzer (2015) Netzer H., 2015, ARA&A, 53, 365
- Netzer & Laor (1993) Netzer H., Laor A., 1993, ApJ, 404, L51
- Onori et al. (2017) Onori F., et al., 2017, MNRAS, 464, 1783
- Pancoast et al. (2014) Pancoast A., Brewer B. J., Treu T., Park D., Barth A. J., Bentz M. C., Woo J.-H., 2014, MNRAS, 445, 3073
- Peterson (1993) Peterson B. M., 1993, PASP, 105, 247
- Ramos Almeida et al. (2009) Ramos Almeida C., Pérez García A. M., Acosta-Pulido J. A., 2009, ApJ, 694, 1379
- Ricci et al. (2017) Ricci F., La Franca F., Onori F., Bianchi S., 2017, A&A in press, arXiv:1610:03490
- Riffel et al. (2006) Riffel R., Rodríguez-Ardila A., Pastoriza M. G., 2006, A&A, 457, 61
- Risaliti et al. (2011) Risaliti G., Salvati M., Marconi A., 2011, MNRAS, 411, 2223
- Rose et al. (2015) Rose M., Elvis M., Crenshaw M., Glidden A., 2015, MNRAS, 451, L11
- Schulze et al. (2015) Schulze A., et al., 2015, MNRAS, 447, 2085
- Shankar et al. (2013) Shankar F., Weinberg D. H., Miralda-Escudé J., 2013, MNRAS, 428, 421
- Ueda et al. (2003) Ueda Y., Akiyama M., Ohta K., Miyaji T., 2003, ApJ, 598, 886
- Ueda et al. (2014) Ueda Y., Akiyama M., Hasinger G., Miyaji T., Watson M. G., 2014, ApJ, 786, 104
- Vasudevan & Fabian (2007) Vasudevan R. V., Fabian A. C., 2007, MNRAS, 381, 1235
- Vazquez et al. (2015) Vazquez B., et al., 2015, ApJ, 801, 127
- Veilleux et al. (1997) Veilleux S., Goodrich R. W., Hill G. J., 1997, ApJ, 477, 631
- Vestergaard (2002) Vestergaard M., 2002, ApJ, 571, 733
- Wills & Browne (1986) Wills B. J., Browne I. W. A., 1986, ApJ, 302, 56
- Winter et al. (2010) Winter L. M., Lewis K. T., Koss M., Veilleux S., Keeney B., Mushotzky R. F., 2010, ApJ, 710, 503
- Wright et al. (2010) Wright E. L., et al., 2010, AJ, 140, 1868