Exceptionally strong phonon scattering by B substitution in cubic SiC
Abstract
We use ab-initio calculations to predict the thermal conductivity of cubic SiC with different types of defects. An excellent quantitative agreement with previous experimental measurements is found. The results unveil that substitution has a much stronger effect than any of the other defect types in 3C-SiC, including vacancies. This finding contradicts the prediction of the classical mass-difference model of impurity scattering, according to which the effects of and would be similar and much smaller than that of the C vacancy. The strikingly different behavior of the defect arises from a unique pattern of resonant phonon scattering caused by the broken structural symmetry around the impurity.
Silicon carbide (SiC) plays a fundamental role in many emerging technologies, ranging from biomedical sensors to optoelectronics, power electronics and photovoltaics Eddy and Gaskill (2009); Bhatnagar and Baliga (1993); Fréchette and Carraro (2006); Hao et al. (2016); Saddow (2012); Hillenbrand et al. (2002); Syvajarvi et al. (2016); Beaucarne et al. (2002); Cicero et al. (2004). Most notably, this material has been termed the “linchpin to green energy” that may replace Si-based technology in power electronics Eddy and Gaskill (2009), owing partly to its large lattice thermal conductivity (). From the many stable polytypes of SiC Harris (ed.), two of the hexagonal ones, 6H-SiC and 4H-SiC, have been extensively studied and widely used Zheludev (2007); W. C. Lien et al. (2014); Harris (ed.). In contrast, the structurally less complex cubic polytype of SiC with zinc-blende structure (3C-SiC) is much less well understood, despite presumably having the best electronic properties Verucchi et al. (2012), and, as we will see, possibly a higher than the other polytypes. This is partly due to the difficulty in synthesizing high quality crystals, although recent improvements in 3C-SiC growth techniques have prompted a renewed interest in it Verucchi et al. (2012).
Surprisingly, the reference measurements of on pure undoped 3C-SiC are over 20 years old and little detail is known about the quality of the samples Harris (ed.); Morelli et al. (1993). The reference value of for 3C phase is perplexingly lower than that for the structurally more complex 6H phase, raising doubts about whether this is truly an intrinsic property or just a consequence of the defective, polycrystalline quality of the 3C-SiC samples. It is then clear that to understand the conduction properties of 3C-SiC, and to harness its full potential, one must first comprehend the way defects affect it. As we show here, by comparing predictive ab-initio calculations with experiments on defective samples, a richer physical picture emerges, unveiling the striking differences in the way different dopants affect . This also indirectly suggests that the intrinsic of defect-free 3C-SiC should be much higher than previously reported and surpass that of the 6H phase.
In this paper, we compare our results to the curves for doped samples of 3C-SiC Ivanova et al. (2006). We use an ab-initio approach to quantify the phonon scattering rates of substitutional defects. The predicted is in excellent agreement with the experimental results. This then allows us to explain the effect of codoping with N and B, and shows that B impurities scatter phonons two orders of magnitude more strongly overall than N or Al impurities, and as strongly as C vacancies. We identify resonant phonon scattering as the reason for this behavior, resulting from distortion and broken symmetry around the B atom. We then show this resonant scattering behavior to be a general phenomenon that can show up for strong enough perturbations.
for cubic structures can be obtained from a complete phonon picture as explained in Refs. Li et al., 2014; Katre and Madsen, 2016. We use an iterative scheme to solve the full linearized Boltzmann transport equation (BTE) and calculate the of 3C-SiC as implemented in the almaBTE code The ALMA project developers . Details about the calculations are presented in the supplementary material.
The calculated for defect-free single-crystal 3C-SiC is shown as the brown dashed line in Fig. 1. Its value at 300 K is 552 W/m/K, which is about 70 higher than the experimentally reported (320 W/m/K) Ioffe Institute ; Morelli et al. (1993). It also surpasses the experimental at 300 K for the 6H-SiC phase by 10 Ioffe Institute . Inclusion of Si and C isotope scattering slightly lowers the calculated (orange dashed line in Fig. 1), but the values remain much larger than the experimental ones.
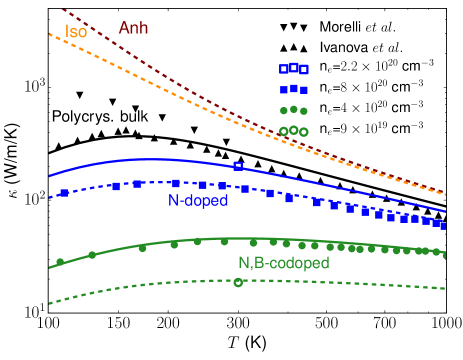
The calculated for the defective structures of 3C-SiC are compared with experiments on polycrystalline samples from Ref. Ivanova et al., 2006 in Fig. 1. The additional contribution of the grain boundaries to the scattering rate is included in the standard way as , where is the phonon group velocity and is the grain size. Employing m for all the samples yields good agreement with experiment.
The black filled triangles in Fig. 1 are the experimental measurements on the polycrystalline bulk sample without any dopant Ivanova et al. (2006). The other experimental results are for the N-doped, and N-and-B-codoped n-type samples in Ref. Ivanova et al., 2006. The case of N-only doping demonstrates the predictive power of the ab-initio approach. As N in SiC can be considered as a shallow donor Gupta and Ballato (2006); Smith et al. (1999); Isoya et al. (2003) and each dopant contributes one electron per defect atom, the concentrations of N defects can be expected to be the same as the carrier concentration. Using the carrier concentrations for different N-doped 3C-SiC samples reported in Ref. Ivanova et al., 2006 yields excellent agreement between the calculated and the experimental for the whole temperature range in Fig. 1 (blue lines and symbols). This confirms the reliability of the ab-initio approach.
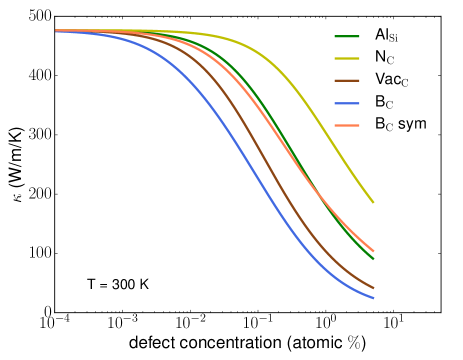
The case of B and N codoping is considered next. B substitutes for C in 3C-SiC when it is grown in Si-rich conditions Fukumoto (1996); Bechstedt et al. (2001); Petrenko and Petrenko (2016). The fact that the undoped samples in Ref. Ivanova et al., 2006 are -type with a reasonably high carrier concentration (cm-3) would indicate the formation of vacancies at C sites, which happens only in Si-rich growth conditions Oda et al. (2013). Due to codoping, the carrier concentrations given in Ref. Ivanova et al., 2006 correspond to the difference between the donor and acceptor concentrations, and thus they do not uniquely determine the defect densities. In this case, the ab-initio calculations are able to determine individual defect densities: by keeping the difference in concentrations equal to the experimental carrier concentration, the calculation matches the whole temperature dependent experimental curve only if the individual concentrations are 1.3 and 0.5 for N and B respectively (Fig. 1: upper green line and circles). The relative concentrations of the other codoped sample were similarly derived yielding 2.7 and 2.5 of N and B defects respectively (lower green line and circle in Fig. 1). Our calculations capture the correct experimental trend of a big reduction in seen when B defects, even in smaller concentrations than N, are introduced in the samples (Fig. 1). This evidences the much stronger phonon scattering strength induced by B defects. Furthermore, Fig. 2 shows the dependence of on impurity concentration, and confirms the anomalously large scattering from B defects. Such a behavior of the B defects seems the only possible explanation of the very low (42 W/m/K and 19 W/m/K at 300 K) measured for the codoped samples. Otherwise, to achieve the same low thermal conductivities by N-doping alone would require the N concentrations in excess of 20%, which are obviously unrealistic.
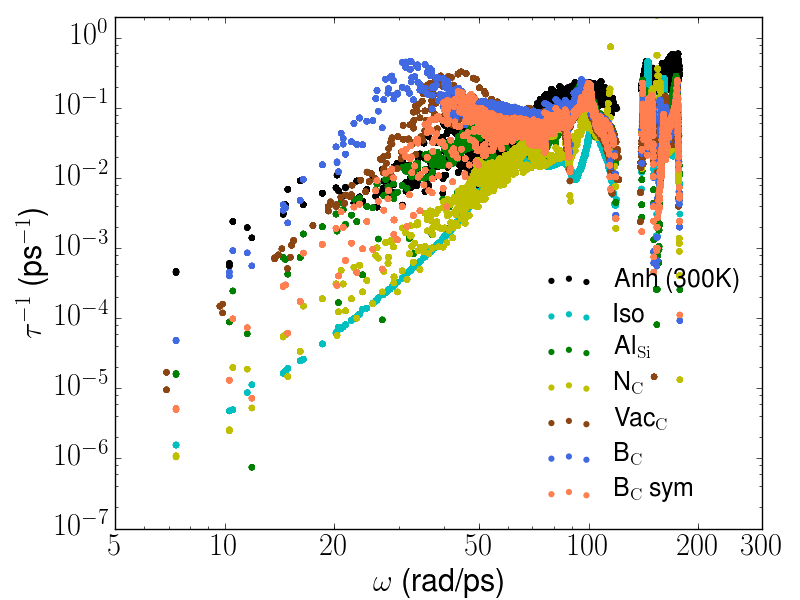
A look at the phonon scattering rates in Fig. 3 provides more clues for boron’s atypical behavior. Scattering by substitutional impurities comes from two sources: the mass difference between the impurity atom and the one it replaces, and the local change in the interatomic force constants (IFCs) around the impurity in response to structural relaxation and modified chemical environment. In cases like Ge impurities in Si, the mass term dominates because Si and Ge have similar chemical bonding properties but very different masses Kundu et al. (2011); Garg et al. (2011). The other extreme is the case of vacancies, where the host atom is absent and the only contribution comes from IFC differences. The B-induced scattering rates in Fig. 3 are a striking two orders of magnitude larger than the N-induced ones, and they are comparable to those of the C vacancy. This is surprising because the absolute value of the mass difference between B and C is nearly the same as between N and C. A calculation including only mass difference, and neglecting IFC differences does indeed predict very similar scattering rates for B and N impurities (Fig. S1 of supplementary material.) Therefore the large scattering rates for B must come from the different changes in IFCs. However, scattering by Al substitutionals is not nearly as large as that of B, despite both species belonging to the same column in the periodic table, which might lead one to expect similar chemical bonding properties.
Fig. 4 shows the norm of the changes in the on-site IFC submatrices. Since translation symmetry imposes a set of linear constraints on each row of the IFC matrix, the change in the onsite terms probes the overall change in the IFCs related to each atom. The results shown in the figure confirm that the largest changes happen in the case of the vacancy. On the other hand, the B defect shows a rather large asymmetry in the first-neighbor shell which may explain the increased scattering. To be able to analyze the contribution to scattering from this asymmetry, we define a symmetric perturbation matrix containing only the part of the total perturbation matrix (see details in supplementary material) calculated by averaging over the four space-group operations that just permute the four nearest-neighbors of the defect centre. Hence, can be split as a sum of this symmetric term plus an asymmetric term containing the remainder of the total perturbation: .
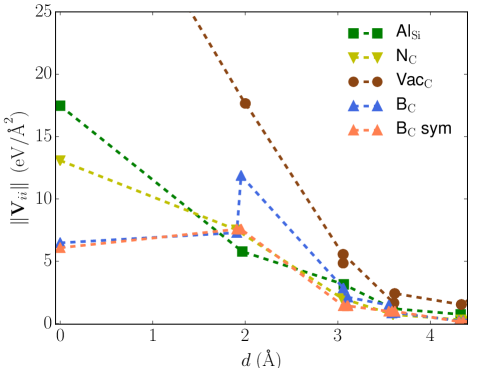
Figures 2 and 3 show the variation of with defect concentration and the phonon-defect scattering rates induced by the artificial defect represented by . Likewise, the norm of the changes in the on-site IFC submatrices due to is shown in Fig. 4. It can be seen that the symmetrization process does indeed bring the values more in line with those corresponding to the symmetric perturbations N and Al. Accordingly, the symmetrized B perturbation yields thermal conductivities very similar to those from Al impurities, and much larger than those for the same concentration of true B impurities, as shown in Fig. 2.
The asymmetry in IFCs is caused by an asymmetry in the relaxed structure of the B defect. While both N and Al lead to tetragonally symmetric relaxations around the impurity, the relaxation around B breaks the symmetry and the impurity gets closer to three of its four nearest-neighbors (Fig. S2 in the supplementary material; see also Ref. Petrenko and Petrenko, 2016.) The asymmetrical relaxed structure of the B defect is a manifestation of the complex chemistry of boron Oganov and Solozhenko (2009). Some insight into the different chemical behaviors of N and B with respect to Si can be gained from a look at their binary compounds. While the most stable silicon nitride is Si3N4, with a relatively simple structure, silicon borides have stoichiometries from SiB3 to SiB40 and very complex unit cells with hundreds of atoms Vlasse et al. (1986); Aselage (1998). The stoichiometry and the structure of silicon borides suggest an affinity of B for low coordination with Si. Thus, relaxing of B defect atom away from one of its four neighboring atoms in 3C-SiC can be interpreted as its movement towards lower coordination.
Although the above reasoning shows that symmetry breaking affects the perturbation for B impurities, this does not yet explain its exceptionally large effect on . To understand it, let us take another look at the scattering rates in Fig. 3. The scattering rates for B display a prominent peak at about 33 rad/ps. A similarly large peak is observed for the vacancy at slightly higher frequency. Such peak is notably smaller or almost absent for the Al and N defects. The rates for the symmetrized B impurity are also shown (B sym), displaying much smaller values and a much lower peak than the original B perturbation. This peak is the signature of resonant scattering. Resonances are quasi-bound states in the continuum of propagating states. They are infinitely extended, but have a large probability around the localized perturbation that causes them. They manifest themselves as peaks in the phonon scattering cross section () of the scatterer near the frequency of the resonance. The Green’s function approach that we use to compute defect scattering rates accounts for the full scattering to all orders, so it perfectly captures the effect of resonances, which would not appear in truncated perturbative approaches.
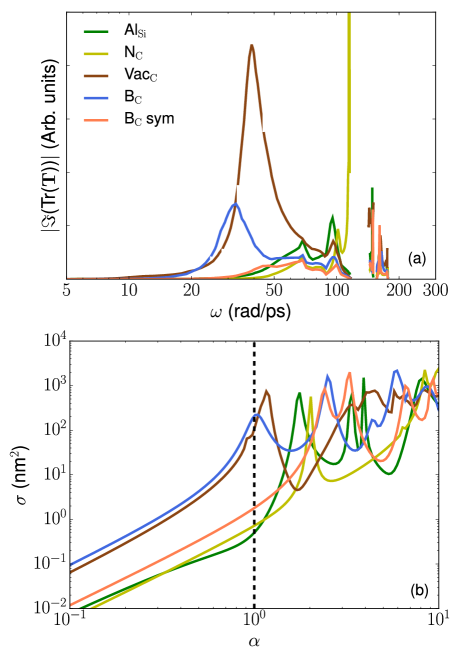
A direct way to identify resonant scattering is via the scattering matrix (see the expression in supplementary), which is fundamentally related to the cross section Mingo et al. (2010); Katcho et al. (2014). Prominent peaks in the imaginary part of the trace of the scattering matrix, shown in Fig. 5(a), correspond to resonances. In this way they are much easier to identify than from the cloud of points in the -point dependent scattering rate plots. The figure clearly displays large resonances for B and C vacancies (Vac), but neither for the symmetrized B nor for N and Al.
According to scattering theory, as the intensity of the localized perturbation grows stronger, increasingly sharper resonances start to develop at the lower frequency spectrum Economou (1983). In the present case, this would imply that resonances might show up for impurities other than B or C vacancies, if only their perturbations were stronger. To verify this, we have artificially multiplied the perturbation by a constant factor , and re-calculated for a longitudinal acoustic (LA) phonon of frequency 33 rad/ps (the resonant frequency for B defect), as a function of . The value corresponds to the true perturbation. Fig. 5(b) confirms that for sufficiently large , every impurity is able to develop resonant scattering. Fig. 5(b) suggests the qualitative concept of an effective native “strength” of the defect: the B and C vacancy defects are associated to a larger strength, manifested as a larger cross section at small and an earlier onset of the resonance with increase in . This “strength” is the result of a complex interplay involving the magnitude of the different changes in IFCs and their symmetry. In the B case, the broken symmetry leads to a visibly enhanced strength with respect to the symmetrized case, seen in Fig. 5(b), despite the overall change in the perturbation matrices in Fig 4, not being drastic.
In conclusion, B substitutional impurities in cubic SiC scatter phonons much more strongly than N or Al impurities, and comparably to C vacancies. For N impurities to reduce as much as B impurities do, the concentration of the former has to be roughly 30 times larger than that of the latter. This could not have been guessed from mass difference considerations. It emerges from ab-initio calculations, which are clearly supported by previous experimental measurements. This striking behavior is caused by the symmetry breaking around the B impurity upon relaxation, which leads to strong resonant scattering of acoustic phonons in the angular frequency range between 33 and 50 rad/ps. If only the symmetric part of the perturbation is kept, the resonance disappears and the calculated effect becomes similar to that of Al substitutionals. Furthermore, the calculations presented suggest that single-crystalline, defect-free cubic SiC can achieve a thermal conductivity about 1.7 times higher than the largest reported measured value on this polytype, and above than those of other polytypes.
The results shown here point at a general phenomenon, whereby lattice distortions induced by symmetry breaking impurities may develop into a phonon resonance and lead to enhanced scattering. This should be relevant to many rapidly evolving technologies. In complex semiconductors there will usually be several possible doping scenarios for reaching a desired carrier concentration, and the sensitivity of the phonon scattering to the specific defect thus opens up an important new route in semiconductor design.
We acknowledge support from the Air Force Office of Scientific Research, USAF under award no. FA9550615-1-0187 DEF, and the European Union’s Horizon 2020 Research and Innovation Programme, grant number 645776 (ALMA). We thank David Broido for valuable discussions.
References
- Eddy and Gaskill (2009) J. C. R. Eddy and D. K. Gaskill, Science 324, 1398 (2009).
- Bhatnagar and Baliga (1993) M. Bhatnagar and B. J. Baliga, IEEE Transac. Elec. Dev. 40, 645 (1993).
- Fréchette and Carraro (2006) J. Fréchette and C. Carraro, J. Am. Chem. Soc. 128, 14774 (2006).
- Hao et al. (2016) C. Hao, X. Guo, Y. Pan, S. Chen, Z. Jiao, H. Yang, and X. Guo, J. Am. Chem. Soc. 138, 9361 (2016).
- Saddow (2012) S. E. Saddow, Silicon Carbide Biotechnology (Elsiver: Amsterdam, 2012).
- Hillenbrand et al. (2002) R. Hillenbrand, T. Taubner, and F. Keilmann, Nature 418, 159 (2002).
- Syvajarvi et al. (2016) M. Syvajarvi, Q. Ma, V. Jokubavicius, A. Galeckas, J. Sun, X. Liu, M. Jansson, P. Wellmann, M. Linnarsson, P. Runde, et al., Solar Ene. Mater. and Solar Cel. 145, Part 2, 104 (2016).
- Beaucarne et al. (2002) G. Beaucarne, A. S. Brown, M. J. Keevers, R. Corkish, and M. A. Green, Prog. Photovolt: Res. Appl. 10, 345 (2002).
- Cicero et al. (2004) G. Cicero, A. Catellani, and G. Galli, Phys. Rev. Lett. 93, 016102 (2004).
- Harris (ed.) G. L. Harris (ed.), in Properties of Silicon Carbide (ISPEC, London, 1995).
- Zheludev (2007) N. Zheludev, Nat. Phot. 1, 189 (2007).
- W. C. Lien et al. (2014) W. C. W. C. Lien, N. Damrongplasit, J. H. Paredes, S. D. G., T. J. K. Liu, and A. P. Pisano, IEEE J. Elec. Dev. Soc. 2, 164 (2014).
- Verucchi et al. (2012) R. Verucchi, L. Aversa, M. V. Nardi, S. Taioli, S. a Beccara, D. Alfè, L. Nasi, F. Rossi, G. Salviati, and S. Iannotta, J. Am. Chem. Soc. 134, 17400 (2012).
- Morelli et al. (1993) D. Morelli, J. Heremans, C. Beetz, W. S. Woo, G. L. Harris, and C. Taylor, Instit. Phys. Conf. Ser. N137, 313 (1993).
- Ivanova et al. (2006) L. M. Ivanova, P. A. Aleksandrov, and K. D. Demakov, Inorg. Mater. 42, 1205 (2006).
- Li et al. (2014) W. Li, J. Carrete, N. A. Katcho, and N. Mingo, Comp. Phys. Comm. 185, 1747 (2014).
- Katre and Madsen (2016) A. Katre and G. K. H. Madsen, Phys. Rev. B 93, 155203 (2016).
- (18) The ALMA project developers, All-scale predictive design of heat management material structures, http://www.almabte.eu/.
- (19) Ioffe Institute, Thermal properties of silicon carbide, http://www.ioffe.ru/SVA/NSM/Semicond/SiC/thermal.html.
- Gupta and Ballato (2006) M. C. Gupta and J. Ballato, The Handbook of Photonics, Second Edition (CRC Press, 2006).
- Smith et al. (1999) S. R. Smith, A. O. Evwaraye, W. C. Mitchel, and M. A. Capano, J. Elec. Mater. 28, 190 (1999).
- Isoya et al. (2003) J. Isoya, T. Ohshima, N. Morishita, T. Kamiya, H. Itoh, and S. Yamasaki, Phys. B: Cond. Mat. 340–342, 903 (2003).
- Fukumoto (1996) A. Fukumoto, Phys. Rev. B 53, 4458 (1996).
- Bechstedt et al. (2001) F. Bechstedt, A. Fissel, J. Furthmüller, U. Grossner, and A. Zywietz, J. Phys.: Cond. Mat. 13, 9027 (2001).
- Petrenko and Petrenko (2016) T. T. Petrenko and T. L. Petrenko, Phys. Rev. B 93, 165203 (2016).
- Oda et al. (2013) T. Oda, Y. Zhang, and W. J. Weber, J. Chem. Phys. 139 (2013).
- Kundu et al. (2011) A. Kundu, N. Mingo, D. A. Broido, and D. A. Stewart, Phys. Rev. B 84, 125426 (2011).
- Garg et al. (2011) J. Garg, N. Bonini, B. Kozinsky, and N. Marzari, Phys. Rev. Lett. 106, 045901 (2011).
- Oganov and Solozhenko (2009) A. R. Oganov and V. L. Solozhenko, J. Superhard Mater. 31, 285 (2009).
- Vlasse et al. (1986) M. Vlasse, G. A. Slack, M. Garbauskas, J. S. Kasper, and J. C. Viala, J. Solid Stat. Chem. 63, 31 (1986).
- Aselage (1998) T. L. Aselage, J. Mater. Research 13, 1786–1794 (1998).
- Mingo et al. (2010) N. Mingo, K. Esfarjani, D. A. Broido, and D. A. Stewart, Phys. Rev. B 81, 045408 (2010).
- Katcho et al. (2014) N. A. Katcho, J. Carrete, W. Li, and N. Mingo, Phys. Rev. B 90, 094117 (2014).
- Economou (1983) E. Economou, in Green’s function in quantum Physics, edited by M. Cardona, P. Fulde, and H. J. Queisser (Springer New York, 1983), pp. 108–109, II ed.