The Crystal Structure of Rb2Ti2O5
Abstract
Recent results have demonstrated an exceptionally high dielectric constant in the range 200 K-330 K in a crystalline tianium oxide : Rb2Ti2O5. In this article, the possibility of a structural transition giving rise to ferroelectricity is carefully inspected. In particular X-Ray diffraction, high resolution transmission electron microscopy and Raman spectroscopy are performed. The crystal structure is shown to remain invariant and centrosymmetric at all temperatures between 90 K and 450 K. The stability of the C2/m structure is confirmed by DFT calculations. These important findings allow to discard the existence of a conventional ferroelectric phase transition as a possible mechanism for the unusual dielectric constant observed in this material.
I Introduction
The investigation of new layered materials has always been topical in condensed matter, since many electronic properties are marginally true in two dimensions. On the other hand, ternary titanium oxydes, such as perovskite, are known to exhibit many remarkable electronic behaviors such as ferroelectricity Na1.7K0.3Ti3O7 ; K2Ti6O13-1 , pyroelectricity Pyro-RTPO-2006 ; Pyro-KTAO-2010 , colossal magnetoresistance CMR or 2D-superconducting properties LAOSTO . The ternary titanium oxide family denoted by M2TinO2n+1 (MTO) with M = Li, Na, K, Rb, Cs, Fr and called the Anderson-Wadsley type alkali titanates K2Ti2O5-1986 with layered structure for 2 5 and tunnel structure for 6 8, are known for presenting ferroelectric phase transitions, with especially high Curie temperaturesK2Ti6O13-1 as well as for other applications Shripal2005 . Their ease of synthesis and their potential applications are a motivation to study this family of compounds.
Very few information has been reported to date in the literature concerning the Rb2Ti2O5 (RTO) compound, which is reputed to be a layered material. Actually, two early documents report its synthesis and claim a space group Cm for its structure Rb2Ti2O5-1 ; Rb2Ti2O5-2 .
Earlier structural investigations were led on K2Ti2O5, where the space group is reported to be C2/m and more generally on the M2Ti2O5 material family (MTO)K2Ti2O5-1960 ; K2Ti2O5-1961 ; K2Ti2O5-1986 .
The material exhibits a five-fold coordination for titanium, which comes as a surprise since titanium atoms tend to adopt an energetically more stable six-fold coordination in most materials K2Ti2O5-1960 . As a matter of fact, the five-fold Ti coordination has only been reported in MTO. According to the literature, this family of compounds offers a certain interest for chemists because of their oxidation abilities K2Ti2O5-2009 ; K2Ti2O5-2011 but electrical properties measurements have not been reported so far.
Recent work 1-2016-RTO-Ionic has demonstrated superionic conductivity properties attesting of an electrolyte nature of the material due to ionic electromigration. The ionic conductivity in the temperature range between 200 K and 330 K reaches as high as . This high ionic conductivity coupled with an electronically insulating nature leads to an electrolyte behavior.
These two properties were demonstrated to yield important polarization phenomena with colossal dielectric constant reaching at low frequency 1-2016-RTO-Ionic .
However since these observations are also consistent with ferroelectric like behavior, the question of a possible associated structural phase transition arises, as an alternative explanation.
In the present work, we report a systematic characterization of the Rb2Ti2O5 crystal structure as a function of temperature. X-ray diffraction and Raman spectroscopy techniques were both used in conjunction with theoretical calculations of structural and vibrational properties, using density functional theory.
II Chemical synthesis
The synthesis of the Rb2Ti2O5 was made under air by melting TiO2 (rutile) and RbNO3 powders in a crucible.
It resulted hard aggregates of transparent needles that were kept under dry argon atmosphere in order to avoid hydratation.
The crystals extracted from the aggregate exhibit a needle-shape with typically 1 millimeter length and hundreds of micrometers width and thickness.
III Characterization
III.1 Single crystal XRD
Single-crystal X-ray diffraction data were acquired on an Oxford Diffraction Xcalibur-S diffractometer equipped with a Sapphire CCD-detector with Mo K radiation ( = 0.71073 , graphite monochromator) at 293 K. Data reduction, cell refinement, space group determination, scaling, and empirical or analytical absorption correction were performed using CrysAlisPro software DRX1 .
Aquisitions were realized at 400 K, 300 K and 150 K and they all show the same structure. The atomic positions and the lattice parameters of the Rb2Ti2O5 structure are respectively reported in the table 1 and 2.
| Temperature | 400 K | 300 K | 150 K |
| CCDC number | 1517161 | 1517160 | 1517159 |
| Molecular Weight (g.mol-1) | 346.74 | 346.74 | 346.74 |
| Cryst syst | monoclinic | monoclinic | monoclinic |
| Space group | C2/m | C2/m | C2/m |
| a/ | 11.3419(12) | 11.3370(13) | 11.3457(12) |
| b/ | 3.8198(5) | 3.8244(5) | 3.8195(5) |
| c/ | 7.0103(8) | 6.9946(8) | 6.9699(8) |
| /deg | 90 | 90 | 90 |
| /deg | 100.298(11) | 100.308(12) | 100.359(11) |
| /deg | 90 | 90 | 90 |
| Volume/ | 298.82(6) | 298.37(6) | 297.12(6) |
| Z | 2 | 2 | 2 |
| (mg.mm-3) | 3.854 | 3.860 | 3.876 |
| (mm-3) | 18.796 | 18.824 | 18.903 |
| F(000) | 316.0 | 316.0 | 316.0 |
| Crystal size | 0.2 0.1 0.05 | 0.2 0.1 0.05 | 0.2 0.1 0.05 |
| Radiation | MoK ( = 0.71073) | MoK ( = 0.71073) | MoK ( = 0.71073) |
| 2 range | 5.906 to 64.994 | 5.92 to 52.726 | 5.942 to 52.714 |
| Reflexions collected | 1859 | 1389 | 1205 |
| Data/restraints/param. | 567/0/30 | 351/0/29 | 348/0/29 |
| GOF on F2 | 1.081 | 1.173 | 1.109 |
| R1/wR2 (I>=2 (I)) | 0.0353 /0.0893 | 0.0279 /0.0714 | 0.0499/0.1310 |
| R1/wR2 (all) | 0.0400/0.0918 | 0.0293/0.0725 | 0.0537/0.1342 |
| Largest diff. peak/hole / e | 0.82/-1.63 | 0.68/-1.45 | 1,52/-1.93 |
| Atom | x | y | z | U(eq) | |
| 400 K | Rb1 | 981.2(8) | 5000 | 8472.5(12) | 14.9(5) |
| Ti1 | 3522.9(14) | 5000 | 5897(2) | 9.7(5) | |
| O1 | 5000 | 5000 | 5000 | 15(2) | |
| O2 | 3767(6) | 5000 | 8391(9) | 15.6(15) | |
| O3 | 1772(6) | 5000 | 4776(9) | 14.9(14) | |
| 300 K | Rb1 | 985.1(5) | 5000 | 8481.2(8) | 21.0(3) |
| Ti1 | 3524.9(8) | 5000 | 5884.9(14) | 10.8(3) | |
| O1 | 5000 | 5000 | 5000 | 19.7(13) | |
| O2 | 3762(4) | 5000 | 8367(6) | 20.7(9) | |
| O3 | 1780(3) | 5000 | 4797(5) | 14.3(8) | |
| 150 K | Rb1 | 981.2(8) | 5000 | 8472.5(12) | 14.9(5) |
| Ti1 | 3522.9(14) | 5000 | 5897(2) | 9.7(5) | |
| O1 | 5000 | 5000 | 5000 | 15(2) | |
| O2 | 3767(6) | 5000 | 8391(9) | 15.6(15) | |
| O3 | 1772(6) | 5000 | 4776(9) | 14.9(14) |
III.2 Powder XRD
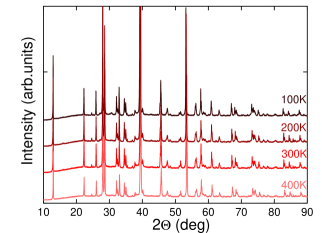
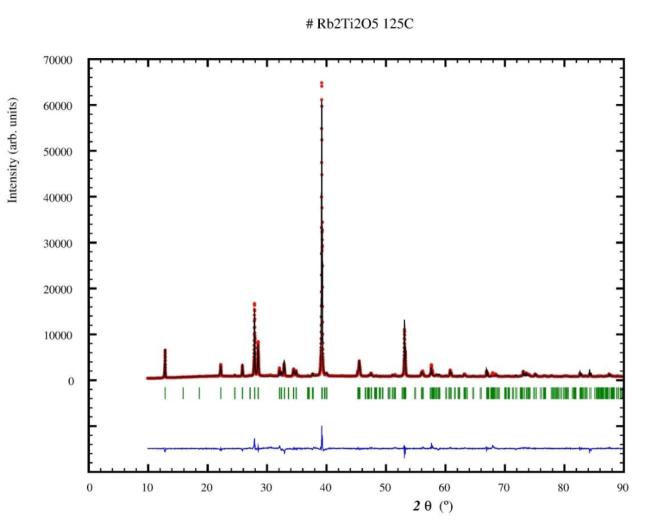
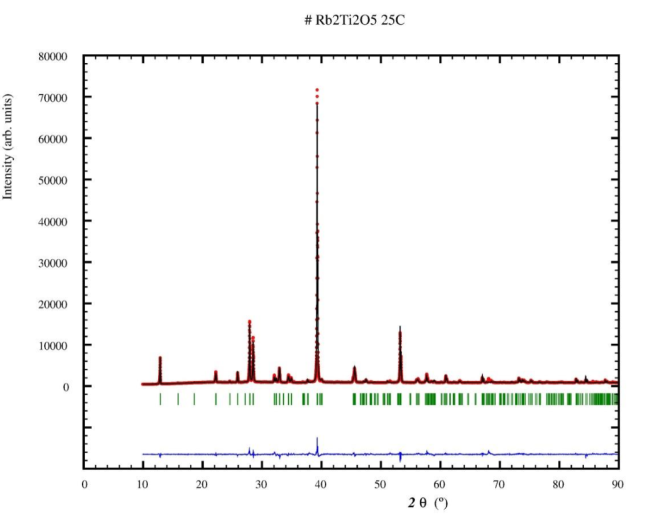
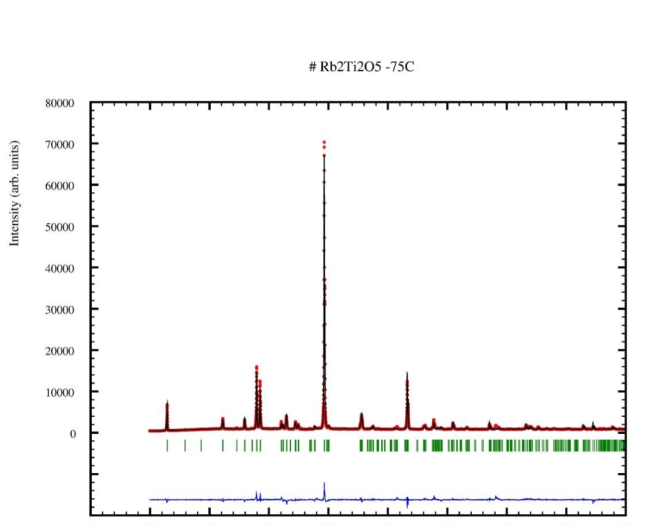
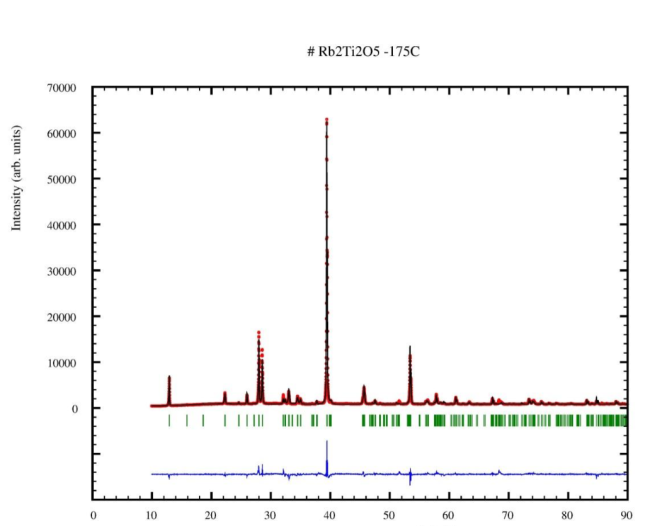
The X-ray powder diffraction (XRD) patterns were recorded at the IMPMC (Pierre and Marie Curie University, Paris) x-ray diffraction platform using an XPert Pro Panalytical diffractometer equipped with a Cu K radiation source ( = 1.54056 , = 1.54439 ) with an XCelerator detector. The measurements were conducted under nitrogen atmosphere (under vacuum for 100 K acquisition) in an Anton Paar HTK 450 temperature controlled chamber. Rietveld refinements DRX4 were performed with the FullProf suite of programs DRX5 on X-ray powder diffraction patterns recorded in Bragg-Brentano geometry. The background was modelized using a 12-coeficients polynom, and Thomson-Cox-Hasting Voigt functions DRX6 were used as peak shape functions. Preferred orientation, consistent with a platy habit of crystallites, was taken into account in the refinements as all (001) reflections were over-estimated. Measurements in capillary would have limited this effect but they were not possible since the Bragg Brentano (reflection) geometry was imposed by our cryostat. However, these refinements reveal that the single crystal structure is representative of the whole sample and further confirm the absence of structural transition from 100 K to 400 K. Vesta software VESTA was used to visualize the crystal structures. These measurements were made as function of temperature and under a nitrogen atmosphere.
The evolution of the diffractograms acquired on a RTO is pictured in figure 1 as function of temperature between 100 K and 400 K. Table 3 displays the lattice parameters deduced from Rietveld refinements performed on the X-ray Powder Pattern.
| Temperature | 400 K | 300 K | 200 K | 100 K |
| Space group | C2/m | C2/m | C2/m | C2/m |
| a () | 11.34378(2) | 11.34378(2) | 11.34381(2) | 11.34265(3) |
| b () | 3.82824(5) | 3.82905(6) | 3.82756(5) | 3.82557(6) |
| c () | 6.99109(5) | 7.00371(5) | 6.98718(5) | 6.96969(6) |
| (deg) | 100.2889(5) | 100.2413(6) | 100.2939(6) | 100.3379(7) |
| Volume () | 298.762(7) | 299.365(8) | 298.495(7) | 297.521(9) |
| RBragg (%) | 9.86 | 13.4 | 12.1 | 13 |
The atomic positions and lattice parameters extracted from the single crystal and the powder measurements were found to be similar and allow to conclude with a C2/m structure which remains unchanged over the investigated range of temperature.
The unit cell content of the RTO is shown in figure 2 using VESTA software.
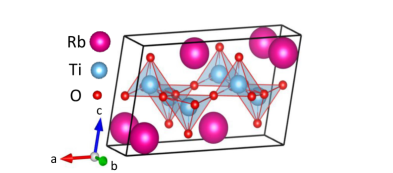
The structure of RTO is highly anisotropic. This two-dimensional structure consists in alternate layers of Ti-O and Rb atoms along the c-axis. The Ti-O layers are made of chains of double pyramids sharing corners. A double-pyramid is formed by the association of two square-based pyramids sharing edges, with their apex pointing to opposite directions. In this configuration each Ti atom is surrounded by five oxygens which form a slightlty tilted square based pyramid. Rb+ atoms sit in between those layers. The refinements performed demonstrated that the structure is identical with the one reported for K2Ti2O5 K2Ti2O5-1961 .
III.3 Scanning electron microscopy
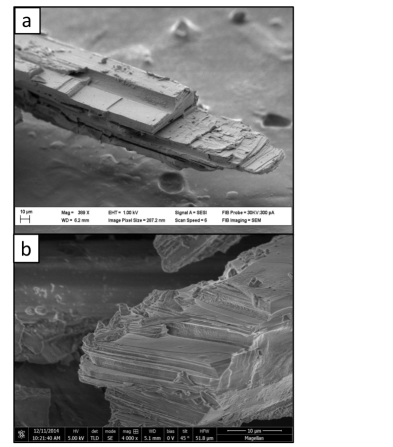
Rightafter the chemical synthesis process reached back room temperature, RTO cristals were isolated and Scanning Electron Microscopy (SEM) acquisitions were realized. Two SEM pictures which show the needle shape of the RTO and its lamellar structure are displayed in figure 3.
The growth direction is along the b axis. In these pictures the microscopic layered nature of the material is observable at the macroscopic scale over the entire size of the cristal. Figure 3.a displays a good overview of the superimposition of layers.
III.4 High-resolution transmission electron microscopy
Pictures of High-resolution transmission electron microscopy (HRTEM) were performed on a RTO sample (HR-TEM JEM-2010F; JEOL Ltd, Tokyo, Japan). The figure 4 pictured one of those acquisitions.
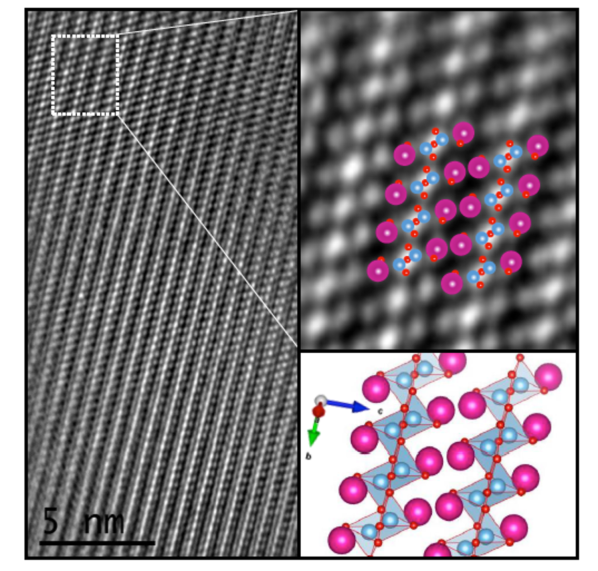
A close-up of the crystal ordering is shown in the inset of figure 4. A simulated crystal structure realized by VESTA is surimposed over the HRTEM image pointing to the crystal of the studied sample.
The zig-zag light spot lines represent the (ab) plane made of the Ti-O squared base-pyramids as can attest the insert surimposed structure. Very shady lights in between these light lines show the presence of rubidium atoms forming the layers separating the Ti-O plans.
IV Raman spectroscopy
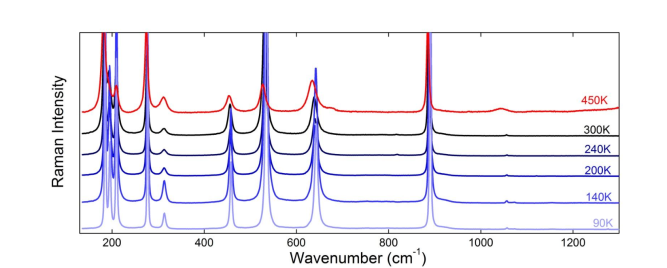
Raman spectroscopy measurements were performed on Rb2Ti2O5 cristals over the range of temperature [90 K - 450 K] under controlled atmosphere conditions. The set-up consisted of an argon laser source "Spectra-physics Argon 514.5 nm", a spectrometer "T64000 HORIBA Jobin Yvon", a set of optical microscopy lens used to focus the laser beam over few micrometers and a cryostat or a cryofour "linkam FTIR 600" used to control the atmosphere and the temperature with helium. The power of the laser beam was set at 140 mW and the recording times lasted 30 sec. Each Raman spectra is an average from three distinct spectra acquired in a row.
Raman spectra recorded between 90 K and 450 K over the wavenumber range [180 cm-1 - 1300 cm-1] are plotted in figure 5. The spectra remain qualitatively unchanged when temperature varies attesting of the stability of the structure over the entire explored range of temperature. Measurements were also performed at 90 K and did not show any variation of the phonon modes. This Raman spectroscopy investigation represents therefore a second probe attesting of the stability of the C2/m crystal structure of the RTO material between 10 K and 450 K.
V Density functional theory calculation
V.1 Crystal structure
The structural calculations were performed on the Rb2Ti2O5 unit cell,
which consists of two formula units, through the Quantum Espresso package QE that is based on the density functional theory (DFT). Both Local Density Approximation (LDA) and Generalized Gradient Approximation (GGA) functionals were used. PBE
| GGA | LDA | |
| a/ | ||
| b/ | ||
| c/ | ||
| /deg | 90 | 90 |
| /deg | 100.110 | 100.327 |
| /deg | 90 | 90 |
| / | 298.688 | 278.105 |
| /Ryd | -980.1266(6) | -980.4192(1) |
| /GPa | 53.4(0) | 70.9(8) |
| 7.0(5) | 4.5(9) |
We employed ultra-soft pseudopotentials, which include semi-core states for Rb and Ti. A Monkhorst-Pack grid and a cutoff energy of 50 Ryd for the expansion of the Kohn-Sham KohmSham1 ; KohmSham2 orbitals in plane waves (4 times as large for the charge density and potential) were enough to obtain the converged energies and the structural parameters.
At the beginning of the structural optimization, the space group was set as C2/m and the atomic positions were those extracted from the X-Ray diffraction measurements, which are displayed in Table 2. Both lattice parameters, angles and atomic positions were then left free to relax; their final values, within the GGA or the LDA, are collected in Table 4. A series of structural optimizations have been conducted at several volumes around the equilibrium volume and the numerical results have been represented through the Murnaghan equation of stateMurnaghan3 , via the fitted equilibrium volume , bulk modulus and its pressure derivative .
| Atom | x | y | z |
| Rb | 1003 | 5000 | 8500 |
| Ti | 3521 | 5000 | 5900 |
| O1 | 5000 | 5000 | 5000 |
| O2 | 3745 | 5000 | 8400 |
| O3 | 1776 | 5000 | 4787 |
The computed atomic positions are reported in table 5. We see that the structural parameters that were computed within the GGA are extremely close to their experimental counterparts that are collected in Tab 1. The computed enthalpy of formation of Rb2Ti2O5 at zero pressure from the elementary stable phases Rb(s), Ti(s) and O2(gas) is -309.8 kJ/mol, within the GGA. These theoretical calculations thus confirm that the synthesized Rb2Ti2O5 crystal is thermodynamically stable and that its structure can be solved with a high level of accuracy by combining X-ray diffraction with DFT calculations.
V.2 Band structure
The band structure pictured in the figure 6 is calculated using the GGA functional for the corresponding optimized crystal structure. The path used along the Brillouin zone is chosen using the MCL structure DFTPath . A gap of at least 3.54 eV, which is likely underestimated as usual in the DFT-GGA, attests nevertheless of the insulating nature of the Rb2Ti2O5 crystal.

V.3 Phonon modes
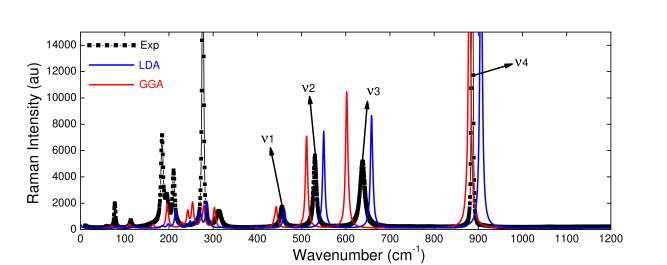
Phonon mode calculations are based on the density functional Perturbation Theory DFT . These calculations were performed by using LDA or GGA functionals and carried out at the corresponding relaxed structures. The phonon frequencies at the center of the Brillouin zone were computed with ultrasoft pseudopotentials, while the Raman intensities were estimated by employing norm-conserving pseudopotentials on top of the phonon calculations, and are therefore less accurate than the frequencies themselves. The theoretical phonon spectra are convolved with Lorentzians and plotted in figure 7. The Raman intensities and the phonon frequencies are extracted from the DFT calculations whereas the full width at half maximum are arbitrary chosen as 1 to make them discernable.
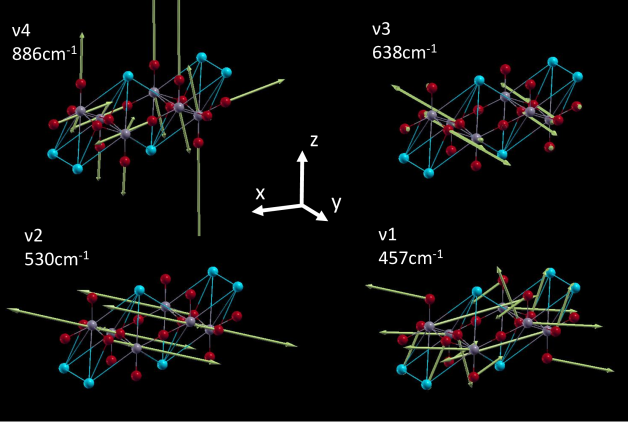
The red and blue curves represent the theoretical Raman spectra simulated with the GGA or the LDA functionals, respectively. The black square curve represents the experimental data recorded on a crystal of Rb2Ti2O5 at room conditions between 180 cm-1 and 1300 cm-1. With respect to the experimental data, the computed frequencies are higher in the LDA and lower in the GGA. This can be linked to the fact that the LDA generally underestimates the lattice parameters and provides stiffer force constants, while the GGA makes the reverse. When looking at the high-frequency part of the spectrum, the four phonon modes are bracketed by the theoretical phonon modes found with GGA and LDA functionals, which differ by not more than 56 cm-1. These four phonon modes are denoted , , and , from small to high frequencies. The representations of these four phonon modes are sketched in figure 8. They all correspond to vibration modes of Ti-O bonds.
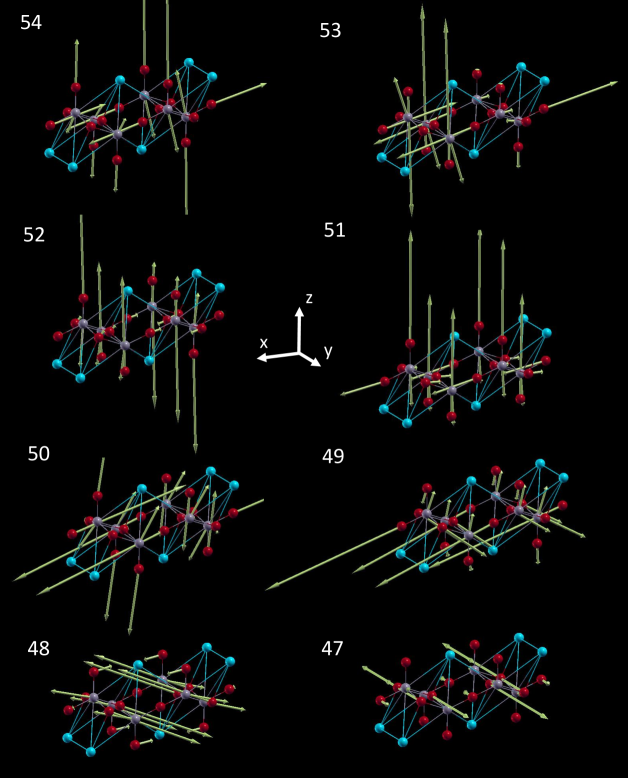
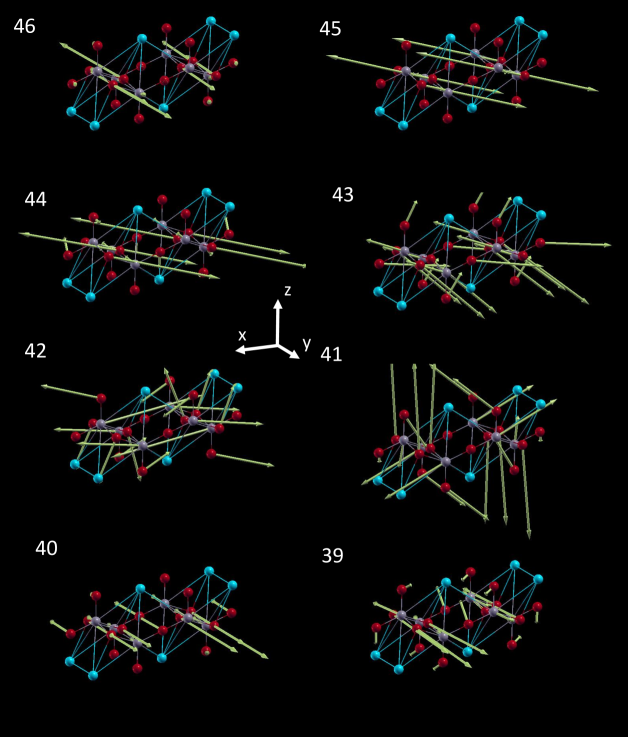
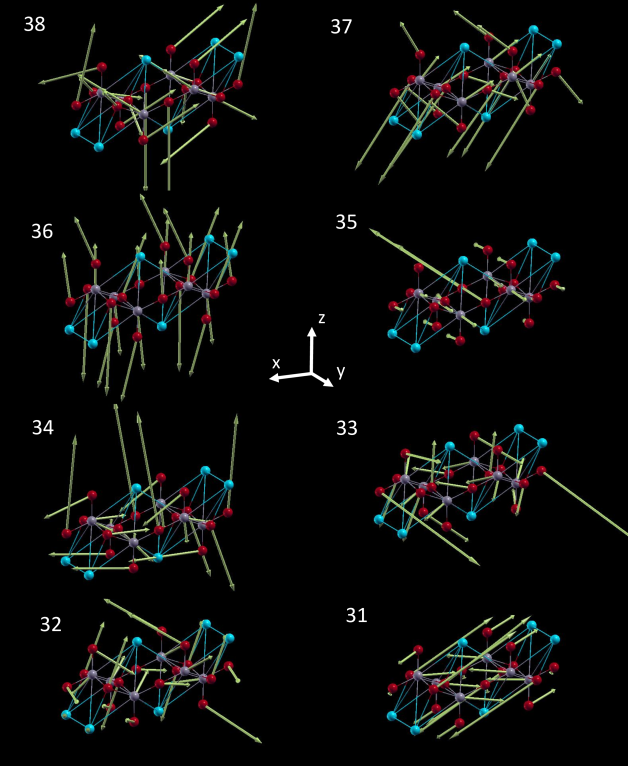
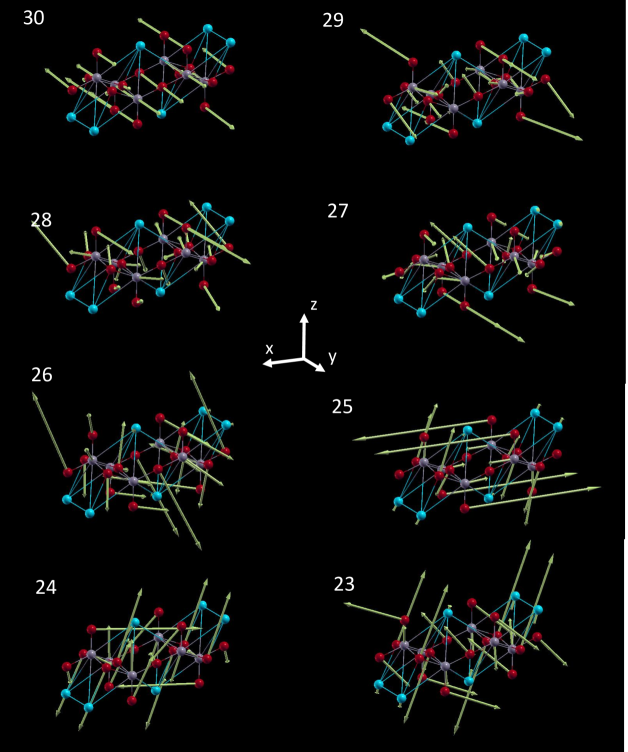
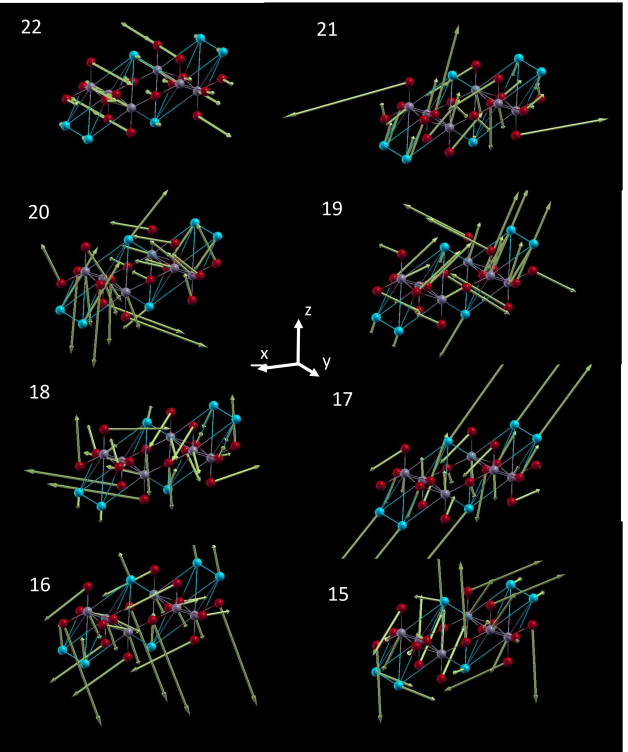
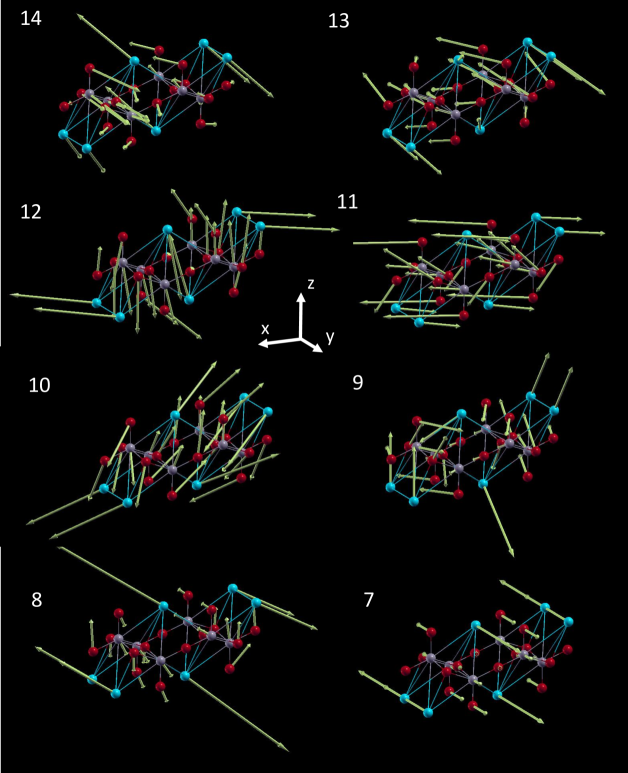
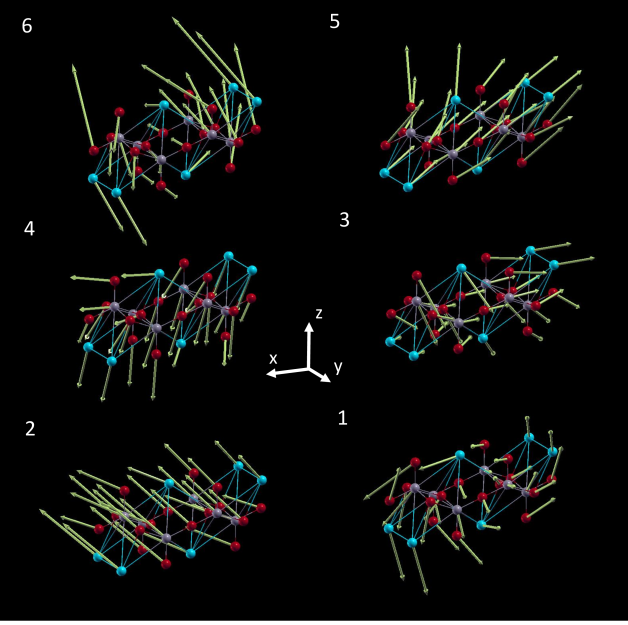
At low frequencies, ten theoretical modes were computed between 80 cm-1 and 330 cm-1. They can be unambigously linked to the set of experimental modes in the same wavenumber range, eventhough their intensities do not match with the experimental ones. The representations of all the calculated phonon modes are displayed in the supplemental material, in figures 15, 16, 17, 18, 19, 20 and 21.
Overall, the good agreement between the calculated phonon spectra for the simulated RTO system and the Raman spectra taken on a RTO crystal confirms that each mode can be assigned and analyzed in terms of a consistent set of atomic displacements and excludes the presence of singularities.
The computed diagonal effective charges for Ti are , with much smaller off-diagonal elements and .
In contradiction to typical ferroelectric crystals such as BaTiO3 Ghosez2007 , the effective charges do not show a relevant anomalous contribution, which is consistent with the absence of an electric-driven instability in Rb2Ti2O5.
VI Relation with electrical properties
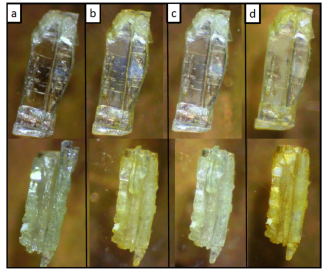
As reported earlier 1-2016-RTO-Ionic , the remarkable electrical properties of RTO are strongly enhanced for samples annealed under vacuum at 400 K for a couple of hours. As a matter of fact, these electrical properties can also be "desactivated" when the material is annealed under 1 bar-oxygen atmosphere at 400 K.
This observation tends to indicate that the existence of such electrical properties is corroborated with the presence of oxygen vacancies in the material. In addition, the figure 9 shows that a reversible change of color operates when the material is alternatively annealed under vacuum and oxygen at 400 K. This is a strong proof of the creation of oxygen vacancies since the material turns from white to yellow and yellow to white, similarly to what is known in TiO2 Sekiya2000 .
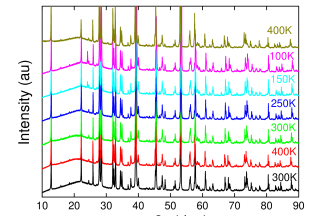
DRX investigation has thus been performed on RTO powder that was annealed in situ in the diffraction chamber under N2 atmosphere. The corresponding diffractogram is displayed in figure 10 and does not show any changes as function of the temperature excepted for the apparition of a diffraction peak around 24 degree below 250 K, artifact due to a small contamination with ice into the diffraction chamber.
Powder diffraction at room temperature was also performed on samples annealed for 24 hours at 400 K under vacuum and again, the same crystal structure as in as-grown crystals was found.
The powder diffraction realized on as grown samples and displayed in Tab 3 shows that the lattice parameters are not decreasing/increasing monotonously as expected as function of the temperature because of the thermal dilatations. The a lattice parameters decreases from 400 K to 300 K and then increases untill 100 K, while b does the contrary and c decreases regularly. This behavior may be due to an unusual lattice distorsion which takes place roughly in the temperature range where transport and dielectric properties of the RTO are the most singular. This would deserve further investigations.
Finally, it is known that X-ray diffraction can not discern the presence of oxygen vacancies into a crystal structure. Neutron diffraction will be considered in order to further investigate the presence of oxygen vacancies induced by the annealing processes.
VII Conclusion
The crystal structure of Rb2Ti2O5 has been characterized as a function of temperature using X-Ray diffraction and Raman spectroscopy. Both methods found the space group of the material consistent with C/2m between 90 K and 450 K. The outcomes of the X-Ray diffraction and Raman spectroscopy are compared to theoretical calculations made with density functional theory and are in excellent agreement.
The structure found is also confirmed by transmission electron microscopy and scanning electron microscopy.
In addition, this work shows that the C2/m structure of the material remains unchanged between 90 K and 450 K, thus excluding the existence of a structural transition between 200 K and 330 K. This is true for as-grown samples as well as in "deoxygenated" vacuum-annealed or N2-annealed samples.
These findings lead to discard a conventional ferroelectric transition as a mechanism responsible for the reported colossal polarisability of Rb2Ti2O5.
References
- (1) D. Maurya, J. Kumar, and Shripal, Journal of Applied Physics 100, 034103 (2006), doi:\bibinfo{doi}{http://dx.doi.org/10.1063/1.2227255}, http://scitation.aip.org/content/aip/journal/jap/100/3/10.1063/1.222725%5
- (2) S. V. Vikram, D. M. Phase, and V. S. Chandel, Journal of Materials Science: Materials in Electronics 21, 902 (2010), ISSN 1573-482X, http://dx.doi.org/10.1007/s10854-009-0015-0
- (3) Y. Shaldin, S. Matyjasik, M. Tseitlin, and M. Roth, Optical Materials 30, 101 (2007), ISSN 0925-3467, http://www.sciencedirect.com/science/article/pii/S0925346706003703
- (4) Y. V. Shaldin, S. Matyjasik, M. Tseitlin, E. Mojaev, and M. Roth, physica status solidi (b) 246, 452 (2009), ISSN 1521-3951, http://dx.doi.org/10.1002/pssb.200844294
- (5) M. McCormack, S. Jin, T. H. Tiefel, R. M. Fleming, J. M. Phillips, and R. Ramesh, Applied Physics Letters 64, 3045 (1994), http://scitation.aip.org/content/aip/journal/apl/64/22/10.1063/1.111372%
- (6) N. Reyren, S. Thiel, A. D. Caviglia, L. F. Kourkoutis, G. Hammerl, C. Richter, C. W. Schneider, T. Kopp, A.-S. Rüetschi, D. Jaccard, M. Gabay, D. A. Muller, J.-M. Triscone, and J. Mannhart, Science 317, 1196 (2007), http://science.sciencemag.org/content/317/5842/1196.full.pdf+html
- (7) M. Tournoux, R. Marchand, and L. Brohan, Progress in Solid State Chemistry 17, 33 (1986), ISSN 0079-6786, http://www.sciencedirect.com/science/article/pii/0079678686900038
- (8) Shripal, S. Badhwar, D. Maurya, and J. Kumar, Journal of Materials Science: Materials in Electronics 16, 495 (2005), ISSN 1573-482X, http://dx.doi.org/10.1007/s10854-005-2723-4
- (9) O. Schmitz-Dumont and A. H. Schulz, Monatshefte für Chemie und verwandte Teile anderer Wissenschaften 83, 638 (1952), ISSN 1434-4475, http://dx.doi.org/10.1007/BF00897713
- (10) O. Schmitz-DuMont and H. Reckhard, Monatshefte für Chemie und verwandte Teile anderer Wissenschaften 90, 134 (1959), ISSN 1434-4475, http://dx.doi.org/10.1007/BF00925227
- (11) S. Andersson and A. D. Wadsley, Nature 4736 (aug 1960), doi:\bibinfo{doi}{10.1038/187499a0}, http://www.nature.com/nature/journal/v187/n4736/pdf/187499a0.pdf
- (12) S. Andersson and A. D. Wadsley, Acta Chem. Scand 3 (aug 1961), doi:\bibinfo{doi}{10.3891/acta.chem.scand.15-0663}, http://actachemscand.org/pdf/acta_vol_15_p0663-0669.pdf
- (13) Z. G. Qiang Wang and J. S. Chung, Chem. Commun 35, 5284 (2009), http://pubs.rsc.org/en/content/articlepdf/2009/cc/b909455e
- (14) J. S. C. Qiang Wang and Z. Guo, Ind. Eng. Chem. Res 50 (13), 8384 (2011), http://pubs.acs.org/doi/abs/10.1021/ie200698j
- (15) R. Federicci, S. Holé, B. Baptiste, S. Mercone, and B. léridon(2017), http://
- (16) Rigaku Oxford Diffraction(2015)
- (17) H. M. Rietveld, J. Appl. Crystallogrr 65–71 (1969)
- (18) Rodriguez-Carvajal, J. Phys. B 55–69 (1993)
- (19) K. Momma and F. Izumi, Journal of Applied Crystallography 44, 1272 (Dec 2011), https://doi.org/10.1107/S0021889811038970
- (20) e. a. Paolo Giannozzi, Journal of Physics: Condensed Matter 21, 395502 (2009), http://stacks.iop.org/0953-8984/21/i=39/a=395502
- (21) J. P. Perdew, K. Burke, and M. Ernzerhof, Phys. Rev. Lett. 77, 3865 (Oct 1996), http://link.aps.org/doi/10.1103/PhysRevLett.77.3865
- (22) P. Hohenberg and W. Kohn, Phys. Rev. 136, B864 (Nov 1964), http://link.aps.org/doi/10.1103/PhysRev.136.B864
- (23) W. Kohn and L. J. Sham, Phys. Rev. 140, A1133 (Nov 1965), http://link.aps.org/doi/10.1103/PhysRev.140.A1133
- (24) F. D. Murnaghan, PNAS 30, 244 (1944), http://www.pnas.org/content/30/9/244.citation
- (25) W. Setyawan and S. Curtarolo, Computational Materials Science 49, 299 (2010), ISSN 0927-0256, http://www.sciencedirect.com/science/article/pii/S0927025610002697
- (26) S. Baroni, S. de Gironcoli, A. Dal Corso, and P. Giannozzi, Rev. Mod. Phys. 73, 515 (Jul 2001), http://link.aps.org/doi/10.1103/RevModPhys.73.515
- (27) P. Rabe, Karin M.and Ghosez, “First-principles studies of ferroelectricoxides,” in Physics of Ferroelectrics: A Modern Perspective (Springer Berlin Heidelberg, Berlin, Heidelberg, 2007) pp. 117–174, ISBN 978-3-540-34591-6, http://dx.doi.org/10.1007/978-3-540-34591-6_4
- (28) T. Sekiya, K. Ichimura, M. Igarashi and S. Kurita, Journal of Physics and Chemistry of Solids 61, 1237–1242 (Aug 2000), http://www.sciencedirect.com/science/article/pii/S0022369799004242
VIII Appendix A : tables for different XRD results
| Atom | U11 | U22 | U33 | U23 | U13 | U12 |
| Rb1 | 18.9(4) | 21.0(4) | 24.1(4) | 0 | 6.2(2) | 0 |
| Ti1 | 4.4(5) | 10.2(6) | 17.3(5) | 0 | 0.7(4) | 0 |
| O1 | 9(3) | 13(3) | 40(3) | 0 | 9(2) | 0 |
| O2 | 19(2) | 22(3) | 18.6(19) | 0 | -1.1(16) | 0 |
| O3 | 5.7(16) | 12(2) | 24.0(19) | 0 | -1.7(14) | 0 |
| Atom | Atom | Length(Å) | Atom | Atom | Length(Å) | |
| Rb1 | Rb11 | 3.3468(11) | Ti1 | O39 | 1.9861(10) | |
| Rb1 | Ti12 | 3.5945(10) | Ti1 | O3 | 1.988(4) | |
| Rb1 | Ti13 | 3.5945(10) | Ti1 | O310 | 1.9861(10) | |
| Rb1 | O3 | 2.878(4) | Ti1 | O1 | 1.8842(9) | |
| Rb1 | O34 | 3.537(4) | Ti1 | O2 | 1.709(4) | |
| Rb1 | O12 | 3.1400(5) | O3 | Rb14 | 3.537(4) | |
| Rb1 | O13 | 3.1400(5) | O3 | Ti110 | 1.9861(10) | |
| Rb1 | O22 | 3.153(3) | O3 | Ti19 | 1.9861(10) | |
| Rb1 | O25 | 2.894(3) | O1 | Rb19 | 3.1400(5) | |
| Rb1 | O23 | 3.153(3) | O1 | Rb18 | 3.1400(5) | |
| Rb1 | O2 | 3.164(4) | O1 | Rb110 | 3.1400(5) | |
| Rb1 | O26 | 2.894(3) | O1 | Rb17 | 3.1400(5) | |
| Ti1 | Rb17 | 3.5945(10) | O1 | Ti11 | 1.8841(9) | |
| Ti1 | Rb18 | 3.5945(10) | O2 | RbA6 | 2.894(3) | |
| Ti1 | Rb19 | 3.7281(10) | O2 | Rb17 | 3.153(3) | |
| Ti1 | Rb110 | 3.7281(10) | O2 | Rb18 | 3.153(3) | |
| Ti1 | Ti110 | 3.0920(14) | O2 | Rb15 | 2.894(3) | |
| Ti1 | Ti19 | 3.0920(14) |
1-X,1-Y,2-Z; 2-1/2+X,-1/2+Y,+Z; 3-1/2+X,1/2+Y,+Z; 4-X,1-Y,1-Z; 51/2-X,3/2-Y,2-Z; 61/2-X,1/2-Y,2-Z; 71/2+X,1/2+Y,+Z; 81/2+X,-1/2+Y,+Z; 91/2-X,1/2-Y,1-Z; 101/2-X,3/2-Y,1-Z; 111-X,1-Y,1-Z
| Atom | U11 | U22 | U33 | U23 | U13 | U12 |
| Rb1 | 25.2(3) | 27.7(3) | 28.7(3) | 0 | 8.87(19) | 0 |
| Ti1 | 5.8(3) | 12.6(4) | 19.2(4) | 0 | 1.6(2) | 0 |
| O1 | 10(2) | 19(3) | 48(3) | 0 | 15(2) | 0 |
| O2 | 29.5(19) | 24(2) | 21.9(16) | 0 | -0.5(14) | 0 |
| O3 | 5.5(12) | 13.6(15) | 31.8(17) | 0 | 0.2(11) | 0 |
| Atom | Atom | Length(Å) | Atom | Atom | Length(Å) | |
| Rb1 | Rb11 | 3.3518(10) | Ti1 | O39 | 1.9824(9) | |
| Rb1 | Ti12 | 3.6000(9) | Ti1 | O3 | 1.992(3) | |
| Rb1 | Ti13 | 3.6000(9) | Ti1 | O310 | 1.9824(9) | |
| Rb1 | O3 | 2.893(4) | Ti1 | O1 | 1.8844(8) | |
| Rb1 | O34 | 3.542(3) | Ti1 | O2 | 1.705(4) | |
| Rb1 | O13 | 3.1464(5) | O3 | Rb14 | 3.542(3) | |
| Rb1 | O12 | 3.1464(5) | O3 | Ti110 | 1.9824(9) | |
| Rb1 | O22 | 3.154(3) | O3 | Ti19 | 1.9824(9) | |
| Rb1 | O2 | 3.164(4) | O1 | Rb17 | 3.1464(5) | |
| Rb1 | O25 | 2.899(3) | O1 | Rb110 | 3.1464(5) | |
| Rb1 | O23 | 3.154(3) | O1 | Rb18 | 3.1464(5) | |
| Rb1 | O26 | 2.899(3) | O1 | Rb19 | 3.1464(5) | |
| Ti1 | Rb17 | 3.6000(9) | O1 | Ti11 | 1.8844(7) | |
| Ti1 | Rb18 | 3.6000(9) | O2 | Rb16 | 2.899(3) | |
| Ti1 | Rb19 | 3.7338(9) | O2 | Rb18 | 3.154(3) | |
| Ti1 | Rb110 | 3.7338(9) | O2 | Rb15 | 2.899(3) | |
| Ti1 | Rb110 | 3.0926(12) | O2 | Rb17 | 3.154(3)) | |
| Ti1 | Rb19 | 3.0926(12) |
1-X,1-Y,2-Z; 2-1/2+X,-1/2+Y,+Z; 3-1/2+X,1/2+Y,+Z; 4-X,1-Y,1-Z; 51/2-X,3/2-Y,2-Z; 61/2-X,1/2-Y,2-Z; 71/2+X,1/2+Y,+Z; 81/2+X,-1/2+Y,+Z; 91/2-X,1/2-Y,1-Z; 101/2-X,3/2-Y,1-Z; 111-X,1-Y,1-Z
| Atom | U11 | U22 | U33 | U23 | U13 | U12 |
| Rb1 | 12.3(6) | 17.9(7) | 13.1(6) | 0 | -1.6(4) | 0 |
| Ti1 | 5.5(9) | 10.9(10) | 10.5(9) | 0 | -4.3(6) | 0 |
| O1 | 6(3) | 16(4) | 19(3) | 0 | -6(3) | 0 |
| O2 | 13(3) | 15(3) | 16(3) | 0 | -4(3) | 0 |
| O3 | 4(4) | 19(5) | 22(5) | 0 | 0(4) | 0 |
| Atom | Atom | Length(Å) | Atom | Atom | Length(Å) | |
| Rb1 | Rb11 | 3.3460(16) | Ti1 | O3 | 1.8910(15) | |
| Rb1 | Ti12 | 3.5845(17) | Ti1 | O38 | 1.9805(17) | |
| Rb1 | Ti13 | 3.5845(17) | Ti1 | O3 | 2.000(6) | |
| Rb1 | O12 | 3.1265(7) | Ti1 | O39 | 1.9805(17) | |
| Rb1 | O13 | 3.1265(7) | Ti1 | O2 | 1.710(7) | |
| Rb1 | O34 | 3.513(6) | O1 | Rb17 | 3.1266(7) | |
| Rb1 | O3 | 2.877(7) | O1 | Rb19 | 3.1266(7) | |
| Rb1 | O22 | 3.154(3) | O3 | Ti19 | 1.9824(9) | |
| Rb1 | O2 | 3.171(6) | O1 | Rb18 | 3.1266(7) | |
| Rb1 | O22 | 3.148(5) | O1 | Rb110 | 3.1266(7) | |
| Rb1 | O25 | 2.878(5) | O1 | Ti111 | 1.8910(15) | |
| Rb1 | O26 | 2.878(5) | O3 | Rb14 | 3.513(6) | |
| Rb1 | O23 | 3.148(5) | O3 | Ti9 | 1.9805(17) | |
| Ti1 | Rb17 | 3.5845(17) | O3 | Ti18 | 1.9805(17) | |
| Ti1 | Rb18 | 3.7221(16) | O2 | Rb15 | 2.878(5) | |
| Ti1 | Rb19 | 3.7221(16) | O2 | Rb17 | 3.148(5) | |
| Ti1 | Rb110 | 3.5845(17) | O2 | Rb110 | 3.148(5) | |
| Ti1 | Ti19 | 3.091(2) | O2 | Rb16 | 2.878(5) | |
| Ti1 | Ti18 | 3.091(2) |
1-X,1-Y,2-Z; 2-1/2+X,-1/2+Y,+Z; 3-1/2+X,1/2+Y,+Z; 4-X,1-Y,1-Z; 51/2-X,3/2-Y,2-Z; 61/2-X,1/2-Y,2-Z; 71/2+X,1/2+Y,+Z; 81/2+X,-1/2+Y,+Z; 91/2-X,1/2-Y,1-Z; 101/2-X,3/2-Y,1-Z; 111-X,1-Y,1-Z
IX Appendix B : representations of the DFT phonon modes calculated with GGA functional
| N | (cm-1) | Raman Intensity (au) | N | (cm-1) | Raman Intensity (au) |
| 1 | 0 | low | 28 | 240 | high |
| 2 | 0 | low | 29 | 252 | medium |
| 3 | 0 | low | 30 | 254 | high |
| 4 | 0 | low | 31 | 256 | low |
| 5 | 0 | low | 32 | 282 | medium |
| 6 | 0 | low | 33 | 292 | low |
| 7 | 9 | low | 34 | 301 | high |
| 8 | 63 | low | 35 | 309 | low |
| 9 | 67 | low | 36 | 319 | high |
| 10 | 73 | low | 37 | 387 | low |
| 11 | 86 | low | 38 | 400 | low |
| 12 | 87 | low | 39 | 413 | low |
| 13 | 88 | low | 40 | 432 | low |
| 14 | 89 | low | 41 | 444 | medium |
| 15 | 92 | low | 42 | 447 | high |
| 16 | 115 | low | 43 | 457 | low |
| 17 | 125 | low | 44 | 498 | low |
| 18 | 134 | medium | 45 | 507 | high |
| 19 | 145 | low | 46 | 594 | high |
| 20 | 155 | low | 47 | 599 | medium |
| 21 | 165 | medium | 48 | 624 | low |
| 22 | 183 | low | 49 | 721 | low |
| 23 | 193 | low | 50 | 759 | low |
| 24 | 219 | high | 51 | 759 | low |
| 25 | 225 | medium | 52 | 846 | low |
| 26 | 230 | medium | 53 | 879 | medium |
| 27 | 234 | medium | 54 | 881 | high |