Investigating the Settling Dynamics of Cohesive Silt Particles With Particle-Resolving Simulations
Abstract
The settling of cohesive sediment is ubiquitous in aquatic environments, and the study of the settling process is important for both engineering and environmental reasons. In the settling process, the silt particles show behaviors that are different from non-cohesive particles due to the influence of inter-particle cohesive force. For instance, the flocs formed in the settling process of cohesive silt can loosen the packing, and thus the structural densities of cohesive silt beds are much smaller than that of non-cohesive sand beds. While it is a consensus that cohesive behaviors depend on the characteristics of sediment particles (e.g., Bond number, particle size distribution), little is known about the exact influence of these characteristics on the cohesive behaviors. In addition, since the cohesive behaviors of the silt are caused by the inter-particle cohesive forces, the motions of and the contacts among silt particles should be resolved to study these cohesive behaviors in the settling process. However, studies of the cohesive behaviors of silt particles in the settling process based on particle-resolving approach are still lacking. In the present work, three-dimensional settling process is investigated numerically by using CFD–DEM (Computational Fluid Dynamics–Discrete Element Method). The inter-particle collision force, the van der Waals force, and the fluid–particle interaction forces are considered. The numerical model is used to simulate the hindered settling process of silt based on the experimental setup in the literature. The results obtained in the simulations, including the structural densities of the beds, the characteristic lines, and the particle terminal velocity, are in good agreement with the experimental observations in the literature. To the authors’ knowledge, this is the first time that the influences of non-dimensional Bond number and particle polydispersity on the structural densities of silt beds have been investigated separately. The results demonstrate that the cohesive behavior of silt in the settling process is attributed to both the cohesion among silt particles themselves and the particle polydispersity. To guide to the macro-scale modeling of cohesive silt sedimentation, the collision frequency functions obtained in the numerical simulations are also presented based on the micromechanics of particles. The results obtained by using CFD–DEM indicate that the binary collision theory over-estimated the particle collision frequency in the flocculation process at high solid volume fraction.
keywords:
cohesive particle , sedimentation , hindered settling , two-phase flow , CFD–DEM1 Introduction
In the natural environment, the settling process occurs ubiquitously, in which the sediment particles fall continuously towards the seabed, lake floor or river floor to form a loose sediment layer (Zhao et al., 2014). The settling of sediment particles can have negative impacts on the environment. For example, excess sedimentation in waterways can make them too shallow for navigation; sediment deposition can bury the aquatic habitats and is detrimental to aquatic life. On the other hand, diminished sedimentation can cause the losses of valuable wetlands (McAnally and Mehta, 2000). Therefore, the understanding of the settling process is important in the calculation of sediment budget for engineering, economic and environmental reasons. In addition, the sedimentation process is found in chemical, mining, pharmaceutical and other industries due to its importance in the understanding of fluid–solid separation (Shih et al., 1987; Bürger and Wendland, 2001; Dong et al., 2009; Zhao et al., 2014).
Since silt is the prevailing sediment fraction in many river systems, the modeling and assessment of sediment dynamics in these rivers require proper knowledge of the behaviors of silt (te Slaa et al., 2015). The size of silt is larger than clay but smaller than sand (Krumbein and Aberdeen, 1937). Compared with non-cohesive sand, silt demonstrates some behaviors that are unique to cohesive particles. Specifically, these behaviors include: (1) the structural densities (solid volume fractions) of silt beds are smaller than those of sand beds (Winterwerp and van Kesteren, 2004; te Slaa et al., 2015); (2) the trajectories of silt particles are deflected when the flocs form (Stolzenbach and Elimelech, 1994; Mazzolani et al., 1998; Zhang and Zhang, 2011); (3) the critical shear stress to initiate silt bed motion is larger than that of sand bed (Roberts et al., 1998; Lick et al., 2004). These behaviors are collectively referred to as “cohesive behaviors” hereafter following the literature (te Slaa et al., 2015). These cohesive behaviors could be caused by the cohesion of silt particle itself or the inter-mixture of silt particles of different sizes (te Slaa et al., 2015). It is believed that the variation of the characteristics of the sediment particles (e.g., Bond number, particle size distribution) can significantly influence the cohesive behaviors (Dong et al., 2006, 2009). However, little is known about how exactly the variation in these characteristics can influence the sedimentation of silt particles.
The modeling of the silt settling process is hindered by the complex dynamics of the particles and the challenges in predicting the fluid–particle interaction and inter-particle contact. The traditional empirical approaches based on experimental measurements (Richardson and Zaki, 1954; Winterwerp and van Kesteren, 2004; te Slaa et al., 2015) are used to predict the settling velocity, which is among the most important quantities of interest for the fluid–solid mixture (Batchelor and Green, 1972; Hinch, 1977; Zhao et al., 2014). At higher particle concentrations, the influence of return flow and wake formation, the inter-particle collision, and the increased buoyancy effects are considered in the settling process (Winterwerp, 2002). The influence of flocculation on cohesive sediment in differential settling process can be also considered by using collision frequency function to describe inter-particle contact (Krishnappan, 1990; Winterwerp, 2002). The traditional approaches are able to predict the settling velocity and the sediment concentration in the regime where calibration data were obtained, but they heavily rely on empirical correlations to describe the influence of return flow and inter-particle contact. Therefore, these models may lead to large discrepancies in the predictions of the cohesive behavior of silt particles when outside these regimes because the empirical correlations are not derived directly from first principles.
With the growth of available computational resources in the past few decades, the Discrete Element Method (DEM) has gained popularity (Jiang and Haff, 1993; Drake and Calantoni, 2001; Chen et al., 2011; Capecelatro and Desjardins, 2013; Schmeeckle, 2014). The DEM uses Newton’s law of motion to predict individual particle motion, and the detailed packing arrangement of individual particles in the sediment bed can be captured. Consequently, the DEM has been used to predict the distribution of poly-dispersed sediment particle in the aggregates after sedimentation (Bravo et al., 2015). Moreover, the DEM explicitly resolves the interaction among the sediment particles, and thus the influence of the inter-particle cohesive force on the particle trajectory can be captured (Dyachenko and Dueck, 2012). When the influence of fluid flow (e.g., return flow, wake formation, pressure) is significant in the sedimentation problems, the fluid flow is usually resolved using the CFD and the coupled CFD–DEM approach is used. In CFD–DEM approach, the locally-averaged Navier–Stokes equations are solved for the fluid flow, and the fluid–particle interaction forces are considered. This coupled approach is not only successful in predicting the excess pore pressure in the sand bed during the sedimentation process (Zhao and Shan, 2013; Zhao et al., 2014), but can also capture the reduction of the structural densities in the packed beds of cohesive particles in chemical and mineral engineering applications (Dong et al., 2006, 2009). However, the study of cohesive silt settling and the cohesive behaviors based on CFD–DEM approach is still lacking.
It has recently been demonstrated that SediFoam, a hybrid CFD–DEM solver for particle-laden flows, is capable of modeling the subaqueous sediment motion in extensive validation tests. For example, satisfactory predictive performances were observed in the modeling of the current-induced suspended sediment transport, the generation and migration of sand dune, and the sediment transport in oscillatory flows (Sun and Xiao, 2016a, b, c). In this study, we use SediFoam to study the settling process of cohesive silt particles. Compared with the previous study on sand particle settling using CFD–DEM (Zhao et al., 2014), the size of silt is smaller and inter-particle cohesion is more significant. The objectives of the present study are to (1) demonstrate the capability of CFD–DEM to predict the cohesive behaviors (e.g., decrease of structural densities) in the settling of cohesive silt, (2) investigate the influence of the particle characteristics (e.g., Bond number, particle polydispersity) on the structural densities of the silt beds after sedimentation, and (3) examine the accuracy of the empirical formulas in the prediction of collision frequency function in the macro-scale modeling of cohesive silt sedimentation. While this work focuses on the sedimentation of cohesive silt, the proposed approach also opens the possibility for first-principle-based simulations of the flocculation and erosion of cohesive silt.
While earlier works (e.g., Higashitani et al., 2001; Dong et al., 2006, 2009; Zhang and Zhang, 2011) have used particle-resolving simulations to study the settling of cohesive particles, the current contribution is novel in several aspects. First, we investigated the individual effects of Bond number and particle polydispersity on the bed structural density. Second, we clearly demonstrated the capability of CFD-DEM in capturing the effects of flocculation on the settling characteristics and its temporal evolution for poly-dispersed systems. Finally, our simulations produced collision frequency functions, which can provide valuable guidance for future development of such empirical relations widely used in macro-scale models.
The rest of the paper is organized as follows. Section 2 introduces the methodology of the present model, including the mathematical formulation of fluid equations, the particle motion equations, the fluid–particle interactions, and the modeling of cohesion. The implementation details of the code and the numerical methods used in the simulations are described in Section 3. In Section 4, the results obtained in the numerical simulations are presented. Section 5 discusses the insights gained from the present results for macro-scale modeling. Finally, Section 6 concludes the paper.
2 Methodology
2.1 Mathematical Model of Particle Motion
In CFD–DEM, the modeling of translational and rotational motion of each sediment particle is based on Newton’s second law as the following equations (Cundall and Strack, 1979):
| (1a) | ||||
| (1b) | ||||
where is the mass of particle; is particle velocity; is time; , , are inter-particle collision force, van der Waals force, fluid–particle interaction forces, respectively; is the gravitational acceleration. Similarly, and are angular moment of inertia and angular velocity of the particle; and are the torques due to inter-particle collision and fluid–particle interactions, respectively. To compute the collision forces and torques, the particles are modeled as soft spheres with inter-particle contact represented by an elastic spring and a viscous dashpot. The detailed description of the collision model in SediFoam and the extensive validations tests with respective to the experimental data are available in Gupta (2015).
2.2 Cohesion Model
In the present simulations, the van der Waals force is implemented and used to model the cohesion among sediment particles (Israelachvili, 2011):
| (2) |
where is the van der Waals force between particle and ; is the Hamaker coefficient; and are the radii of particle and , respectively; is the separation distance between the two particles and ; is the unit vector from particle to particle . A minimum separation distance is applied to avoid singularity when equals to zero (Yang et al., 2000; Dong et al., 2009). Since the minimum separation distance is much smaller than particle size (), Eq. (2) reduces to:
| (3) |
The influence of cohesive force to the silt particle is represented by using the dimensionless Bond number , which is defined as the ratio of the maximum cohesive force and particle weight (Clift et al., 1978):
| (4) |
where is the magnitude of gravitational acceleration. It should be noted that both van der Waals force and electrostatic repulsive force act among particles in DLVO theory for particle cohesion (Verwey and Overbeek, 1948; Israelachvili, 2011). However, the electrostatic force does not significantly influence particle cohesion in the settling process and thus is not considered in the present simulation for the sake of simplicity. This simplification is consistent with these made in the literature (Higashitani et al., 2001; Zhang and Zhang, 2011).
2.3 Locally-Averaged Navier–Stokes Equations for Fluids
Locally-averaged incompressible Navier–Stokes equations are used to describe the fluid flow. Assuming constant fluid density , the governing equations for the fluid are (Anderson and Jackson, 1967; Kafui et al., 2002):
| (5a) | ||||
| (5b) | ||||
where is the solid volume fraction; is the fluid volume fraction; is the fluid velocity. The terms on the right hand side of the momentum equation are: pressure gradient , divergence of the stress tensor , gravity, and fluid–particle interaction forces, respectively. In the present study, only the viscous stress is considered because the fluid Reynolds number is small. The Eulerian fields , , and in Eq. (5) are obtained by averaging the Lagrangian information of particles.
2.4 Fluid–Particle Interactions
The fluid–particle interaction forces in Eq. (1a) consist of buoyancy , drag , lift force , and added mass force . Although the lift force and the added mass force are not considered in the validation tests of fluidized bed simulation (Gupta, 2015), they are important in the simulation of sediment transport.
The drag force model proposed by Syamlal et al. (1993) is applied in the present simulations. The drag on an individual component sphere is formulated as:
| (6) |
where and are the volume and the velocity of particle , respectively; , , and are the fluid velocity, solid volume fraction, and fluid volume fraction interpolated to the center of particle , respectively; is the drag correlation coefficient which accounts for the presence of other particles. The value in the present study is based on Syamlal et al. (1993):
| (7) |
where is the drag coefficient of particle ; is the diameter of particle ; the particle velocity Reynolds number is defined as:
| (8) |
where is the density of solid particle, is the diameter of particle , is the dynamic viscosity of fluid flow; the is the correlation term for the -th particle:
| (9) |
with
| (10) |
In addition to drag, the lift force on a spherical component particle is modeled as (Saffman, 1965; van Rijn, 1984; Zhu et al., 2007):
| (11) |
where is the lift coefficient, is the curl of flow velocity interpolated to the center of particle , and indicates the cross product. The added mass force is considered important because the densities of the carrier and disperse phases are comparable in sediment transport applications. This is modeled as:
| (12) |
where is the coefficient of added mass; represents the material derivative of fluid velocity interpolated to the center of particle .
3 Implementations and Numerical Methods
The hybrid CFD–DEM solver SediFoam is developed based on two state-of-the-art open-source codes in their respective fields, i.e., a CFD platform OpenFOAM (Open Field Operation and Manipulation) developed by OpenFOAM Foundation (Greenshields, 2015) and a molecular dynamics simulator LAMMPS (Large-scale Atomic/Molecular Massively Parallel Simulator) developed at the Sandia National Laboratories (Plimpton, 1995). The LAMMPS–OpenFOAM interface is implemented for the communication of the two solvers. The code is publicly available at https://github.com/xiaoh/sediFoam under GPL license. Detailed implementation is discussed in Sun and Xiao (2016b).
The fluid equations in (5) are solved in OpenFOAM with the finite volume method (Jasak, 1996). PISO (Pressure Implicit Splitting Operation) algorithm is used to prevent velocity–pressure decoupling (Issa, 1986). A second-order central scheme is used for the spatial discretization of convection terms and diffusion terms. Time integrations are performed with a second-order implicit scheme. An averaging algorithm based on diffusion is implemented to obtain smooth , and fields from discrete sediment particles (Sun and Xiao, 2015a, b). To resolve the collision between the sediment particles, the contact force between sediment particles is computed based on the non-linear contact theory of Hertz (1882). The time step to resolve the particle collision is less than the Rayleigh time of smallest particle and characteristic time of the fastest moving particle (Kremmer and Favier, 2001; Ji and Shen, 2006). The cohesive force model mentioned in Section 2.1 is validated via fluidized bed simulations (Gupta, 2015).
4 Results
Based on the above-mentioned approach, numerical simulations are performed to study the settling process of cohesive silt particles. The first objective of the numerical simulations is to demonstrate that CFD–DEM is capable of predicting the cohesive behaviors in the silt settling process. Therefore, the cohesive behaviors obtained in the present simulations are compared with available data in the literature, including (1) the decrease of the structural densities in the silt beds, (2) the decrease in the separation between the characteristic lines due to flocculation, (3) the variation of settling velocity in the settling process, and (4) the variation of the ratio between van der Waals force and structural density. Another objective is to investigate the influence of Bond number and particle polydispersity on silt sedimentation. Therefore, the variation of structural densities on the silt beds due to the variation of Bond number and particle polydispersity is detailed. The setup of the numerical tests is based on previous experimental and numerical studies (Dong et al., 2009; Van and Van Bang, 2013; te Slaa et al., 2015).
The parameters used in the numerical simulations are presented in Table 1, including the dimensions of the domain, the mesh resolutions, and the properties of fluid and particle phases. The geometry of the domain is shown in Fig. 1. Although the dimensions of the computational domain are much smaller than those in the experimental study, the size of the computational domain is adequate for CFD–DEM simulations of sedimentation (Dong et al., 2006, 2009; Zhao et al., 2014). The -, - and - coordinates are aligned with the length, width, and height directions, respectively. The CFD mesh in all directions is uniform in size. The boundary conditions for the pressure and the velocity fields are periodic in both - and -directions. In -direction, no-slip wall condition is applied on the bottom, whereas pressure outlet boundary condition is applied on the top. The fluid is quiescent initially. The silt particles are settling from random locations and the initial solid volume fraction is uniform. The restitution coefficient of the sediment particles used in the simulations is very small () because the contact among the sediment particles is viscously damped (Schmeeckle, 2014; Kidanemariam and Uhlmann, 2014). The coefficient of friction between the particles is 0.4 according to Kidanemariam and Uhlmann (2014). It should be noted that both the restitution coefficient and the coefficient of friction do not significantly influence the integral quantities in sediment transport according to literature (Drake and Calantoni, 2001). The fraction of silt by material weight is approximated by using log-normal distribution (Vanoni, 2006; García, 2008). The process to generate silt particles of random sizes based on the distribution of material weight is detailed in the Appendix.
We simulated 14 different combinations of initial solid volume fraction , particle polydispersity , and Bond number Bo. The summary of different combinations (Mono01 to Mono05, Poly01 to Poly09) is shown in Table 2. The influences of Bond number on the settling of mono- and poly-dispersed silt particles are investigated by using Mono01 to Mono05 and Poly01 to Poly05, respectively. The present simulation covers the range of Bond number between 0 and 4. In addition to the influence of Bond number, the different cohesive behaviors of mono- and poly-dispersed particles are compared. The influence of the initial solid volume fraction on the settling process is investigated by comparing the results obtained in Poly04, and from Poly06 to Poly09. The initial solid volume fraction ranges from 0.02 to 0.16 in the simulations. It is noted that the Hamaker coefficient is constant for particles of different sizes in each simulation. This is because that the Hamaker coefficient does not change significantly for the same material (Israelachvili, 2011). For poly-dispersed silt particle, the Bond number is calculated based on Eq. (4) using the maximum cohesive force and the weight of mass median particle diameter .
| parameter | value range |
| domain dimensions | |
| length, width, height () | |
| mesh resolutions | |
| length, width, height () | |
| particle properties | |
| initial solid volume fraction [–] | [0.01, 0.16] |
| mass median particle diameter [m] | 60 |
| density [] | 2.7 |
| Young’s modulus [MPa] | 10 |
| normal restitution coefficient [–] | 0.1 |
| coefficient of friction [–] | 0.4 |
| Hamaker coefficient[] | [0.0, 0.48] |
| Bond number [–] | [0, 4] |
| fluid conditions | |
| viscosity [] | 1.0 |
| density [] | 1.0 |
| Case | initial volume fraction | particle polydispersity | Bond number |
|---|---|---|---|
| () | () | (Bo) | |
| Mono01 | 0.16 | 1.0 | 0.0 |
| Mono02 | 0.16 | 1.0 | 0.5 |
| Mono03 | 0.16 | 1.0 | 1.0 |
| Mono04 | 0.16 | 1.0 | 2.0 |
| Mono05 | 0.16 | 1.0 | 4.0 |
| Poly01 | 0.16 | 4.0 | 0.0 |
| Poly02 | 0.16 | 4.0 | 0.5 |
| Poly03 | 0.16 | 4.0 | 1.0 |
| Poly04 | 0.16 | 4.0 | 2.0 |
| Poly05 | 0.16 | 4.0 | 4.0 |
| Poly06 | 0.01 | 4.0 | 2.0 |
| Poly07 | 0.02 | 4.0 | 2.0 |
| Poly08 | 0.04 | 4.0 | 2.0 |
| Poly09 | 0.08 | 4.0 | 2.0 |
4.1 Structural Density
In the sedimentation process of fluid–particle mixture, the height of the sediment bed increases. Due to the formation of flocs by silt particle, the structural densities (solid volume fraction in unity) of silt beds are smaller than those of sand beds (te Slaa et al., 2015). In the present study, the influences of inter-particle cohesion and particle polydispersity on the structural densities of sediment beds are investigated separately.
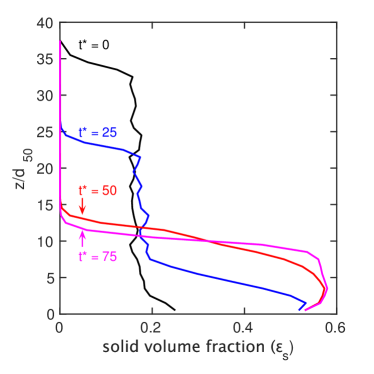
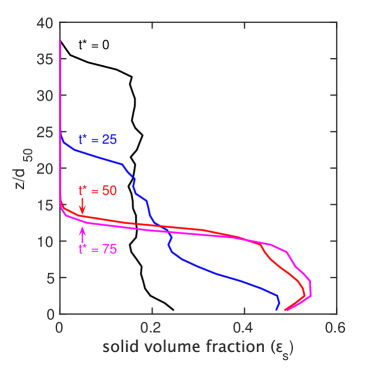
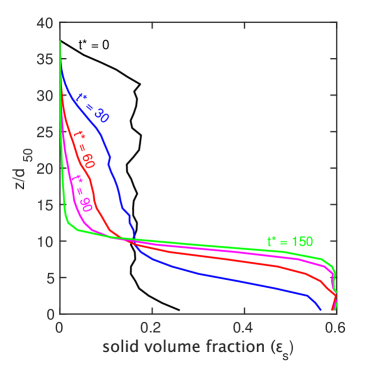
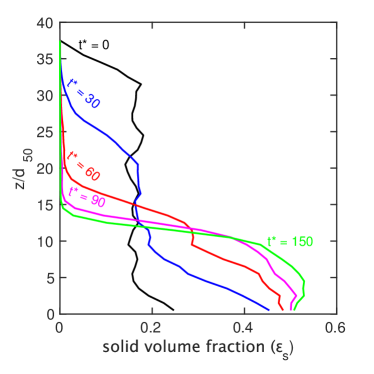
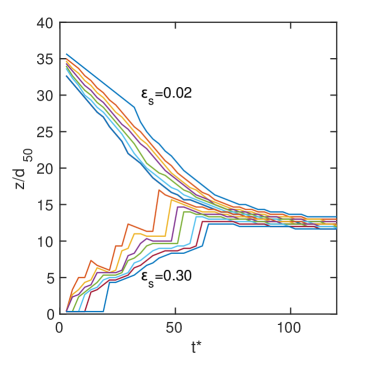
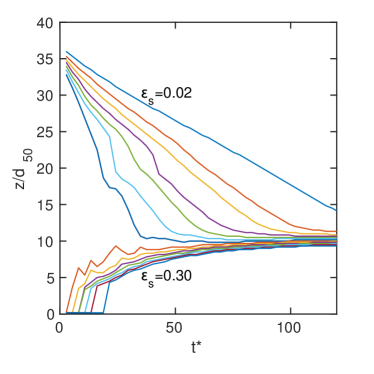
The evolution of solid volume fraction profiles during the sedimentation process for silt particles is presented in Fig. 2. This aims to demonstrate that CFD–DEM is capable of modeling the variation of the interfaces of the fluid–particle mixture. It can be seen in Fig. 2 that the downward moving (supernatant/suspension) and upward moving (suspension/sediment bed) interfaces are observed in the sediment test. This is consistent with both experimental measurements and Kynch’s theory on sedimentation (Kynch, 1952; Kranenburg, 1992). It can be seen in the figure that the stacking arrangement of the sediment particles is influenced by wall boundary, and thus the solid volume fraction is smaller in the near-wall regions. However, this does not influence the prediction of structural densities since the thickness of the sediment bed is large enough (Benenati and Brosilow, 1962). The non-dimensional time is used, where is the clear water terminal velocity of the particles of mass median diameter. At , the initial solid volume fraction in the domain is .
The solid volume fraction profiles of mono-dispersed particles are shown in Figs. 2(a) and 2(b). It can be seen that the shape of the profiles and the height of the downward moving interface at different snapshots have no major difference between cohesive and non-cohesive particle. However, the structural density in the sediment bed of cohesive particle is smaller than that of non-cohesive particle after the particles are settled out of the suspension (). This observation is similar to previous findings in cake sedimentation of glass beads (Dong et al., 2009), indicating the decrease of structural density is due to particle cohesion even though the particles are mono-dispersed. Figures 2(c) and 2(d) show the solid volume fraction profiles of poly-dispersed particles. Due to the presence of smaller particles in poly-dispersed silt, the sedimentation of poly-dispersed silt takes longer () compared with that of mono-dispersed silt (). It can be seen in Fig. 2(c) that there is no downward moving interface in the sedimentation process of poly-dispersed particles compared with mono-dispersed particles in Fig. 2(a). Instead, a gradient of the solid volume fraction in the suspension can be observed. This gradient is attributed to the separation of poly-dispersed silt in the settling process. The larger silt particles fall more rapidly to form the silt bed, whereas small silt particles fall slowly in the suspension. In the upper part of suspension, there are only very small particles, and the solid volume fraction is small; in the lower part, large and small silt particles coexist, and the solid volume fraction is close to the initial value . When the particle cohesion is considered in the poly-dispersed silt, the smaller particles are attached to larger ones and fall faster. Therefore, the separation of poly-dispersed silt is less significant and the gradient of the solid volume fraction in the suspension is smaller, as is shown in Fig. 2(d). It can be seen that the range of the solid volume fraction in the sediment bed of cohesive poly-dispersed silt is [0.48, 0.53] at Bond number Bo = 2. This range is qualitatively consistent with the result [0.46, 0.55] in experimental measurement (te Slaa et al., 2015). When the Bond number = 2, the Hamaker coefficient in the simulation equals to , which of the same order of magnitude as in the literature (Israelachvili, 2011).
The structural densities of the sediment beds of mono- and poly-dispersed silt obtained in the present simulations are plotted as a function of the Bond number in Fig. 3. The range of the structural densities is used to demonstrate its variation within the sediment beds. This aims to illustrate the influence of both Bond number and particle polydispersity on the structural densities of the sediment beds. It can be seen that the variations of the structural densities at different Bond numbers in the present simulations are consistent with those obtained in previous CFD–DEM simulations of much larger particles (Dong et al., 2009). This indicates that the influence of the Bond number on the decrease of the structural densities is similar for different particle sizes. It can be seen that the structural densities of poly-dispersed silt when Bond number Bo are larger than that of mono-dispersed silt. This is because smaller particles can fill in the spaces between larger particles and have larger structural densities when the cohesive force is negligible. However, at Bond number Bo , the structural densities of poly-dispersed silt are much smaller. This is attributed to the fact that the number of particles smaller than is very large (see Fig. A.1(b)), and the influence of cohesive force is more significant on smaller particles. The flocs of smaller silt particles are more likely to form, and the cohesive force limited the relative motion of silt particles to prevent the formation of more close-packed structures. Moreover, the variation of structural densities is larger for poly-dispersed silt. This is due to the variation of particle size in poly-dispersed silt beds.
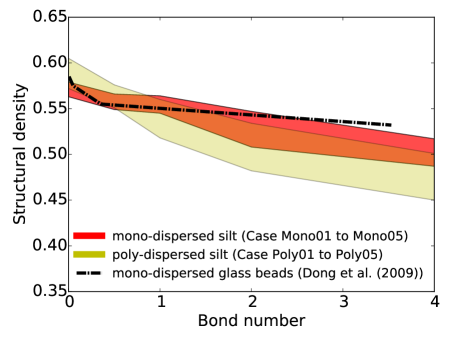
In summary, the structural densities of both mono- and poly-dispersed silt at various Bond numbers are presented. The results obtained in the present studies are qualitatively consistent with those in the literature. It can be seen that the cohesion from silt particle itself can contribute to the decrease of structural densities. Moreover, the presence of smaller particles in poly-dispersed silt increases the reduction of structural densities.
4.2 Characteristic Lines
The characteristic lines of equal solid volume fraction (isolutes) are constructed from solid volume fraction profiles. The descending and ascending of isolutes indicate the segregation of particles of different sizes. In this section, the characteristic lines obtained from CFD–DEM simulations are detailed, which is to demonstrate the capability of the CFD–DEM approach in the prediction of segregation of cohesive silt.
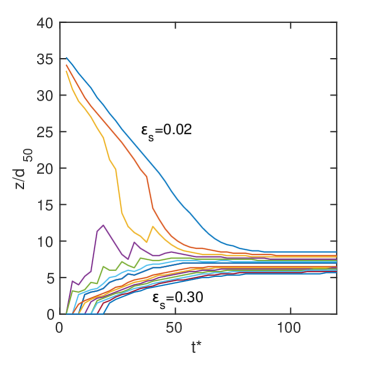
The evolution of characteristic lines in the () plane during the settling process for case Poly09 is shown in Fig. 4. The descending and ascending of the isolutes of the horizontally-averaged solid volume fraction fields are demonstrated. The descending of the isolutes represents the settling of particles, whereas the ascending of the isolutes represents the accretion of sediment beds. It can be seen in Fig. 4 that the variation in slopes of the descending characteristic lines (fan of isolutes) can be observed in the settling process of poly-dispersed particles. This is due to the segregation of poly-dispersed silt, since the silt particles are composed of different size fractions and have different settling velocities. The fan of isolutes is also observed in the previous experimental study (te Slaa et al., 2015). When the sediment are settled out of the suspension, the isolutes indicate the surface of the sediment beds and the characteristic lines become horizontal in the () plane.
The characteristic lines obtained from cohesive poly-dispersed silt at different initial solid volume fractions are shown in Figs. 5(a) and 5(b). At both initial solid volume fractions, the fans of isolutes due to the segregation of poly-dispersed silt are observed. However, when the initial solid volume fraction increases from to 0.16, the segregation effect reduces significantly. This is attributed to the fact that the increase of initial solid volume fraction can hinder the segregation process (te Slaa et al., 2015). The influence of the Bond number to characteristic lines can be seen from the comparison between Figs. 5(b) and 5(c). The rising isolutes are similar in both panels, but the shapes of the descending isolutes are different. When the cohesive force is considered, the separation of the descending isolutes is negligible. However, when the cohesive force is not considered, the separation is much more significant. This is because when particle cohesion is considered, smaller particles are attached to larger ones and fall much faster. Consequently, the segregation due to the difference of particle settling velocity is significantly reduced. Compared with the experimental study, the present numerical simulation uses a much smaller computational domain, and the characteristic lines obtained in numerical tests cannot be directly compared to the experimental results. However, the qualitative features of the characteristic lines observed in the experimental study (te Slaa et al., 2015) are still captured in the numerical simulations.
4.3 Settling Velocity
The settling velocity is another quantity of interest in the settling process. Since natural silt is poly-dispersed and the settling velocities of different particle sizes differ significantly, the settling velocity varies as the particle distribution of the suspended particles changes. To describe the variation of settling velocity during the settling process of natural silt, the combinations of settling velocity and solid volume fraction are used (te Slaa et al., 2015). In the present work, the settling velocities obtained by using CFD–DEM are presented to demonstrate the capability of CFD–DEM in predicting the maximum settling velocity and the evolution of the settling velocity during the settling process.
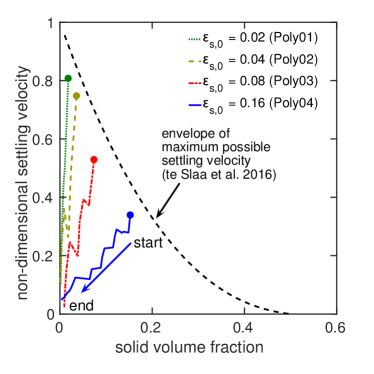
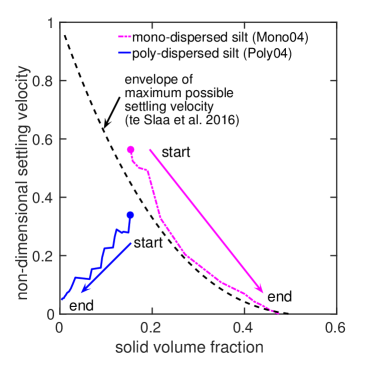
The settling velocity is obtained by calculating the volume-averaged particle velocity of the moving particles, excluding the stationary particles in the sediment bed. The settling velocities are normalized by the clear water settling velocity (). The evolution of settling velocities and the solid volume fractions of silt particle suspension obtained in the present simulations are shown in Fig. 6. The settling velocities obtained at different solid volume fractions according to the hindered settling function in the literature are plotted as the enclosing envelope for all possible combinations (te Slaa et al., 2015). The markers in Fig. 6 indicate the initial settling velocities before the settling process. The evolution of both solid volume fraction and settling velocity of the suspension are denoted using arrows.
The settling velocities of poly-dispersed silt at different initial solid volume fractions are shown in Fig. 6(a). It can be seen in the results that the initial settling velocities obtained at all particle solid volume fractions are close to the envelope. This indicates the settling velocities predicted by using CFD–DEM are consistent with the results obtained by using the empirical formula which considered the influence of the silt flocculation and reverse flow (te Slaa et al., 2015). Therefore, the CFD–DEM approach captures their influence on the averaged settling velocities of silt particles. In addition, the settling velocities predicted by present simulations of poly-dispersed silt are located below the velocity envelope. This is consistent with both the experimental measurement and the sedimentation theory of poly-dispersed particles (te Slaa et al., 2013, 2015). The comparison between mono- and poly-dispersed silt is plotted in Fig. 6(b). It can be seen that the evolution of solid volume fractions and settling velocities of mono-dispersed silt is different from those of poly-dispersed silt. The solid volume fraction of the suspension of mono-dispersed silt increases during the settling process (see Fig. 2(b)). It can be seen that the terminal velocities of the mono-dispersed particles at different solid volume fractions are consistent with the maximum possible settling velocities. This suggests that settling velocity of mono-dispersed silt predicted by using CFD–DEM follows the empirical formula during the sedimentation and consolidation process when the solid volume fractions of the suspension increases.
4.4 Force Ratio
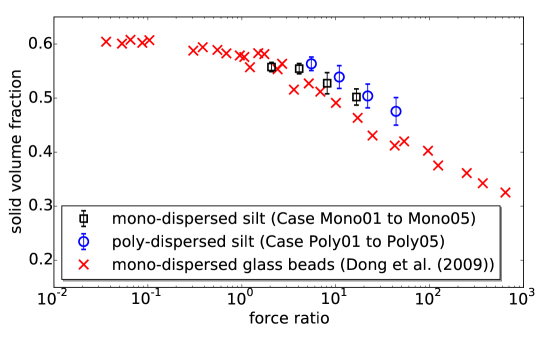
When the settling process is terminated, the influence of fluid drag decreases and the inter-particle contact increases to balance the gravity. The packing arrangement after settling can be related to the ratio between total cohesive force and submerged particle weight (Yang et al., 2000; Dong et al., 2009). Therefore, the force ratio is an important quantity of interest to describe the influence of cohesive force on the packing arrangement. In this section, the force ratios obtained in the present simulations are shown and compared with those in the literature. This aims to demonstrate that correlations between the force ratio and the packing arrangement in the silt bed are captured in present simulations.
The ratio between the total cohesive force and submerged particle weight is defined as (Yang et al., 2000; Dong et al., 2009):
| (13) |
where is the force ratio; and are the total cohesive force and the submerged weight on particle , respectively. The solid volume fractions of the silt bed and the force ratios for both mono- and poly-dispersed particles obtained in the simulations are shown in Fig. 7. When the cohesive force increases, the relative motion between silt particles is limited and thus the packing arrangement in the sediment bed is loosen. Compared with mono-dispersed particles, poly-dispersed particles have slightly larger force ratios. This is because poly-dispersed particles are likely to have more contacts than mono-dispersed particles, and thus the total cohesive force is larger. Moreover, it can be also seen that the relationship between force ratios and solid volume fractions obtained in the present simulations is consistent with the results in the literature (Dong et al., 2009). It is noted that the diameter of silt ( m) is smaller than the glass beads ( m) in the literature. This suggests the similar correlation relationship between force ratio and solid volume fraction is observed at numerical tests using different particles sizes.
5 Discussion
Currently, CFD–DEM are mostly constrained to numerical simulations in small domains (of the order of centimeters) due to the high computational costs. However, engineering scales are much larger, usually ranging from tens of meters to several kilometers. Therefore, macro-scale models have been widely used to study the settling of cohesive sediments in engineering practices, but they need ad-hoc closure models for the influence of flocculation. These ad-hoc models are not derived directly from first principles and cause large discrepancies in the predictions of the cohesive behavior of silt particles, particularly when used outside their applicable regimes. CFD–DEM can provide valuable physical insights of the cohesive particle flocculation, which can provide guidance to the macro-scale modeling of the settling process using empirical models. To this end, we discuss the cohesive force network and collision density functions obtained from the present simulations and their implications for macro-scale modeling of cohesive silt sedimentation.
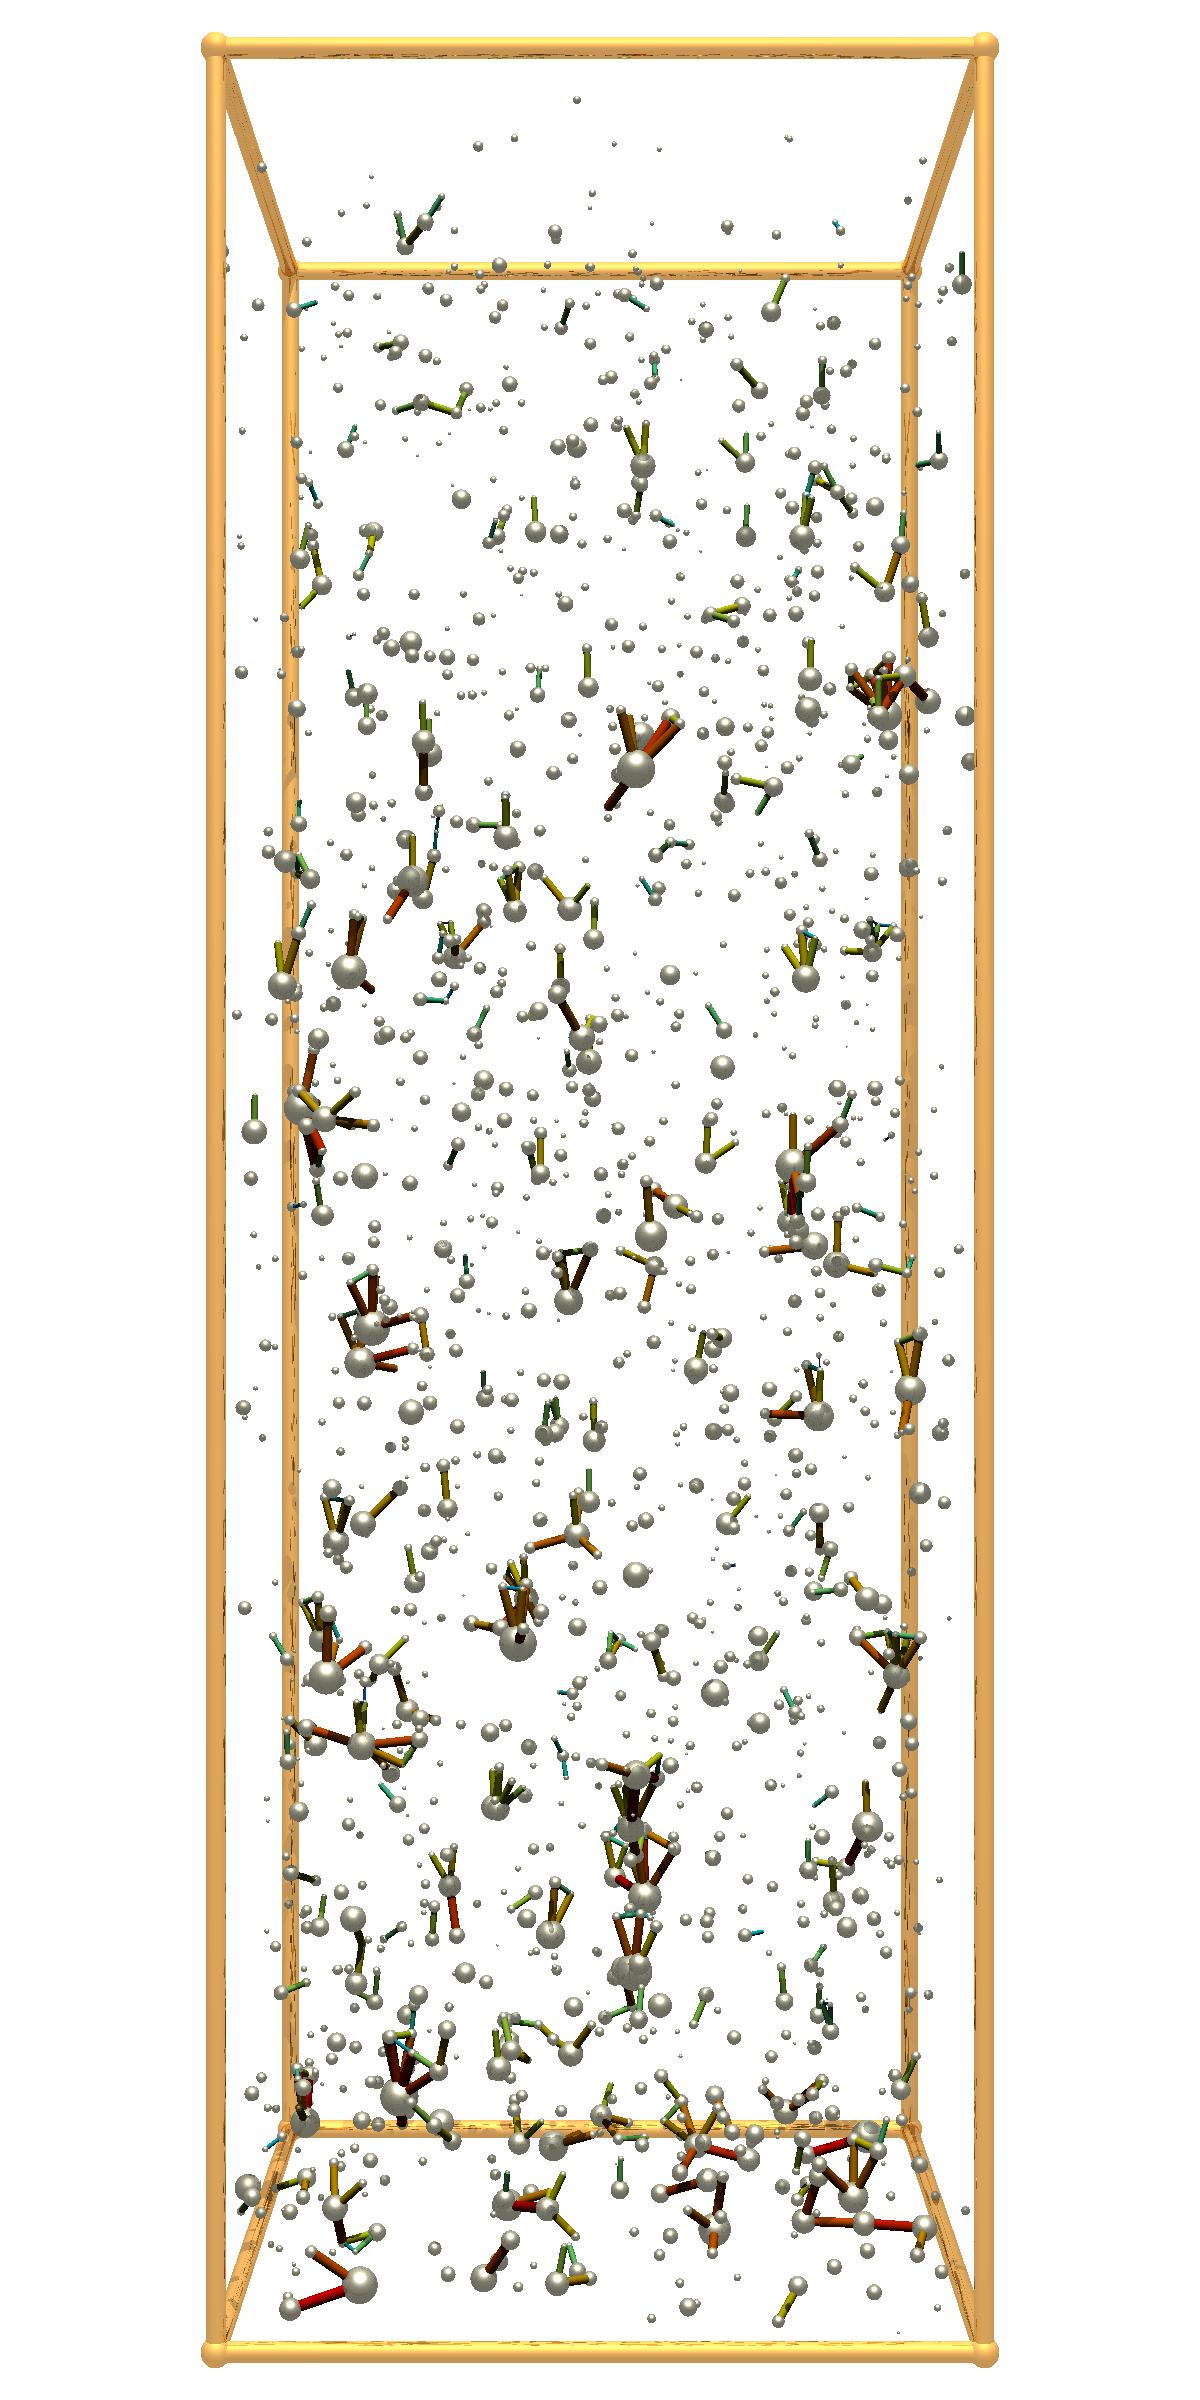
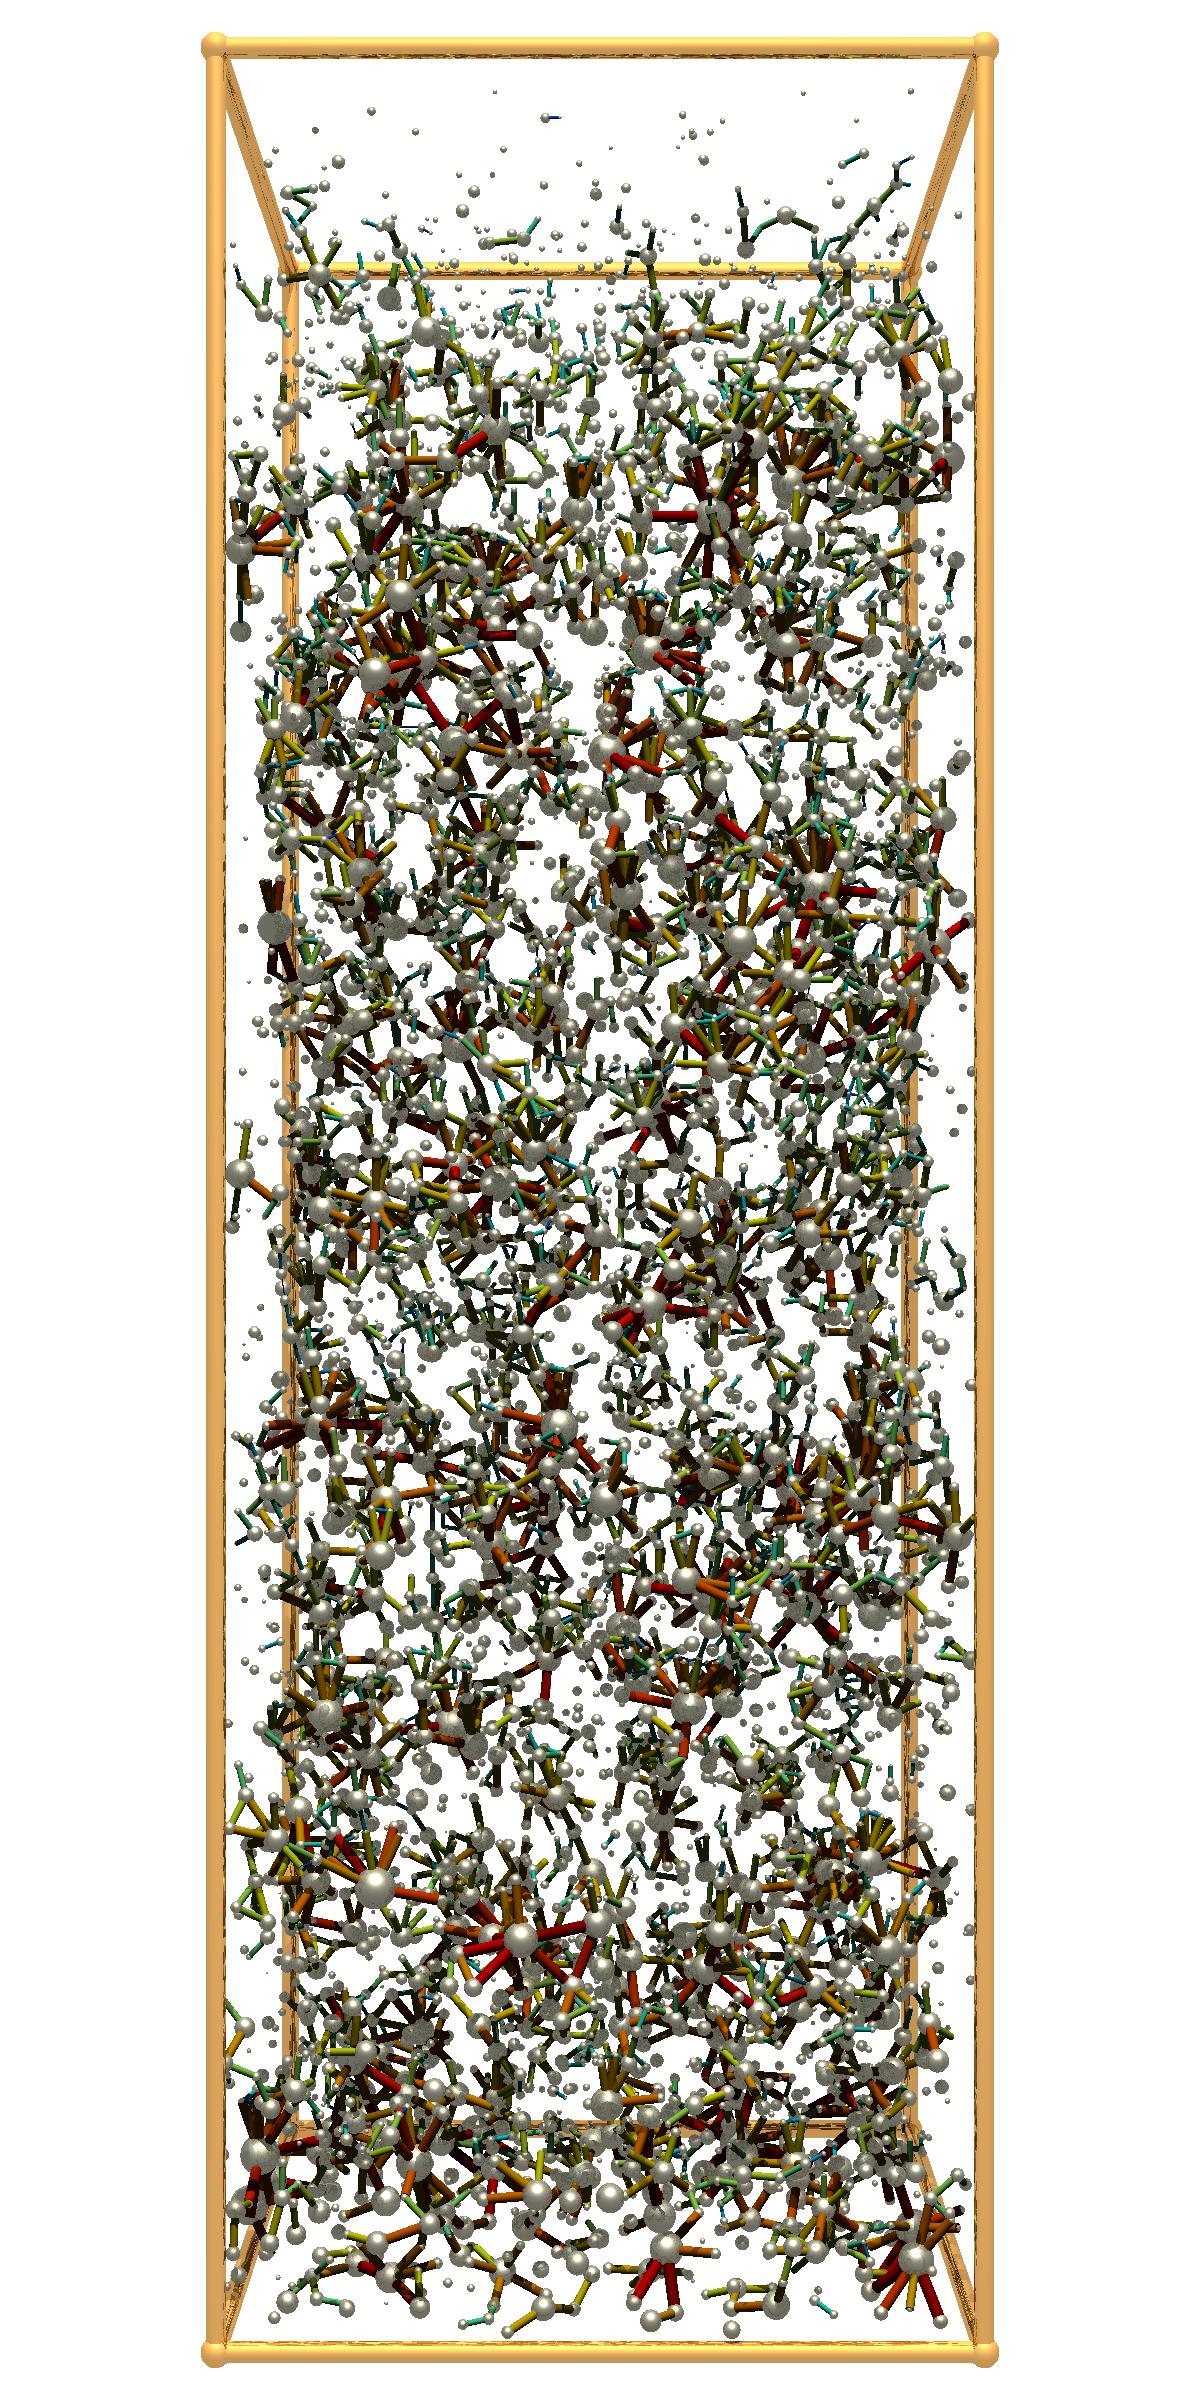
The cohesive force network between silt particles is shown in Fig. 8 to demonstrate the propagation of the cohesive force. The locations of particles and cohesive force are obtained at before the sedimentation of larger particles. The particles are represented by using spheres of different sizes. The cohesive forces between the particles are represented by using cylinders, and the diameter of the cylinders indicates the magnitude of the cohesive force. The cohesion between particles of different sizes can be observed in Fig. 8. This is caused by the differential settling of poly-dispersed silt. Because of the inter-particle cohesion, the flocs of silt particle are formed at both initial solid volume fractions. At lower initial solid volume fraction (see Fig. 8(a)), small and isolated flocs are observed. On the other hand, at higher initial solid volume fraction (see Fig. 8(b)), the number of contacts between silt particles increases significantly. The flocs are connected via van der Waals force and are no longer isolated as in the case of low initial solid volume fractions. It can be also seen that the magnitude of the cohesive force is larger between larger particles than that between smaller particles. However, the Bond number between smaller particles is larger.
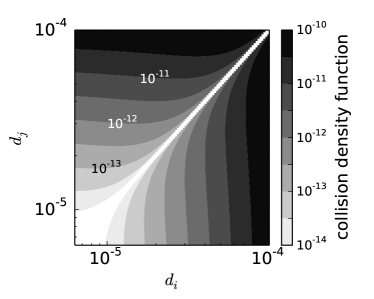
The collision frequency function has been used to model the rate of collision between cohesive particles in macro-scale problems of silt sedimentation (van Leussen, 1988, 1994). This coefficient is important in the prediction of the settling velocity when flocs are formed by cohesive particles. In the modeling of flocculation based on binary collision theory, the collision frequency function is defined as (van Leussen, 1988):
| (14) |
where is the difference in density between fluid and particle. However, the binary collision theory does not account for the influence of solid volume fraction on the collision frequency.
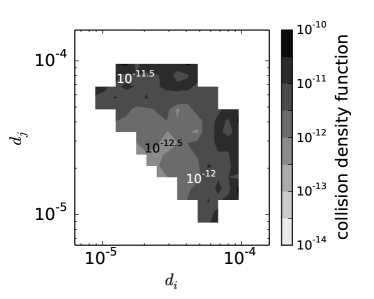
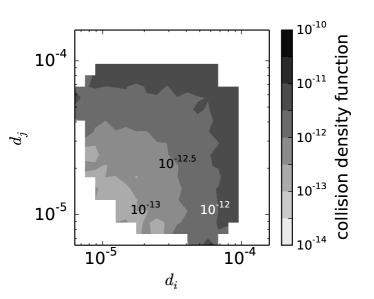
The results obtained at different in the CFD–DEM simulations are compared with those obtained by using Eq. (14) to demonstrate the variation of the collision frequency functions due to solid volume fractions. The contours of collision frequency functions obtained in the present simulations are shown in Figs. 9(a) and 9(b), and the contour computed based on binary collision theory is presented in Fig. 9(c). The collision frequency functions are obtained at in the CFD–DEM simulations before the sedimentation of larger particles. It can be seen that the collision frequency function obtained at low initial solid volume fraction is in good agreement with the theoretical solution in terms of the order of magnitude. However, the contour obtained at higher initial solid volume fraction is different from that obtained at lower . Compared with Fig. 9(a), it can be seen in Fig. 9(b) that the collision occurs for smaller particles can be observed at higher initial solid volume fraction. When the initial solid volume fraction increases, the average distance between smaller particles decreases, and thus the flocculation between smaller particles is more likely to be observed. However, the collision frequency between larger particles decreases at higher initial solid volume fraction. This is due to the fact that smaller particles are filling the spaces of larger ones and reduces the chance of direct contact between larger particles.
In summary, the collision frequency function obtained at low solid volume fraction () is in good agreement with the theoretical solution in terms of the order of magnitude. However, a decrease of collision frequency is observed at high solid volume fraction (). This indicates the decrease of collision frequency at high volume fractions in macro-scale modeling of cohesive silt sedimentation should be taken into account.
6 Conclusion
In this work, we have studied the three-dimensional settling process of cohesive silt via numerical simulations. The CFD–DEM approach is adopted in the simulations because it can faithfully represent the individual and averaged quantities of sediment particles. The van der Waals force is taken into account to describe the cohesive forces between silt particles. In addition, the different behaviors of both mono- and poly-dispersed silt in the settling process are investigated. Phenomena observed in the experimental study (te Slaa et al., 2013, 2015), including the decrease of structural densities, the segregation, and the variation of settling velocity, are all captured in the numerical simulations. It is demonstrated that the structural densities of the sediment beds decrease significantly when the particle Bond number increases. This is because the increase of particle cohesion between the silt particles prevents the formation of more close-packed structures. Moreover, the mean structural density decreases further when the polydispersity of particle size increases. This is attributed to the fact that cohesive force is larger for smaller particles at a given Hamaker coefficient. The particle cohesion can also reduce the segregation of the characteristic lines at high solid volume fraction () because smaller particles are overtaken by larger ones. The force ratio obtained by using silt particle is also presented to demonstrate its relationship with the packing arrangement. The force ratios obtained in the present study is consistent with those results using much larger particles in the literature.
In addition to the validation against existing data in the literature, the micromechanics of individual silt particle during the settling process is investigated. The cohesive force network between silt particles is presented to demonstrate the propagation of the cohesive force. At lower initial solid volume fraction, small and isolated flocs are observed. On the other hand, the number of contacts between silt particles increases significantly at higher initial solid volume fraction. The collision frequency function obtained in the present simulations is compared with the formula in the literature. A decrease in the collision frequency function is observed at high initial solid volume fraction (). This effect should be accounted for in the modeling of cohesive silt sedimentation using empirical models for macro-scale problems.
Acknowledgments
The computational resources used for this project were provided by the Advanced Research Computing (ARC) of Virginia Tech, which is gratefully acknowledged. RS gratefully acknowledges Dr. Prashant Gupta for the implementation and validation of the inter-particle cohesive force module of SediFoam.
Reference
References
- Anderson and Jackson (1967) Anderson, T., Jackson, R., 1967. A fluid mechanical description of fluidized beds: Equations of motion. Industrial and Chemistry Engineering Fundamentals 6, 527–534.
- Batchelor and Green (1972) Batchelor, G. K., Green, J.-T., 1972. The hydrodynamic interaction of two small freely-moving spheres in a linear flow field. Journal of Fluid Mechanics 56 (02), 375–400.
- Benenati and Brosilow (1962) Benenati, R., Brosilow, C., 1962. Void fraction distribution in beds of spheres. AIChE Journal 8 (3), 359–361.
- Bravo et al. (2015) Bravo, R., Pérez-Aparicio, J. L., Gómez-Hernández, J. J., 2015. Numerical sedimentation particle-size analysis using the Discrete Element Method. Advances in Water Resources 86, 58–72.
- Bürger and Wendland (2001) Bürger, R., Wendland, W. L., 2001. Sedimentation and suspension flows: Historical perspective and some recent developments. Journal of Engineering Mathematics 41 (2-3), 101–116.
- Capecelatro and Desjardins (2013) Capecelatro, J., Desjardins, O., 2013. Eulerian–Lagrangian modeling of turbulent liquid–solid slurries in horizontal pipes. International journal of multiphase flow 55, 64–79.
- Chen et al. (2011) Chen, F., Drumm, E. C., Guiochon, G., 2011. Coupled discrete element and finite volume solution of two classical soil mechanics problems. Computers and Geotechnics 38 (5), 638–647.
- Clift et al. (1978) Clift, R., Grace, J., Weber, M., 1978. Bubbles, drops and particles. Academic Press, New York.
- Cundall and Strack (1979) Cundall, P., Strack, D., 1979. A discrete numerical model for granular assemblies. Géotechnique 29, 47–65.
- Dong et al. (2006) Dong, K., Yang, R., Zou, R., Yu, A., 2006. Role of interparticle forces in the formation of random loose packing. Physical review letters 96 (14), 145505.
- Dong et al. (2009) Dong, K., Zou, R., Yang, R., Yu, A., Roach, G., 2009. DEM simulation of cake formation in sedimentation and filtration. Minerals Engineering 22 (11), 921–930.
- Drake and Calantoni (2001) Drake, T. G., Calantoni, J., 2001. Discrete particle model for sheet flow sediment transport in the nearshore. Journal of Geophysical Research: Oceans (1978–2012) 106 (C9), 19859–19868.
- Dyachenko and Dueck (2012) Dyachenko, E., Dueck, J., 2012. Modeling of sedimentation and filtration layer formation by Discrete Element Method. Komput. Issled. Model. (1), 105–120.
- García (2008) García, M., 2008. Sedimentation engineering: processes, measurements, modeling, and practice. ASCE Manuals and Reports on Engineering Practice (110).
- Greenshields (2015) Greenshields, C. J., 2015. Openfoam user guide. OpenFOAM Foundation Ltd, version 3 (1).
- Gupta (2015) Gupta, P., 2015. Verification and validation of a DEM–CFD model and multiscale modelling of cohesive fluidization regimes.
- Heintzenberg (1994) Heintzenberg, J., 1994. Properties of the log-normal particle size distribution. Aerosol Science and Technology 21 (1), 46–48.
- Hertz (1882) Hertz, H., 1882. Über die Berührung fester elastischer Körper. Journal für die reine und angewandte Mathematik 92, 156–171.
- Higashitani et al. (2001) Higashitani, K., Iimura, K., Sanda, H., 2001. Simulation of deformation and breakup of large aggregates in flows of viscous fluids. Chemical Engineering Science 56 (9), 2927–2938.
- Hinch (1977) Hinch, E. J., 1977. An averaged-equation approach to particle interactions in a fluid suspension. Journal of Fluid Mechanics 83 (04), 695–720.
- Israelachvili (2011) Israelachvili, J., 2011. Intermolecular and surface forces: revised third edition. Academic press.
- Issa (1986) Issa, R. I., 1986. Solution of the implicitly discretised fluid flow equations by operator-splitting. Journal of Computational Physics 62 (1), 40–65.
- Jasak (1996) Jasak, H., 1996. Error analysis and estimation for the finite volume method with applications to fluid flows. Ph.D. thesis, Imperial College London (University of London).
- Ji and Shen (2006) Ji, S., Shen, H. H., 2006. Effect of contact force models on granular flow dynamics. Journal of engineering mechanics 132 (11), 1252–1259.
- Jiang and Haff (1993) Jiang, Z., Haff, P. K., 1993. Multiparticle simulation methods applied to the micromechanics of bed load transport. Water resources research 29 (2), 399–412.
- Kafui et al. (2002) Kafui, K., Thornton, C., Adams, M., 2002. Discrete particle–continuum fluid modelling of gas–solid fluidised beds. Chemical Engineering Science 57 (13).
- Kidanemariam and Uhlmann (2014) Kidanemariam, A. G., Uhlmann, M., 2014. Direct numerical simulation of pattern formation in subaqueous sediment. Journal of Fluid Mechanics 750 (R2), 1–13.
- Kranenburg (1992) Kranenburg, C., 1992. Hindered settling and consolidation of mud-analytical results. Tech. rep., TU Delft, Department of Hydraulic Engineering.
- Kremmer and Favier (2001) Kremmer, M., Favier, J., 2001. A method for representing boundaries in discrete element modelling—part II: Kinematics. International Journal for Numerical Methods in Engineering 51 (12), 1423–1436.
- Krishnappan (1990) Krishnappan, B., 1990. Modelling of settling and flocculation of fine sediments in still water. Canadian Journal of Civil Engineering 17 (5), 763–770.
- Krumbein and Aberdeen (1937) Krumbein, W. C., Aberdeen, E., 1937. The sediments of Barataria Bay. Journal of Sedimentary Research 7 (1).
- Kynch (1952) Kynch, G. J., 1952. A theory of sedimentation. Transactions of the Faraday society 48, 166–176.
- Lick et al. (2004) Lick, W., Jin, L., Gailani, J., 2004. Initiation of movement of quartz particles. Journal of Hydraulic Engineering 130 (8), 755–761.
- Mazzolani et al. (1998) Mazzolani, G., Stolzenbach, K. D., Elimelech, M., 1998. Gravity-induced coagulation of spherical particles of different size and density. Journal of colloid and interface science 197 (2), 334–347.
- McAnally and Mehta (2000) McAnally, W., Mehta, A., 2000. Aggregation rate of fine sediment 126 (12), 883 – 892.
-
Plimpton (1995)
Plimpton, J., 1995. Fast parallel algorithms for short-range molecular
dynamics. J. Comp. Phys. 117, 1–19, see also
http://lammps.sandia.gov/index.html. - Richardson and Zaki (1954) Richardson, J., Zaki, W., 1954. The sedimentation of a suspension of uniform spheres under conditions of viscous flow. Chemical Engineering Science 3 (2), 65–73.
- Roberts et al. (1998) Roberts, J., Jepsen, R., Gotthard, D., Lick, W., 1998. Effects of particle size and bulk density on erosion of quartz particles. Journal of Hydraulic Engineering 124 (12), 1261–1267.
- Saffman (1965) Saffman, P., 1965. The lift on a small sphere in a slow shear flow. Journal of fluid mechanics 22 (02), 385–400.
- Schmeeckle (2014) Schmeeckle, M. W., 2014. Numerical simulation of turbulence and sediment transport of medium sand. Journal of Geophysical Research: Earth Surface 119, 1240–1262.
- Shih et al. (1987) Shih, Y. T., Gidaspow, D., Wasan, D. T., 1987. Hydrodynamics of sedimentation of multisized particles. Powder Technology 50 (3), 201–215.
- Stolzenbach and Elimelech (1994) Stolzenbach, K. D., Elimelech, M., 1994. The effect of particle density on collisions between sinking particles: implications for particle aggregation in the ocean. Deep Sea Research Part I: Oceanographic Research Papers 41 (3), 469–483.
- Sun and Xiao (2015a) Sun, R., Xiao, H., 2015a. Diffusion-based coarse graining in hybrid continuum–discrete solvers: Applications in CFD–DEM. International Journal of Multiphase Flow 72, 233–247.
- Sun and Xiao (2015b) Sun, R., Xiao, H., 2015b. Diffusion-based coarse graining in hybrid continuum–discrete solvers: Theoretical formulation and a priori tests. International Journal of Multiphase Flow 77, 142 – 157.
- Sun and Xiao (2016a) Sun, R., Xiao, H., 2016a. CFD–DEM simulations of current-induced dune formation and morphological evolution. Advances in Water Resources 92, 228–239.
- Sun and Xiao (2016b) Sun, R., Xiao, H., 2016b. SediFoam: A general-purpose, open-source CFD–DEM solver for particle-laden flow with emphasis on sediment transport. Computers & Geosciences 89, 207 – 219.
- Sun and Xiao (2016c) Sun, R., Xiao, H., 2016c. Sediment micromechanics in sheet flows induced by asymmetric waves: A CFD–DEM study. Computers & Geosciences 96, 35–46.
-
Syamlal et al. (1993)
Syamlal, M., Rogers, W., O’Brien, T., 1993. MFIX documentation: Theory guide.
Tech. rep., National Energy Technology Laboratory, Department of Energy, see
also URL
http://www.mfix.org. - te Slaa et al. (2013) te Slaa, S., He, Q., van Maren, D. S., Winterwerp, J. C., 2013. Sedimentation processes in silt-rich sediment systems. Ocean Dynamics 63 (4), 399–421.
- te Slaa et al. (2015) te Slaa, S., van Maren, D., He, Q., Winterwerp, J., 2015. Hindered settling of silt. Journal of Hydraulic Engineering 141 (9), 04015020.
- Van and Van Bang (2013) Van, L. A., Van Bang, D. P., 2013. Hindered settling of sand–mud flocs mixtures: From model formulation to numerical validation. Advances in Water Resources 53, 1–11.
- van Leussen (1988) van Leussen, W., 1988. Aggregation of particles, settling velocity of mud flocs a review. In: Physical processes in estuaries. Springer, pp. 347–403.
- van Leussen (1994) van Leussen, W., 1994. Estuarine macroflocs and their role in fine-grained sediment transport. Ministry of Transport, Public Works and Water Management, National Institute for Coastal and Marine Management (RIKZ).
- van Rijn (1984) van Rijn, L., 1984. Sediment transport, part I: Bed load transport. Journal of hydraulic engineering 110 (10), 1431–1456.
- Vanoni (2006) Vanoni, V., 2006. Sedimentation engineering. ASCE, New Work, p. 23.
- Verwey and Overbeek (1948) Verwey, E. J. W., Overbeek, J. T. G., 1948. Theory of the stability of lyophobic colloids. Amsterdam: Elsevier.
- Winterwerp (2002) Winterwerp, J., 2002. On the flocculation and settling velocity of estuarine mud. Continental shelf research 22 (9), 1339–1360.
- Winterwerp and van Kesteren (2004) Winterwerp, J. C., van Kesteren, W. G. M., 2004. Introduction to the physics of cohesive sediment dynamics in the marine environment. Vol. 56. Elsevier.
- Yang et al. (2000) Yang, R., Zou, R., Yu, A., 2000. Computer simulation of the packing of fine particles. Physical review E 62 (3), 3900.
- Zhang and Zhang (2011) Zhang, J., Zhang, Q., 2011. Lattice Boltzmann simulation of the flocculation process of cohesive sediment due to differential settling. Continental Shelf Research 31 (10), S94–S105.
- Zhao and Shan (2013) Zhao, J., Shan, T., 2013. Coupled CFD–DEM simulation of fluid–particle interaction in geomechanics. Powder technology 239, 248–258.
- Zhao et al. (2014) Zhao, T., Houlsby, G., Utili, S., 2014. Investigation of granular batch sedimentation via DEM–CFD coupling. Granular Matter 16 (6), 921–932.
- Zhu et al. (2007) Zhu, H., Zhou, Z., Yang, R., Yu, A., 2007. Discrete particle simulation of particulate systems: theoretical developments. Chemical Engineering Science 62 (13), 3378–3396.
Appendix A Appendix: Generation of Silt Particles Based on Material Weight Fraction
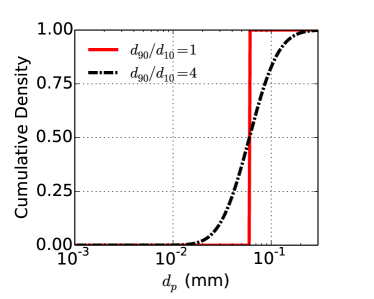
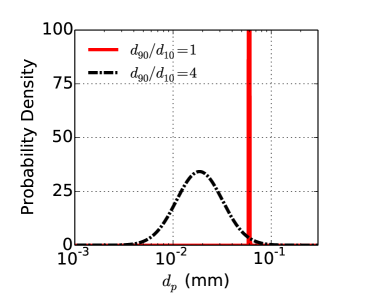
The fraction of silt by material weight is approximated by using log-normal distribution according to the literature (Vanoni, 2006; García, 2008). However, the material weight fraction cannot be directly used to generate the poly-dispersed particles in CFD–DEM. This is because the number of particles per logarithmic interval is unknown. Instead, particle number distribution is required to generate particles of random diameters. According to Heintzenberg (1994), when the distribution of material weight is log-normal, the distribution of particle number is also log-normal. The number median particle diameter , where is the variance of the material weight fraction; the variance of particle diameter distribution is consistent with .
The material weight distribution and the particle number distribution used in the simulations are shown in Figs. A.1(a) and A.1(b), respectively. It can be seen in Fig. A.1(a) that the mean particle diameters are identical for both mono- and poly-dispersed silt. Although the mean particle diameters are the same for both mono- and poly-dispersed silt, most silt particles are smaller than mean diameter when the particle is poly-dispersed (). This is because a larger number of small particles are required for the same material mass.