Kiloparsec-Scale Simulations of Star Formation in Disk Galaxies. IV.
Regulation of Galactic Star Formation Rates by Stellar Feedback
Abstract
Star formation from the interstellar medium of galactic disks is a basic process controlling the evolution of galaxies. Understanding the star formation rate in a local patch of a disk with a given gas mass is thus an important challenge for theoretical models. Here we simulate a kiloparsec region of a disk, following the evolution of self-gravitating molecular clouds down to subparsec scales, as they form stars that then inject feedback energy by dissociating and ionizing UV photons and supernova explosions. We assess the relative importance of each feedback mechanism. We find that -dissociating feedback results in the largest absolute reduction in star formation compared to the run with no feedback. Subsequently adding photoionization feedback produces a more modest reduction. Our fiducial models that combine all three feedback mechanisms yield, without fine-tuning, star formation rates that are in excellent agreement with observations, with -dissociating photons playing a crucial role. Models that only include supernova feedback—a common method in galaxy evolution simulations—settle to similar star formation rates, but with very different temperature and chemical states of the gas, and with very different spatial distributions of young stars.
1. Introduction
The formation of stars from the interstellar medium (ISM) of galactic disks is one of the basic processes that controls the evolution of galaxies. Most stellar populations are built-up in this way, including those in typical Milky Way-like disk galaxies, as well as those formed in starbursts due to galactic interactions that drive large quantities of the ISM gas to more compact circumnuclear disks. Understanding the star formation rate (SFR) per unit area, , from a given galactic disk system as characterized by its total gas mass per unit area, , is thus a basic challenge to theoretical models of star formation and galaxy evolution. Empirically, there is a well-established correlation of based on global averages of disk systems (Kennicutt 1998). Considering only the mass surface density of molecular gas, , and averaging on smaller kpc scales, a linear relation has been derived (Leroy et al. 2008; Bigiel et al. 2008). These SFRs are of relatively low efficiency: only about 4% percent of the total gas content in a given annulus is turned into stars per local orbital time (e.g., Leroy et al. 2008; Tan 2010). Zooming in to the scales where stars actually form, the majority are born in very localized, parsec-scale clumps, i.e., proto star clusters, within turbulent, magnetized giant molecular clouds (GMCs), which are themselves 10 to 100 pc in size (McKee & Ostriker 2007). The inefficiency of star formation continues down to these scales: only a few percent of GMC and clump gas forms stars per local free-fall time (Krumholz & Tan 2007; Da Rio et al. 2014).
The physics of the star formation process is expected to involve a competition between gravitational collapse and various forms of pressure support in the GMCs and their clumps (e.g., thermal, turbulent, magnetic, radiation). However, thermal pressure is relatively unimportant at the K temperatures of most GMC material. The inefficiency of observed SFRs in GMCs implies that some combination of turbulence, magnetic fields and feedback is playing a crucial role in regulating SFRs, making the rates much smaller than those that would result from unsupported, free-fall collapse of the clouds. However, the relative importance of these inhibiting factors remains very uncertain. On the theoretical side, this is because numerical simulations of the ISM and star formation are challenging due to the large range of scales that must be followed, the uncertain choices that need to be made when specifying initial conditions, and the wide variety of physical processes that must be considered.
In this paper we present numerical simulations that explore star formation in galactic disks, focussing on the role of feedback in regulating the ISM and star formation activity. This is the fourth in a series of papers describing 3D simulations of a 1 kpc2 patch of a galactic disk extracted from the global galaxy simulation of Tasker & Tan (2009). In Van Loo, Butler & Tan (2013, Paper I), we followed the patch for 10 Myr down to a resolution of 0.5 pc. Star formation was included, with star particles with a minimum mass of 100 forming in gas above a density threshold of at a star formation efficiency per local free-fall time of . No feedback processes aside from a constant FUV field (of strength , where is the standard Habing (1968) intensity) were included, and after 10 Myr we observed star formation rate surface densities times higher than those in galaxies of comparable gas mass surface density (e.g., Bigiel et al. 2008). In Paper I we speculated that this was due to a lack of magnetic fields and/or local feedback from young stars.
In Van Loo, Tan & Falle (2015, Paper II) we explored the effects of magnetic fields of varying strength on the same kpc-scale patch of the Tasker & Tan (2009) galactic disk. Here we found that magnetic fields suppressed the overall star formation rates by up to a factor of two; however, this result was strongly influenced by the presence of a magnetically supercritical starburst region. In other regions, larger suppression rates were observed.
In Butler, Tan & Van Loo (2015, Paper III), we followed the kpc-scale patch down to much higher resolution ( pc) for 4 Myr. Star formation was included with the same recipe as in Papers I and II, but now with a higher density threshold of and a minimum star particle mass of 10 . As in Paper I, we did not include magnetic fields or feedback from star particles. Enabled by our higher resolution, we explored the structural, kinematic and dynamical properties of the large filaments and clumps and compared them, when possible, to observations of Infrared Dark Clouds (IRDCs) and long molecular filaments that have been identified in the Galactic plane. We found that by many metrics, including too high dense ( ) gas mass fractions, too high mass per unit length dispersion and velocity gradients along the filaments, and too high velocity dispersion for a given mass per unit length, our simulated filaments and clumps differ greatly compared to observed clouds. We therefore concluded that IRDCs do not form from global fast collapse of GMCs, but rather we expect them to be strongly influenced by dynamically important magnetic fields.
The important features that distinguish the simulations of this current paper (Paper IV) from previous works are: (1) the inclusion of dissociating and ionizing feedback, in combination with supernova feedback; (2) the adopted simulation set-up that is inherited from a shearing, global disk simulation; (3) the high dynamic range from 1 kiloparsec down to 0.5 parsecs; (4) the high, realistic density threshold for initiating star formation of and the requirement that this gas be mostly molecular; (5) the use of a star formation efficiency per local free-fall time of 2%. These features of the star formation sub-grid model are motivated by observational studies of star-forming molecular clouds (e.g., Zuckerman & Evans 1974; Krumholz & Tan 2007; Tan et al. 2014; Da Rio et al. 2014). They are an approximate attempt to account for the regulation of star formation rates by a combination of turbulence and magnetic fields operating on sub-grid scales.
By comparison, Walch et al. (2015) presented simulations of a 500 pc sized patch of a non-shearing disk with fiducial resolution of about 4 pc, studying only localized feedback from supernova, although in a background UV radiation field. Kim et al. (2013) simulated a shearing 512 pc sized patch of disk down to 2 pc resolution to study star formation from “dense” gas () and subsequent momentum injection from SN feedback. Kim & Ostriker (2015) included the effects of magnetic fields, finding only modest reductions in SFRs of 25%. On larger scales, Hopkins et al. (2012) have presented smooth particle hydrodynamics (SPH) simulations of galaxies with up to sub-pc resolution in which stars form when and including momentum feedback representing stellar winds, radiation pressure and supernovae, and an approximate Strömgren-type model for ionization feedback. However, the SPH method has been criticized for being very diffusive and for having difficulties of accurately modeling the multi-phase ISM that is expected in regions affected by strong feedback (Agertz et al. 2007). Agertz & Kratsov (2015) have simulated a global disk galaxy with a cosmological zoom-in grid-based AMR simulation that includes energy and momentum feedback from winds, radiation pressure and supernova feedback, but with resolution of only 75 pc. The treatment of radiative transfer in the above simulations has generally been very approximate in comparison to the moment based method we utilize here. Rosdahl et al. (2015) have presented global galaxy simulations including photo-ionization, radiation pressure and supernova feedback, but with minimum resolutions of about 20 pc, still too small to resolve GMCs. Photodissociation feedback with a moment based method of radiative transfer has not been included in any of the above simulations.
We note that after submission of the first version of our paper, the study of Peters et al. (2017) has been published, which carried out similar simulations on a 0.5 kpc by 0.5 kpc non-shearing disk patch at 4 pc resolution that model star formation with a sink particle method and include dissociating feedback, in addition to photoionization, stellar winds and supernovae. One of the main conclusions of the Peters et al. study is that FUV dissociating feedback is needed to produce SFRs, i.e., gas depletion times, in agreement with observed galactic disks.
2. Methods
Our approach is to focus on a kiloparsec-sized patch of a typical galactic disk, extended vertically also by a kiloparsec (i.e., to 500 pc either side of the disk midplane), with a flat, i.e., constant, rotation curve of 200 circular velocity. The center of the patch is at a galactocentric radius of 4.25 kpc. This kpc-sized region is large enough to be sensitive to the main effects of galactic dynamics, including the shear flow due to differential rotation and the vertical structure of the disk. At the same time the region is small enough that it is practical to have resolution down to 0.5-parsec scales that can resolve GMCs. For initial conditions, following Papers I, II & III, we adopt a structured ISM with average gas content of that was extracted from a lower, 8 pc, resolution global galaxy simulation (Tasker & Tan 2009 [TT09]), which already formed a population of self-gravitating GMCs evolved to point of quasi statistical equilibrium via shear-driven collisions and interactions. These initial conditions are shown in the left columns of Figures 1 and 2, which display top-down and in-plane views of the simulation volume. We note that the TT09 simulation did not include star formation or feedback and so the initial conditions here have only been sculpted by the processes of gravitational instability and cloud collisions in a shearing disk. As discussed by TT09 and Paper I, the GMCs have properties such as masses and virial parameters that are quite similar to observed GMCs, but with one main difference being that they have mass surface densities about a factor of two greater than local Milky Way GMCs. Partly for this reason, when these initial conditions are adopted in models that do include star formation and feedback there is an initial transient burst of star formation that we regard as unrealistic. Thus to mitigate its effects we carry out evolution with an “initial feedback model,” discussed below, in a first phase from 0 to 5 Myr, and then adopt the conditions at 5 Myr as our starting point for investigating the different effects of feedback implementation.
We note also that our simulation set-up, again following Papers I, II & III, is not that of a shearing box, but rather is transformed into the rest frame of the center of the box at a galactocentric distance of 4.25 kpc. The gas in the disk patch inherits shearing motions that were present in the global disk (and GMCs also inherit a random velocity dispersion of ), but these are not maintained during our simulation. For this reason, we limit the evolution to a period of 20 Myr, i.e., about one flow crossing time at the maximum shear velocity. The boundary conditions of the volume are set to be outflow in the vertical directions and periodic in the disk plane.
Using the adaptive mesh refinement (AMR) radiation-hydrodynamics code RAMSES-RT (Rosdahl et al. 2013), we have included several physical processes in the simulations, especially: heating and cooling of molecular, atomic and ionized gas; star formation from dense (), molecular () gas, i.e., the creation of “star particles” that each represents a small cluster of stars of 100 , with average feedback properties assessed by assuming a standard Chabrier (2003) stellar initial mass function (IMF); and several feedback mechanisms from these newly-formed stars. In particular, we explore the effects of three types of stellar feedback: H2 dissociation by Lyman-Werner (LW) band ultraviolet photons, photoionzation of hydrogen by extreme ultraviolet (EUV) photons that have eV energies, and supernovae, i.e., the explosive death of massive stars that occurs 3 Myr after their formation leading to release of ergs of kinetic energy. The radiation from the stars is propagated on the AMR grid using a first-order Godunov method, using the moment-based M1 approximation for the Eddington Tensor. The primary advantage of this method is that it is independent of the number of radiation sources, allowing us to study the effects of feedback from many thousands of star particles.
As discussed above, the same initial conditions have also been simulated previously with two other AMR simulation codes: Enzo (Bryan et al. 2014) for the case of pure hydrodynamics with no direct stellar feedback, but including the effect of a diffuse background FUV radiation field (Van Loo, Butler & Tan 2013; Butler, Tan & Van Loo 2015); and MG (Falle et al. 2012) for the case of magnetohydrodynamics (MHD), but with no direct feedback (Van Loo, Tan & Falle 2015). Thus we are able to compare our results with those of these previous simulations to examine the relative importance of magnetic fields and feedback.
The simulations contain four levels of AMR on top of the root grid resolution of 7.8 pc (i.e., over the kpc3 volume), reaching a minimum cell size of 0.49 pc at the finest level (i.e., equivalent to the resolution of a 20483 uniform grid simulation). Cells are refined when the total mass within exceeds 800 M⊙. For example, on refinement to the finest level, this corresponds to a density in a 1 pc sized cell of , which is insufficient to resolve the Jeans length for temperatures that may be as low as K. As with previous papers in this series, the primary goal is not to be able to properly resolve the details of gravitational fragmentation in any particular GMC, but rather to have an approximate estimate of the locations and mass fractions of gas that reach densities of that are necessary for star formation.
We evolve the simulations for 20 Myr, first with an “initial feedback model” until 5 Myr, and then with a variety of different feedback implementations from 5 to 20 Myr. As described below, the goal of the initial feedback model, which has reduced FUV feedback, is to mitigate the effects of the initial transient burst of star formation that depends on adopted initial conditions.
In the following subsections, we describe the main physical processes that have been included in the simulation code.
2.1. Star Formation
We utilize a sub-grid model for star formation in which gas is converted, stochastically, into star particles at a fixed efficiency per free-fall time, if a cell exceeds a given threshold density, and molecular hydrogen mass fraction of . This choice of is motivated by the empirical results of Krumholz & Tan (2007) and is the same value used in the simulations of Van Loo et al. (2015; 2013). The choice of is also motivated by observations of local star-forming clouds, especially Infrared Dark Clouds (IRDCs), which can achieve these densities, while remaining mostly starless (Butler & Tan 2012; Tan et al. 2014). The choice of is also the same as that used in the simulations of Van Loo et al. (2013; 2015). The value of is motivated by the fact that, empirically, star formation is seen to occur exclusively in molecular clouds. Physically, the reason for this may be that this allows cooling to low temperatures of K, helped by CO line cooling, which then allows dense, supersonically turbulent gas clumps to form. Their relatively low ionization fractions and turbulent conditions may be crucial for mediating the loss of magnetic flux support from the gas, e.g., by turbulent reconnection (Lazarian & Vishniac 1999; Eyink et al. 2011).
Star formation is then modeled by creation of “star particles” that are intended to represent a small cluster of young stars. On their creation, the equivalent mass is removed instantaneously from the gas in the relevant cell. The star particles only feel gravitational forces from the surrounding gas and the background galactic potential. Also, they do not accrete any material once formed. We adopt a minimum star particle mass of , with this choice being motivated by the minimum gas mass that is present in a star-forming 0.5 pc-sized cell of , given the choice of . In typical simulation time steps, the mass of new young stars that should form is much less than , so a star particle is only formed with a probability that yields an overall, time-averaged SFR equal to that set by the choice of . Thus all star particles in the simulations are in fact born with masses of and when they are formed, the mass of gas in the natal cell undergoes at most a change.
2.2. Stellar Evolution and Feedback
The star particles are then sources of feedback on the surrounding gas. The feedback properties are based on that expected from a stellar population with initial masses distributed according to the Chabrier (2003) IMF with upper and lower mass limits of 120 and 0.1 . In reality, one expects stochastic sampling of the upper end of the IMF, but this effect is not included here. We anticipate that it would make only minor differences due to the large number of star particles that are formed in the simulations. Thus we utilize IMF-averaged stellar evolutionary tracks from Bruzual & Charlot (2003) that follow evolution from the zero age main sequence to later stages (see Rosdahl et al. 2015 for more details).
In this study, our primary focus is to investigate the thermal and chemical feedback due to UV radiation. Thus the FUV radiation field is constructed, which induces photoelectric heating feedback. It also leads to dissociation of H2. The EUV radiation field leads to ionization of H, with the ionized gas heated to near K. The elevated thermal pressure of these HII regions is another form of feedback. The radiative transfer methods necessary to model this feedback are described below, while the types of radiation feedback are summarized in Table 1.
Note, in this work, we have not modeled the effects of radiation pressure feedback, which is deferred to a future study (Rosdahl et al., in prep.). Nor have we modeled the momentum input from stellar wind feedback, which is difficult to resolve on the scales followed here, especially the effects of overlapping wind bubbles from individual stars, which will lead to a reduction in the overall momentum injection due to oppositely directed flows.
Supernova feedback is modelled with a single injection from each star particle (of total mass ) into its host cell 3 Myr after the particle is formed of ejecta mass and thermal energy . We choose a value of , resulting in each star particle injecting the energy and mass expected from a single supernova progenitor star of initial mass of approximately 10 to 20 . It is worth noting that, thanks to our high mass resolution, we are effectively modelling each individual supernovae explosion, one star at a time. Following the supernova event, cooling is delayed by a dissipation timescale , which we have set to 50,000 yr, given typical densities on the scales of our minimum resolution of 0.5 pc. In practice, this is implemented by turning off cooling in a cell (and adjacent cells) that contains a star particle that underwent a supernova explosion in the last 50,000 yr (see Teyssier et al. 2013; Rosdahl et al. 2015).
To enable the rapid development of a realistic ISM structure that is approximately similar to that in the inner Milky Way disk, e.g., at kpc galactocentric radius, we first run the simulation from 0 to 5 Myr with an “initial feedback model” that includes FUV, EUV and SN feedback. However, because there is an initial transient burst of star formation that occurs before feedback can begin to fully regulate the ISM and because the FUV feedback from stars is quite long-lived (i.e., Myr), we artificially lower the intensity of FUV radiation from these initial phase star particles by a reduction factor of 0.1, while keeping EUV and SN feedback as normal. The net result of this model is that by 5 Myr, the FUV intensity from the initial phase stars is at a median level of 5.3 within the 100 pc thick disk midplane region, where is the standard Habing (1968) intensity. This value is similar to that of the Milky Way at galactocentric radii of kpc (Wolfire et al. 2003). The main focus of our work is then to investigate how implementing different feedback methods from stars formed after 5 Myr affects ISM and star formation properties from the period from 5 to 20 Myr. Note, that the residual effects of feedback from the initial phase stars continue after 5 Myr, but quite rapidly lose importance due to the short timescales associated with massive star evolution.
2.3. Radiative Transfer
Details of the radiative transfer algorithm can be found in Rosdahl et al. (2013). Here we outline the main methods and approximations used in this paper. For stability reasons, the radiative transfer time-step scales inversely with the speed of light . To avoid very small timesteps relative to those set by the hydrodynamics, we use the “reduced speed of light approximation” (Gnedin & Abel 2001), and limit the propagation of radiation to a global speed, , where is the true speed of light. In our simulations we adopt the value of , i.e., 1500 km s-1. We expect the effects of this choice to be relatively minor (see Rosdahl et al. 2015 for explorations of the effect of this choice on SFRs in larger-scale simulations). It is important to note that this approximation is only valid if the reduced speed of light results in a light crossing time that is short compared to smallest of the sound crossing time, the recombination time and the advection time. We have checked a posteriori that our simulation indeed satisfies these requirements. For the transport of radiation, as described in detail in Rosdahl & Teyssier (2015), we use a first order moment method, which tracks in each cell the radiation energy density (zeroth moment, energy per unit volume) and the bulk radiation flux vector F (first moment, energy per unit area and time). The system of moment equations is closed with the M1 expression for the radiation pressure tensor, which has the large numerical advantage that it can be evaluated purely from the local quantities and F. A moment method treats the radiation as a fluid, rather than tracking individual rays, giving the very important advantage that we can treat a large number of radiation sources. As demonstrated in detail in Rosdahl & Teyssier (2015), the sacrifice that comes with this is that rays from individual sources are treated in an average sense in every volume element, resulting in a radiation field which is not as accurate as with ray-tracing, on scales of the source separation. In Rosdahl et al. (2015), we demonstrate that qualitatively we still retain a correct radiation field in a galaxy disk setup.
The two moments are the radiation energy density (erg ) and the radiation flux (erg cm). For the latter, we need to model the radiation pressure (erg cm-3), for which we use the M1 closure. The set of moment equations is solved separately for each radiation group, which is defined for a specific frequency range. For this work, we model four radiation groups (see Table 1) that determine the photodissociation of , the ionization of , the ionization of , and the ionization of , respectively.
| Photon Group | ||||||
|---|---|---|---|---|---|---|
| eV | eV | |||||
| LW | 12.00 | 13.60 | 3.000 | 0.000 | 0.000 | 0.000 |
| EUVHI | 13.60 | 24.59 | 0.000 | 3.007 | 0.000 | 0.000 |
| EUVHeI | 24.59 | 54.42 | 0.000 | 5.687 | 4.478 | 0.000 |
| EUVHeII | 54.42 | 0.000 | 7.889 | 1.197 | 1.055 |
The ionization fractions are defined as . While previous work using Ramses-RT at much larger scales only considered the atomic and ionized species of hydrogen and helium (e.g., Rosdahl et al. 2015), with our higher resolution and denser, colder gas, it becomes important to model the formation and destruction of molecules. We introduce a photo-dissociating radiation model for molecular hydrogen that is included in the non-equilibrium chemistry solver. H2 is formed on dust grains as described by Draine & Bertoldi (1998), as well as from the gas phase onto H-, assuming equilibrium abundances for H- (see Abel et al. 1997), the latter of which is only important at low metallicities.
H2 is dissociated either through collisions with HI (Dove & Mandy 1986; Abel et al. 1997), or through photodissociation by photons in the Lyman-Werner band. For the latter, we use the radiative transfer algorithm of RAMSES-RT, without considering Doppler effects and the associated relativistic corrections to the moment equations. In other words, this amounts to ignoring the effects of velocity gradients in the H2 opacity calculation, while still properly accounting for shielding of LW radiation due to the column density of H2 in dense molecular clouds. These effects are also ignored for the ionization of hydrogen and helium.
2.4. Heating and Cooling
The hydrogen and helium thermochemistry is calculated based on absorption and emission of photons by hydrogen and helium species, photoelectric heating due to electrons ejected from dust grains, as well as equilibrium metal and dust cooling assuming solar metallicity. The gas thermal energy density is tracked in each cell along with the abundances of the species that interact with the photons. We utilize the same non-equilibrium thermochemical network described in Rosdahl et al. (2015). In this network, HI, HeI, and HeII interact with photons through photoionization, and HII, HeII, and HeIII through recombination. In this paper we have additionally considered the cooling and heating contributions from the dissociation of molecular hydrogen by photons in the Lyman-Werner band, as well as line emission from molecular rotational and vibrational levels and fine-structure atomic levels. We also include free-free, free-bound, and two photon cooling, as well as photoelectric heating via dust grains that scales with the Lyman-Werner flux as in Forbes et al. (2016).
While we model non-equilibrium hydrogen and helium thermochemistry, a non-equilibrium description of the thermochemistry of metal species is beyond the scope of this work. Instead, we use tabulated metal contributions to the cooling rates, including dust cooling, extracted from CLOUDY (Ferland et al. 2013), stored as a function of the local temperature, and assumed to scale linearly with the gas density and metallicity.
3. Results
3.1. Effect of Feedback on Global Evolution of the Interstellar Medium
We follow the evolution of the ISM in a series of galactic disk patch simulations for 20 Myr. We will see that this is a long enough time for the results of different feedback mechanisms to become readily apparent and for the properties of the ISM, including its SFR, to reach a quasi statistical equilibrium. As discussed in §2.2, to help enable the rapid development of a realistic ISM structure that is approximately similar to that in the inner Milky Way disk, e.g., at a distance of kpc from the Galactic, we first run the simulation from 0 to 5 Myr with an “initial feedback model” that includes FUV (reduced by a factor of 0.1), EUV and SN feedback. The net result of this model is that by 5 Myr, the FUV intensity from the “initial phase” stars is at a median level of 5.3 within the 100 pc thick disk midplane region.
After 5 Myr, different cases of feedback are then investigated for the newly formed stars in a sequence of model runs: (1) No feedback; (2) only FUV feedback; (3) FUV+EUV feedback; (4) FUV+EUV+SN feedback (the fiducial case); (5) only SN feedback. Note, that the feedback from the initial phase stars continues after 5 Myr in all cases, but the effects of their EUV and SN soon die out, while the impact of the reduced FUV feedback from these stars also gradually declines. ISM properties and star formation activity from 5 to 20 Myr and their dependencies on how feedback is modeled are the focus of this paper.
Figures 1 and 2 show images of the fiducial simulation results, i.e., FUV+EUV+SN feedback, after 5, 10, 15 and 20 Myr as viewed from above (top-down view) and from the side (in-plane view) of the disk, respectively. The quantities displayed are: the mass surface density structure of the gas, , together with locations of young stars, distinguishing those that form after 5 Myr from those that formed earlier; number density of H nuclei, (this quantity and the following are mass-weighted along the line of sight), gas temperature, , , and mass fractions, dissociating (Lyman-Werner) photon intensities, and H-ionizing (EUV) photon intensities.
Figure 1’s top-down view is the clearest way to visualize the evolution of the several initial GMCs that are orbiting in the galactic disk. With the velocity reference frame of the simulation set equal to the orbital velocity of the center of the box, the shear flow causes GMCs on the left, inner-galaxy side to tend to move upwards in the figures, while clouds on the right, outer-galaxy side move downwards. However, note that the clouds also inherit random motions, , from the global galaxy simulation. Periodic boundary conditions are adopted for the sides, while outflow boundary conditions are applied on the top and bottom sides of the cube. Using AMR, finer resolution grids down to 0.5 pc scales are applied (i.e., up to 4 levels of refinement), which follow fragmentation of the GMCs into dense gas clumps.
Above our adopted threshold density of and for gas that is 90% molecular, stars are formed with the empirically motivated subgrid model that turns gas into star particles at an efficiency of 2% per local free-fall time (Krumholz & Tan 2007), described in §2.2. These star particles then act as sources of dissociating, ionizing and, after a 3 Myr delay, supernova feedback. The radiative feedback can be seen directly in the figures showing the intensities of dissociating and ionizing radiation, which then influence the temperature and chemical state of the gas. The intensity of the UV Lyman-Werner radiation field varies by orders of magnitude, being very high in regions of active star formation. By 20 Myr the median FUV intensity in the 100 pc thick disk midplane region is about 8.0 .
In Figure 3 we show the time evolution of the mass and volume fractions of the various ISM phases in the 100 pc thick disk region for the different feedback simulations. For the fiducial simulation at 10, 15 and 20 Myr, the ISM has overall mass fractions: , and , respectively. The equivalent volume fractions are: , and (we note that only a very small fraction of the total gas mass, is expelled from the simulation box to distances pc). After a burst of ionizing feedback, which raises to about 0.4, these mass and volume fractions of the different phases approach relatively constant values as the simulation evolves towards 20 Myr, illustrating that by these metrics the ISM reaches a quasi-statistical equilibrium. We note that by 20 Myr the fiducial simulation has a ratio , which is 2 to 3 times smaller than the average values inferred inside the solar circle by Koda et al. (2016). We expect this is due to the moderately elevated values of FUV intensity that are present, i.e., equivalent to , about double that in the inner Galaxy.
Comparing the results of the different feedback simulations in the sequence from Runs 1 to 4 (NF, LW, LW+EUV, LW+EUV+SN), we see the mass fraction at 20 Myr being reduced to close to the quasi-equilbrium value mostly by the introduction of LW feedback. On its own, this LW feedback keeps most of the gas in the HI phase. With introduction of EUV and SN, a more significant mass fraction of the ionized phase is created. SN-only feedback leads to a much higher mass fraction.
The equivalent results to Figures 1 and 2 for the simulations that have different feedback implementation after 5 Myr are shown in the Appendix, i.e., no feedback (Run NF), only dissociating Lyman-Werner feedback (Run LW), dissociating plus ionizing feedback (Run LW+EUV) and only supernova feedback (Run SN) (Figures A1 - A8). The choice of how feedback is implemented can have a profound effect on the structure of the ISM. This is also illustrated in Figures 4 and 5, which show the results of all the above simulations side-by-side after 20 Myr of evolution.
The NF run retains denser clouds and the global ISM is generally cooler, with heat input only from the declining effects of feedback from the initial phase (0 to 5 Myr formed) stars. Adding LW feedback results in much smaller mass and volume fractions and a generally warmer ISM. However, large scale distributions of dense gas structures remain relatively unaffected compared the NF model. Adding EUV feedback continues these trends. Long, pc, cold, dense filamentary structures are seen aligned with the galactic plane. Finally, the fiducial model with LW+EUV+SN feedback leads to more disruption in the distribution of the dense gas structures: e.g., filaments tend to be shorter and/or more irregular. There are enhanced fractions in some regions due to sweeping up of previously atomic gas. More strongly fluctuating gas potentials also appear to lead to a greater dispersal of the stars that are born in bound star clusters. SN-only feedback leads to much more disruption of the initial molecular clouds, higher fractions of the ISM in the hot (K) phase, but also larger fractions of the molecular phase. The young stars are more dispersed in the SN-only feedback run.
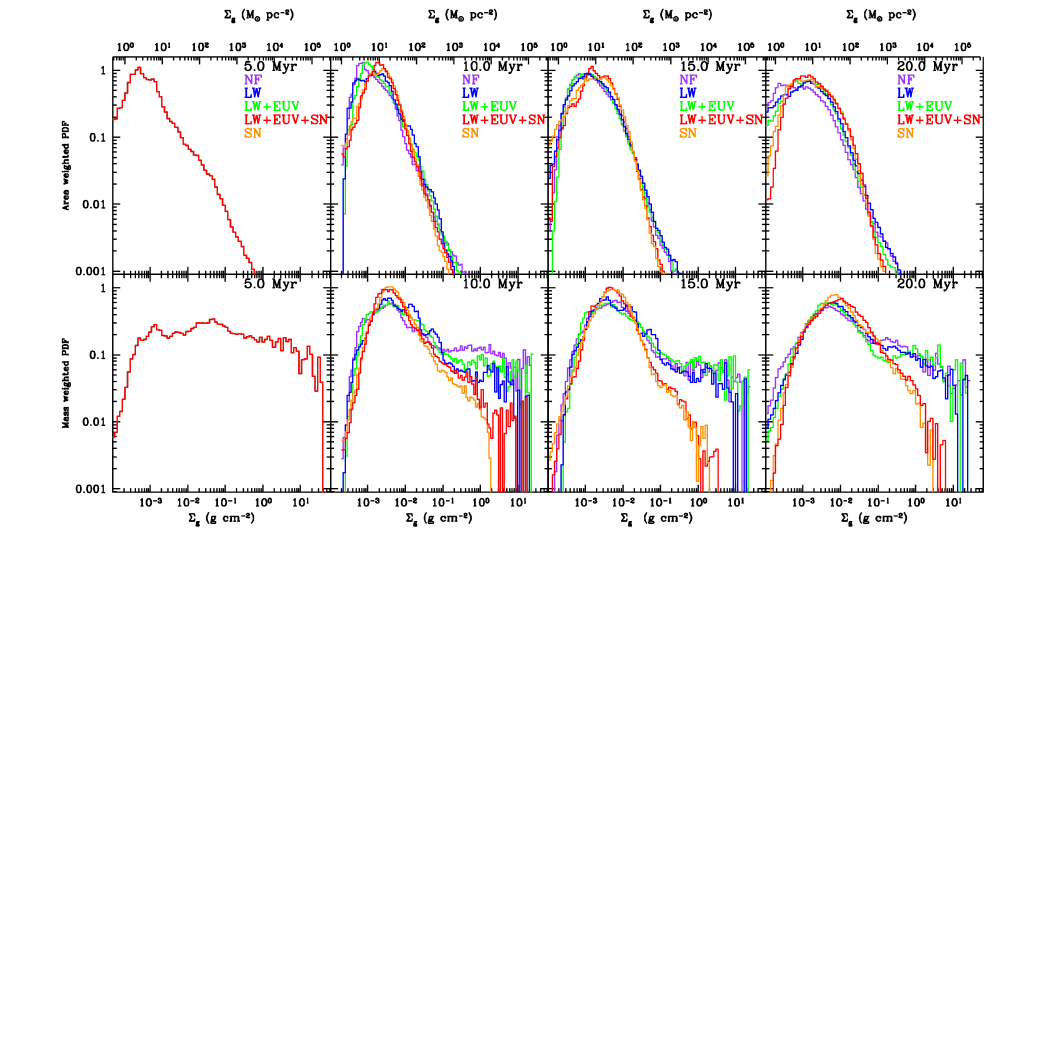
In Figures 6 and 7, we present comparisons of the area and mass-weighted probability distribution functions (PDFs) of gas mass surface densities, viewed from above the disk, that arise in the different models. These are amongst the simplest statistical metrics of the ISM, which can be compared to observed systems, especially as we enter the era of full operation of the Atacama Large Mm-submm Array (ALMA) that has the ability to resolve parsec scales in nearby galaxies. Figure 6 shows that relatively large changes in the PDFs occur from 5 to 10 Myr in all models and then subsequent evolution is more gradual. The mass fraction at high conditions decreases, which is a consequence of both formation of stars and disruption of gas clouds by feedback.
Figure 7 compares the different feedback models at particular times in the simulations, starting from identical initial conditions at 5 Myr. The rapid changes from 5 to 10 Myr are again obvious. By 20 Myr, the area-weighted PDFs in the models with feedback achieve distributions with a single main peak just below . In the mass-weighted PDFs, the high- component is more apparent and at 15 and 20 Myr we notice quite similar distributions in the NF, LW and LW+EUV models. However, there can be factors of a few differences in the amount of material with , which is close to the value of individual 0.5 pc cells on reaching the threshold volume density for star formation of for star formation. The effect of SN in the LW+EUV+SN and SN-only runs is to destroy much of the highest structures, i.e., . Another feature of the PDFs is that those of the LW+EUV+SN and SN-only runs are quite similar to each other.
To better visualize the locations of stars and gas and the effects of different feedback implementations, in Figure 8 we show zoom-ins to two regions at the time of 10 Myr. Region 1, a square patch of 400 pc on a side, is centered in the disk midplane at ( pc, pc) relative to the center of the kpc box and contains the most vigorous starburst activity. Region 2, which is 400 pc by 600 pc in size and centered at ( pc, pc), has a more moderate level of star formation. These regions are the same as those previously analyzed at 10 Myr in the MHD simulations of Van Loo et al. (2015). Recall that each star particle represents a cluster or sub-cluster with 100 that has formed during the last 10 Myr, with the red color for the 0-5 Myr population (common to all runs) and white color for those formed from 5 to 10 Myr and having varying feedback properties. These figures give a dramatic visual illustration of differences in the morphologies of molecular clouds and their star formation activity that result from different implementations of feedback physics. For example, in Region 1 much more massive star clusters form in the no feedback run, while these are mostly dispersed during the sequence LW, LW+EUV and LW+EUV+SN. The SN-only run has a quite different distribution of young stars, which have had the most destructive effects on their natal clouds.
To explore the differences in young stellar populations more quantitatively, we identify the five most massive young star clusters and/or associations in each simulation in Region 1, i.e., a starburst region, selected to each be contained within pc3-scale volumes. For Run NF at 10 Myr, we find that the five most massive clusters/associations (only counting stars formed after 5 Myr) have a mean mass of . Introducing LW feedback reduces this to ; LW+EUV feedback further reduces this to ; and LW+EUV+SN feedback to . On the other hand the SN only feedback simulation produces five most massive clusters with mean mass of . Thus the way in which feedback is implemented can have dramatic impact on the clustering of star formation.
3.2. The Effect of Feedback on Star Formation Rates
We now examine the SFRs that occur during the simulations and the effects of different feedback models. The time evolution of the SFR in the whole kpc patch is shown in Figure 9, averaging over time intervals of just under 1 Myr. Here we also show the results of a run, NF0, which has no feedback at all for the entire period from 0 to 20 Myr. This provides a baseline result against which the other simulations can be compared. In addition, we plot the 0 to 10 Myr SFR results of the MHD simulation of Van Loo et al. (2015) in which the galactic disk patch is initially threaded with a uniform -field of strength of 10 , along with an extrapolated SFR, assuming exponential decay, from 10 to 20 Myr. As discussed by Van Loo et al. (2015), magnetic fields help support the clouds against collapse and lead to reductions in SFRs of factors of a few.
For the feedback simulation runs presented in this paper, all implement the “initial feedback model” from 0 to 5 Myr, designed to reach a realistic FUV intensity by this time. During this phase we see suppression of the SFR by about a factor of ten in the first few Myr, but then by smaller factors. After 5 Myr, the no feedback case eventually converges towards a SFR approximately equal to the NF0 run as the effects of stars formed in the initial feedback phase die out. Introducing only Lyman-Werner feedback leads to factors of several reduction in SFR compared to Run NF over most of the 20 Myr evolution. However, the SFR now also shows much larger fluctuations, which indicates the bursty nature of star formation and subsequent feedback that is occuring in the simulated disk patch. We will thus typically consider SFRs from the simulations averaged over 5 Myr periods. The SFRs in the three 5 Myr period averages from 5 to 20 Myr are fairly constant at a level of about .
Continuing along the sequence of feedback models, the introduction of ionizing feedback in Run LW+EUV leads to SFRs that, on average, are only modestly smaller than Run LW, and sometimes can even be higher, e.g., from 10 to 15 Myr. The final step to reaching the fiducial model is the introduction of supernova feedback, i.e., Run LW+EUV+SN, which leads to a significant further reduction in the SFRs. The global evolution of the SFR appears to show a longer period systematic fluctuation, decreasing from an initial relatively high value at 5 Myr by almost a factor of 100 by the time around 15 Myr, before increasing again to a value around by 20 Myr. However, the two 5 Myr period averages from 10 to 20 Myr are relatively similar at about half this value. Note that the absolute amount of reduction of due to introduction of SN feedback in this sequence is about the same as that caused by the earlier introduction of LW feedback, relative to the NF case.
Finally, the SN-only feedback run shows an initially relatively high SFR just after 5 Myr, which is understandable given the 3 Myr delay associated with this feedback. However, the SFR then declines over the next 10 Myr by about two orders of magnitude, before rising more modestly again after 15 Myr. This SFR history is very similar to that of the fiducial run with full feedback (LW+EUV+SN), which is consistent with the very similar PDFs of gas mass surface density seen in these models at late times (Fig. 7).
Figure 10a shows the results of these simulations on a “Kennicutt-Schmidt” (KS) diagram of versus , i.e., the total gas mass surface density. The left panel shows conditions averaged over the whole kpc patch of the simulations, with evaluated as the average from 15 to 20 Myr, i.e., when the statistical properties of the ISM appear to have mostly stabilized (§3.1). The value of is that observed at the end of this period, i.e., at 20 Myr. This method of constructing the KS diagram is similar to that adopted by observational studies, which measure current gas properties but which evaluate SFRs from the presence of massive star populations that are sensitive to the SFR averaged over the last several Myr. The observational measurements of Kennicutt (1998) and Bigiel et al. (2008), the latter averaging over scales of about 1 kpc, are plotted in Fig. 10.
We have connected the results of the simulations with a sequence of arrows that show the effect of adding particular physics. The pure no feedback result, NF0, is in the upper left with a high SFR and, by 20 Myr, a much reduced gas content. The effect of magnetizing this disk with a 10 field strength is shown by the light blue arrow connecting to extrapolated results of Van Loo et al. (2015). The purple arrow to Run NF illustrates the effect of the initial feedback model implemented from 0 to 5 Myr, but then with feedback turned off. The SFR near the end of the simulation is very similar to that of NF0, even though the disk has retained more gas. Adding LW feedback brings the SFR down by just over a factor of two and further raises the gas mass surface density. Ionization has a more modest effect on SFR, with remaining gas content (set mostly by earlier SFRs) hardly affected. At the end of the sequence, the fiducial model of LW+EUV+SN feedback brings the SFR down by about a factor of 10 at a slightly larger gas content. We see that the fiducial model sits in the middle of the distribution of observed SFRs of Bigiel et al. (2008). The effect of the SN-only model is shown by the orange arrow from NF. Overall it causes a similar reduction in SFR and increase in retained gas content as the sequence to the fiducial model.
Figure 10b shows similar results, but now for Region 1 (starburst conditions) and Region 2 (normal disk conditions) (see Fig. 8). Note, these regions were originally defined at 10 Myr in the simulations of Van Loo et al. (2013), and were also analyzed at this time in the MHD simulations of Van Loo et al. (2015). By 20 Myr, the nature of these regions, such as their gas content undergoes dramatic evolution. Thus we also analyze the properties of these regions at 10 Myr, i.e., the time at which is evaluated, with the SFR being the average from 5 to 10 Myr. We note that this means conditions in the ISM in these regions have not reached quasi-statistical equilibrium. However, on these scales of only several hundred parsecs, such equilibrium is in any case not likely to be achieved when averaging over 5 Myr timescales. Observationally, at these scales of several hundred parsec sided regions, a greater dispersion in the normalization of the Kennicutt-Schmidt relation has been reported (Leroy et al., 2013).
Region 2, which is 600 pc by 400 pc in extent and with average conditions quite similar to those of the kpc patch as a whole, shows qualitatively similar behavior. However, LW feedback is seen to play a relatively more important role here along the sequence to the fiducial model of LW+EUV+SN. The fiducial model rests at a location slightly elevated in its normalization compared to the median of the data, although still within the range of the observed scatter in the KS relation. Since Region 2 is centered on a GMC complex, this slight enhancement is also consistent with theoretical expectations, given the clustered nature of star formation in disk galaxies. In Region 2 the -field model also leads to a significant reduction in SFR, although not as much as that due to the fiducial feedback model. The SN-only feedback model is also not as effective as the full radiative feedback plus SN model in this case.
Region 1, centered on a very dense grouping of GMCs that are also interacting, shows very high SFR surface densities. The NF0 and NF models have , with the latter retaining a gas mass surface density of about at 10 Myr. LW feedback brings the SFR down by about a factor of five, with addition of ionization causing only a minor reduction beyond this. The final LW+EUV+SN model has its SFR reduced further by a factor of 10 to . However, note the largest reduction of SFR in absolute terms resulted at the stage of introduction of FUV dissociating feedback. The introduction of SN causes leads to a dramatic reduction in , i.e., by about a factor of three, which is caused by expulsion of gas from Region 1 to its immediate surroundings. This illustrates the inherent difficulties of measuring the KS relation on these small scales of several hundred parsecs. Still, the final location of Region 1 in the KS diagram for the fiducial model is at a normalization that is consistent with the upper envelope of the observational data, as might be expected for a starburst region.
Finally, we note that introduction of magnetic field support affects the SFR of Region 1 only by about a factor of two, a smaller factor than in Region 1 and in the kpc patch as a whole. This is because the dense GMCs in Region 1 would need stronger -field strengths to resist collapse to the same level as the lower density GMCs in the other parts of disk. SN-only feedback reduces SFRs by factors of a few and, like the case of LW+EUV+SN, expels most of the gas from the region. The final location of the SN-only model in the KS diagram is at a level that is about 10 times higher than the upper envelope of the observed data.
4. Discussion and Conclusions
We have found that the combined effects of dissociating, ionizing, and supernova feedback have a dramatic influence on the structure and star formation activity of the interstellar medium of a disk galaxy. The relative mass and volume fractions of different phases of the ISM approach quasi-static values after 20 Myr of evolution of the simulated kpc patch of the disk. The detailed structure of the ISM, especially dense, molecular clouds, and the spatial distribution of young stellar populations varies significantly with how feedback is implemented, as we have also seen in comparison to a supernova only feedback model.
Of the forms of feedback we have investigated in the sequence of building our fiducial model, it is the introduction of FUV radiation that dissociates molecules and heats the gas, which typically plays the largest role in reducing absolute SFRs from those seen in simulations with no feedback from the newly forming stars. These reduction factors are similar to those seen in models including magnetic support from an ISM magnetized at a level of . However, the full combination of radiative and mechanical feedback from supernovae of our fiducial model is needed to bring these overall star formation rates down to values similar to those observed in real disk systems. Averaged on kpc scales, the SFRs resulting from the SN-only feedback models are very similar to those achieved in our fiducial simulation, even though these involve large differences in the chemical and temperature structures of the gas and in the spatial distribution of young stars. Also, in smaller scale regions centered on GMC complexes, there are significant differences in the SFRs between the SN-only case and the full feedback model. These results illustrate the importance of considering FUV feedback in understanding the star formation activity of galactic disk systems. Similar conclusions have been reached by Peters et al. (2017) in their lower (4 pc) resolution studies of a smaller (0.5 kpc by 0.5 kpc) disk patch, which builds on the previous study of a stellar wind and supernova feedback model by Gatto et al. (2017).
The simulations presented in this paper of course have their limitations and there is scope for improvement, which may influence the final results. For example, it will be necessary to combine these feedback models with magnetized ISM simulations. Additional feedback effects such as protostellar outflows from forming stars, stellar winds and radiation pressure will also need to be considered. The momentum input from these sources can be comparable to that from supernovae, although in the case of outflows and winds much of this momentum may be lost in oppositely directed flows from a distributed population of stars. Also, initial test simulations including radiation pressure by Rosdahl et al., in prep., indicate that it plays a relatively minor role on the scale of this kpc patch. On smaller scales radiation pressure has been studied by, e.g., Krumholz & Matzner (2009) who find it can be important feedback in modifying HII region dynamics around massive star clusters. The contribution of relativistic cosmic rays, which are known to have a similar energy density to magnetic and thermal pressures in the local Galactic ISM, will also need to be included. To constrain these more complex models and their particular parameter choices against observed systems, we will also need to examine more detailed statistical metrics, e.g., of structural, kinematic and chemical properties of the ISM, in addition to SFR activity. Improved resolution down to the core scale of individual star formation is also highly desirable, especially for resolution of the early stages of ionizing feedback, which will then also necessitate a fully stochastic treatment of the initial stellar mass function of massive stars. On the other hand, the region we have simulated is relatively limited in spatial extent, which may lead to stochastic effects related to the particular GMCs that are included in the volume. Future work should also aim to expand the number of different realizations simulated, the size of the simulated volume and also explore the effects of a range of galactic environments.
References
- (1) Abel, T., Anninos, P., Zhang, Yu, Norman, M. L. 1997, New Astronomy, 2, 181-207
- (2) Agertz, O. et al. 2007, Monthly Notices of the Royal Astronomical Society, 380
- (3) Agertz, O. & Kratsov, A. V. 2015, The Astrophysical Journal, 804, 18
- (4) Bigiel, F. et al. 2008, The Astronomical Journal, 136, 2846-2871
- (5) Bryan, G. L. et al. 2014, The Astrophysical Journal Supplement, 211, 19
- (6) Bruzual, G. & Charlot, S. 2003, Monthly Notices of the Royal Astronomical Society, 344, 1000-1028
- (7) Butler, M. J. & Tan, J. C. 2012, The Astrophysical Journal, 754, 5
- (8) Butler, M. J., Tan, J. C. & Van Loo, S. 2015, The Astrophysical Journal, 805, 1
- (9) Chabrier, G. 2003, The Publications of the Astronomical Society of the Pacific, 115, 763-795
- (10) Da Rio, N., Tan, J. C. & Jaehnig, K. 2014, The Astrophysical Journal, 795, 55
- (11) Dove, J. E. & Mandy, M. E. 1986, The Astrophysical Journal Letters, 311, L93-L96
- (12) Draine, B. T. & Bertoldi, F. 1996, The Astrophysical Journal, 468, 269
- (13) Eyink, G. L., Lazarian, A. & Vishniac, E. T. 2011, The Astrophysical Journal, 743, 51
- (14) Falle, S. A. E. G., Hubber, D., Goodwin, S. & Boley, A. 2012, ASP Conference Series, 459, 298
- (15) Ferland, G. J. et al. 2013, Revista Mexicana de Astronomia y Astrofisica, 49, 137-163
- (16) Forbes, J. C., Krumholz, M. R., Goldbaum, N. J., & Dekel, A. 2016, Nature 535, 523-525
- (17) Gatto, A. et al. 2017, Monthly Notices of the Royal Astronical Society, 466, 1903-1924
- (18) Gnedin, N. Y. & Abel, T. 2011, New Astronomy, 6, 437-455
- (19) Habing, H. J. 1968, Bulletin of the Astronomical Institutes of the Netherlands, 19, 421
- (20) Hopkins, P. F., Keres, D., Murray, N., Quataert, E. & Hernquist, L. 2012, Monthly Notices of the Royal Astronomical Society, 427
- (21) Kennicutt, R. C. 1998, The Astrophysical Journal, 498, 541-552
- (22) Kim, C., Ostriker, E. C. & Kim, W. 2013, The Astrophysical Journal, 776, 1
- (23) Koda, J., Scoville, N. & Heyer, M. 2016, The Astrophysical Journal, 823, 2
- (24) Krumholz, M. R. & Tan, J.C. 2007, The Astrophysical Journal, 654, 304-315
- (25) Krumholz, M. R. & Matzner 2009, The Astrophysical Journal, 703, 2
- (26) Lazarian, A. & Vishniac, E. T. 1999, The Astrophysical Journal, 517, 700-718
- (27) Leroy, A. et al. 2008, The Astronomical Journal, 136, 2782-2845
- (28) Leroy, A. K. et al. 2013, The Astronomical Journal, 146, 2
- (29) McKee, C. F. & Ostriker, E.C. 2007, Annual Review of Astronomy & Astrophysics, 45, 565-687
- (30) Peters, T. et al. 2017 Monthly Notices of the Royal Astronomical Society, 466, 3293-3308
- (31) Rosdahl, J., Blaizot, J., Aubert, D., Stranex, T. & Teyssier, R. 2013, Monthly Notices of the Royal Astronomical Society, 436
- (32) Rosdahl, J., Schaye, J., Teyssier, R. & Agertz, O. 2015, Monthly Notices of the Royal Astronomical Society, 451, 34-58
- (33) Rosdahl, J. & Teyssier, R. 2015, Monthly Notices of the Royal Astronomical Society,449, 4
- (34) Tan, J. C. 2010, The Astrophysical Journal Letters, 710, L88-L91
- (35) Tan, J. C. et al. 2014, Protostars and Planets VI, Henrik Beuther, Ralf S. Klessen, Cornelis P. Dullemond, and Thomas Henning (eds.)
- (36) Tasker, E. J. & Tan, J. C. 2009, The Astrophysical Journal, 700, 358-375
- (37) Teyssier, R., Pontzen, A., Dubois, Y. & Read, J. 2013, Monthly Notices of the Royal Astronomical Society, 429, 3068-3078
- (38) Walch, S. et al. 2015, Monthly Notices of the Royal Astronomical Society, 454, 238-268
- (39) Wolfire, M. G., McKee, C. F., Hollenbach, D. & Tielens, A. G. G. M. 2003, The Astrophysical Journal, 587, 278-311
- (40) Van Loo, S., Butler, M. J. & Tan, J. C. 2013, The Astrophysical Journal, 764, 36
- (41) Van Loo, S., Tan, J. C. & Falle, S. A. E. G. 2015, The Astrophysical Journal Letters, 800, L11
- (42) Zuckerman, B. & Evans, N. J. 1974, The Astrophisical Journal, 192, L149-L152
- (43)