A search for water maser emission from brown dwarfs and low-luminosity young stellar objects
Abstract
We present a survey for water maser emission toward a sample of 44 low-luminosity young objects, comprising (proto-)brown dwarfs, first hydrostatic cores (FHCs), and other young stellar objects (YSOs) with bolometric luminosities lower than 0.4 L⊙. Water maser emission is a good tracer of energetic processes, such as mass-loss and/or accretion, and is a useful tool to study this processes with very high angular resolution. This type of emission has been confirmed in objects with L L⊙. Objects with lower luminosities also undergo mass-loss and accretion, and thus, are prospective sites of maser emission. Our sensitive single-dish observations provided a single detection when pointing toward the FHC L1448 IRS 2E. However, follow-up interferometric observations showed water maser emission associated with the nearby YSO L1448 IRS 2 (a Class 0 protostar of L L⊙), and did not find any emission toward L1448 IRS 2E. The upper limits for water maser emission determined by our observations are one order of magnitude lower than expected from the correlation between water maser luminosities and bolometric luminosities found for YSOs. This suggests that this correlation does not hold at the lower end of the (sub)stellar mass spectrum. Possible reasons are that the slope of this correlation is steeper at L L⊙, or that there is an absolute luminosity threshold below which water maser emission cannot be produced. Alternatively, if the correlation still stands at low luminosity, the detection rates of masers would be significantly lower than the values obtained in higher-luminosity Class 0 protostars.
1 Introduction
Water maser emission is present in different astrophysical environments, such as young stellar objects (YSOs), evolved stars, and active galactic nuclei (Elitzur, 1992; Lo, 2005). The most widely studied water maser transition is the one at 22 GHz, which has proved to be a very powerful tool to study these environments, since interferometric observations (in particular using Very Long Baseline Interferometry, VLBI) allow us to reach angular resolutions better than 1 milliarcsec (e.g., Torrelles et al., 2001, 2014; Yung et al., 2011). Thus, we can study processes and structures in these sources with a level of detail unsurpassed by any other technique in Astronomy.
Focusing on the case of water maser emission toward YSOs, we know that it is intense and widespread over a wide range of stellar masses (e.g., Claussen et al., 1996; Forster & Caswell, 1999; Furuya et al., 2003; Breen et al., 2010). Interferometric observations reveal a dichotomy in the distribution of water masers in YSOs: while in some sources this type of emission traces collimated jets, in others it traces protoplanetary disks (e.g., Torrelles et al., 1997, 1998). This is important, since the presence of disks and collimated outflows are key ingredients in the formation of stars via accretion. In low-mass ( M⊙) YSOs, water maser emission is consistently found associated with sources in the earliest evolutionary stages. Among objects in the classical evolutionary classes defined by Lada (1987) and André et al. (1993), Furuya et al. (2001) estimated detection rates of % in Class 0 objects, 4% in Class I, and 0% in Class II ones. This is understandable, because water masers are thought to be collisionally pumped in post-shock regions (Elitzur et al., 1989; Yates et al., 1997). The youngest YSOs seem to be the ones with more powerful collimated mass outflows (Bontemps et al., 1996; Dionatos et al., 2010; Podio et al., 2012; Watson et al., 2016), which can create shocked regions as they move through the ambient molecular cloud. They also undergo intense accretion (Henriksen et al., 1997), which could pump maser emission in disks.
Collimated outflows and accretion processes are present in YSOs with extremely low mass, and even in substellar objects. Spitzer data revealed the presence of a new class of objects (Young et al., 2004; Kauffmann et al., 2005) named “Very Low Luminosity Objects” (VeLLO). These are objects embedded in dense cores, with internal luminosities L⊙. Some of these objects show Herbig-Haro (HH) emission (Stecklum et al., 2007b; Comerón & Reipurth, 2006) and bipolar molecular outflows (André et al., 1999; Bussmann et al., 2007), which are classical signposts of mass-loss processes in higher-mass YSOs. Moreover, even for brown dwarfs (BDs) there is mounting evidence of the presence of accretion (e.g., Muzerolle et al., 2000; Comerón et al., 2000; Fernández & Comerón, 2001; Barrado y Navascués & Martín, 2003; Luhman et al., 2003; Alcalá et al., 2014), outflows (Whelan et al., 2005, 2007; Palau et al., 2014; Morata et al., 2015), and disks (Natta & Testi, 2001; Barrado y Navascués et al., 2007; Scholz & Jayawardhana, 2008; Downes et al., 2015; Testi et al., 2016). This evidence suggests that the formation of VeLLOs and BDs takes place in a similar way to solar-type stellar objects. Then, we see that the structures and processes that give rise to water maser emission (accretion/outflows) are also present in these very low mass objects, so it is possible that they also harbor water masers. The difference may be that the water maser emission could be weaker, as it happens when we compare low- and high-mass YSOs (Claussen et al., 1996; Furuya et al., 2001). The energy output in mass-loss processes decreases with stellar luminosity (Anglada, 1995), so there may be a mass limit below which maser emission cannot be produced. So far, the lowest-luminosity YSOs reported to possibly harbor a water maser is GF 9-2 ( L⊙; Furuya et al., 2003). Extending this to lower luminosity objects would allow us to study mass-loss processes and accretion disks at the low luminosity end of the mass spectrum.
Another important category of low-luminosity objects are first hydrostatic cores (FHCs; Larson, 1969). These represent the first stage of the evolution of protostars, immediately before dissociation of molecular hydrogen and the subsequent formation of a Class 0 protostar. Some of these FHCs show evidence for collimated outflows (e.g., Chen et al., 2010), and therefore, they might also harbor water masers. Given that a large fraction of Class 0 protostars are water-maser emitters, a search toward the earlier FHC phase would establish the starting point of maser emission in low-mass YSOs.
In this paper we present a search for water maser emission toward a sample of low luminosity YSOs and substellar objects, to investigate whether their mass-loss processes are energetic enough to power water maser emission. As a longer term goal, the identification of water-maser emitters among these objects would allow us to design VLBI observations to study mass-loss processes in very low luminosity objects at the smallest possible spatial scales.
2 Source sample
We compiled 44 sources with declination , reported in the literature with L⊙, and/or M⊙, with the main requirement that they show evidence of outflow/accretion and/or signs of youth (e.g., excess emission at millimeter wavelengths).
The sample of 44 sources comprises four groups: i) 20 young BDs; ii) 6 VeLLOs; iii) 7 FHCs; iv) 11 low luminosity objects (LLOs) with and/or , not included in any of the groups above.
BDs with signs of youth were taken from different samples: young BDs (most of them Class II objects) detected at 1.3 mm by Klein et al. (2003) and Scholz & Jayawardhana (2006); the three young substellar objects classified by White & Hillenbrand (2004) in a spectroscopic optical study of Class I young stellar objects in Taurus-Auriga; Class I BD candidates proposed by Palau et al. (2012) and Morata et al. (2015) using submillimeter and centimeter observations; and Class 0 proto-BD presented in Palau et al. (2014). Regarding VeLLOs and FHCs, we took sources from the compilation of Palau et al. (2014), as well as the globule CB 130, which host several FHC candidates (Kim et al., 2011).
The rest of LLOs were selected from the sources in the Muzerolle et al. (2003) sample with stellar masses M⊙, and estimated ages Myr, with the exception of CIDA 14, which is reported to have M⊙ by Briceño et al. (1999). It is interesting to note that three out of the five selected sources from Muzerolle et al. (2003) present signs of outflow activity from [OI] lines. We also included individual targets which were confirmed to be deeply embedded and of very low mass, such as the detections by Klein et al. (2003), L1415-IRS, a highly variable source (FU Ori-like object) with only 0.13 L⊙, which is also driving HH emission (Stecklum et al., 2007a, 2007b), the triple system IRAS 04325+2402AB/C, first reported by Hartmann et al. (1999), where one of the components could be substellar and driving an outflow (Scholz & Jayawardhana, 2008; Scholz et al., 2010), and IRAS 04166+2706, a 0.4 L⊙ source driving an extremely high-velocity and highly collimated outflow (e.g., Tafalla et al., 2004; Santiago-García et al., 2009; Wang et al., 2014). We also included two low-mass dense cores reported by Codella et al. (1997), associated with infrared (IRAS) or submillimeter sources (Di Francesco et al., 2008).
3 Observations
3.1 Effelsberg
Single-dish observations were carried out with the 100-m Effelsberg radio telescope of the Max-Planck-Institut für Radioastronomie, between 2015 September 29 and 2015 October 3 (observational project 14-14). We used the S14mm receiver, and tuned it to observe the transition of the H2O molecule (rest frequency 22235.08 MHz). The full width at half maximum (FWHM) of the telescope beam at this frequency is . The backend was the Fast Fourier Transform Spectrometer (XFFT), with a bandwidth of 100 MHz (total velocity coverage of 1348 km s-1) sampled over 32768 channels, providing an effective spectral resolution of 3.5 kHz (0.047 km s-1). For all sources, the spectral bandpass was centered at a velocity with respect to the local standard of rest (kinematical definition, ) of zero. We checked the pointing accuracy of the telescope at least once every hour using nearby calibrators. The rms pointing accuracy was better than . We observed in position switching mode, alternating on- and off-source scans of 60 seconds each. Each source was typically observed for a total time (on+off) of 30 minutes, although integrations were longer in some cases (e.g., for targets at low elevation). Data were processed with the Continuum and Line Analysis Single-dish Software (CLASS), which is part of the GILDAS111http://www.iram.fr/IRAMFR/GILDAS package of the Institut de Radioastronomie Milimétrique. The spectra were corrected by the elevation-dependent gain of the telescope and by atmospheric opacity, and were Hanning-smoothed to obtain a final spectral resolution of 0.33 km s-1. Table 3.1 lists the observed positions and the resulting rms of the spectra, which is of the order of 20 mJy in all cases. Note that some sources were observed in different epochs. Given the usually high variability of water masers, we did not average the data of different days, but present the results of the observations of each day individually. Moreover, although our target list comprised 44 sources, only 42 positions were observed, since in the B1 and CB130 fields, the Effelsberg beam included two sources.
| Target name | R.A. (J2000) | Dec. (J2000) | rms | Date | TypeaaType of object. BD: (proto-)brown dwarf. FHC: First hydrostatic core. VeLLO: Very low luminosity object. LLO: Other low-luminosity YSO. The evolutionary class of the object is indicated by 0, I, II (for Class 0, I, and II objects, respectively). | References | |
|---|---|---|---|---|---|---|---|
| (mJy) | () | ||||||
| L1451-mm | 03:25:10.25 | +30:23:55.0 | 21 | 2015-SEP-29 | FHC | 0.05 | 1 |
| L1448 IRS 2E | 03:25:25.52 | +30:45:02.5 | 16 | 2015-SEP-29 | FHC | 2 | |
| 14 | 2015-OCT-03 | ||||||
| Per-Bolo 58 | 03:29:25.40 | +31:28:15.0 | 18 | 2015-OCT-01 | FHC | 0.18 | 3,4 |
| B1-b fieldbbThe B1-b field includes 2 candidate FHCs within the telescope beam: HKM99 B1-bS and HKM99 B1-bN (see Hirano et al., 1999). | 03:33:21.25 | +31:07:35.0 | 19 | 2015-SEP-30 | FHC | 0.15–0.31 | 5,6,7 |
| IC 348-SMM2E | 03:43:57.73 | +32:03:10.1 | 18 | 2015-SEP-30 | BD-0 | 0.10 | 8 |
| 20 | 2015-OCT-03 | ||||||
| IC 348-173 | 03:44:09.98 | +32:04:05.4 | 18 | 2015-OCT-01 | LL0-I | 0.11 | 9 |
| IC 348-613 | 03:44:26.90 | +32:09:25.0 | 19 | 2015-SEP-30 | BD-I | 0.002 | 10,11,12 |
| IC 348-205 | 03:44:29.54 | +32:00:53.2 | 18 | 2015-OCT-02 | LLO-I | 0.08 | 9,13 |
| IC 348-382 | 03:44:30.78 | +32:02:42.9 | 27 | 2015-OCT-03 | LLO-I | 0.012 | 9,13 |
| IC 348-165 | 03:44:35.43 | +32:08:54.4 | 26 | 2015-OCT-03 | LLO-I | 0.10 | 9,13 |
| SSTB213 J041726.38+273920.0 | 04:17:26.38 | +27:39:20.0 | 18 | 2015-OCT-01 | BD-I | 14,15 | |
| SSTB213 J041740.32+282415.5 | 04:17:40.32 | +28:24:15.5 | 17 | 2015-OCT-01 | BD-I | 14,15 | |
| SSTB213 J041757.75+274105.5 | 04:17:57.77 | +27:41:05.0 | 17 | 2015-OCT-01 | BD-I | 14,15,16 | |
| SSTB213 J041828.08+274910.9 | 04:18:28.08 | +27:49:10.9 | 18 | 2015-OCT-01 | BD-I | 14,15 | |
| SSTB213 J041836.33+271442.2 | 04:18:36.33 | +27:14:42.2 | 18 | 2015-OCT-01 | BD-I | 14,15 | |
| SSTB213 J041847.84+274055.3 | 04:18:47.84 | +27:40:55.3 | 17 | 2015-OCT-01 | BD-I | 14,15 | |
| KPNO-Tau 2 | 04:18:51.16 | +28:14:33.2 | 17 | 2015-OCT-01 | BD-II | 13,17,18 | |
| IRAS 04158+2805 | 04:18:58.14 | +28:12:23.5 | 21 | 2015-SEP-30 | BD-I | 0.4 | 19,20,21 |
| SSTB213 J041913.10+274726.0 | 04:19:13.10 | +27:47:26.0 | 16 | 2015-OCT-01 | BD-I | 14,15 | |
| SSTB213 J041938.77+282340.7 | 04:19:38.77 | +28:23:40.7 | 19 | 2015-OCT-02 | BD-I | 14,15 | |
| IRAS 04166+2706 | 04:19:42.50 | +27:13:40.0 | 27 | 2015-OCT-02 | LLO-0 | 22,23,24,25 | |
| L1521D | 04:21:03.55 | +27:02:48.4 | 28 | 2015-OCT-03 | LLO | 0.3 | 26 |
| SSTB213 J042019.20+280610.3 | 04:20:19.20 | +28:06:10.3 | 18 | 2015-OCT-02 | BD-I | 14,15 | |
| SSTB213 J042118.43+280640.8 | 04:21:18.43 | +28:06:40.8 | 18 | 2015-OCT-02 | BD-I | 14,15 | |
| IRAM 04191+1522 | 04:21:56.91 | +15:29:45.9 | 20 | 2015-SEP-30 | VeLLO-0 | 0.15 | 27,28,29,30 |
| IRAS 04248+2612 | 04:27:57.33 | +26:19:18.1 | 19 | 2015-SEP-30 | BD-I | 0.4 | 20 |
| L1521F-IRS | 04:28:38.95 | +26:51:35.1 | 19 | 2015-OCT-02 | VeLLO-0/I | 30,31 | |
| MHO 5 | 04:32:16.00 | +18:12:46.0 | 18 | 2015-SEP-30 | LLO-I | 0.066 | 9,13,32 |
| IRAS 04325+2402 A/B | 04:35:35.37 | +24:08:19.5 | 18 | 2015-OCT-02 | LLO-I | 0.7 | 33,34,35,36,37 |
| 2MASS J04381486+2611399 | 04:38:14.86 | +26:11:39.9 | 17 | 2015-SEP-30 | BD-II | 17,18,38 | |
| 2MASS J04390396+2544264 | 04:39:03.96 | +25:44:26.4 | 19 | 2015-SEP-30 | BD-II | 0.019 | 17,18,32 |
| CFHT-BD-Tau 4 | 04:39:47.30 | +26:01:39.0 | 19 | 2015-OCT-02 | LLO-II | 12,13,18,39,40 | |
| L1415-IRS | 04:41:35.87 | +54:19:11.7 | 18 | 2015-OCT-01 | LLO-I | 0.13 | 41,42 |
| 2MASS J04414825+2534304 | 04:41:48.25 | +25:34:30.5 | 19 | 2015-SEP-30 | BD-II | 0.009 | 17,18,32 |
| L1507A | 04:42:38.59 | +29:43:55.3 | 18 | 2015-OCT-02 | LLO | 26 | |
| 2MASS J04442713+2512164 | 04:44:27.13 | +25:12:16.4 | 19 | 2015-SEP-30 | BD-II | 0.028 | 18,43 |
| IRAS 04489+3042 | 04:52:06.68 | +30:47:17.5 | 17 | 2015-OCT-01 | BD-I | 0.3 | 19,20 |
| CB130-1 fieldccThe CB130-1 field includes 2 candidate FHCs within the telescope beam: KED2011 CB130-1-IRS1 and KED2011 CB130-1-IRS2. | 18:16:16.90 | :32:38.0 | 25 | 2015-SEP-30 | FHC | 0.071-0.23 | 44 |
| 24 | 2015-OCT-01 | ||||||
| L328-IRS | 18:17:00.40 | :01:52.0 | 24 | 2015-SEP-30 | VeLLO-0 | 0.14 | 45,46 |
| 19 | 2015-OCT-01 | ||||||
| L673-7-IRS | 19:21:34.80 | +11:21:23.0 | 15 | 2015-SEP-29 | VeLLO-0 | 0.18 | 47,48,49 |
| L1148-IRS | 20:40:56.59 | +67:23:05.3 | 14 | 2015-SEP-30 | VeLLO-0 | 0.12 | 50 |
| L1014-IRS | 21:24:07.55 | +49:59:09.0 | 21 | 2015-SEP-30 | VeLLO-I/II | 0.15 | 51,52 |
| 17 | 2015-OCT-01 |
References. — (1) Pineda et al. (2011); (2) Chen et al. (2010); (3) Enoch et al. (2010); (4) Dunham et al. (2011); (5) Pezzuto et al. (2012); (6) Huang & Hirano (2013); (7) Hirano & Liu (2014); (8) Palau et al. (2014); (9) Muzerolle et al. (2003); (10) Luhman (1999); (11) Preibisch & Zinnecker (2001); (12) Klein et al. (2003); (13) Mohanty et al. (2005); (14) Palau et al. (2012); (15) Morata et al. (2015); (16) Barrado et al. (2009); (17) Muzerolle et al. (2005); (18) Scholz & Jayawardhana (2006); (19) Motte & André (2001); (20) White & Hillenbrand (2004); (21) Andrews et al. (2008); (22) Shirley et al. (2000); (23) Young et al. (2003); (24) Tafalla et al. (2004); (25) Froebrich (2005); (26) Codella et al. (1997); (27) André et al. (1999); (28) Belloche et al. (2002); (29) Dunham et al. (2006); (30) Young et al. (2006); (31) Bourke et al. (2006); (32) Phan-Bao et al. (2011); (33) Ungerechts et al. (1982); (34) Hartmann et al. (1999); (35) Wang et al. (2001); (36) Güdel et al. (2007); (37) Scholz et al. (2010); (38) Luhman et al. (2007); (39) Martín et al. (2001); (40) Pascucci et al. (2003); (41) Stecklum et al. (2007a); (42) Stecklum et al. (2007b); (43) Bouy et al. (2008); (44) Kim et al. (2011); (45) Lee et al. (2009); (46) Lee et al. (2013); (47) Kauffmann et al. (2008); (48) Dunham et al. (2010); (49) Schwarz et al. (2012); (50) Kauffmann et al. (2011); (51) Bourke et al. (2005); (52) Maheswar et al. (2011).
3.2 Very Large Array
Prompted by a detection in our single-dish observations, we observed a field centered at source L1448 IRS 2E with the Karl G. Jansky Very Large Array (VLA) of the National Radio Astronomy Observatory on 2015 October 14 (project 15B-366). The array was in its D configuration. A baseband centered at 22 GHz was observed with an 8-bit sampler (for a high spectral resolution). Within this baseband, a subband of 8 MHz was used to observe the water maser line and Doppler tracking was applied, centering the subband at a frequency corresponding to km s-1. This subband was sampled over 2048 channels, thus providing a velocity coverage and resolution of 108 and 0.052 km s-1, respectively. Seven subbands of 128 MHz each were also observed in this 8-bit baseband, covering a total of 896 MHz for radio continuum. In addition, two basebands, centered at 23.45 and 25.45 were also observed with 3-bit samplers. Each of these basebands was covered by 16 subbands of 128 MHz. Therefore, the combined coverage for radio continuum data provided by the three observed basebands was 3.67 GHz, centered at 23.98 GHz.
Sources J0319+4130 (3C 84), J0137+331 (3C 48), and J0336+3218 (4C 32.14) were used to calibrate the spectral bandpass response, the absolute flux scale, and the complex gain (phase and amplitude), respectively. Calibration, imaging, and further processing was carried out with the Common Astronomy Software Applications (CASA) package. All maps were obtained with a Briggs weighting of visibilities (with robust=0.5 in task clean of CASA), and deconvolved with the CLEAN algorithm. In the case of radio continuum emission, multifrequecy synthesis was used to obtain the maps. The resulting FWHM of the synthesized beams were (p.a. ) for the water maser images, and (p.a. ) for the continuum images. The final images have been corrected by the primary beam response of the VLA. The absolute positional accuracy of our interferometric observations was .
4 Results
In our single-dish observations, we only detected maser emission toward the position of L1448 IRS 2E (Fig. 1) on 2015 September 29. It only shows one clear spectral component of flux density mJy at km s-1. This source has been classified as a FHC by Chen et al. (2010).

However, our follow-up VLA observations shows that the maser emission is located at RA(J2000) = , Dec(J2000) = . This position is away from L1448 IRS 2E and is coincident with L1448 IRS 2 instead. The VLA spectrum is presented in Fig. 2. It shows a spectral component of flux density mJy at km s-1. The peak velocity of the emission is redshifted by km s-1 with respect to the peak measured in our single-dish spectrum. We think that the most likely situation is that the emission detected both with Effelsberg and the VLA arises from L1448 IRS 2. Assuming this is the case, we estimated the expected flux density in our single-dish observations, taking into account the FWHM of the Effelsberg beam (), and the distance between L1448 IRS 2 and our observed position (). For a source flux density of 460 mJy (Fig. 2), the flux density in the Effelsberg spectrum should have been mJy. This is consistent with the non-detection on our second single-dish spectrum, taken on 2015-10-03 (Fig. 1). Our spectrum on 2015-09-29 is a factor of 4 brighter than our expectation, and it would indicate a decrease in the water maser emission over the time span of 15 days covered by our data. However, although unlikely, we cannot discard that L1448 IRS 2E (or other nearby source) was the emitting source of the spectrum in Fig. 1) and it faded over the following days. In any case, what is relevant for our work is that there is no confirmation that the FHC L1448 IRS 2E is a water-maser emitter. In these VLA observations, the upper limit for water maser emission toward L1448 IRS 2E is 14 mJy, after Hanning-smoothing the VLA data up to a velocity resolution of 0.21 km s-1.

On the other hand L1448 IRS 2 is a Class 0 protostar with a luminosity (O’Linger et al., 1999; Tobin et al., 2015). Ours is the first reported detection of a water maser in this object. Furuya et al. (2003) and Sunada et al. (2007) reported non-detections toward this source, with rms levels of 80 and 170 mJy, respectively.
We detected two unresolved radio continuum sources with the VLA (Fig. 3), which correspond to sources VLA 3 and VLA 4 detected by Anglada & Rodríguez (2002) at 3.6 cm. We detected source VLA 3 (the northern one in the image) at RA(J2000) , Dec(J2000) with a flux density mJy. Its flux density is higher at lower frequencies (e.g., mJy at 3.6 cm, Anglada & Rodríguez, 2002), confirming the presence of non-thermal emission, which suggests that this is a background source (Anglada & Rodríguez, 2002), unrelated with this star-forming region.
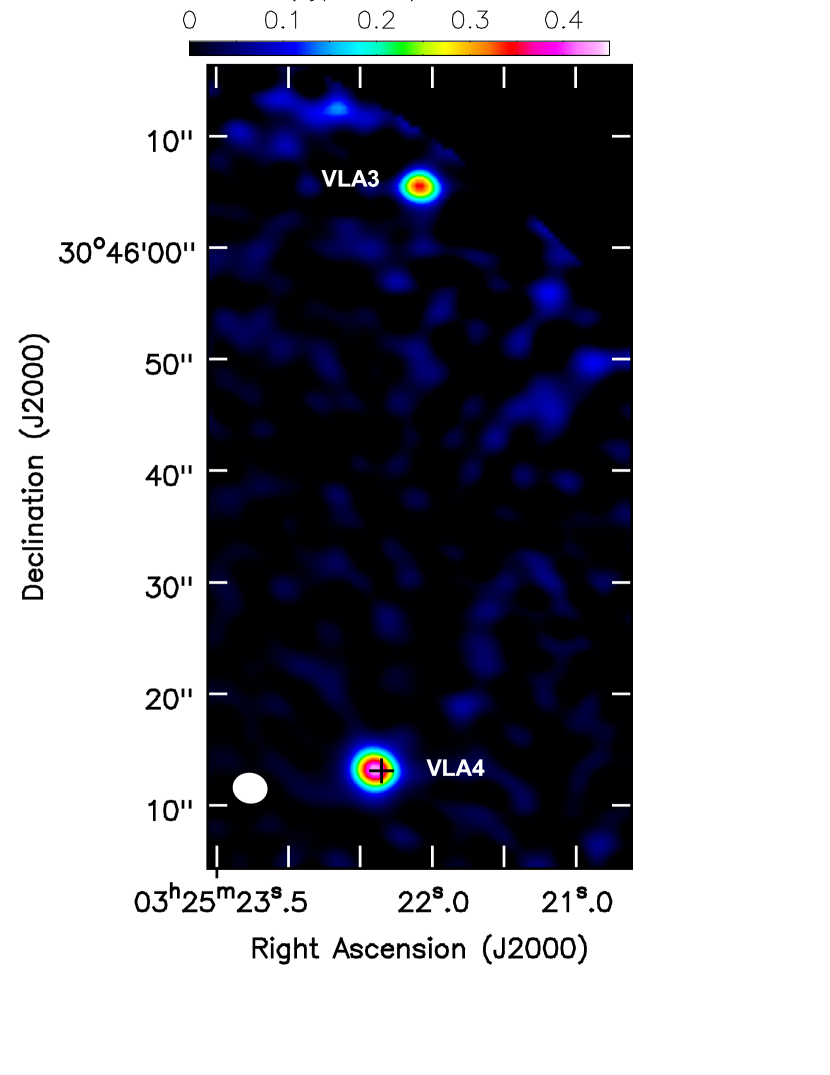
The southern source is located at RA(J2000) , Dec(J2000) and it has a flux density mJy. This is source VLA 4 ( at 3.6 cm, Anglada & Rodríguez, 2002), which is the radio counterpart of the infrared source L1448 IRS 2. Fig. 3 clearly shows that the water maser emission is associated with this radio source. Tobin et al. (2015) resolved the radio emission from L1448 IRS 2 into a binary, with a separation between components of arcsec. We cannot resolve this binary in our radio continuum maps, but we note that the position of the maser emission is closer to component B. This is the weaker radio source of the two components, but it has a steeper radio spectral index, which would indicate that its free-free emission is optically thicker. It could be the younger of the two components and its association with water maser emission indicates that it is undergoing energetic mass-loss.
5 Discussion
We did not detect any water maser emission in our sample of low luminosity objects. This is in contrast with the high detection rates (% in Class 0 YSOs, Furuya et al., 2001) in objects with higher masses. An important question is whether shocks related to mass-loss processes in these extremely low luminosity objects are energetic enough to produce water maser emission. The observations presented here are sensitive enough to impose significant constraints on our sample, to determine whether there is a lower limit on the stellar luminosity of sources capable to excite this type of emission.
Previous water maser surveys established an empirical relationship between the stellar luminosity and the water maser luminosity (e.g., Brand et al., 2003; Shirley et al., 2007). For instance, Shirley et al. (2007) give . A correlation between the maximum velocity spread of the spectral components of the maser emission and the maser luminosity has also been found (Brand et al., 2003). Assuming a 3- upper limit to the flux density of the water maser emission in our sample of mJy (since the rms was typically mJy, Table 3.1), and an upper limit to the velocity spread of masers of km s-1 (similar to that found in source GF 9-2, with 0.3 , Furuya et al., 2003), we obtain upper limits for the maser luminosity of our sample of for sources in Perseus (assuming a distance of 232 pc, Hirota et al., 2011) and for those in Taurus (distance 137 pc, Torres et al., 2007). Most of our sources are in those two complexes (those with right ascension between 3 and 5 hours).
If the empirical relationship by Shirley et al. (2007) stands for the sources in our sample, our observations should have enough sensitivity to detect water masers from sources with in Perseus and Taurus. This is illustrated in Fig. 4, where we show the upper limits obtained in our observations for the water maser luminosity in FHC and Class-0 YSOs and BDs, together with the extrapolation to low luminosities of the empirical correlation by Shirley et al. (2007). We also show in this figure the upper limits to maser luminosity for other two sources with L⊙ (L1014-IRS and GF 9-2; Shirley et al., 2007, Manjarrez et al. in preparation). Although this empirical relationship has a large scatter, the upper limits in luminosity for all sources fall systematically below the empirical prediction by around one order of magnitude. The same happens with Class I and II sources in our sample, but we did not plot them in this figure because these more evolved objects have a much lower probability of pumping maser emission (Furuya et al., 2001).
If the empirical relationship between stellar and maser luminosities is still valid at L⊙ and the detection rates were similar to the ones found in other low-mass Class 0 protostars (%), we should have detected some water masers. So either premise is not correct. The first possibility (that the empirical relationship between stellar and maser luminosities does not hold at the lowest end of the mass spectrum) would mean that the relationship is steeper for the lowest-luminosity objects, and the maser luminosities in objects L⊙ are lower than predicted by the empirical relationship (see Fig. 4 in this paper and Fig. 3 in Shirley et al., 2007). It is even possible that there is a strict threshold in luminosity below which, we cannot detect masers. The second possibility is that the relationship does stand at low luminosities, but the detection rates of masers are significantly lower than the values obtained in higher-luminosity Class 0 protostars, and even though the maser emission from these sources may eventually be above our detection threshold, it is excited during very short periods of time and we missed them. With our data it is not possible to discern between these possibilities. A further monitoring of these sources in our sample would help us to determine whether our failing to detect maser emission is due to a significant decrease of detection rates.

If a luminosity threshold exists, its value is still uncertain. As mentioned above, the lowest-luminosity object that has been reported to harbor a water maser is GF 9-2 (L L⊙ Furuya et al., 2003). However, this detection was obtained with the Nobeyama single-dish radio telescope in 2000 April, and has never been confirmed with interferometric observations. VLA observations carried out in 2008 August by Manjarrez et al (in preparation) failed to detect any water maser emission within of GF 9-2, with a 3 upper limit of 5 mJy, a factor lower than the flux density of reported by Furuya et al. (2003). Since the beam size of the Nobeyama telescope at 22 GHz () is smaller than the VLA primary beam (), we can be certain the emission detected in 2000 faded away by 2008. While it is certainly possible that GF 9-2 was the water-maser emitting source in 2000, we cannot discard that the emission arose from another nearby source, as in the case of L1448 IRS 2E in this paper. To our knowledge, the lowest luminosity YSO in which water maser emission has been confirmed with interferometric observations is VLA 1623 (Furuya et al., 2003), with a bolometric luminosity of L⊙.
6 Conclusions
We have carried out a sensitive single-dish survey (using the Effelsberg Radio Telescope) for water maser emission toward a sample of low-luminosity objects, comprising 20 young BDs, 7 FHCs, 6 VeLLOs, and 11 additional YSOs with L L⊙ and/or M⊙. We only detected water maser emission when pointing towards L1448 IRS 2E, a FHC. However, follow-up interferometric observations with the VLA did not confirm the presence of water maser emission associated with this source. Instead, we found water maser emission associated with the Class-0 YSO L1448 IRS 2. This is the first reported detection of water maser emission toward this source.
If we extrapolate to low luminosities the known correlation between bolometric luminosity and water maser luminosities, established for sources with L⊙, we found that the expected water maser luminosities are one order of magnitude higher than the upper limits obtained in our survey for FHC and Class-0 objects. Possible explanations are that the vs relationship does not extend to the lower-end of the sub(stellar) mass spectrum (either its slope is steeper at low luminosities or there is a luminosity threshold below which water maser cannot be excited), or that the detection rates of water maser emission is lower than the values obtained for higher-luminosity Class 0 YSOs (40%).
References
- Alcalá et al. (2014) Alcalá, J. M., et al. 2014, A&A, 561, A2
- André et al. (1999) André, P., Motte, F., & Bacmann, A. 1999, ApJ, 513, L57
- André et al. (1993) André, P., Ward-Thompson, D., & Barsony, M. 1993, ApJ, 406, 122
- Andrews et al. (2008) Andrews, S. M., Liu, M. C., Williams, J. P., & Allers, K. N. 2008, ApJ, 685, 1039
- Anglada (1995) Anglada G. 1995, RMxAC, 1, 67
- Anglada & Rodríguez (2002) Anglada G., & Rodríguez L. F. 2002, Rev. Mexicana Astron. Astrofis., 38, 13
- Barrado et al. (2009) Barrado, D., Morales-Calderón, M., Palau, A., et al. 2009, A&A, 508, 859
- Barrado y Navascués & Martín (2003) Barrado y Navascués D., & Martín E. L. 2003, AJ, 126, 2997
- Barrado y Navascués et al. (2007) Barrado y Navascués, D., Stauffer, J. R., Morales-Calderón, M., et al. 2007, ApJ, 664, 481
- Belloche et al. (2002) Belloche, A., André, P., Despois, D., & Blinder S. 2002, A&A, 393, 927
- Bontemps et al. (1996) Bontemps, S., André, P., Terebey, S., & Cabrit, S. 1996, A&A, 311, 858
- Bourke et al. (2005) Bourke, T. L., Crapsi, A., Myers, P. C., et al. 2005, ApJ, 633, L129
- Bourke et al. (2006) Bourke, T. L., Myers, P. C., Evans, N. J., II, et al. 2006, ApJ, 649, L37
- Bouy et al. (2008) Bouy, H., Huélamo, N., Pinte, C., et al. 2008, A&A, 486, 877
- Brand et al. (2003) Brand, J., Cesaroni, R., Comoretto, G., et al. 2003, A&A, 407, 573
- Breen et al. (2010) Breen, S. L., Caswell, J. L., Ellingsen, S. P., & Phillips, C. J. 2010, MNRAS, 406, 1487
- Briceño et al. (1999) Briceño, C., Calvet, N., Kenyon, S., & Hartmann, L. 1999, AJ, 118, 1354
- Bussmann et al. (2007) Bussmann, R. S., Wong, T. W., Hedden, A. S., Kulesa, C. A., & Walker, C. K. 2007, ApJ, 657, L33
- Chen et al. (2010) Chen, X., Arce, H. G., Zhang, Q., et al. 2010, ApJ, 715, 1344
- Claussen et al. (1996) Claussen, M. J., Wilking, B. A., Benson, P. J., el al. 1996, ApJS, 106, 111
- Codella et al. (1997) Codella, C., Welser, R., Henkel, C., & Benson, P. J., Myers, P. C., 1997, A&A, 324, 203
- Comerón et al. (2000) Comerón, F., Neuhäuser, R., & Kaas, A. A. 2000, A&A, 359, 269
- Comerón & Reipurth (2006) Comerón, F., & Reipurth, B. 2006, A&A, 458, L21
- Di Francesco et al. (2008) Di Francesco, J., Johnstone, D., Kirk, H., MacKenzie, T., & Ledwosinska, E. 2008, ApJS, 175, 277
- Dionatos et al. (2010) Dionatos, O., Nisini, B., Codella, C., & Giannini, T. 2010, A&A, 523, A29
- Downes et al. (2015) Downes, J. J., Román-Zúñiga, C., Ballesteros-Paredes, J., et al. 2015, MNRAS, 450, 3490
- Dunham et al. (2011) Dunham, M. M., Chen, X., Arce, H. G., et al. 2011, ApJ, 742, 1
- Dunham et al. (2006) Dunham, M. M., Evans, N. J., II, Bourke, T. L., et al. 2006, ApJ, 651, 945
- Dunham et al. (2010) Dunham, M. M., Evans, N. J., Bourke, T. L., et al. 2010, ApJ, 721, 995
- Elitzur (1992) Elitzur, M., 1992, ARA&A, 30, 75
- Elitzur et al. (1989) Elitzur, M., Hollenbach, D. J., & McKee, C. F. 1989, ApJ, 346, 983
- Enoch et al. (2010) Enoch, M. L., Lee, J.-E., Harvey, P., Dunham, M. M., & Schnee, S. 2010, ApJ, 722, L33
- Fernández & Comerón (2001) Fernández, M., & Comerón, F. 2001, A&A, 380, 264
- Forster & Caswell (1999) Forster, J. R., & Caswell, J. L. 1999, A&AS, 137, 43
- Froebrich (2005) Froebrich, D. 2005, ApJS, 156, 169
- Furuya et al. (2001) Furuya, R. S., Kitamura, Y., Wootten, H. A., Claussen, M. J., & Kawabe, R. 2001, ApJ, 559, L143
- Furuya et al. (2003) Furuya, R. S., Kitamura, Y., Wootten, A., Claussen, M. J., Kawabe, R. 2003, ApJS, 144, 71
- Güdel et al. (2007) Güdel, M., Briggs, K. R., Arzner, K., et al. 2007, A&A, 468, 353
- Hartmann et al. (1999) Hartmann, L., Calvet, N., Allen, L., Chen, H., & Jayawardhana, R. 1999, AJ, 118, 1784
- Henriksen et al. (1997) Henriksen, R., André, P., & Bontemps, S. 1997, A&A, 323, 549
- Hirano et al. (1999) Hirano, N., Kamazaki, T., Mikami, H., Ohashi, N., & Umemoto T. 1999, in Nakamoto, T., ed. Proc. of Star Formation 1999, Nobeyama Radio Obs., 181
- Hirano & Liu (2014) Hirano, N., & Liu, F.-C., 2014, ApJ, 789, 50
- Hirota et al. (2011) Hirota, T., Honma, M., Imai, H., et al. 2011, PASJ, 63, 1
- Huang & Hirano (2013) Huang, Y.-H., & Hirano, N., 2013, ApJ, 766, 131
- Kauffmann et al. (2008) Kauffmann, J., Bertoldi, F., Bourke, T. L., Evans, N. J., II, & Lee, C. W. 2008, A&A, 487, 993
- Kauffmann et al. (2011) Kauffmann, J., Bertoldi, F., Bourke, T. L., et al. 2011, MNRAS, 416, 2341
- Kauffmann et al. (2005) Kauffmann, J., Bertoldi, F., Evans, N. J., II, & C2D Collaboration 2005, Astronomische Nachrichten, 326, 878
- Kim et al. (2011) Kim, H. J., Evans, N. J., II, Dunham, M. M., et al. 2011, ApJ, 729, 84
- Klein et al. (2003) Klein, R., Apai, D., Pascucci, I., Henning, T., & Waters, L. B. F. M. 2003, ApJ, 593, L57
- Lada (1987) Lada, C. 1987, in Jugaku M. P. J., ed., IAU Symp. 115, Star Formation – From OB Associations to Protostars. D. Reidel Publishing Co, Dordrecht, p. 1
- Larson (1969) Larson, R. B. 1969, MNRAS, 145, 271
- Lee et al. (2009) Lee, C. W., Bourke, T. L., Myers, P. C., et al. 2009, ApJ, 693, 1290
- Lee et al. (2013) Lee, C. W., Kim, M.-R., Kim, G., et al. 2013, ApJ, 777, 50
- Lo (2005) Lo, K. Y. 2005, ARA&A, 43, 625
- Luhman (1999) Luhman, K. L. 1999, ApJ, 525, 466
- Luhman et al. (2007) Luhman, K. L., Adame, L., D’Alessio, P., et al. 2007, ApJ, 666, 1219
- Luhman et al. (2003) Luhman, K. L., Briceño, C., Stauffer, et al. 2003, ApJ, 590, 348
- Maheswar et al. (2011) Maheswar, G., Lee, C. W., & Dib, S. 2011, A&A, 536, A99
- Martín et al. (2001) Martín, E. L., Dougados, C., Magnier, E., et al. 2001, ApJ, 561, L195
- Mohanty et al. (2005) Mohanty, S., Jayawardhana, R., & Basri, G., 2005, ApJ, 626, 498
- Morata et al. (2015) Morata, O., Palau, A., González, R. F., et al. 2015, ApJ, 807, 55
- Motte & André (2001) Motte, F., & André, P., 2001, A&A, 365, 440
- Muzerolle et al. (2000) Muzerolle, J., Briceño, C., Calvet, N., et al. 2000, ApJ, 545, L141
- Muzerolle et al. (2003) Muzerolle, J., Hillenbrand, L., Calvet, N., Briceño, C., & Hartmann, L. 2003, ApJ, 592, 266
- Muzerolle et al. (2005) Muzerolle, J., Luhman, K. L., Briceño, C., Hartmann, L., & Calvet, N. 2005, ApJ, 625, 906
- Natta & Testi (2001) Natta, A., & Testi, L. 2001, A&A, 376, L22
- O’Linger et al. (1999) O’Linger, J., Wolf-Chase, G., Barsony, M., & Ward-Thompson, D. 1999, ApJ, 515, 696
- Palau et al. (2012) Palau, A., de Gregorio-Monsalvo, I., Morata, Ò., et al. 2012, MNRAS, 424, 2778
- Palau et al. (2014) Palau, A., Zapata, L. A., Rodríguez, L. F., et al. 2014, MNRAS, 444, 833
- Pascucci et al. (2003) Pascucci, I., Apai, D., Henning, T., & Dullemond, C. P. 2003, ApJ, 590, L111
- Pezzuto et al. (2012) Pezzuto, S., Elia, D., Schisano, E., et al. 2012, A&A, 547, A54
- Phan-Bao et al. (2011) Phan-Bao, N., Lee, C.-F., Ho, P. T. P., & Tang, Y.-W. 2011, ApJ, 735, 14
- Pineda et al. (2011) Pineda, J. E., Arce, H. G., Schnee, S., et al. 2011, ApJ, 743, 201
- Podio et al. (2012) Podio, L., Kamp, I., Flower, D., et al. 2012, A&A, 545, A44
- Preibisch & Zinnecker (2001) Preibisch, T., & Zinnecker, H. 2001, AJ, 122, 866
- Santiago-García et al. (2009) Santiago-García, J., Tafalla, M., Johnstone, D., & Bachiller, R. 2009, A&A, 495, 169
- Scholz & Jayawardhana (2006) Scholz, A., & Jayawardhana, R. 2006, ApJ, 638, 1056
- Scholz & Jayawardhana (2008) Scholz, A., & Jayawardhana, R. 2008, ApJ, 672, L49
- Scholz et al. (2010) Scholz, A., Wood, K., Wilner, D., et al. 2010, MNRAS, 409, 1557
- Schwarz et al. (2012) Schwarz, K. R., Shirley, Y. L., & Dunham, M. M. 2012, AJ, 144, 115
- Shirley et al. (2007) Shirley, Y. L., Claussen, M. J., Bourke, T. L., Young, C. H., & Blake, G. A. 2007, ApJ, 667, 329
- Shirley et al. (2000) Shirley, Y. L., Evans, N. J., II, Rawlings, J. M. C., & Gregersen, E. M. 2000, ApJS, 131, 249
- Stecklum et al. (2007a) Stecklum, B., Melnikov, S. Y., & Meusinger, H. 2007a, A&A, 463, 621
- Stecklum et al. (2007b) Stecklum B., Meusinger H., & Froebrich D., 2007b, Ap&SS, 311, 63
- Sunada et al. (2007) Sunada, K., Nakazato, T., Ikeda, N., et al. 2007, PASJ, 59, 1185
- Tafalla et al. (2004) Tafalla, M., Santiago, J., Johnstone, D., & Bachiller, R. 2004, A&A, 423, L21
- Testi et al. (2016) Testi, L., Natta, A., Scholz, A., et al. 2016, A&A, 593, A111
- Tobin et al. (2015) Tobin, J. J., Looney, L. W., Wilner, D. J., et al. 2015, ApJ, 805, 125
- Torrelles et al. (1997) Torrelles, J. M., Gómez, J. F., Rodríguez, L. F., et al. 1997, ApJ, 489, 744
- Torrelles et al. (1998) Torrelles, J. M., Gómez, J. F., Rodríguez, L. F., et al. 1998, ApJ, 505, 756
- Torrelles et al. (2001) Torrelles, J. M., Patel, N. A., Gómez, J. F., et al. 2001, ApJ, 560, 853
- Torrelles et al. (2014) Torrelles, J. M., Trinidad, M. A., Curiel, S., et al. 2014, MNRAS, 437, 3803
- Torres et al. (2007) Torres, R. M., Loinard, L., Mioduszewski, A. J., & Rodríguez, L. F. 2007, ApJ, 671, 1813
- Ungerechts et al. (1982) Ungerechts, H., Winnewisser, G., & Walmsley, C. M. 1982, A&A, 111, 339
- Wang et al. (2014) Wang, L.-Y., Shang, H., Su, Y.-N., et al. 2014, ApJ, 780, 49
- Wang et al. (2001) Wang, H., Yang, J., Wang, M., et al. 2001, AJ, 121, 1551
- Watson et al. (2016) Watson, D. M., Calvet, N. P., Fischer, W. J., et al. 2016, ApJ, 828, 52
- Whelan et al. (2005) Whelan, E. T., Ray, T. P., Bacciotti, F., et al. 2005, Nature, 435, 652
- Whelan et al. (2007) Whelan, E. T., Ray, T. P., Randich, S., et al. 2007, ApJ, 659, L45
- White & Hillenbrand (2004) White, R. J., & Hillenbrand, L. A. 2004, ApJ, 616, 998
- Yates et al. (1997) Yates, J. A., Field, D., & Gray, M. D. 1997, MNRAS, 285, 303
- Young et al. (2006) Young, C. H., Bourke, T. L., Young, K. E.,et al. 2006, AJ, 132, 1998
- Young et al. (2004) Young, C. H., Jørgensen, J. K., Shirley, Y. L., et al. 2004, ApJS, 154, 396
- Young et al. (2003) Young, C. H., Shirley, Y. L., Evans, N. J., II, & Rawlings, J. M. C. 2003, ApJS, 145, 111
- Yung et al. (2011) Yung, B. H. K., Nakashima, J.-I., Imai, H., et al. 2011, ApJ, 741, 94