A Unique View of AGN-Driven Molecular Outflows: The Discovery of a Massive Galaxy Counterpart to a High-Metallicity Damped Lyman- Absorber
Abstract
We report the discovery of a massive galaxy at the same redshift as a carbon-monoxide-bearing sub-damped Lyman absorber (sub-DLA) seen in the spectrum of QSO J1439+1117. The galaxy, J1439B, is located 47 from the QSO sightline, a projected distance of 38 physical kpc at , and exhibits broad optical emission lines ( km s-1) with ratios characteristic of excitation by an active galactic nucleus (AGN). The galaxy has a factor of 9 lower star formation than is typical of star-forming galaxies of the same mass and redshift. The nearby sub-DLA is highly enriched, suggesting its galactic counterpart must be massive if it follows the mass-metallicity relationship. Metallic absorption within the circumgalactic medium of the sub-DLA and J1439B is spread over a velocity range km s-1, suggesting an energetic origin. We explore the possibility that a different galaxy could be responsible for the rare absorber, and conclude that it is unlikely based on imaging, integral-field spectroscopy, and high- massive galaxy pair statistics. We argue that the gas seen in absorption against the QSO was likely ejected from the galaxy J1439B and therefore provides a unique observational probe of AGN feedback in the distant universe.
Subject headings:
galaxies: high-redshift, active — intergalactic medium — quasars: absorption lines1. Introduction
The formation and evolution of galaxies is inextricably tied to the flow of gas into and out of galaxies through the circumgalactic medium (CGM). Galaxies in the early universe require significant gas accretion in order to power their high rates of star formation for sizable fractions of a Hubble time (see, e.g., Erb 2008 and Finlator & Davé 2008). Gas outflows are observationally known to be prevalent among high-redshift galaxies (Pettini et al. 2001; Shapley et al. 2003; Steidel et al. 2010), and cosmological semi-analytic and hydrodynamic simulations require strong feedback in order to reproduce the observed luminosity function of galaxies (White & Frenk 1991; Cole et al. 1994; Kauffmann et al. 1999; Somerville & Primack 1999; Efstathiou 2000). At low masses, the energy and momentum injected into the gas from supernovae and stellar radiation pressure is likely sufficient to drive galaxy-scale winds (Murray et al. 2011; Hopkins et al. 2012); however, at masses above , feedback from active galactic nuclei (AGN) may be needed to regulate and eventually halt star formation (Benson et al. 2003; Croton et al. 2006).
The gaseous environments of high-redshift galaxies are an excellent laboratory to explore the properties of galactic accretion and winds. Studies of statistical samples of high-redshift galaxies have begun to quantify the properties of the CGM (Rudie et al. 2012; Turner et al. 2014, 2015; Rubin et al. 2015; Lau et al. 2016); however, there is still much observational and theoretical progress needed to understand the nuanced relationship between galaxies and their gaseous surroundings, especially with regard to feedback.
One particular class of CGM absorption is known as the damped Lyman absorber (DLA). Covering about a third of the sky (Fumagalli et al. 2015), DLAs contain the majority of the neutral gas at all redshifts (Tytler 1987; O’Meara et al. 2007) and are thought to trace gas within the interstellar medium (ISM) or very near to galaxies. Compared to the rest of the intergalactic medium (IGM) and CGM which is predominantly ionized, DLAs have column densities of hydrogen large enough that the outer layers absorb the incident hydrogen-ionizing photons, leaving the majority of the gas within the structure neutral. For historical reasons, DLAs are usually defined as those clouds with (see Wolfe et al. 2005 for a review), although structures with somewhat lower column densities are still self-shielding and may be largely neutral (Dessauges-Zavadsky et al. 2003; Meiring et al. 2009; Lehner et al. 2014).
DLAs, like galaxies, have a wide variety of physical properties that likely reflect the diversity of their origins. The majority of DLAs are metal poor (Pettini et al. 1997b; Rafelski et al. 2012; Jorgenson et al. 2013), have small physical sizes (Monier et al. 2009; Cooke et al. 2010), and are kinematically cold (Prochaska & Wolfe 1997; Neeleman et al. 2013). Although some authors have suggested that they could originate in the far outskirts of more massive systems (Cooke et al. 2006; Rafelski et al. 2011; Font-Ribera et al. 2012), both cosmological and high-resolution simulations suggest that the majority of DLAs are associated with relatively low-mass galaxies (Haehnelt et al. 1998b; Pontzen et al. 2008; Bird et al. 2015).
Tremendous effort has been focused on the identification of the galaxy counterparts of high-redshift DLAs. Large surveys of the volume surrounding QSO sight lines with DLAs have been carried out using both long-slit (Fynbo et al. 2010) and integral-field (Péroux et al. 2011; Bouché et al. 2012; Péroux et al. 2012) spectrographs as well as imaging and spectroscopic surveys using double DLA sight lines (Fumagalli et al. 2010). Despite these efforts, however, relatively few galaxy counterparts are known. Péroux et al. (2011), Bouché et al. (2012), and Fumagalli et al. (2015) employed systematic searches for DLA host galaxies. With relatively few detections, based on the detection limits of their data, the authors conclude that the typical DLA galaxy counterpart has a star formation rate SFR yr-1. In contrast, the detected galactic counterparts to DLAs unsurprisingly represent a biased sample; the galaxies typically have significantly higher SFRs, and on average, the metallicity of the DLAs is higher (Fynbo et al. 2010; Péroux et al. 2012; Fumagalli et al. 2015)
Fumagalli et al. (2015) recently reviewed the published results and found that only 11 , absorption systems were known to have galactic counterparts at the same spectroscopically identified redshift (Møller & Warren 1993; Møller et al. 2002, 2004; Weatherley et al. 2005; Fynbo et al. 2010, 2011; Bouché et al. 2012; Krogager et al. 2012; Noterdaeme et al. 2012b; Péroux et al. 2013; Bouché et al. 2013; Jorgenson & Wolfe 2014). Since 2015, at least five additional plausible host galaxies have been identified (Hartoog et al. 2015; Srianand et al. 2016; Neeleman et al. 2017). In addition to these, a handful of high- sub-DLAs with have identified nearby galaxies (c.f. Kashikawa et al. 2014; Zafar et al. 2017). Compared with either the statistical sample of DLAs from the Sloan Digital Sky Survey, which contains over 12,000 DLAs (Noterdaeme et al. 2012a), or the several hundred DLAs with high-resolutions spectroscopy (see, e.g., Zafar et al. 2013; Jorgenson et al. 2013), the sample of galaxy counterparts is remarkably small. Given the current small sample, additional discoveries are critical both to our understanding of the nature of DLAs and sub-DLAs, as well as to our understanding of galaxy formation.
The sub-DLA at z=2.41827 toward QSO J1439+1117, hereafter DLAJ1439, is a unique system due to its high level of chemical enrichment and molecular gas content. It has an H I column density , placing it just short of the classical DLA limit of , and metallicity consistent with the solar value (Noterdaeme et al. 2008). Gas associated with the sub-DLA is detected in numerous metallic transitions including neutral carbon and sulfur, as well as in several molecular species (see Noterdaeme et al. 2008, Srianand et al. 2008, and Section 4.2), suggesting that the absorber is self-shielding. DLAJ1439 provided the first optical detection of carbon monoxide (CO) associated with a DLA or sub-DLA (Srianand et al. 2008). In addition to CO, H2 and HD are also detected (Srianand et al. 2008; Noterdaeme et al. 2008). Further, DLAJ1439 has a high molecular fraction (Srianand et al. 2008), the highest measured in any DLA or sub-DLA to date (Liszt 2015).
Here we report the discovery of a galaxy at the same redshift separated from DLAJ1439 by 47, or 38 physical kpc. In Section 2, we describe the imaging and spectroscopic discovery data and their analysis. Section 3 describes the properties of J1439B that indicate it likely hosts an AGN and which make it a likely galaxy counterpart to DLAJ1439. In Section 4, we argue that J1439B is the most likely candidate for the source of the absorber and discuss the implications for the chemical evolution of the galaxy and for AGN-driven outflows.
Throughout this paper we assume a Chabrier (2003) stellar initial mass function and a -CDM cosmology with km s-1 Mpc-1, , and . Unless otherwise specified, all distances are in physical units, all transitions are referred to by their vacuum wavelengths, and magnitudes refer to the AB system (Oke & Gunn 1983).
2. Data
2.1. QSO Spectroscopy
High-resolution spectroscopic observations of QSO J1439+1117 were carried out using the Ultraviolet and Visual Echelle Spectrograph (UVES; Dekker et al. 2000) on the Very Large Telescope (VLT). The data from ESO program 278.A-5062(A) were obtained from the ESO Science Archive Facility. A description of the observational setup is discussed in Noterdaeme et al. (2008) and Srianand et al. (2008). All column density measurements of the absorption systems, and quantities derived from them, are taken from these papers, and the QSO data are presented in this work for visualization of the velocity distribution only.
A detailed description of the reduction procedure can be found in Murphy et al. (2007) and Bagdonaite et al. (2014). Briefly, the data were reduced using the ESO UVES pipeline. Cosmic rays were masked, and the exposures were combined using UVES_popler (Murphy 2016) which was specifically designed to optimally combine exposures reduced by the UVES pipeline. The resultant spectrum was cleaned of artifacts and continuum normalized.
2.2. Imaging Observations
Near-infrared (IR) imaging of the field surrounding QSO J1439+1117 was taken with the FourStar camera (Persson et al. 2013) on the Magellan Baade 6.5 m telescope. The FourStar data were reduced using a custom pipeline, FourCLift, developed by D. Kelson and described in Kelson et al. (2014). FourCLift corrects for dark current and nonlinearity before flat-fielding the images. Bad pixels are masked, and the sky background is determined iteratively using a bivariate wavelet transformation of the images with detected sources masked. Time variability in each level of the wavelet transforms is determined and sky frames are computed by inverting model wavelet transforms reconstructed for the time of each science exposure. These model sky frames are subtracted, and the frames subsequently aligned and stacked, taking into account the distortion of the camera to produce rectified images. Photometric calibration of the FourCLift processed images was performed with unsaturated 2MASS stars in the field.
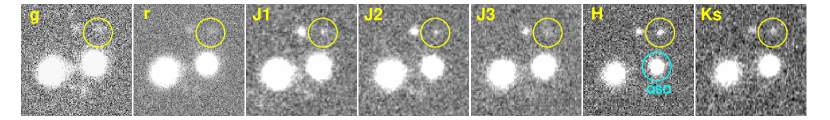
Optical images in Sloan and were taken with the camera of the IMACS imaging spectrometer (Dressler et al. 2011) on the Magellan Baade telescope. The data were bias and gain corrected, flat fielded, background subtracted, and combined using standard IRAF packages. The zeropoints of the images were determined using photometrically calibrated stars in the same fields from the SDSS DR7 (York et al. 2000; Abazajian et al. 2009). The optical and NIR images are shown in Figure 1. All of the images were aligned and then registered to the -band image. They were then smoothed to a FWHM = 12, similar to that of the band image.
2.3. Galaxy Photometry
From the NIR imaging, a galaxy of interest (henceforth J1439B) was identified 47 north of the QSO at R.A. , decl. . The colors of the galaxy were measured using Source Extractor (Bertin & Arnouts 1996) in a 16 aperture centered on the -band detection in order to minimize any contribution from the nearby QSO. A small correction to the colors for light that falls outside of the 16 aperture was computed and applied by comparing the color of stars measured in 8” apertures to that measured in 16 apertures. Conservatively, the color errors were computed as the quadratic sum of the photometric error in the two bands and the aperture correction.
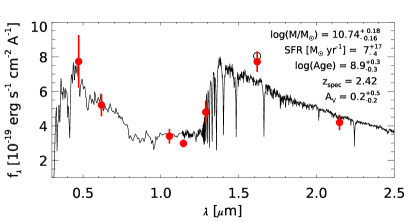
The -band photometry of the galaxy was computed using the un-smoothed image. The Source Extractor -band MagAuto aperture was used as the normalization and the magnitudes in the other photometric bands were computed by adding the -band magnitude to the aperture-corrected colors. The magnitude errors used throughout this paper are the quadratic sum of the aperture-corrected color errors and the -band MagAuto error computed by Source Extractor. The final magnitudes, corrected for Galactic extinction following Schlafly & Finkbeiner (2011), are reported in Table 1 and shown in Figure 2.
| Band | Instrument | AB MagnitudeaaAperture and foreground dust-corrected magnitudes and errors. |
|---|---|---|
| IMACS | 24.50 0.21 | |
| IMACS | 24.34 0.13 | |
| FourStar | 23.65 0.14 | |
| FourStar | 23.61 0.08 | |
| FourStar | 22.84 0.15 | |
| FourStar | 21.78 0.07 | |
| bbThe -band magnitude corrected for the [O III]5008 and 4960 emission as determined from the FIRE observations. | FourStar | 21.83 0.08 |
| FourStar | 21.87 0.12 |
2.4. NIR Spectroscopy
An NIR spectrum of the galaxy was acquired in 06 seeing with the FIRE spectrograph (Simcoe et al. 2013) on the Magellan Baade telescope. In total, 7 hours of integration were obtained using 20-minute exposures taken in an AB dither pattern. Preliminary reduction of the data was completed with the publicly available reduction pipeline FIREHOSE.111 Written by Rob Simcoe, John Bochanski, and Mike Matejek; http://www.firespectrograph.org/ The flat field was derived from internal quartz flats and the illumination correction was computed from twilight flat exposures. The initial wavelength solution from FIREHOSE utilizes both ThAr arc exposures as well as OH emission lines captured in the science exposures. The data were also flux calibrated and corrected for telluric absorption using observations of A0V stars.
Custom reduction software was developed to produce a rectified 2D spectrum (see Newman et al. 2015). The trace of the object through the echelle orders was mapped using observations of telluric calibration stars, and each echellogram was rectified. Spatial object profiles were derived from the spectral regions surrounding the [O III] emission lines detected in the FIREHOSE-derived sky-subtracted combined exposures for the A and B positions from each night. These profiles were used to model the contributions to the 2D spectrum from the source for second-pass sky subtraction. The wavelength solution was refined outside of FIREHOSE using OH lines in the observed data. Individual exposures were aligned and averaged without weighting, and the 1D spectrum was extracted with a boxcar of 10 width. The resultant spectrum was renormalized to match the -band photometry and the best-fit spectral energy distribution (SED) template in order to correct for possible slit losses and errors in the spectrophotometry. The reduced spectrum is shown in Figure 3.
2.5. Photometric Modeling
The SED fitting code FAST (Kriek et al. 2009) was used to model the photometry of the galaxy using the Bruzual & Charlot (2003) stellar populations synthesis models, a Chabrier (2003) IMF, and a Calzetti et al. (2000) dust-attenuation curve. As the spectral library does not include emission lines, we also correct the -band photometry by 0.045 mag to account for the presence of [O III] line emission, the strongest line present in the FIRE spectrum (see Section 2.6). The redshift was fixed to the measured spectroscopic redshift of the galaxy . The best-fit model derived by FAST implies that the galaxy is relatively massive, , with a comparatively modest star formation rate, yr-1, and a relatively evolved stellar population (age Myr). The photometric data as well as the best-fit SED are shown in Figure 2.
2.6. Spectroscopic Modeling
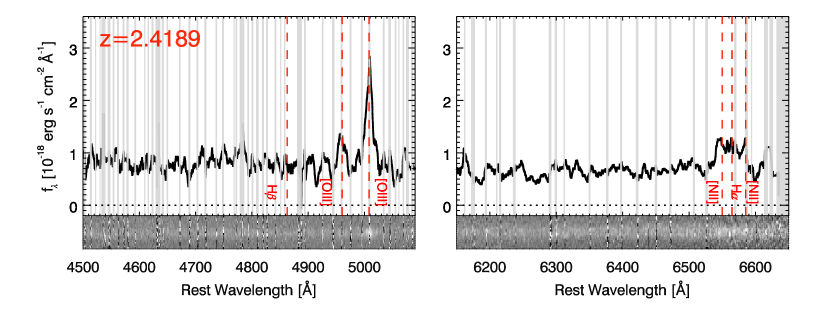
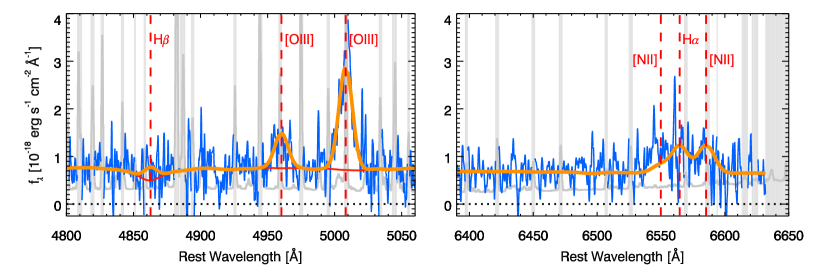
Rest-optical spectroscopy of the galaxy (Figure 3) reveals broad [O III] emission in the band and blended H and [N II] emission in the band. The -band portion of the spectrum was modeled using a single Gaussian emission component for each of the [O III] and H emission lines superimposed on the best-fit stellar continuum model from the SED fitting. The best-fit SED model spectrum was convolved with a Gaussian matched to the measured [O III] emission line width ( km s-1). This model continuum was used to account for stellar absorption at H. The emission lines were all forced to have the same redshift and velocity dispersion, and the [O III] emission line fluxes were forced to have a [O III] ratio of 2.98, in agreement with their theoretically determined magnetic-dipole transition probabilities (Storey & Zeippen 2000). Regions around bright night-sky lines were masked prior to fitting (gray regions in Figure 4). The resulting fit is shown in the left-hand panel of Figure 4 and the parameters of the fit are listed in Table 2.
Both [O III] lines are well-detected and best fit by a broad Gaussian with km s-1 at . Using the best-fit SED spectrum as the model continuum yields a formal detection of H and a high value of [O III]/H.222If the stellar continuum were modeled without the expected stellar absorption, H would be undetected leading to a higher value of [O III]/H. However, given the uncertainty in the precise age of the stars and the stellar velocity dispersion of the galaxy, and therefore the shape and normalization of the underlying H absorption, we consider one additional model to determine the maximum allowable H line flux and the lowest possible value of [O III]/H. We fix all of the input parameters in FAST to the best-fit values, but set the age to year, and a short exponential star-formation timescale year in order to produce a spectrum with the largest plausible stellar absorption at H.333The Bruzual & Charlot (2003) models have a maximum H absorption equivalent width at an age of year. Fitting the -band spectrum using this maximal-H model as the continuum results in a fit with higher H line flux; however, the change is smaller than the error in the fit using the best-fit SED.
[N II] and H emission is also detected at lower significance and is more difficult to model robustly. Because of this we use a model similar to the one above, with single Gaussian components for [N II] and H superimposed on the stellar continuum; however, we force the redshift and velocity dispersion of the emission lines to match that determined by the -band fit (Figure 4, right panel). As with [O III], we fix the ratio of the [N II] emission lines to their theoretically determined [N II] ratio of 3.05. This results in a fit that appears to under-predict the emission at wavelengths shorter than that of H. The detected excess emission could be due to additional H emission, which is blue-shifted with respect to the main H component; however the quality of the -band data do not warrant a multi-component fit to this emission. The parameters of both the - and -band fits are listed in Table 2.
| Redshift | Line Flux ( erg s-1 cm-2) | Line Ratios | |||||
|---|---|---|---|---|---|---|---|
| (km s-1) | [O III] | HaaThis fit reflects the use of the best-fit SED as the continuum in order to correct for underlying stellar absorption. Without this correction, H is undetected. | H | [N II] | [O III]/HaaThis fit reflects the use of the best-fit SED as the continuum in order to correct for underlying stellar absorption. Without this correction, H is undetected. | [N II]/H | |
3. The Nature of J1439B
Given the close separation (47, 38 physical kpc) of the galaxy J1439B to the high-metallicity, CO-bearing sub-DLA seen in the spectrum of QSO J1439+1117, the properties of the galaxy are of considerable interest. In particular, it is necessary to assess the possibility that the galaxy could have a causal relationship with the sub-DLA in which the gas represents the ejected or stripped ISM of J1439B. Given this, signatures of past feedback within the galaxy, as well as its present capability to launch gas, are of relevance. As will be shown, the galaxy sits below the main sequence of star formation, has broad nebular line emission plausibly due to an outflow, appears likely to host an AGN, and is massive enough to have enriched its ISM to near solar metallicity, consistent with the abundances derived for DLAJ1439. Collectively, these properties suggest that J1439B is the likely source of the sub-DLA gas.
3.1. The Position of J1439B with Respect to the Main Sequence of Star Formation

Many authors have noted that star-forming galaxies exhibit a correlation between their stellar mass and star-formation rate such that high-mass galaxies typically exhibit higher levels of star formation, both in the local universe and at high redshift (Brinchmann et al. 2004; Noeske et al. 2007; Daddi et al. 2007; Rodighiero et al. 2011; Wuyts et al. 2011; Reddy et al. 2012; Whitaker et al. 2012). Generally referred to as the “main sequence” of star formation following Noeske et al. (2007), the underlying meaning of this relation and its evolution is debated (see e.g. Peng et al. 2010b; Kelson 2014; Abramson et al. 2014); however, the existence of such a correlation allows one to infer how “typical” a given SFR is for a galaxy at fixed stellar mass and redshift.
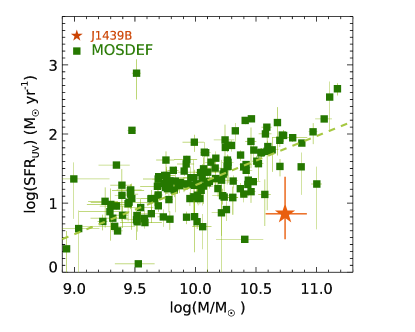
Shown in Figure 5 is a recent measurement of the main sequence of galaxies from the -band selected MOSDEF sample as presented in Shivaei et al. (2015).444 Shivaei et al. (2015) measure a completeness limit of M⊙. For galaxies with masses comparable to J1439B, the sample should be highly complete. As we determine the SFR of J1439B based on the best-fit SED, the values plotted from the MOSDEF sample are those based on photometrically derived SFRs; however, the results are unchanged if one considers H-based SFRs. Also plotted for comparison is the SED-based SFR and stellar mass of J1439B.555We argue below that the dominant ionization source in J1439B is an AGN, and so we refrain from reporting an SFR determined from H emission. The SED-derived SFR implies significantly less flux in the H emission line than is measured, consistent with the argument that the SED is mostly determined by the stellar properties while the ionizing emission lines are dominated by an AGN.
It is evident from this figure that J1439B has a low rate of star formation given its present stellar mass compared to galaxies from the MOSDEF sample. To better quantify how “atypical” J1439B is, we use the fit to the main sequence described by Shivaei et al. (2015) to galaxies from the MOSDEF sample with using the UV SFR indicator. They found
| (1) |
with an intrinsic scatter of where SFR is measured in yr-1 and is measured in . Based on this fit, for a galaxy with the mass of J1439B, we would expect an SFR of 61 yr-1. The SFR of J1439B, SRF, is therefore below the main sequence determined by Shivaei et al. (2015).
3.2. The Ionization Properties of J1439 from Optical Emission Line Ratio Diagnostics
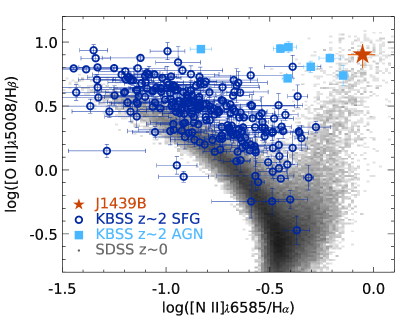
The deep rest-optical spectrum of J1439B provides important constraints on the source of ionization in the galaxy. One of the best known diagnostics, the [N II] BPT diagram (Baldwin et al. 1981), is shown in the left-hand panel of Figure 6. Local galaxies, taken from the SDSS Data Release 7 (Abazajian et al. 2009) are shown in the gray shading. The high-density arc of galaxies extending from the bottom middle of the plot toward the upper left is a sequence of low- star-forming galaxies in which [O III]/H increases and [N II]/H decreases with decreasing gas-phase metallicity and increasing ionization. Galaxies that lie in the more diffuse distribution have optical line emission that is dominated by ionization from an AGN. The region in between is populated by galaxies with both AGN and star-formation, or those with ionization that is dominated by shocks or hot evolved stars (Veilleux & Osterbrock 1987; Kewley et al. 2001; Kauffmann et al. 2003).
Overplotted in blue are a large sample of UV-selected star-forming galaxies from the Keck Baryonic Structure Survey (KBSS; Strom et al. 2017). From the KBSS sample, we plot galaxies with measurements of H, measurements of [O III] and H, and measurements of [N II]. Galaxies that are spectroscopically identified as AGN are plotted in light blue squares, while galaxies without detected spectroscopic signatures of AGN activity are plotted as dark blue open circles. As described in Steidel et al. (2014) and Strom et al. (2017), galaxies are identified as AGN based on strong detections of high-ionization emission lines in their rest-UV spectrum (e.g. N V, C IV) or, for those galaxies lacking rest-UV spectroscopy,666Two out of the seven galaxies identified as AGN in Steidel et al. (2014) lack UV spectroscopy. unambiguous combinations of rest-optical line widths and ratios characteristic of AGN.
The location of J1439B within this diagram is represented by the red star. As had been discussed extensively in the literature (Masters et al. 2014; Steidel et al. 2014; Shapley et al. 2015; Sanders et al. 2016b; Strom et al. 2017), based on large high-redshift galaxy samples, there is clearly a systematic offset between the and star-forming loci. Given the higher level of ionization of high- galaxies, and the possibility of metal-poor AGN, it is likely that the [N II] BPT diagram no longer provides a clean separation for all galaxies and AGN (Kewley et al. 2013). Based on the MOSDEF sample, which includes IR- and X-ray-selected AGN, Coil et al. (2015) and Azadi et al. (2017) argue that some AGN may contaminate galaxies in the star-forming sequence of the BPT diagram, but that galaxies at the plotted position of J1439B are almost certainly AGN. Considering Figure 6, based on the location of either low- or high-redshift AGN, the position of J1439B is quite clearly within the AGN portion of the diagram. However, caution is still warranted given the lower S/N of the FIRE spectrum in the band and the resulting poor emission line model fit. The measured ratio of [N II]/H is higher than all of the KBSS galaxies; however, the measurement is likely subject to additional systematic uncertainties.777The plotted error is based solely on the errors in the fit parameterized as discussed in Section 2.6. No source of systematic error due to the choice of model is taken into account.
To diagnose the likely presence of an AGN without relying on the comparatively poor quality of the -band spectrum, we also consider a mass-excitation diagram (MEx; Juneau et al. 2011) in the right-hand panel of Figure 6. The same samples are plotted as described above, but the requirements of a detection of [N II] among the KBSS sample is relaxed. As was the case with the BPT diagram, the position of J1439B in the MEx diagram is most similar to the most extreme AGN in the low- universe and coincident with all of the high- AGN from the KBSS. While neither of these diagnostics is completely conclusive as to the nature of the ionization source, it appears likely that the galaxy hosts an AGN.
3.3. Emission Line Width
Another distinguishing property of the optical spectrum of J1439B is the large velocity dispersion km s-1 measured in the [O III] emission lines. This value of is larger than all of the galaxies in the UV-selected KBSS-MOSFIRE sample888The only galaxy with a comparable velocity dispersion is Q0821-BX101, which Steidel et al. (2014) identified as an AGN. (Strom et al. 2017), even those galaxies with significantly higher inferred stellar mass (see Figure 7). Measured values of km s-1 do exist among high-redshift samples, most of which fall into two distinct types: compact star-forming (c.f. van Dokkum et al. 2015) and quiescent (c.f. van Dokkum et al. 2009; Belli et al. 2017) galaxies, as well as AGN (c.f. Förster Schreiber et al. 2014; Genzel et al. 2014; Coil et al. 2015; Azadi et al. 2017).
In order to quantify the expected contribution to the measured [O III] emission line width from virial motions of the gas within the galactic potential, we calculate the “expected velocity dispersion” following van Dokkum et al. (2015) using photometrically derived quantities. We use galfit (Peng et al. 2002, 2010a) to model the -band image using a Sersic profile + sky. The limited depth and ground-based seeing in the -band image prevent a high-confidence fit; however, the best-fit models are disk-like, with semi-major kpc and axis ratio depending on whether we allow the Sersic index to vary or if we keep it fixed at . We compute a circularized half-light ratio,
| (2) |
yielding kpc. Next we calculate the expected velocity dispersion:
| (3) |
where , , and have units of km s-1, , and kpc, respectively. The predicted velocity dispersion of J1439B is km s-1, roughly 100 km s-1 less than the spectroscopically measured velocity dispersion. Given this, below we explore the likelihood that the kinematics of the gas reflect the dynamical properties of the stars within the galaxy or that of an AGN-driven wind.
3.3.1 Broad Emission Lines in Compact Galaxies
A decade ago, deep HST imaging uncovered a significant population of massive compact galaxies at high redshift (c.f. Trujillo et al. 2006; van Dokkum et al. 2008). More recently, the remarkably concentrated nature of these sources was confirmed with stellar velocity dispersion measurements (van Dokkum et al. 2009; Toft et al. 2012; van de Sande et al. 2013; Belli et al. 2014; Hill et al. 2016; Barro et al. 2016; Belli et al. 2017), many of which are comparable to or larger than that of J1439B.
Van Dokkum (2015) targeted a sample of plausible star-forming progenitors of these systems, characterized by compact sizes, large stellar masses, and high star-formation rates. The authors followed up galaxies that had photometrically predicted velocity dispersions, km s-1, finding spectroscopic velocity dispersions measured in the ionized gas that vary greatly from system to system. Specifically, van Dokkum et al. (2015) obtained -band spectroscopy for 25 star-forming compact massive galaxies (sCMG) and measured the velocity dispersion using H emission (see Figure 7). Even among this sample selected on properties expected to obtain high velocity dispersions, only five galaxies have measured emission-line velocity dispersions km s-1(comparable to that of J1439B), four of which are X-ray-detected AGN with erg s-1. Van Dokkum (2015) argued that the velocity dispersion of those systems are likely affected by the presence of the AGN, either through winds or the dynamics of gas close to the black hole999Note that broad H emission could plausibly originate in the BLR close to a black hole; however, collisionally excited forbidden emission such as [O III] is not expected from a BLR due to the higher gas densities (see, e.g., Sulentic et al. 2000)..

Without a measurement of the stellar velocity dispersion in J1439B, one cannot rule out the possibility that the measured [O III] emission line width is due to virialized motion alone. Nonetheless the argument above, combined with the high incidence of AGN among the studied population of star-forming galaxies with km s-1, further suggests that J1439B contains an AGN and that the kinematics of the ionized gas may be due to a wind.
3.3.2 Broad Forbidden-line Emission due to an AGN-driven Outflow
Broad emission lines in the optical spectrum of a galaxy are often an indication of the presence of an AGN. Typically, the broadest line emission is found in the Balmer lines and originates within the broad line region (BLR), thought to be a disk of gas in orbit around the black hole. Such regions do not exhibit collisionally excited emission lines such as [N II] and [O III] (Sulentic et al. 2000), presumably because the densities within the disk are too high to produce forbidden emission. Given the poor fit to the region surrounding H and very low level emission at H in the J1439B spectrum (see Section 2.6 and Figure 4), very broad Balmer line emission cannot be ruled out; however, the relatively high velocity dispersion measured for the [O III] emission must also be explained and does not originate from a BLR.
Förster Schreiber et al. (2014) and Genzel et al. (2014) reported the high incidence of broad emission components associated with the nuclei of high-mass star-forming galaxies, which they interpret as signatures of AGN-driven outflows. The broad components are measured in recombination emission (H) as well as forbidden transitions ([N II] and [S II]), suggesting they are more likely due to winds than the BLR. Genzel et al. (2014) report that two-thirds of galaxies with exhibit nuclear emission with line widths in the range of km s-1. Newman et al. (2012b) found that lower-mass star-forming galaxies also often exhibit underlying broad forbidden and recombination emission, which they also interpret as being due to outflows; however, this emission appears to extend across the whole galaxy, has lower typical line widths km s-1, and is more likely driven by intense star formation. As J1439B has a relatively low SFR, if the broad [O III] emission is due to winds, it is unlikely that the winds are driven by star formation alone.
Genzel et al. (2014) also found that the width of the broad nuclear emission appears to correlate with the position of the galaxy above or below the star forming main sequence. Specifically, Genzel et al. (2014) stacked the nuclear spectrum of galaxies in three bins of stellar mass and two bins of SFR (above and below the main sequence). For their stack of galaxies with with measured SFR that places them below the main sequence, consistent with the photometrically derived properties of J1439B, the average measured velocity dispersion of the broad nuclear component is km s-1, very similar to the measured line width of the [O III] emission in the FIRE spectrum of J1439B.
Given the high frequency of AGN in galaxies with masses comparable to J1439B and the likelihood that the large measured emission-line velocity dispersion of J1439B is caused by outflowing winds and the lower-than-typical SFR of J1439B, one must consider the possibility that DLAJ1439 was expelled from the ISM of J1439B in a previous episode of feedback or through stripping.

3.4. The Metallicity of DLAJ1439 and Implications for Its Relationship to Galaxy J1439B
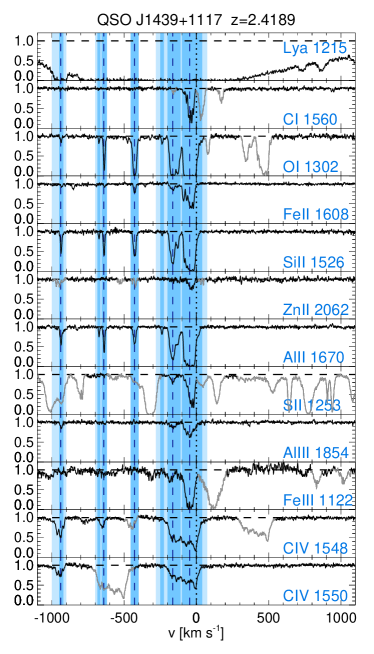
There are many remarkable properties of DLAJ1439, but one of the most discriminatory as to the likely origin of the gas is its metallicity. Metal line absorption associated with the sub-DLA is detected from a wide variety of elements and arises from gas with a large range of ionization states (see Figure 8). As the O I absorption associated with the trough of the sub-DLA is saturated, a direct determination of the O/H ratio is not possible. However, Noterdaeme et al. (2008) reported a sulfur abundance based on fits to the S II absorption components of [S/H]. The ratio of S/O is constant across galactic environments (Pagel 2009), and so sulfur can be used as a proxy for oxygen abundance.
There is considerable uncertainty regarding the true oxygen abundance of the ISM of high-redshift galaxies. Because oxygen abundances can only be directly measured for a rare subset of galaxies at high- (Yuan & Kewley 2009; Wuyts et al. 2012; Christensen et al. 2012; Bayliss et al. 2014; Sanders et al. 2016a), most of which are gravitationally lensed, the majority of the inferences regarding the chemical abundances of distant galaxies are based on the ratios of ionization and excitation-sensitive emission-line ratios such as N2, O3N2, and R23 (see, e.g., Pettini & Pagel 2004). Unfortunately, these metallicity diagnostics introduce systematic uncertainties as large as 0.7 dex even in the local universe (Kewley & Ellison 2008). Further, the typical emission line ratios of star-forming galaxies evolve with redshift (see Section 3.2), which manifest as large discrepancies in the abundances derived for the same high- galaxy using different strong line diagnostics (Steidel et al. 2014; Sanders et al. 2015). Thankfully, even given these considerable caveats, the high level of enrichment of the sub-DLA is constraining because all determinations of the high- mass-metallicity relation suggest that solar metallicity enrichment only occurs in very massive galaxies.
Figure 9 shows the most recent determinations of the mass-metallicity relation of star-forming galaxies based on statistical samples with uniform data. We consider metallicities determined from both the N2 (filled symbols) and O3N2 (open symbols) indicators as measured in the -band-selected MOSDEF sample (Sanders et al. 2015, green squares) and the UV-selected KBSS sample (Steidel et al. 2014; blue circles). For comparison, in pink shading we show the constraints on the abundance of the sub-DLA. Clearly, whichever galaxy responsible for the absorption system must have a high stellar mass capable of producing roughly solar metallicity enrichment. The mass of J1439B, indicated by the orange vertical shading, is consistent with the possibility that the sub-DLA is composed of gas that originated within the ISM of J1439B. Recent work studying the relationship of the masses of DLA galaxy counterparts and their measured metallicities also suggests that the mass of the galaxy associated with DLAJ1439 would be , consistent with the mass of J1439B (Møller et al. 2013; Christensen et al. 2014).
4. Discussion
While many DLAs and sub-DLAs likely originate within the central gaseous regions or extended disks of galaxies and may therefore commonly trace the in situ ISM of the galaxy, the large separation between DLAJ1439 and J1439B (38 pkpc) makes this scenario improbable. Even in the unlikely possibility that such a large gas disk or other coherent structure existed surrounding J1439B, extending 10-20 times farther than the optical light of the galaxy, we would expect the chemical enrichment of the gas at such a large distance to be significantly lower than that within the central portions of the galaxy (c.f. Kennicutt et al. 2003; Zurita & Bresolin 2012; Bresolin et al. 2016). Given that a disk origin of DLAJ1439 is disfavored, we must consider the possibility that the sub-DLA originates from either another galaxy closer to the line of sight or from ejected or stripped ISM from J1439B.
4.1. Could Another Galaxy be Responsible for DLAJ1439?
As outlined above, there is considerable evidence of a plausible connection between the galaxy J1439B and the DLAJ1439. However, if J1439B is the galaxy counterpart to the sub-DLA, it is at a larger separation than is typically found between high- absorbers and their host galaxies (Fumagalli et al. 2015, but see also Neeleman et al. 2017). Here we explore the possibility that another galaxy could be responsible for the sub-DLA.
In Section 3.4 and Figure 9, we showed that the sub-DLA’s high metallicity implies that the source of its enrichment is likely a massive galaxy with mass comparable to or greater than that of J1439B. The images shown in Figure 1 rule out the existence of another galaxy with comparable mass to J1439B lying closer to the line of sight to the QSO, unless the galaxy is hidden within the PSF of the QSO.101010The -band image of J1439B provides a 14 detection of the galaxy. As this corresponds to rest-frame Å, the luminosity is a good proxy for mass. We would detect a galaxy of comparable size but five times less luminous at 3. The other source directly east of J1439B that is visually apparent in Figure 1 has a photometric redshift computed with EAZY (Brammer et al. 2008) that is inconsistent with solutions . No other faint galaxies are detected with separations from the QSO.
Additional constraints on the existence of a galaxy very close to the line of sight to the QSO were discussed in Bouché et al. (2012) using data from the z2SIMPLE survey taken with the Spectrograph for INtegral Field Observation in the Near-Infrared (SINFONI; Eisenhauer et al. 2003) on the VLT. Bouché et al. (2012) took -band IFU spectroscopy in natural seeing of a 10” 10” field surrounding 28 QSOs, including QSO J1439+1117. Among their 28 absorbers, they detected only 4 possible host galaxies and did not detect a galaxy at the redshift of DLAJ1439.111111The position of J1439B is very near the edge of the field of view of the SINFONI observations and only received half the exposure time.
In the central 4” search area surrounding the QSOs, Bouché et al. (2012) reported a limiting H flux of , corresponding to a limiting SFR of 3.9 yr-1 uncorrected for dust, integrated over eight spectral pixels, or roughly 300 km s-1. For a galaxy analogous to J1439B with an emission line velocity dispersion km s-1, the true limit is somewhat less stringent as the line emission would be spread over a larger number of pixels. Nevertheless, the SINFONI data further demonstrate the lack of a galaxy closer to the line of sight. Bouché et al. (2012) argued that only within a 03 radius of the QSO would the SINFONI data been insensitive to the H emission from the galaxy.
The final possibility is that another galaxy lies directly on top of the line of sight to the QSO and has an unfavorable contrast ratio, leaving it undetected in the imaging and IFU observations. This is a challenging possibility to disprove, but we can quantify the likelihood in part using measurements of the pair fraction of massive galaxies.
There have been several studies aimed at quantifying the merger rate at high redshift that have measured the fraction of massive galaxies that are found with close companions. In this work, we are most interested in pairs of nearly equal mass since, as we argue in Section 3.4, the metallicity of DLAJ1439 indicates that the source of its metals is likely a galaxy of mass equal to or greater than that of J1439B. Given this, we consider the results of studies qualifying the pair fraction of 1/4 mass-ratio pairs to be an upper limit on the likelihood that another galaxy would be the primary origin of the absorber. Three recent studies have considered the incidence of satellites surrounding massive galaxies with and projected separations less than kpc, finding that of such galaxies have a likely companion at least one-quarter as massive as the primary (Newman et al. 2012a; Man et al. 2012, 2016).
In practice, we are only interested in the volume surrounding the galaxy that is closer to the line of sight to the QSO, and we have ruled out the existence of such a galaxy in the majority of that volume, but not at the precise location of the QSO line of sight. Further, we have argued that galaxies with are unlikely to be responsible for the high levels of chemical enrichment found in the sub-DLA. Given these caveats, we consider to be a very conservative upper limit on the probability that another galaxy is responsible for DLAJ1439.
4.2. Implications
If DLAJ1439 represents the ejected or stripped ISM of J1439B, it offers a rare window into the chemistry and molecular properties of the ISM in high- galaxies. As shown in Figure 8, the environment surrounding DLAJ1439 and J1439B contains several strong multiphase absorbers. Collectively, these systems probe gas within the circumgalactic medium of J1439B. Srianand et al. (2008) and Noterdaeme et al. (2008) modeled the H I absorption within 1000 km s-1 of the sub-DLA using four additional absorbing structures, all with (noted in Figure 8 by the vertical dashed lines). Absorbers with , commonly referred to as Lyman Limit Systems, are intrinsically rare, with a typical incidence of per QSO sightline at high redshift (Storrie-Lombardi et al. 1994). Therefore, the existence of five absorbers located within 1000 km s-1 of each other all with is a rare occurrence and suggests a direct relationship with the sub-DLA and likely J1439B.
We argue above that the metallicity of the sub-DLA itself is consistent with the enrichment expected for the ISM of J1439B. Given the existence of these other strong H I systems, one can further constrain the likely origin of the gas. As mentioned above, the H I absorbers are spread over km s-1. Each of these absorbers is also detected in metallic transitions with ionization potentials ranging from O I to C IV. The velocity distribution of metal line absorption is spread over km s-1 both in low- and high-ionization gas. Given the large velocity spread, we favor a wind scenario for their origin as the expected velocities associated with the gravitational potential of J1439B are significantly less than 1000 km s-1. If we assume the stellar mass – halo mass relation from Behroozi et al. (2013), J1439B has a dark matter halo mass of . Thus the virial velocity of the halo would be km s-1, far less than the velocity spread of absorbers seen in the QSO spectrum. This precludes an origin for the absorbers from either virialized gas within the CGM of the galaxy or stripped ISM resulting from an interaction. Therefore, we argue that DLAJ1439 and its surrounding absorbers provide a unique view of AGN-driven winds at high redshift.
4.2.1 The Chemical Evolution of J1439B
The detailed elemental abundances of DLAJ1439 provide insight into the nature of the ISM within the source galaxy. The abundances of S and Zn, which are typically not depleted onto dust grains, are consistent with a high level of enrichment, roughly solar metallicity (, ), and their ratios can be used to measure the level of -enhancement. In DLAJ1439 the gas is consistent with solar /Fe (Noterdaeme et al. 2008). This is notable given the significant -enhancements that are common in the old stars within giant elliptical galaxies (Worthey et al. 1992; Henry & Worthey 1999; Trager et al. 2000; Thomas et al. 2005), and the recent finding of super-solar O/Fe [ (O/Fe)⊙] in UV-selected star-forming galaxies at the same cosmic epoch (Steidel et al. 2016). Interestingly, Noterdaeme et al. (2008) argue that the N/O ratio in DLAJ1439 also appears to be consistent with the solar ratio, again somewhat at odds with the recent determination of [N/O] in star-forming galaxies at from Steidel et al. (2016). Both the /Fe and N/O ratios suggest a level of chemical maturity associated with prolonged star formation histories, consistent with the Gyr age estimate of J1439B from the SED fitting.
Comparison of refractory and volatile elemental abundances provide some constraint on the amount and type of dust in DLAJ1439 (Pettini et al. 1997a; Wolfe et al. 2003). Shaw et al. (2016) considered detailed models of DLAJ1439 and noted that the dust-to-gas ratio inferred for the sub-DLA is dependent on which volatile element is used in the calculation. Employing the measured [Fe/Zn] abundance, they infer a dust-to-gas ratio nearly twice the value in the Milky Way, whereas when using [Fe/S] they find a ratio very similar to the Milky Way value. Regardless of which value is used, however, DLAJ1439 is again atypical of damped absorbers which have a typical dust-to-gas ratio roughly 30 times lower than the Milky Way (Pettini et al. 1997a). The large amount of dust in the system is consistent with its significant degree of chemical enrichment, and further supports the scenario in which the sub-DLA is related to a massive evolved galaxy such as J1439B.
4.2.2 AGN-driven Outflows
The origin of molecular gas in outflows is debated. Some theoretical arguments favor the direct expulsion of molecular gas through energy-conserving winds (Faucher-Giguère & Quataert 2012; Zubovas & Nayakshin 2014; Tombesi et al. 2015), while in other models the molecular gas forms in situ in dusty outflows due to cooling instabilities (Ferrara & Scannapieco 2016). Regardless of their origin, however, outflows containing molecular gas have been definitively observed in several local AGN and QSOs (Feruglio et al. 2010; Alatalo et al. 2011; Sturm et al. 2011), extending in some cases over many kiloparsecs (Cicone et al. 2014). Extended outflows have also been observed in multiple phases, both in ionized (Greene et al. 2012; Liu et al. 2013a, b, 2014; Hainline et al. 2014; Sun et al. 2017; Yuma et al. 2017) and [C II]-emitting gas (Cicone et al. 2015; Maiolino et al. 2012) at both high and low redshift. Harrison et al. (2014) considered a sample of 16 type 2 AGN, finding that all of them had ionized gas emission lines similar to those observed in J1439B with km s-1, and that 70% of such galaxies have outflows that extend over kpc scales.
Interestingly, many authors have noted a relationship between the detected extent of the ionized outflow and the luminosity of the AGN (Liu et al. 2013a, b, 2014; Hainline et al. 2014; Sun et al. 2017). In particular, extended ionized outflows seem to be most common in AGN with erg s-1 (Sun et al. 2017). Following, Reyes et al. (2008) and Liu et al. (2009), who derived a relationship between the bolometric luminosity of AGN and the luminosity of their [O III] emission, we calculate erg s, which would imply erg s-1. This suggests that the AGN in J1439B is comparably luminous to the class of lower-redshift AGN that have been shown to drive outflows.
While clearly uncertain, it is plausible that the DLAJ1439 represents wind material from an AGN-driven outflow from J1439B. In that case, the J1439 DLA-galaxy system offers many unique clues about the nature of such a wind. In particular, given the detection at 38 kpc, J1439 provides spatial information about the extent of the wind through a more sensitive probe than in emission. Additionally, the properties of the gas can be studied in much greater detail through the sub-DLA’s absorption lines, providing high-fidelity measurements of the chemistry, density, and kinematics of the gas at large distances from the galaxy.
Given the measurement of and in this sub-DLA by Srianand et al. (2008), it is possible to measure . This is significantly less than the value typical of star-forming regions in the local universe, where (Lacy et al. 1994). The ratio is comparable to values observed in diffuse clouds in the Galaxy, but at fixed , DLAJ1439 has 0.5-1 dex more CO (Burgh et al. 2007; Sheffer et al. 2008). Using the ratio of fine-structure carbon absorption lines, Srianand et al. (2008) also derived a density of the sub-DLA to be cm-3, comparable to, although somewhat lower than, the typical densities in diffuse clouds within the ISM of the Milky Way (Snow & McCall 2006). Taken together, these two measurements suggest that the physical properties of the gas are likely similar to that of diffuse Galactic clouds.
In addition to the properties of the gas and their implications for its physical state, the kinematics of the various absorption components are also of interest. In Figure 8, one can clearly see a number of distinct metallic absorption features. While the redshift of the galaxy is well aligned with the strongest components of the neutral and low-ionization gas (, km s-1), the majority of the metal line absorption systems lie blue-shifted with respect to both the sub-DLA and J1439B, with the highest-velocity absorbers detected in low-ionization (e.g. O I, Si II) as well as high-ionization (e.g. C IV) lines extending to and km s-1 respectively. Redshifted metal lines extend to less than 100 km s-1 in the opposite direction.
As we argue above, the large velocity spread of the metal-line absorbers detected in the QSO spectrum are inconsistent with a gravitational origin, given the mass of J1439B. The most plausible scenario is that the absorbers result from a wind with an outflow velocity km s-1, again suggestive of AGN driving. In the context of an outflow model with a constant outflow velocity, the kinematics of the absorbing gas provide a joint constraint on the opening angle of the outflow and the outflow velocity. For an outflow velocity of 3000 km s-1 or less, the opening angle would be larger than 20 degrees.
The presence and high fraction of molecular gas within the sub-DLA [; (Srianand et al. 2008)] is also of considerable interest. In particular, if the absorbing gas was ejected from J1439B in its present state (as opposed to formed within the outflow), it would provide a possible explanation for the galaxy’s anemic SFR, given that the direct fuel for star formation would have been removed.
In addition to this, the most likely scenario is that this gas escapes completely from the halo. As mentioned above, we assume the stellar mass – halo mass relation from Behroozi et al. (2013) to infer that J1439B has a dark matter halo mass of . The measured velocity range in the metal line absorbers ( km s-1) is comparable to the escape velocity of the halo at a distance of 38 kpc. So if DLAJ1439 is the ejected ISM of J1439B, it represents the permanent removal of star-formation-ready material from a galaxy, a very effective and long-lasting form of feedback.
4.2.3 Timescales
Lastly, we comment briefly on the timescales of interest implied by the inferred velocities of the wind and the distance between J1439B and the QSO line of sight. In Section 3.3.2, we argue that the large measured emission-line velocity dispersion of J1439B is most likely due to an AGN-driven wind. This suggests a lower limit for the current outflowing wind speed of 300 km s-1. Above in Section 4.2.2, we discuss the possibility of a 1000 km s-1 outflow based on the kinematics of the gas detected in absorption. Noting the projected distance between the galaxy and the QSO line of sight of 38 kpc, it would take years for gas traveling at 300 km s-1 to cover this distance. If that gas were instead ejected at 1000 km s-1, it would require only years. Either of these timescales is significantly shorter than the typical age of the stars suggested by the SED fit (700 Myr). This is consistent with the high levels of enrichment measured in the sub-DLA; a majority of the stars in the galaxy would have formed prior to the ejection of the gas, enriching the ISM to the solar metallicity value measured. Further, the travel time required is similar to the expected lifetime of AGN in the distant universe (Haiman & Loeb 1998; Haehnelt et al. 1998a; Yu & Tremaine 2002; Martini 2004; Hopkins & Hernquist 2009).
5. Summary
We report the discovery of a galaxy 38 kpc from the sightline to QSO J1439+1117 coincident with the redshift of the CO-bearing, solar-metallicity sub-DLA. We presented optical and NIR photometry of the galaxies as well as SED fits showing that the galaxy is massive () and evolved (Section 2.5 and Figure 2). A NIR spectrum of the galaxy, J1439B, observed with Magellan/FIRE, shows broad [O III] emission ( km s-1) as well as [N II] and H emission (Section 2.6 and Figure 4).
Based on the properties of the galaxy and the sub-DLA, we argue that there is a plausible connection between J1439B and DLAJ1439:
- •
- •
- •
- •
In Section 4.1, we explored the possibility that another galaxy might lie closer to the line of sight and be the true galactic counterpart to the sub-DLA. Based on our imaging data, as well as published IFU spectroscopy, we conclude that another massive galaxy does not lie closer to the line of sight, unless it is coincident with the QSO sightline. Based on pair statistics for massive high-redshift galaxies, we conclude that there is no more than a 15% chance that another massive galaxy lies within 40 kpc of the line of sight.
We conclude that J1439B is likely the galactic counterpart of DLAJ1439, and that the sub-DLA is most likely the ISM ejected by the AGN. In this scenario, the properties of DLAJ1439 offer a rare view of the chemistry of the ISM close to a high-redshift AGN, and of the state of gas driven out by AGN feedback. The sub-DLA has solar /Fe and N/O abundance ratios, suggesting that the galaxy is quite chemically evolved with a longer star formation history. The molecular properties of the sub-DLA are most similar to that of diffuse clouds in the Milky Way, and the dust-to-gas ratio is similar to or larger than that of the Milky Way. Metal line absorption is detected with a large velocity spread ( km s-1), implying large outflow velocities if the gas results from a wind from J1439B. At a distance of 38 kpc, the large velocity spread also suggests much of the absorbing material would be unbound from J1439B. Given the significant molecular gas content within the sub-DLA, this would represent the ejection of gas that otherwise would have likely undergone star formation.
The collective properties of J1439B and DLAJ1439 are consistent with the picture in which AGN play an active role in modulating the star formation of massive, high-redshift galaxies. Confirmation of the X-ray and radio properties of J1439B would provide better understanding of the nature of the AGN, and the detection of extended molecular emission would cement the connection between J1439B and DLAJ1439. These further observations provide a unique opportunity to obtain a more detailed view of AGN feedback in the high-redshift universe.
References
- Abazajian et al. (2009) Abazajian, K. N., Adelman-McCarthy, J. K., Agüeros, M. A., et al. 2009, ApJS, 182, 543
- Abramson et al. (2014) Abramson, L. E., Kelson, D. D., Dressler, A., et al. 2014, ApJ, 785, L36
- Alatalo et al. (2011) Alatalo, K., Blitz, L., Young, L. M., et al. 2011, ApJ, 735, 88
- Azadi et al. (2017) Azadi, M., Coil, A. L., Aird, J., et al. 2017, ApJ, 835, 27
- Bagdonaite et al. (2014) Bagdonaite, J., Ubachs, W., Murphy, M. T., & Whitmore, J. B. 2014, ApJ, 782, 10
- Baldwin et al. (1981) Baldwin, J. A., Phillips, M. M., & Terlevich, R. 1981, PASP, 93, 5
- Barro et al. (2016) Barro, G., Faber, S. M., Dekel, A., et al. 2016, ApJ, 820, 120
- Bayliss et al. (2014) Bayliss, M. B., Rigby, J. R., Sharon, K., et al. 2014, ApJ, 790, 144
- Behroozi et al. (2013) Behroozi, P. S., Wechsler, R. H., & Conroy, C. 2013, ApJ, 770, 57
- Belli et al. (2014) Belli, S., Newman, A. B., & Ellis, R. S. 2014, ApJ, 783, 117
- Belli et al. (2017) —. 2017, ApJ, 834, 18
- Benson et al. (2003) Benson, A. J., Bower, R. G., Frenk, C. S., et al. 2003, ApJ, 599, 38
- Bertin & Arnouts (1996) Bertin, E., & Arnouts, S. 1996, A&AS, 117, 393
- Bird et al. (2015) Bird, S., Haehnelt, M., Neeleman, M., et al. 2015, MNRAS, 447, 1834
- Bouché et al. (2013) Bouché, N., Murphy, M. T., Kacprzak, G. G., et al. 2013, Science, 341, 50
- Bouché et al. (2012) Bouché, N., Murphy, M. T., Péroux, C., et al. 2012, MNRAS, 419, 2
- Brammer et al. (2008) Brammer, G. B., van Dokkum, P. G., & Coppi, P. 2008, ApJ, 686, 1503
- Bresolin et al. (2016) Bresolin, F., Kudritzki, R.-P., Urbaneja, M. A., et al. 2016, ApJ, 830, 64
- Brinchmann et al. (2004) Brinchmann, J., Charlot, S., White, S. D. M., et al. 2004, MNRAS, 351, 1151
- Bruzual & Charlot (2003) Bruzual, G., & Charlot, S. 2003, MNRAS, 344, 1000
- Burgh et al. (2007) Burgh, E. B., France, K., & McCandliss, S. R. 2007, ApJ, 658, 446
- Calzetti et al. (2000) Calzetti, D., Armus, L., Bohlin, R. C., et al. 2000, ApJ, 533, 682
- Chabrier (2003) Chabrier, G. 2003, PASP, 115, 763
- Christensen et al. (2014) Christensen, L., Møller, P., Fynbo, J. P. U., & Zafar, T. 2014, MNRAS, 445, 225
- Christensen et al. (2012) Christensen, L., Laursen, P., Richard, J., et al. 2012, MNRAS, 427, 1973
- Cicone et al. (2014) Cicone, C., Maiolino, R., Sturm, E., et al. 2014, A&A, 562, A21
- Cicone et al. (2015) Cicone, C., Maiolino, R., Gallerani, S., et al. 2015, A&A, 574, A14
- Coil et al. (2015) Coil, A. L., Aird, J., Reddy, N., et al. 2015, ApJ, 801, 35
- Cole et al. (1994) Cole, S., Aragon-Salamanca, A., Frenk, C. S., Navarro, J. F., & Zepf, S. E. 1994, MNRAS, 271, 781
- Cooke et al. (2006) Cooke, J., Wolfe, A. M., Gawiser, E., & Prochaska, J. X. 2006, ApJ, 652, 994
- Cooke et al. (2010) Cooke, R., Pettini, M., Steidel, C. C., et al. 2010, MNRAS, 409, 679
- Croton et al. (2006) Croton, D. J., Springel, V., White, S. D. M., et al. 2006, MNRAS, 365, 11
- Daddi et al. (2007) Daddi, E., Dickinson, M., Morrison, G., et al. 2007, ApJ, 670, 156
- Dekker et al. (2000) Dekker, H., D’Odorico, S., Kaufer, A., Delabre, B., & Kotzlowski, H. 2000, in Proc. SPIE, Vol. 4008, Optical and IR Telescope Instrumentation and Detectors, ed. M. Iye & A. F. Moorwood, 534–545
- Dessauges-Zavadsky et al. (2003) Dessauges-Zavadsky, M., Péroux, C., Kim, T.-S., D’Odorico, S., & McMahon, R. G. 2003, MNRAS, 345, 447
- Dressler et al. (2011) Dressler, A., Bigelow, B., Hare, T., et al. 2011, PASP, 123, 288
- Efstathiou (2000) Efstathiou, G. 2000, MNRAS, 317, 697
- Eisenhauer et al. (2003) Eisenhauer, F., Abuter, R., Bickert, K., et al. 2003, in Proc. SPIE, Vol. 4841, Instrument Design and Performance for Optical/Infrared Ground-based Telescopes, ed. M. Iye & A. F. M. Moorwood, 1548–1561
- Erb (2008) Erb, D. K. 2008, ApJ, 674, 151
- Faucher-Giguère & Quataert (2012) Faucher-Giguère, C.-A., & Quataert, E. 2012, MNRAS, 425, 605
- Ferrara & Scannapieco (2016) Ferrara, A., & Scannapieco, E. 2016, ApJ, 833, 46
- Feruglio et al. (2010) Feruglio, C., Maiolino, R., Piconcelli, E., et al. 2010, A&A, 518, L155
- Finlator & Davé (2008) Finlator, K., & Davé, R. 2008, MNRAS, 385, 2181
- Font-Ribera et al. (2012) Font-Ribera, A., Miralda-Escudé, J., Arnau, E., et al. 2012, JCAP, 11, 059
- Förster Schreiber et al. (2014) Förster Schreiber, N. M., Genzel, R., Newman, S. F., et al. 2014, ApJ, 787, 38
- Fumagalli et al. (2010) Fumagalli, M., O’Meara, J. M., Prochaska, J. X., & Kanekar, N. 2010, MNRAS, 408, 362
- Fumagalli et al. (2015) Fumagalli, M., O’Meara, J. M., Prochaska, J. X., Rafelski, M., & Kanekar, N. 2015, MNRAS, 446, 3178
- Fynbo et al. (2010) Fynbo, J. P. U., Laursen, P., Ledoux, C., et al. 2010, MNRAS, 408, 2128
- Fynbo et al. (2011) Fynbo, J. P. U., Ledoux, C., Noterdaeme, P., et al. 2011, MNRAS, 413, 2481
- Genzel et al. (2014) Genzel, R., Förster Schreiber, N. M., Rosario, D., et al. 2014, ApJ, 796, 7
- Greene et al. (2012) Greene, J. E., Zakamska, N. L., & Smith, P. S. 2012, ApJ, 746, 86
- Haehnelt et al. (1998a) Haehnelt, M. G., Natarajan, P., & Rees, M. J. 1998a, MNRAS, 300, 817
- Haehnelt et al. (1998b) Haehnelt, M. G., Steinmetz, M., & Rauch, M. 1998b, ApJ, 495, 647
- Haiman & Loeb (1998) Haiman, Z., & Loeb, A. 1998, ApJ, 503, 505
- Hainline et al. (2014) Hainline, K. N., Hickox, R. C., Greene, J. E., et al. 2014, ApJ, 787, 65
- Harrison et al. (2014) Harrison, C. M., Alexander, D. M., Mullaney, J. R., & Swinbank, A. M. 2014, MNRAS, 441, 3306
- Hartoog et al. (2015) Hartoog, O. E., Fynbo, J. P. U., Kaper, L., De Cia, A., & Bagdonaite, J. 2015, MNRAS, 447, 2738
- Henry & Worthey (1999) Henry, R. B. C., & Worthey, G. 1999, PASP, 111, 919
- Hill et al. (2016) Hill, A. R., Muzzin, A., Franx, M., & van de Sande, J. 2016, ApJ, 819, 74
- Hopkins & Hernquist (2009) Hopkins, P. F., & Hernquist, L. 2009, ApJ, 698, 1550
- Hopkins et al. (2012) Hopkins, P. F., Quataert, E., & Murray, N. 2012, MNRAS, 421, 3522
- Jorgenson et al. (2013) Jorgenson, R. A., Murphy, M. T., & Thompson, R. 2013, MNRAS, 435, 482
- Jorgenson & Wolfe (2014) Jorgenson, R. A., & Wolfe, A. M. 2014, ApJ, 785, 16
- Juneau et al. (2011) Juneau, S., Dickinson, M., Alexander, D. M., & Salim, S. 2011, ApJ, 736, 104
- Kashikawa et al. (2014) Kashikawa, N., Misawa, T., Minowa, Y., et al. 2014, ApJ, 780, 116
- Kauffmann et al. (1999) Kauffmann, G., Colberg, J. M., Diaferio, A., & White, S. D. M. 1999, MNRAS, 303, 188
- Kauffmann et al. (2003) Kauffmann, G., Heckman, T. M., Tremonti, C., et al. 2003, MNRAS, 346, 1055
- Kelson (2014) Kelson, D. D. 2014, arXiv:1406.5191
- Kelson et al. (2014) Kelson, D. D., Williams, R. J., Dressler, A., et al. 2014, ApJ, 783, 110
- Kennicutt et al. (2003) Kennicutt, Jr., R. C., Bresolin, F., & Garnett, D. R. 2003, ApJ, 591, 801
- Kewley et al. (2001) Kewley, L. J., Dopita, M. A., Sutherland, R. S., Heisler, C. A., & Trevena, J. 2001, ApJ, 556, 121
- Kewley & Ellison (2008) Kewley, L. J., & Ellison, S. L. 2008, ApJ, 681, 1183
- Kewley et al. (2013) Kewley, L. J., Maier, C., Yabe, K., et al. 2013, ApJ, 774, L10
- Kriek et al. (2009) Kriek, M., van Dokkum, P. G., Labbé, I., et al. 2009, ApJ, 700, 221
- Krogager et al. (2012) Krogager, J.-K., Fynbo, J. P. U., Møller, P., et al. 2012, MNRAS, 424, L1
- Lacy et al. (1994) Lacy, J. H., Knacke, R., Geballe, T. R., & Tokunaga, A. T. 1994, ApJ, 428, L69
- Lau et al. (2016) Lau, M. W., Prochaska, J. X., & Hennawi, J. F. 2016, ApJS, 226, 25
- Lehner et al. (2014) Lehner, N., O’Meara, J. M., Fox, A. J., et al. 2014, ApJ, 788, 119
- Liszt (2015) Liszt, H. S. 2015, ApJ, 799, 66
- Liu et al. (2014) Liu, G., Zakamska, N. L., & Greene, J. E. 2014, MNRAS, 442, 1303
- Liu et al. (2013a) Liu, G., Zakamska, N. L., Greene, J. E., Nesvadba, N. P. H., & Liu, X. 2013a, MNRAS, 430, 2327
- Liu et al. (2013b) —. 2013b, MNRAS, 436, 2576
- Liu et al. (2009) Liu, X., Zakamska, N. L., Greene, J. E., et al. 2009, ApJ, 702, 1098
- Maiolino et al. (2012) Maiolino, R., Gallerani, S., Neri, R., et al. 2012, MNRAS, 425, L66
- Man et al. (2012) Man, A. W. S., Toft, S., Zirm, A. W., Wuyts, S., & van der Wel, A. 2012, ApJ, 744, 85
- Man et al. (2016) Man, A. W. S., Zirm, A. W., & Toft, S. 2016, ApJ, 830, 89
- Martini (2004) Martini, P. 2004, Coevolution of Black Holes and Galaxies, 169
- Masters et al. (2014) Masters, D., McCarthy, P., Siana, B., et al. 2014, ApJ, 785, 153
- Meiring et al. (2009) Meiring, J. D., Lauroesch, J. T., Kulkarni, V. P., et al. 2009, MNRAS, 397, 2037
- Møller et al. (2004) Møller, P., Fynbo, J. P. U., & Fall, S. M. 2004, A&A, 422, L33
- Møller et al. (2013) Møller, P., Fynbo, J. P. U., Ledoux, C., & Nilsson, K. K. 2013, MNRAS, 430, 2680
- Møller & Warren (1993) Møller, P., & Warren, S. J. 1993, A&A, 270, 43
- Møller et al. (2002) Møller, P., Warren, S. J., Fall, S. M., Fynbo, J. U., & Jakobsen, P. 2002, ApJ, 574, 51
- Monier et al. (2009) Monier, E. M., Turnshek, D. A., & Rao, S. 2009, MNRAS, 397, 943
- Murphy (2016) Murphy, M. T. 2016, UVES popler: POst PipeLine Echelle Reduction software
- Murphy et al. (2007) Murphy, M. T., Tzanavaris, P., Webb, J. K., & Lovis, C. 2007, MNRAS, 378, 221
- Murray et al. (2011) Murray, N., Ménard, B., & Thompson, T. A. 2011, ApJ, 735, 66
- Neeleman et al. (2017) Neeleman, M., Kanekar, N., Prochaska, J. X., et al. 2017, Science, 355, 1285
- Neeleman et al. (2013) Neeleman, M., Wolfe, A. M., Prochaska, J. X., & Rafelski, M. 2013, ApJ, 769, 54
- Newman et al. (2015) Newman, A. B., Belli, S., & Ellis, R. S. 2015, ApJ, 813, L7
- Newman et al. (2012a) Newman, A. B., Ellis, R. S., Bundy, K., & Treu, T. 2012a, ApJ, 746, 162
- Newman et al. (2012b) Newman, S. F., Genzel, R., Förster-Schreiber, N. M., et al. 2012b, ApJ, 761, 43
- Noeske et al. (2007) Noeske, K. G., Weiner, B. J., Faber, S. M., et al. 2007, ApJ, 660, L43
- Noterdaeme et al. (2008) Noterdaeme, P., Petitjean, P., Ledoux, C., Srianand, R., & Ivanchik, A. 2008, A&A, 491, 397
- Noterdaeme et al. (2012a) Noterdaeme, P., Petitjean, P., Carithers, W. C., et al. 2012a, A&A, 547, L1
- Noterdaeme et al. (2012b) Noterdaeme, P., Laursen, P., Petitjean, P., et al. 2012b, A&A, 540, A63
- Oke & Gunn (1983) Oke, J. B., & Gunn, J. E. 1983, ApJ, 266, 713
- O’Meara et al. (2007) O’Meara, J. M., Prochaska, J. X., Burles, S., et al. 2007, ApJ, 656, 666
- Pagel (2009) Pagel, B. E. J. 2009, Nucleosynthesis and Chemical Evolution of Galaxies (Cambridge University Press)
- Peng et al. (2002) Peng, C. Y., Ho, L. C., Impey, C. D., & Rix, H.-W. 2002, AJ, 124, 266
- Peng et al. (2010a) —. 2010a, AJ, 139, 2097
- Peng et al. (2010b) Peng, Y.-j., Lilly, S. J., Kovač, K., et al. 2010b, ApJ, 721, 193
- Péroux et al. (2013) Péroux, C., Bouché, N., Kulkarni, V. P., & York, D. G. 2013, MNRAS, 436, 2650
- Péroux et al. (2011) Péroux, C., Bouché, N., Kulkarni, V. P., York, D. G., & Vladilo, G. 2011, MNRAS, 410, 2237
- Péroux et al. (2012) —. 2012, MNRAS, 419, 3060
- Persson et al. (2013) Persson, S. E., Murphy, D. C., Smee, S., et al. 2013, PASP, 125, 654
- Pettini et al. (1997a) Pettini, M., King, D. L., Smith, L. J., & Hunstead, R. W. 1997a, ApJ, 478, 536
- Pettini & Pagel (2004) Pettini, M., & Pagel, B. E. J. 2004, MNRAS, 348, L59
- Pettini et al. (2001) Pettini, M., Shapley, A. E., Steidel, C. C., et al. 2001, ApJ, 554, 981
- Pettini et al. (1997b) Pettini, M., Smith, L. J., King, D. L., & Hunstead, R. W. 1997b, ApJ, 486, 665
- Pontzen et al. (2008) Pontzen, A., Governato, F., Pettini, M., et al. 2008, MNRAS, 390, 1349
- Prochaska & Wolfe (1997) Prochaska, J. X., & Wolfe, A. M. 1997, ApJ, 487, 73
- Rafelski et al. (2011) Rafelski, M., Wolfe, A. M., & Chen, H.-W. 2011, ApJ, 736, 48
- Rafelski et al. (2012) Rafelski, M., Wolfe, A. M., Prochaska, J. X., Neeleman, M., & Mendez, A. J. 2012, ApJ, 755, 89
- Reddy et al. (2012) Reddy, N. A., Pettini, M., Steidel, C. C., et al. 2012, ApJ, 754, 25
- Reyes et al. (2008) Reyes, R., Zakamska, N. L., Strauss, M. A., et al. 2008, AJ, 136, 2373
- Rodighiero et al. (2011) Rodighiero, G., Daddi, E., Baronchelli, I., et al. 2011, ApJ, 739, L40
- Rubin et al. (2015) Rubin, K. H. R., Hennawi, J. F., Prochaska, J. X., et al. 2015, ApJ, 808, 38
- Rudie et al. (2012) Rudie, G. C., Steidel, C. C., Trainor, R. F., et al. 2012, ApJ, 750, 67
- Sanders et al. (2015) Sanders, R. L., Shapley, A. E., Kriek, M., et al. 2015, ApJ, 799, 138
- Sanders et al. (2016a) —. 2016a, ApJ, 825, L23
- Sanders et al. (2016b) —. 2016b, ApJ, 816, 23
- Schlafly & Finkbeiner (2011) Schlafly, E. F., & Finkbeiner, D. P. 2011, ApJ, 737, 103
- Shapley et al. (2003) Shapley, A. E., Steidel, C. C., Pettini, M., & Adelberger, K. L. 2003, ApJ, 588, 65
- Shapley et al. (2015) Shapley, A. E., Reddy, N. A., Kriek, M., et al. 2015, ApJ, 801, 88
- Shaw et al. (2016) Shaw, G., Rawlins, K., & Srianand, R. 2016, MNRAS, 459, 3234
- Sheffer et al. (2008) Sheffer, Y., Rogers, M., Federman, S. R., et al. 2008, ApJ, 687, 1075
- Shivaei et al. (2015) Shivaei, I., Reddy, N. A., Shapley, A. E., et al. 2015, ApJ, 815, 98
- Simcoe et al. (2013) Simcoe, R. A., Burgasser, A. J., Schechter, P. L., et al. 2013, PASP, 125, 270
- Snow & McCall (2006) Snow, T. P., & McCall, B. J. 2006, ARA&A, 44, 367
- Somerville & Primack (1999) Somerville, R. S., & Primack, J. R. 1999, MNRAS, 310, 1087
- Srianand et al. (2016) Srianand, R., Hussain, T., Noterdaeme, P., et al. 2016, MNRAS, 460, 634
- Srianand et al. (2008) Srianand, R., Noterdaeme, P., Ledoux, C., & Petitjean, P. 2008, A&A, 482, L39
- Steidel et al. (2010) Steidel, C. C., Erb, D. K., Shapley, A. E., et al. 2010, ApJ, 717, 289
- Steidel et al. (2016) Steidel, C. C., Strom, A. L., Pettini, M., et al. 2016, ApJ, 826, 159
- Steidel et al. (2014) Steidel, C. C., Rudie, G. C., Strom, A. L., et al. 2014, ApJ, 795, 165
- Storey & Zeippen (2000) Storey, P. J., & Zeippen, C. J. 2000, MNRAS, 312, 813
- Storrie-Lombardi et al. (1994) Storrie-Lombardi, L. J., McMahon, R. G., Irwin, M. J., & Hazard, C. 1994, ApJ, 427, L13
- Strom et al. (2017) Strom, A. L., Steidel, C. C., Rudie, G. C., et al. 2017, ApJ, 836, 164
- Sturm et al. (2011) Sturm, E., González-Alfonso, E., Veilleux, S., et al. 2011, ApJ, 733, L16
- Sulentic et al. (2000) Sulentic, J. W., Marziani, P., & Dultzin-Hacyan, D. 2000, ARA&A, 38, 521
- Sun et al. (2017) Sun, A.-L., Greene, J. E., & Zakamska, N. L. 2017, ApJ, 835, 222
- Thomas et al. (2005) Thomas, D., Maraston, C., Bender, R., & Mendes de Oliveira, C. 2005, ApJ, 621, 673
- Toft et al. (2012) Toft, S., Gallazzi, A., Zirm, A., et al. 2012, ApJ, 754, 3
- Tombesi et al. (2015) Tombesi, F., Meléndez, M., Veilleux, S., et al. 2015, Nature, 519, 436
- Trager et al. (2000) Trager, S. C., Faber, S. M., Worthey, G., & González, J. J. 2000, AJ, 119, 1645
- Trujillo et al. (2006) Trujillo, I., Förster Schreiber, N. M., Rudnick, G., et al. 2006, ApJ, 650, 18
- Turner et al. (2014) Turner, M. L., Schaye, J., Steidel, C. C., Rudie, G. C., & Strom, A. L. 2014, MNRAS, 445, 794
- Turner et al. (2015) —. 2015, MNRAS, 450, 2067
- Tytler (1987) Tytler, D. 1987, ApJ, 321, 49
- van de Sande et al. (2013) van de Sande, J., Kriek, M., Franx, M., et al. 2013, ApJ, 771, 85
- van Dokkum et al. (2009) van Dokkum, P. G., Kriek, M., & Franx, M. 2009, Nature, 460, 717
- van Dokkum et al. (2008) van Dokkum, P. G., Franx, M., Kriek, M., et al. 2008, ApJ, 677, L5
- van Dokkum et al. (2015) van Dokkum, P. G., Nelson, E. J., Franx, M., et al. 2015, ApJ, 813, 23
- Veilleux & Osterbrock (1987) Veilleux, S., & Osterbrock, D. E. 1987, ApJS, 63, 295
- Weatherley et al. (2005) Weatherley, S. J., Warren, S. J., Møller, P., et al. 2005, MNRAS, 358, 985
- Whitaker et al. (2012) Whitaker, K. E., van Dokkum, P. G., Brammer, G., & Franx, M. 2012, ApJ, 754, L29
- White & Frenk (1991) White, S. D. M., & Frenk, C. S. 1991, ApJ, 379, 52
- Wolfe et al. (2005) Wolfe, A. M., Gawiser, E., & Prochaska, J. X. 2005, ARA&A, 43, 861
- Wolfe et al. (2003) Wolfe, A. M., Prochaska, J. X., & Gawiser, E. 2003, ApJ, 593, 215
- Worthey et al. (1992) Worthey, G., Faber, S. M., & Gonzalez, J. J. 1992, ApJ, 398, 69
- Wuyts et al. (2012) Wuyts, E., Rigby, J. R., Sharon, K., & Gladders, M. D. 2012, ApJ, 755, 73
- Wuyts et al. (2011) Wuyts, S., Förster Schreiber, N. M., van der Wel, A., et al. 2011, ApJ, 742, 96
- York et al. (2000) York, D. G., Adelman, J., Anderson, Jr., J. E., et al. 2000, AJ, 120, 1579
- Yu & Tremaine (2002) Yu, Q., & Tremaine, S. 2002, MNRAS, 335, 965
- Yuan & Kewley (2009) Yuan, T.-T., & Kewley, L. J. 2009, ApJ, 699, L161
- Yuma et al. (2017) Yuma, S., Ouchi, M., Drake, A. B., et al. 2017, ApJ, 841, 93
- Zafar et al. (2017) Zafar, T., Møller, P., Péroux, C., et al. 2017, MNRAS, 465, 1613
- Zafar et al. (2013) Zafar, T., Popping, A., & Péroux, C. 2013, A&A, 556, A140
- Zubovas & Nayakshin (2014) Zubovas, K., & Nayakshin, S. 2014, MNRAS, 440, 2625
- Zurita & Bresolin (2012) Zurita, A., & Bresolin, F. 2012, MNRAS, 427, 1463