Powders & Grains 2017
Pomelo, a tool for computing Generic Set Voronoi Diagrams of Aspherical Particles of Arbitrary Shape
Abstract
We describe the development of a new software tool, called "Pomelo", for the calculation of Set Voronoi diagrams. Voronoi diagrams are a spatial partition of the space around the particles into separate Voronoi cells, e.g. applicable to granular materials. A generalization of the conventional Voronoi diagram for points or monodisperse spheres is the Set Voronoi diagram, also known as navigational map or tessellation by zone of influence. In this construction, a Set Voronoi cell contains the volume that is closer to the surface of one particle than to the surface of any other particle. This is required for aspherical or polydisperse systems.
Pomelo is designed to be easy to use and as generic as possible. It directly supports common particle shapes and offers a generic mode, which allows to deal with any type of particles that can be described mathematically. Pomelo can create output in different standard formats, which allows direct visualization and further processing. Finally, we describe three applications of the Set Voronoi code in granular and soft matter physics, namely the problem of packings of ellipsoidal particles with varying degrees of particle-particle friction, mechanical stable packings of tetrahedra and a model for liquid crystal systems of particles with shapes reminiscent of pears.
The analysis of geometries and structures on a micro scale level is an important aspect of granular and soft matter physics to attain knowledge about many interesting properties of particle packings, including contact numbers, anisotropy, local volume fraction, etc. RefHecke ; RefAste ; RefWang .
A well-established concept is the so called Voronoi Diagram. Here, the system is investigated by dividing the space into separate cells in respect to the positions of the center of the particles.
A cell assigned to a certain particle is defined as the space (or region of space) that contains all the volume closer to the center of this specific particle than to any other one (see figure 1 left).
This partition of space, however, only yields precise results for monodisperse spheres as the construction fails otherwise due to morphological properties of the objects.
For nonspherical or polydisperse particles the classical Voronoi diagram is of limited usefullnes, as shown in figure 1 (center) for a system of bidisperse spheres.
A generalized version of the Voronoi Diagram, the Set Voronoi Diagram RefSchaller2013 , also known as navigational map RefLuchnikov or tessellation by zone of influence RefPreteux , has to be applied.
In this case the cells contain all space around the particle which is closer to the particle’s surface than to the surface of any other particle.
Figure 1 (right) shows the Set Voronoi Diagram of a mixture of differently shaped particles.
Here we introduce a software tool called Pomelo, which calculates Set Voronoi Diagrams based on the algorithm described in RefSchaller2013 .
Pomelo is particularly versatile due to its ability to generically handle any arbitrary shape which can be described mathematically.
For instance objects neither have to be convex nor simply connected.
In the first step of the algorithm (figure 2 left) a triangulation of the particle’s bounding surface is generated to sample its shape.
Pomelo offers functionality for some common particle shapes, but the user is can also specify generic particle shapes.
After the discretisation of the surface the system is tessellated by calculating the classical Voronoi diagram of all surface points of this triangulation.
This is shown in figure 2 (center).
To get the Set Voronoi tessellation of the system, cells belonging to points on the same particle surface are merged to a single cell in the last step (figure 2 right).
The resulting partition represents the Set Voronoi Diagram of the system.
With this algorithm, systems and mixtures of particles of any arbitrary shape can be treated.
1 Pomelo
Pomelo is a generic Set Voronoi tool written in c++11 and licensed under GPL3. Pomelo can be downloaded, see ref. RefPomeloDownload , as well as all instructions regarding setting up, building and using Pomelo. The system requirements are g++ 4.9.2 or clang++ 3.5.0-10 or any higher version.
While Pomelo can directly handle common particle shapes (mono- and polydisperse spheres, tetrahedra, ellipsoids and spherocylinders), it also provides a generic mode. The latter works for any shape which surface can be described mathematically. The following two sections will describe how to use Pomelo in both cases. To use Pomelo in generic mode (see section 1.2), lib-lua 5.2 or higher is required.
1.1 Common Particle Shapes
Particle shapes that are intrinsically supported by Pomelo are mono- and polydisperse spheres, tetrahedra, spherocylinders and ellipsoids. Pomelo comes with a set of demos and tests.
One test case is a set of polydisperse spheres in a cubic cell. The input is a xyzr file. Its first line is the number of particles. The second line is a comment which contains some information (separated by comma) required by Pomelo. This includes boundary conditions (periodic/non periodic in each axis), box size, shrink and the number steps in and for discretizing the sphere’s surface. Every following line describes one sphere in the packing with its parameters (coordinates and radius). To run the demo, call Pomelo with the command line argument -SPHEREPOLY, the path to the xyzr file and the desired output folder.
Pomelo’s output are the vertices, faces and cells of the Set Voronoi Diagram. The output can be set to different formats, like the POLY file format, off (for geomview) or a gnuplot readable format for easy visualisation.
1.2 Generic Mode
Using Pomelo in generic mode allows to calculate the Set Voronoi Diagram for generic particles. The input is a position file, which is a list of all particles which are described by a set of parameters each. The parameters are a complete description of the particles surface within the packing. The read file is key for Pomelos versatility. It allows the user to create a surface triangulation based on the parameters given in the position file with a script written in the lua language RefLua . The script tells Pomelo how to create a surface triangulation with the particles parameters as given in the position file. It can be fully customized by the user to match any specific particle shape. This allows the user to create even systems composed of a mixture of diferent particles. The surface triangulation of all particles will then be used to calculate the Set Voronoi Diagram as described above.
Pomelo’s demos include a variety of examples on how to use the read script to handle different types of particles.
2 Applications of Set Voronoi Diagrams
2.1 Ellipsoid Packings
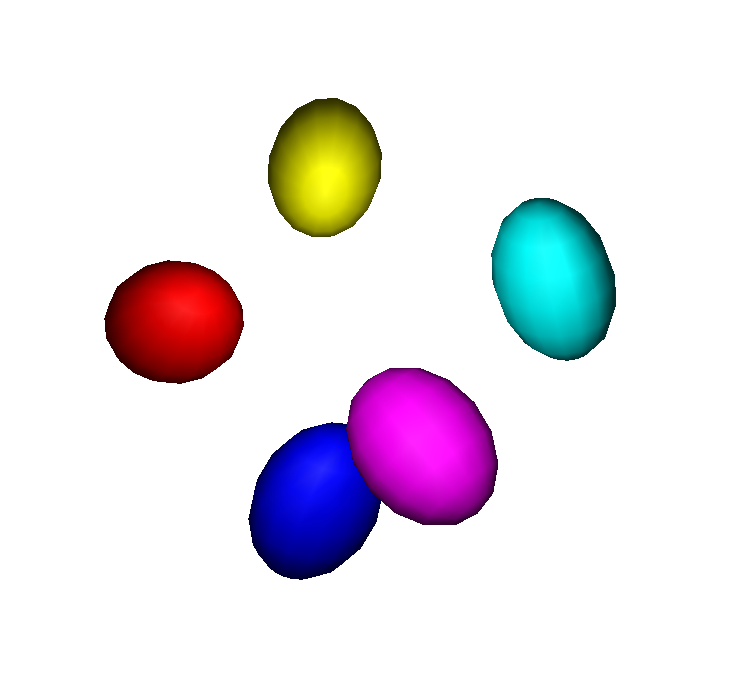
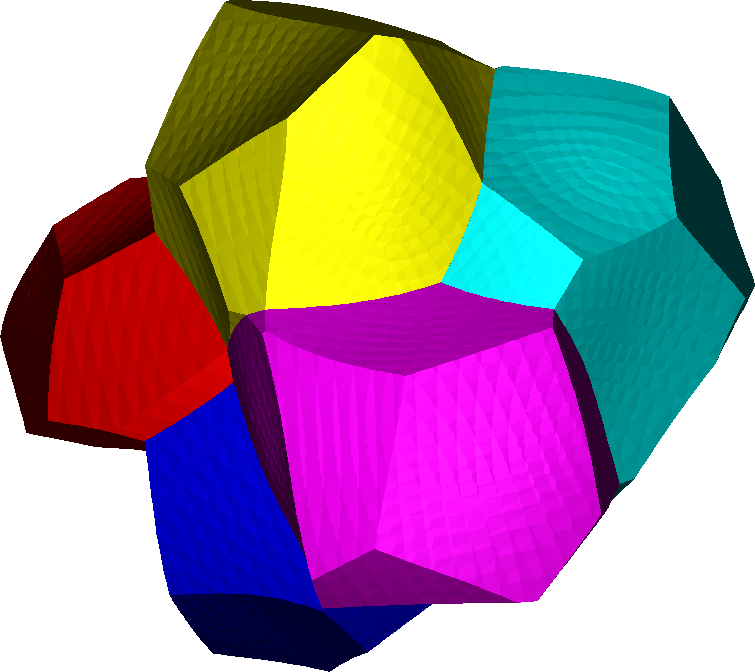
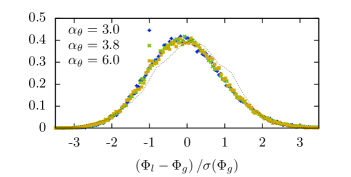
To demonstrate the use of Set Voronoi Diagrams the local packing fraction which is defined as with being the volume of the Set Voronoi Cell and the volume of the particle is calculated. It has been shown that the probability distribution of local packing fractions is universal for sphere packings RefAste and jammed pro- and oblate ellipsoid packings RefSchaller2015 .
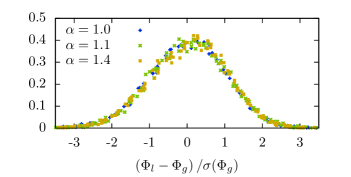
Experimental granular packings of triaxial ellipsoids (three distinct axis lengths , , ) have been measured at various global packing fractions using X-ray tomography, see figure 3. Particle positions, orientations and size have been determined and the Set Voronoi Diagrams have been calculated for each packing. Here the particles are shrinked by Pomelo to improve the quality of the cells. The statistical distribution of local packing fractions for spheres () and triaxial ellipsoids (, ) is shown in figure 4. To first order, the distribution can be collapsed on a master curve, as shown in Ref. RefSchaller2015 , by subtracting the global volume fraction and scaling the distribution by , see figure 4. Thus the functional form of the distribution is invariant to global packing fraction and aspect ratio , to first order.
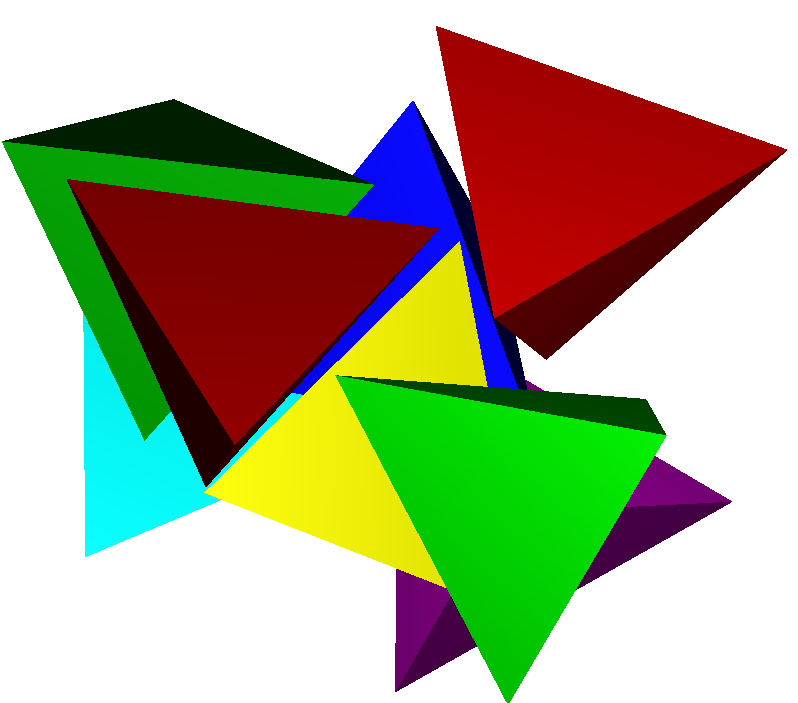
2.2 Tetrahedra
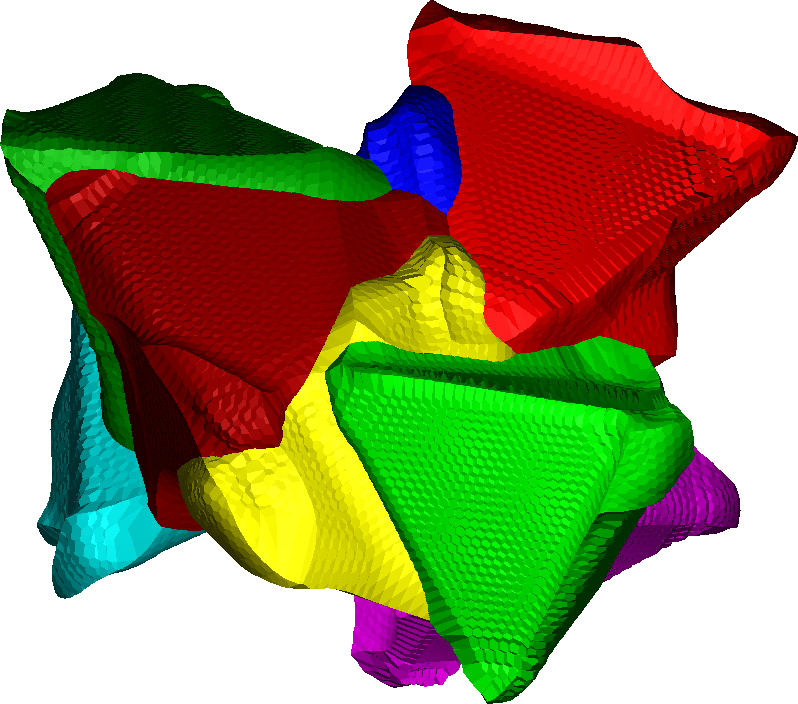
Packings of tetrahedra can also be treated with Pomelo without using the generic mode. The data was obtained by X-ray tomography RefNeudecker . Each tetrahedra is described by the positions of its 4 vertices. Pomelo is able to process the data directly. This gives the advantage to treat not only tetrahedra but pyramids in general.
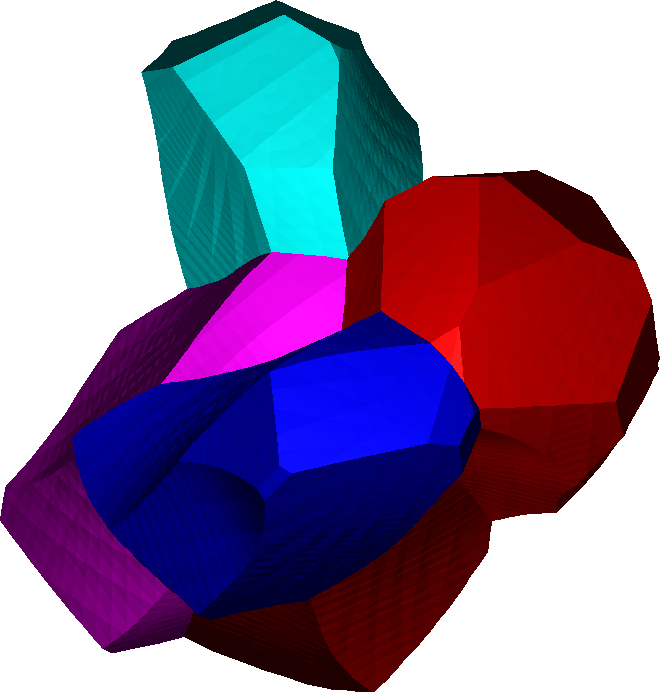
The Set Voronoi tessellations of tetrahedra packings (figure 5) with different packing fraction and contact numbers are calculated with Pomelo. The local packing fraction is shown for those systems in figure 6.
2.3 Pear Shaped Particles
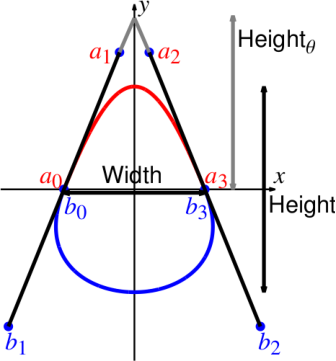
The third example is the calculation of the Set Voronoi Diagrams of pear shaped or tapered particles. The shape of these particles is described by the aspect ratio and the degree of tapering . By using two BÃzier curves forming the bottom and top part of the pear and rotating them around their symmetry axis the surface of the particle is generated (figure 7) RefBarmes . A triangulation algorithm of this surface is implemented within the read file, which allows Pomelo to process pear shaped particles in the generic mode. The position file provides the position, orientation, size, aspect ratio and degree of tapering for every individual particle.
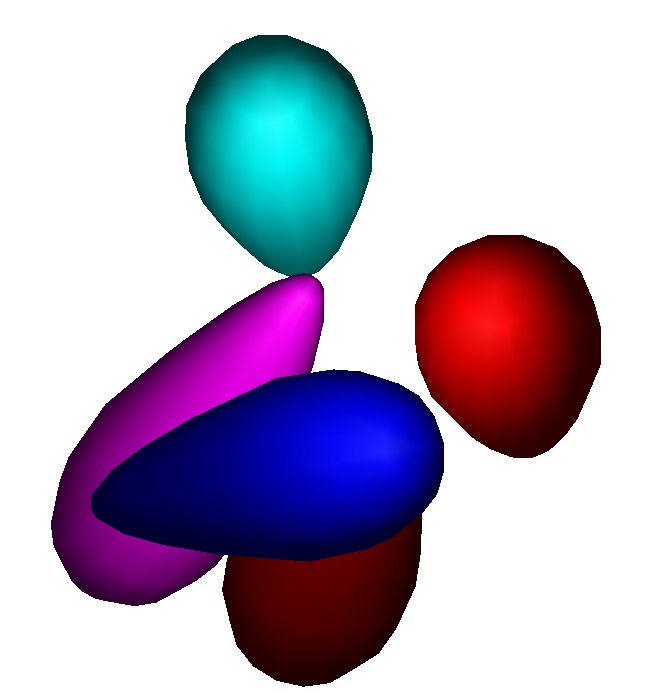
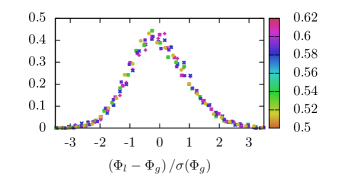
Systems of hard pear shaped particles () with different degrees of tapering are generated using Molecular Dynamics (see figure 8) RefBarmes . The statistical distribution of the local packing fractions for different pear systems ( ; ; ) is shown in figure 9. Similarly to the sphere and ellipsoid packings the distributions of the different pear systems collapse on a master curve. Accordingly the distribution is not only invariant to global packing fraction but also to degree of tappering for pears. However, the data of ellipsoids/spheres and pears do not collapse on the same curve.
3 Outlook
We have shown that Pomelo is applicable for a variety of systems, including spheres, ellipsoids, tetrahedra and pear shaped particles. We have illustrated its use to calculate Set Voronoi volume distributions. However, it is conceivable to analyse other interesting measures like Minkowski tensors, by piping the Set Voronoi Cells into corresponding analysis tools RefSchaller2015 ; RefSchroederTurk2011 ; RefSchroederTurk2013 . It is yet also unclear how similar volume distributions of different systems are.
One way to improve the calculation of the Set Voronoi Diagram is to implement an adaptive sampling of the particle’s surface. By comparing the distance between two neighboring surface points to the distance to the face of the Set Voronoi Cell it is possible to obtain an estimate on where the surface triangulation needs a better resolution and where a coarse resolution is good enough. This estimate will be used to change the density of the surface triangulation of the particles.
References
-
(1)
T. Aste, T. Di Matteo, M. Saadatfar, T. J. Senden, M. SchrÃter, H. L. Swinney, EPL 79, 24003 (2007)
-
(2)
M. van Hecke, J. Phys: Condens. Matter, 22, 0033101 (2010)
-
(3)
P. Wang, C. Song, Y. Jin, K. Wang, H. Makse, J. Stat Mech 2010, P12005 (2010)
-
(4)
F. M. Schaller, S. C. Kapfer, M. E. Evans et al., Philosophical Magazine 93, 3993-4017 (2013)
-
(5)
V. Luchnikov, N. Medvedev, L. Oger, J. Troadec, Phys. Rev. E 59, 7205 (1999)
-
(6)
E. Preteux, J. Math. Imaging Vision 1, 239 (1992)
-
(7)
http://theorie1.physik.uni-erlangen.de/research/pomelo/index.html
-
(8)
https://www.lua.org/
-
(9)
F. M. Schaller, S. C. Kapfer, J. E. Hilton et al., EPL 111, 24002 (2015)
-
(10)
M. Neudecker, S. Ulrich, S. Herminghaus, M. SchrÃter PRL 111, 028001 (2013)
-
(11)
F. Barmes, M. Ricci, C. Zannoni, D. J. Cleaver, Phys. Rev. E. 68, 021708 (2003)
-
(12)
G. E. SchrÃder-Turk, W. Mickel, S. C. Kapfer et al., Adv. M. 23(22-23), 2535–2553 (2011)
- (13) G. E. SchrÃder-Turk, W. Mickel, S. C. Kapfer et al., NJP 15, 083028 (2013)