Real-time monitoring of the structure of ultra thin Fe3O4 films during growth on Nb-doped SrTiO3(001)
Abstract
In this work thin magnetite films were deposited on SrTiO3 via reactive molecular beam epitaxy at different substrate temperatures. The growth process was monitored in-situ during deposition by means of x-ray diffraction. While the magnetite film grown at 400∘ C shows a fully relaxed vertical lattice constant already in the early growth stages, the film deposited at 270∘ C exhibits a strong vertical compressive strain and relaxes towards the bulk value with increasing film thickness. Furthermore, a lateral tensile strain was observed under these growth conditions although the inverse behavior is expected due to the lattice mismatch of -7.5 %. Additionally, the occupancy of the A and B sublattices of magnetite with tetrahedral and octahedral sites was investigated showing a lower occupancy of the A sites compared to an ideal inverse spinel structure. The occupation of A sites decreases for a higher growth temperature. Thus, we assume a relocation of the iron ions from tetrahedral sites to octahedral vacancies forming a deficient rock salt lattice.
In the rising fields of spintronics Hoffmann and Bader (2015) and spin caloritronics Bauer et al. (2012) materials with highly spin-polarized carriers are required either for applications based on magnetoresistive effects or on spin-injection Schmidt (2005).
For this purpose, the material class of half-metals provides ideal properties with one metallic and another semiconducting or insulating spin channel.
Here, magnetite (Fe3O4) is one of the intensively studied half-metals Moussy (2013) due to a predicted 100 % spin polarization at the Fermi level Zhang and Satpathy (1991) and a high Curie temperature of 858 K Cornell and Schwertmann (2003), making thin magnetite films, on one hand, particularly suitable for room temperature spintronic applications Seneor et al. (1999); Kado (2008); Wada et al. (2010).
On the other hand, multilayers of magnetite and platinum enhance the efficiency of thermal generation of spin currents Ramos et al. (2016) based on the spin Seebeck effect Ramos et al. (2013); Uchida et al. (2016) making Fe3O4 attractive in spin caloritronics as well.
Magnetite has a bulk lattice constant of 8.3963 Å Cornell and Schwertmann (2003) and crystallizes in the inverse spinel structure, where eight tetrahedral (A) sites of the bulk unit cell are only occupied by Fe3+ cations while 16 octahedral (B) sites are equally shared by Fe2+ and Fe3+ cations.
At about 120 K bulk magnetite undergoes the so-called Verwey transition, which results in a two-orders-of-magnitude decrease in conductivity and a reduction from cubic to monoclinic crystal symmetry leading to a spontaneous ferroelectric polarization and, thus, multiferroicity Kato and Iida (1982); Alexe et al. (2009).
However, for thin magnetite films this unique transport and magnetic properties as well as structural parameters are strongly influenced by the interaction between the film and the substrate.
In this study the influence of the substrate temperature on the growth behavior of thin magnetite films deposited on 0.05 % Nb-doped SrTiO3(001) was investigated.
For this system the lattice mismatch between Fe3O4 and SrTiO3 amounts to -7.5 %.
Film preparation and characterization were carried out at beamline BM 25 of the European Synchrotron Radiation Facility (ESRF, Grenoble, France).
BM 25 is a bending magnet beamline with a double crystal monochromator consisting of two parallel Si(111) crystals to produce monochromatic beam Castro (1998).
The endstation is equipped with a 2S + 3D diffractometer and an ultra-high vacuum (UHV) chamber.
The UHV chamber includes thermal evaporation sources, a sample heating device, a LEED (low energy electron diffraction) optics and an x-ray source with a dual Ti/Mg anode and an electrostatic cylinder-sector analyzer to perform x-ray photoelectron spectroscopy (XPS) Rubio-Zuazo et al. (2010); Rubio-Zuazo and Castro (2013); Rubio-Zuazo and G.R.Castro (2005).
The base pressure in the UHV chamber was 10-10 mbar.
The set-up design allows to use the sample heating and evaporator and to perform x-ray diffraction (XRD) measurements during growth.
For XRD experiments a NaI detector was used.
Prior to deposition, the SrTiO3(001) substrates were annealed at 400∘ C in 110-4 mbar of O2 for 1 h in order to remove carbon contamination and get well-defined surfaces.
The crystal surface quality and the chemical cleanness was controlled after each preparation step in situ by XPS (Mg K, h = 1253.6 eV) and LEED.
XPS shows no carbon contamination and LEED reveals quadratic surface symmetry and sharp diffraction spots for the cleaned SrTiO3 substrates.
Afterwards, thin magnetite films were grown via reactive molecular beam epitaxy (RMBE) (thermal evaporation from pure metal rod in 510-6 mbar oxygen) at two different substrate temperatures of 270∘ C and 400∘ C.
Additionally, for the sample grown at 400∘ C the annealing was continued for 30 min after the evaporation was stopped.
The resulting film thicknesses were measured by means of x-ray reflectivity (XRR).
The thickness was determined to be () nm and () nm for the film grown at 270∘C and 400∘C, respectively.
Hence, the used deposition rate for both samples was () Å/min.
Directly after deposition Fe 2p photoelectron spectra were recorded for both films (not shown here).
They show no apparent charge transfer satellites, indicating neither an excess of Fe2+ nor Fe3+ ions Yamashita and Hayes (2008); Fujii et al. (1999).
Further, the Fe 2p3/2 and Fe 2p1/2 main peaks are located at binding energies of 710.6 eV and 723.6 eV corresponding to the well-known values for Fe3O4 Yamashita and Hayes (2008).
In addition, LEED measurements show a R45∘ superstructure (not shown here) for both films typical for well ordered magnetite surface Pentcheva et al. (2008); Korecki et al. (2002); Anderson et al. (1997).
Combining the results from XPS and LEED we can conclude that both iron oxide films have Fe3O4 stoichiometry and surface structure.
X-ray diffraction measurements were performed during the deposition of iron oxide at an interval of 3-4 min.
Scans along the (00) crystal truncation rod (CTR) were recorded in geometry close to the SrTiO3(002)P and Fe3O4(004)S Bragg reflections.
Here, index P and S denote the indexing for perovskite type (SrTiO3) and spinel type (Fe3O4) bulk unit cells, respectively.
Since magnetite has almost doubled bulk lattice constant compared to SrTiO3 the Fe3O4(004)S reflection is located close to the SrTiO3(002)P Bragg peak but at lower values.
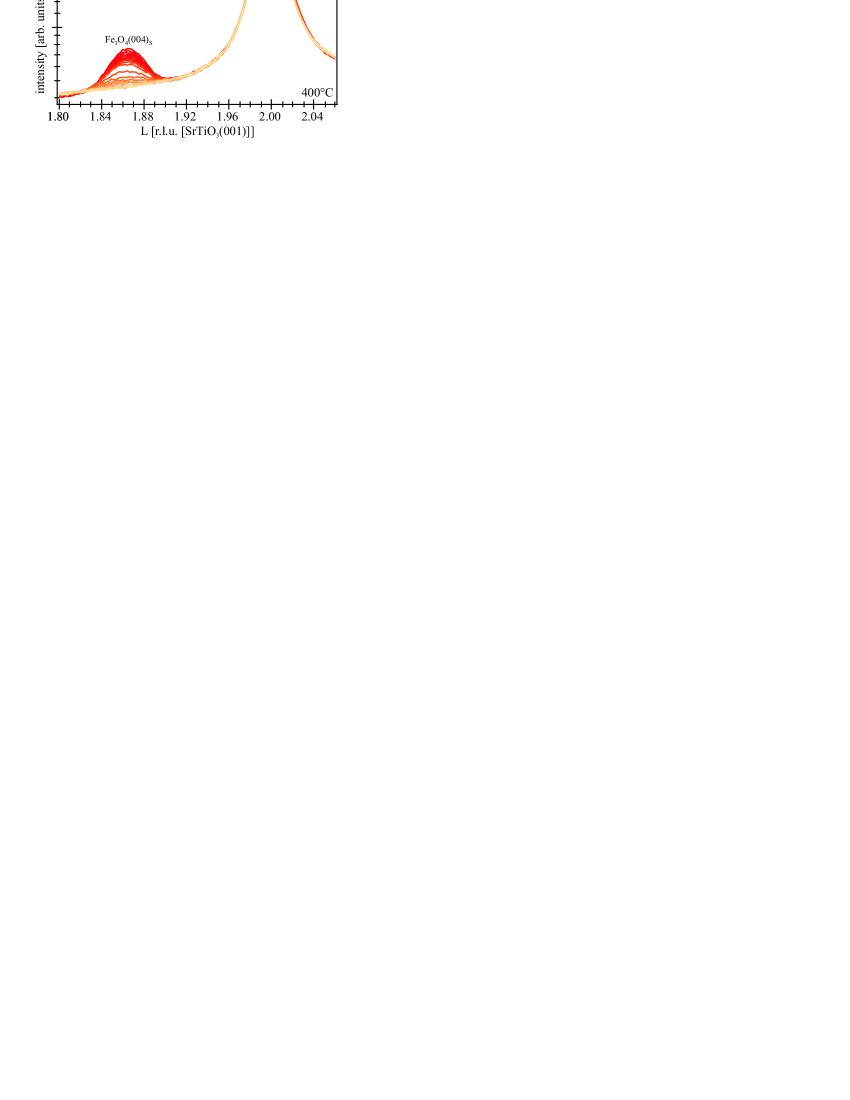
Fig. 1 shows the evolution of the Fe3O4(004)S Bragg peak for the sample grown at 400∘C.
In this measurements an intense substrate peak located at = 2 and a much broader Bragg peak at 1.86 corresponding to the Fe3O4(004)S reflection are visible.
The CTR shows no Laue fringes indicating an inhomogeneous crystalline structure of the film (e.g. inhomogeneous thickness, grains etc.).
With increasing exposure time the intensity of the Fe3O4(004)S reflection increases while the peak width is decreasing.
The substrate peak was fitted by a Lorentzian shaped function and the magnetite peak by a Gaussian shaped function to characterize the growth properties.
Due to low peak intensity, it was only possible to fit the data beyond 15 min deposition time (equivalent to 2.6 nm film thickness).
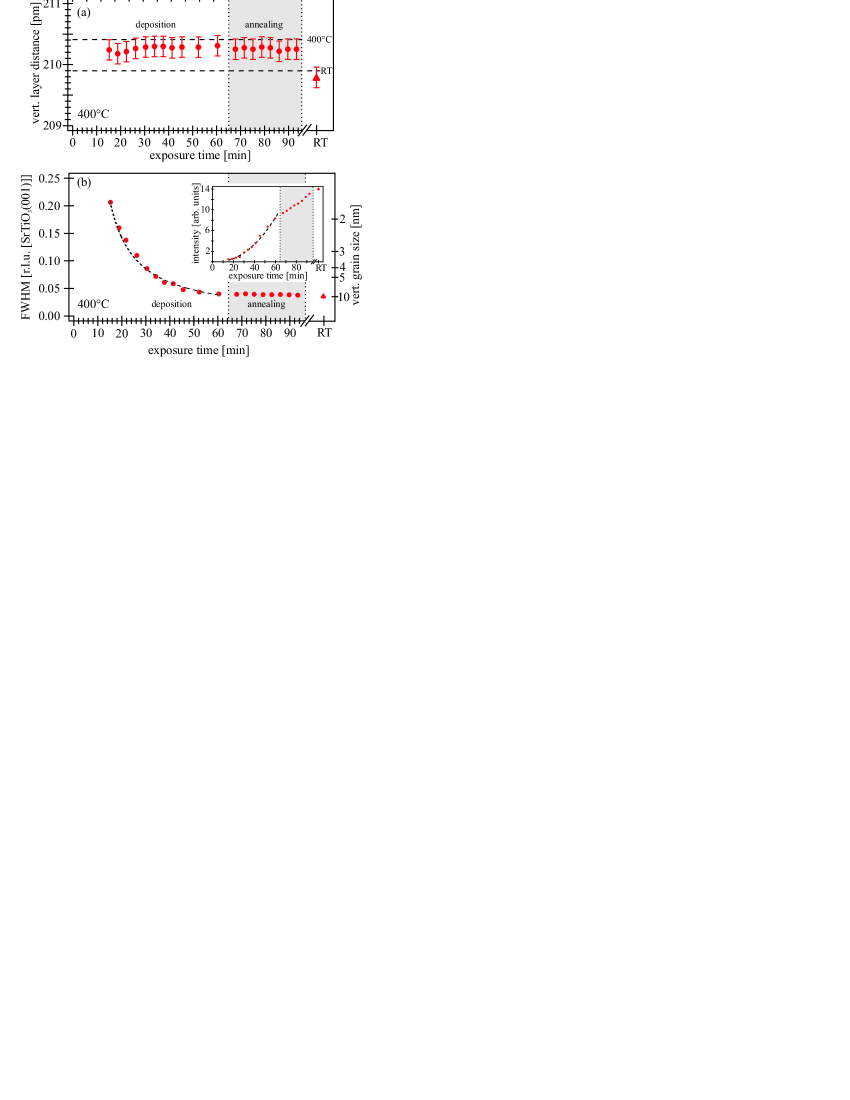
The temporal evolution of the vertical layer distance obtained from the positions of the magnetite diffraction peaks are depicted as a function of the exposure time in Fig. 2(a).
The layer distance remains constant at a value of (210.2 ) pm during the whole deposition and annealing period.
This value coincides with the value expected for bulk magnetite at 400∘C taking into account thermal expansion Levy et al. (2004).
After cooling to room temperature (RT) the resulting layer distance of the magnetite film also coincides within the error tolerance with the bulk value of magnetite Cornell and Schwertmann (2003).
Consequently, the magnetite film deposited at 400∘ C grows fully relaxed already at early stages, despite the lattice mismatch between film and substrate of -7.5%.
Fig. 2(b) shows the full width at half maximum (FWHM) and the peak intensity (inset) of the Fe3O4(004)S reflection extracted from curve fitting.
The vertical grain size of the individual steps during the deposition and annealing process was estimated from the FWHM using the Scherrer formula Scherrer (1918).
Assuming a constant growth rate the time dependence of the FWHM was fitted by a function
| (1) |
Here, indicates the starting point of ordered growth.
In accordance with the result for the FWHM, the peak intensity follows a parabolic law for (cf. inset of Fig. 2(b)).
From the fit of the evolution of the FWHM and intensity of the Fe3O4(004)S peak an interlayer of 1.0-1.5 nm thickness was determined.
Here, we assume a high density of point defects and misfit dislocations within this interlayer leading to a fast strain relaxation and, subsequently, the growth of an ordered fully relaxed magnetite film on top.
During the subsequent annealing process ( min) the decrease of the FWHM is negligible while the intensity shows a significant increase pointing to a higher ordering of the magnetite film.
The resulting increase of the vertical grain size of only 0.5-0.8 nm is too small compared with the strong increment of the intensity.
Thus, the strong increase in the intensity during the annealing indicates a lateral ordering of the magnetite film.
Nevertheless, comparing the vertical grain size calculated by the Scherrer equation and the film thickness obtained from the XRR we estimate a residual distorted interface layer of 1 nm.
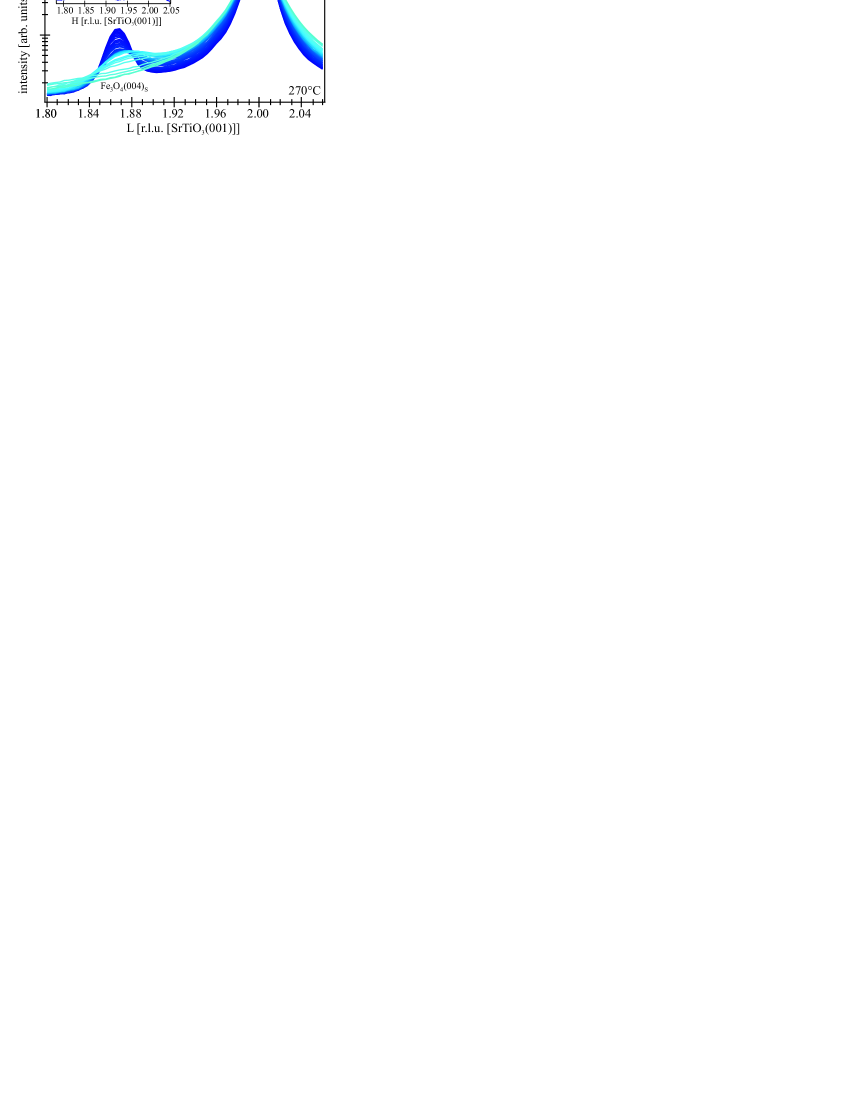
The evolution of the Fe3O4(004)S Bragg peak for the sample grown at 270∘C is depicted in Fig. 3 showing an increase in intensity but a decrease in the peak width with increasing exposure time.
Here also, no Laue fringes are visible near the Bragg peak pointing to an inhomogeneous crystalline order of the magnetite film.
In contrast to the film grown at 400∘C, the Bragg peak shifts to lower values over the deposition time.
For detailed analysis the substrate peak was also fitted by a Lorentzian and the Fe3O4 peak by a Gaussian.
It was not possible to fit the data for the very first 3 nm film thickness (up to 18 min) due to negligible peak intensity in the early growth stages.
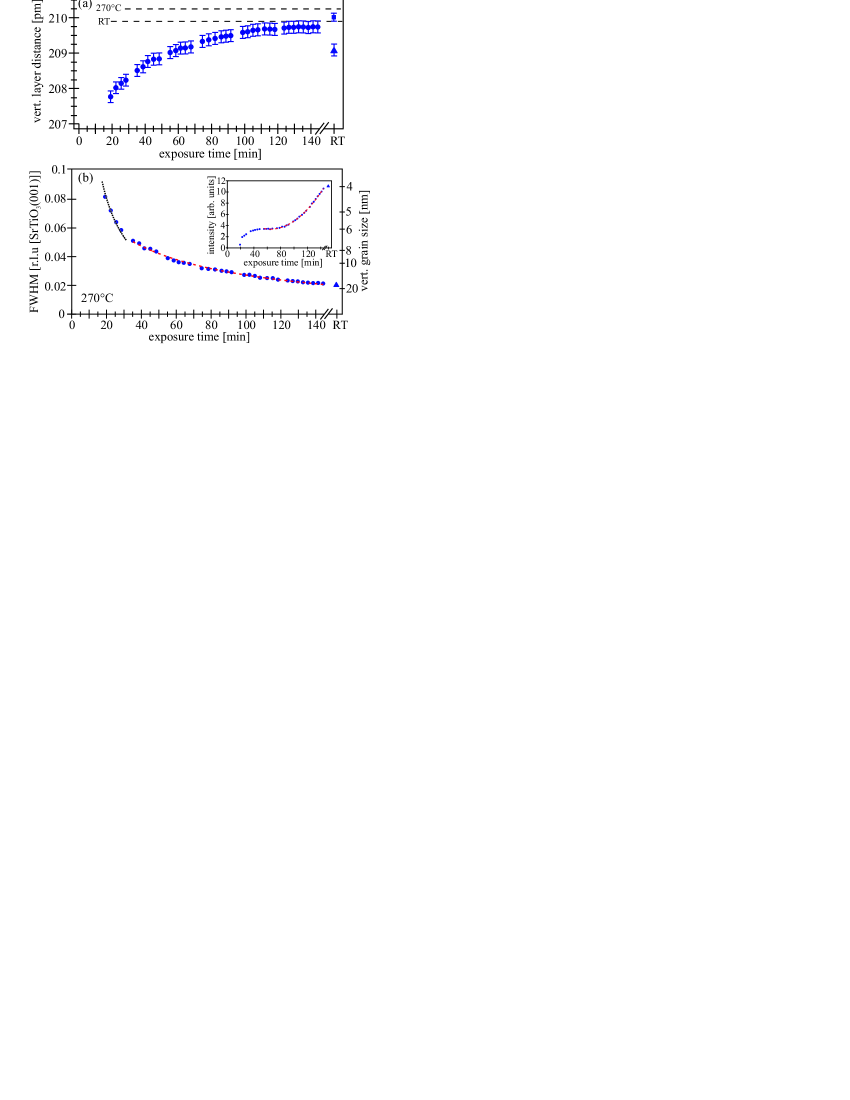
In Fig. 4(a) the vertical lattice constant as a function of the exposure time is presented.
This sample shows a strong strain relaxation behavior towards the bulk value with increasing deposition time.
However, considering the thermal expansion coefficients the bulk value is not completely reached.
The vertical layer distance increases from (207.8 ) pm after deposition of 3 nm to a value of (209.7 ) pm at the end of the deposition.
After cooling down to room temperature the vertical layer distance amounts to (209.1 ) pm, which corresponds to a vertical compressive strain of -0.4 %.
The lateral lattice constant was determined by measuring the Fe3O4(400)S Bragg reflection along the (00) direction at room temperature to analyze the structure in more detail (cf. inset of Fig. 3).
The obtained lateral layer distance of (210.2 ) pm exceeds the bulk value of magnetite by 0.14 %.
Thus, the Fe3O4 film grown on SrTiO3 at 270∘C exhibits vertical compressive and lateral tensile strain.
These results are not expected for magnetite on SrTiO3 since the doubled lattice constant of SrTiO3 (3.905 Å) is smaller compared to the lattice constant of magnetite (8.3963 Å).
Therefore, one expects the inverse behavior, namely lateral compression and vertical tension, due to the lattice mismatch of -7.5 %.
The origin of this effect for magnetite deposited at 270∘C on SrTiO3 is still under discussion.
However, auxetic behavior of this magnetite film, like it was proposed for ultrathin NiFe2O4 films on SrTiO3 Hoppe et al. (2015), can be excluded.
The FWHM and the peak intensity (inset) of the Fe3O4(004)S peak is shown in Fig. 4(b).
Additionally, the vertical grain size estimated from the FWHM using the Scherrer formula Scherrer (1918) is assigned.
For the temporal evolution of the FWHM Eq. 1 was applied.
The experimental data of the FWHM, however, could only be described by two growth regimes (two different constants A).
For the first part ( min) of the fit no delay is obtained (=0) indicating a continuous reduction of the misfit strain.
The initial fast growth regime is followed by a second stage ( min) where the grains grow more slowly.
In addition, the inset in Fig. 4(b) shows the temporal evolution of the Bragg peak intensity.
Here, clear conclusions can only be drawn for the second stage of the slow growth.
The initial constant peak intensity points to the formation of decreasing lateral grain size while we observe a parabolic law for min.
The latter agrees well with the observation of growth at 400∘C and points to a preferential vertical growth of the grains.
The resulting vertical grain size at the end of the deposition amounts to 17 nm and is 9 nm smaller than the film thickness obtained from the XRR measurement.
Probably, these grain boundaries contribute to the relaxation of the strained magnetite film.
In addition, scans along the Fe3O4(22)S CTR were performed to study separately the occupancy of the A and B sublattices with tetrahedral and octahedral sites, respectively.
| Fe3O4 | 270∘C | 400∘C | Fe0.75O | |
| (theo.) | (exp.) | (exp.) | (theo.) | |
| 122.9 | 137.7 | 145.7 | 279.1 | |
| 135.8 | 122.9 | 116.0 | 0 | |
| 127.8 | 138.4 | 144.2 | 239.8 | |
| 0 | 0.095 | 0.146 | 1 |
Here, the Fe3O4(224)S Bragg reflection originates exclusively from the A sublattice with Fe on tetrahedral sites while only Fe cations on octahedral B sites and O anions contribute to the Fe3O4(222)S and the Fe3O4(226)S Bragg peaks.
The latter Bragg peaks were used to determine the Debye-Waller factor so that we could calculate the modulus of the structure factor presented in Tab. 1.
Following the model of Bertram et al. the structure factor of the iron oxide film can be described as a sum of the structure factor of an ideal magnetite and of a defective rock salt like structure .
Here, Fe0.75O exhibits a Fe3O4 stoichiometry but the vacant B sites of the inverse spinel structure are equally occupied by Fe cations removed from A sites.
Therefore, following the Bragg-Williams theory the structure factor can be written as
| (2) |
where denotes the parameter of disorder Warren (1969); Bertram et al. (2013).
Comparing the experimental values of the Fe3O4(22)S Bragg peaks with expected values for the ideal structure, the disorder parameter was determined following Eq. 2 (cf. Tab. 1).
Both magnetite films show a high but not ideal occupancy of the A sublattice with tetrahedral sites.
The film grown at 270∘C shows a slightly lower value of and, thus, a higher occupancy of the tetrahedral sites, compared to the results reported by Bertram et al. Bertram et al. (2013) for a well-ordered magnetite film grown at 250∘C on MgO which could only be obtained for higher growth rates of 3.2 Å/s.
Despite the fully relaxed growth and a higher deposition temperature the film grown at 400∘C exhibits a lower ordering of the tetrahedral sublattice () compared to magnetite film grown at 270∘C.
In summary, the growth process of two magnetite films deposited on SrTiO3(001) at 270∘C and 400∘C was monitored by measuring (00) CTRs during deposition.
The magnetite film grown at 270∘C exhibits a vertical compressive strain and relaxes continuously over the entire growth process.
Additionally, a lateral tensile strain is obtained excluding auxetic behavior.
Due to a lattice mismatch of -7.5 % and, thus, anticipated lateral compressive and vertical tensile strain, this contradicts the behavior expected due to lattice mismatch and requires further investigations.
In contrast, for the sample grown at 400∘C we assume a strong strain relaxation within the very first few layers followed by a fully relaxed growth regime.
However, magnetite grown at 400∘ C shows a lower ordering of the sublattices due to a lower occupancy of the A sites compared to the sample deposited at 270∘C.
This points to a relocation of the iron ions from tetrahedral sites to octahedral vacancies forming a deficient rock salt lattice.
Acknowledgments
The authors acknowledge the Deutsche Forschungsgemeinschaft (DFG) via grant no. KU2321/2-1 for financial support. Further, we would like to thank the ESRF for provision of synchrotron radiation in using BM25.
References
- Hoffmann and Bader (2015) A. Hoffmann and S. D. Bader, Phys. Rev. Applied 4, 047001 (2015).
- Bauer et al. (2012) G. E. W. Bauer, E. Saitoh, and B. J. van Wees, Nat. Mater. 11, 391 (2012).
- Schmidt (2005) G. Schmidt, J. Phys. D: Appl. Phys. 38, R107 (2005).
- Moussy (2013) J.-B. Moussy, J. Phys. D: Appl. Phys. 46, 143001 (2013).
- Zhang and Satpathy (1991) Z. Zhang and S. Satpathy, Phys. Rev. B 44, 13319 (1991).
- Cornell and Schwertmann (2003) R. Cornell and U. Schwertmann, The Iron Oxides: Structure, Properties, Reactions, Occurences and Uses (Wiley-VCH GmbH & Co. KGaA, 2003).
- Seneor et al. (1999) P. Seneor, A. Fert, J.-L. Maurice, F. Montaigne, F. Petroff, and A. Vaurés, Appl. Phys. Lett. 74, 4017 (1999).
- Kado (2008) T. Kado, Appl. Phys. Lett. 92, 092502 (2008).
- Wada et al. (2010) E. Wada, K. Watanabe, Y. Shirahata, M. Itoh, M. Yamaguchi, and T. Taniyama, Appl. Phys. Lett. 96, 102510 (2010).
- Ramos et al. (2016) R. Ramos, A. Anadón, I. Lucas, K. Uchida, P. A. Algarabel, L. Morellón, M. H. Aguirre, E. Saitoh, and M. R. Ibarra, APL Materials 4, 104802 (2016).
- Ramos et al. (2013) R. Ramos, T. Kikkawa, K. Uchida, H. Adachi, I. Lucas, M. H. Aguirre, P. Algarabel, L. Morellón, S. Maekawa, E. Saitoh, et al., Appl. Phys. Lett. 102, 072413 (2013).
- Uchida et al. (2016) K.-I. Uchida, H. Adachi, T. Kikkawa, A. Kirihara, M. Ishida, S. Yorozu, S. Maekawa, and E. Saitoh, Proc. IEEE 104, 1946 (2016).
- Kato and Iida (1982) K. Kato and S. Iida, J. Phys. Soc. Jpn. 51, 1335 (1982).
- Alexe et al. (2009) M. Alexe, M. Ziese, D. Hesse, P. Esquinazi, K. Yamauchi, T. Fukushima, S. Picozzi, and U. G sele, Adv. Mater. 21, 4452 (2009).
- Castro (1998) G. R. Castro, J. Synchrotron Rad. 5, 657 (1998).
- Rubio-Zuazo et al. (2010) J. Rubio-Zuazo, M. Escher, M. Merkel, and G. R. Castro, Rev. Sci. Instrum. 81, 043304 (2010).
- Rubio-Zuazo and Castro (2013) J. Rubio-Zuazo and G. R. Castro, J. Vac. Sci. Technol. A 31, 031103 (2013).
- Rubio-Zuazo and G.R.Castro (2005) J. Rubio-Zuazo and G.R.Castro, Nucl. Instr. Meth. Phys. Res. A 547, 64 (2005).
- Yamashita and Hayes (2008) T. Yamashita and P. Hayes, Appl. Surf. Sci. 254, 2441 (2008).
- Fujii et al. (1999) T. Fujii, F. M. F. de Groot, G. A. Sawatzky, F. C. Voogt, T. Hibma, and K. Okada, Phys. Rev. B 59, 3195 (1999).
- Pentcheva et al. (2008) R. Pentcheva, W. Moritz, J. Rundgren, S. Frank, D. Schrupp, and M. Scheffler, Surf. Sci. 602, 1299 (2008).
- Korecki et al. (2002) J. Korecki, B. Handke, N. Spiridis, T. Slezak, F. Flis-Kabulska, and J. Haber, Thin Solid Films 412, 14 (2002).
- Anderson et al. (1997) J. F. Anderson, M. Kuhn, U. Diebold, K. Shaw, P. Stoyanov, and D. Lind, Phys. Rev. B 56, 9902 (1997).
- Levy et al. (2004) D. Levy, G. Artioli, and M. Dapiaggi, J. Solid State Chem. 177, 1713 (2004).
- Scherrer (1918) P. Scherrer, Nachrichten von der Gesellschaft der Wissenschaften zu Göttingen, Mathematisch-Physikalische Klasse 1918, 98 (1918).
- Hoppe et al. (2015) M. Hoppe, S. Döring, M. Gorgoi, S. Cramm, and M. Müller., Phys. Rev. B 91, 054418 (2015).
- Warren (1969) B. E. Warren, X-Ray Diffraction (Addison-Wesley Pub. Co, 1969).
- Bertram et al. (2013) F. Bertram, C. Deiter, T. Schemme, S. Jentsch, and J. Wollschläger, J. Appl. Phys. 113, 184103 (2013).