Multi-sensor authentication to improve smartphone security
Abstract
The widespread use of smartphones gives rise to new security and privacy concerns. Smartphone thefts account for the largest percentage of thefts in recent crime statistics. Using a victim’s smartphone, the attacker can launch impersonation attacks, which threaten the security of the victim and other users in the network. Our threat model includes the attacker taking over the phone after the user has logged on with his password or pin. Our goal is to design a mechanism for smartphones to better authenticate the current user, continuously and implicitly, and raise alerts when necessary. In this paper, we propose a multi-sensors-based system to achieve continuous and implicit authentication for smartphone users. The system continuously learns the owner’s behavior patterns and environment characteristics, and then authenticates the current user without interrupting user-smartphone interactions. Our method can adaptively update a user’s model considering the temporal change of user’s patterns. Experimental results show that our method is efficient, requiring less than 10 seconds to train the model and 20 seconds to detect the abnormal user, while achieving high accuracy (more than 90%). Also the combination of more sensors provide better accuracy. Furthermore, our method enables adjusting the security level by changing the sampling rate.
1 INTRODUCTION
In recent years, we have witnessed an increasing development of mobile devices such as smartphones and tablets. Smartphones are also becoming an important means for accessing various online services, such as online social networks, email and cloud computing. Many applications and websites allow users to store their information, passwords, etc. Users also save various contact information, photos, schedules and other personal information in their smartphones. No one wants personal and sensitive information to be leaked to others without their permission. However, the smartphone is easily stolen, and the attacker can have access to the personal information stored in the smartphone. Furthermore, the attacker can steal the victim’s identity and launch impersonation attacks in networks, which would threaten the victim’s personal and sensitive information like his bank account, as well as the security of the networks, especially online social networks. Therefore, providing reliable access control of the information stored on smartphones, or accessible through smartphones, is very important. But, first, it is essential to be able to authenticate the legitimate user of the smartphone, and distinguish him or her from other unauthorized users.
Passwords are currently the most common way for authentication. However, they suffer from several weaknesses. Passwords are vulnerable to attacks because they are easily guessed. They suffer from social engineering attacks, like phishing, pretexting, etc. The usability issue is also a serious factor, since users do not like to have to enter, and reenter, passwords or pins. A study [ConsumerReports, 2013] shows that 64% of users do not use passwords as an authentication mechanism on their smartphones. Hence, this paper proposes a means of implicit and continuous authentication, beyond the initial authentication by password, pin or biometric (e.g., fingerprint).
Implicit authentication does not rely on the direct involvement of the user, but is closely related to his/her biometric behavior, habits or living environment. We propose a form of implicit authentication realized by building the user’s profile based on measurements from various sensors in a typical smartphone. Specifically, the sensors within the smartphones can reflect users’ behavior patterns and environment characteristics. The recent development and integration of sensor technologies in smartphones, and advances in modeling user behavior create new opportunities for better smartphone security.
| Sensor | Nexus 5 | iphone 5s | Galaxy S5 |
|---|---|---|---|
| accelerometer | Yes | Yes | Yes |
| gyroscope | Yes | Yes | Yes |
| magnetic field | Yes | Yes | Yes |
| light | Yes | Yes | Yes |
| proximity | Yes | Yes | Yes |
| pressure | Yes | No | Yes |
| temperature | No | No | No |
| orientation | Yes | No | No |
| GPS | Yes | Yes | Yes |
| MIC | Yes | Yes | Yes |
| camera | Yes | Yes | Yes |
| Network | Yes | Yes | Yes |
In this paper, we propose a multi-sensor-based system to achieve continuous and implicit authentication for smartphone users. The system leverages data collected by three sensors: accelerometer, orientation sensor, and magnetometer, in a smartphone, and then trains a user’s profile using the SVM machine learning technique. The system continuously authenticates the current user without interrupting user-smartphone interactions. The smartphone’s security system is alerted once abnormal usage is detected by our implicit authentication mechanism, so that access to sensitive information can be shut down or restricted appropriately, and further checking and remediation actions can be taken. Our authentication mechanism can adaptively update a user’s profile every day considering that the user’s pattern may change slightly with time. Our experimental results on two different data sets show the effectiveness of our proposed idea. It only takes less than 10 seconds to train the model everyday and 20 seconds to detect abnormal usage of the smartphone, while achieving high accuracy (90%, up to 95%).
| Sensor | Description | Common Use | Permission | ||||
| accelerometer |
|
Motion detection | No | ||||
| orientation |
|
Rotation detection. | No | ||||
| magnetometer |
|
|
No | ||||
| gyroscope |
|
Rotation detection | No | ||||
| light |
|
|
No | ||||
| proximity |
|
Phone position during a call. | No | ||||
| pressure |
|
Environment detection | No | ||||
| temperature |
|
Environment detection | No | ||||
| GPS | Positioning | Tracking and Positioning | Yes | ||||
| microphone | Record voice | Speech recognition | Yes | ||||
| camera | Record image | Face recognition | Yes | ||||
| network | Provide user connection to internet |
|
Yes |
We arrived at our three-sensor solution by first testing the performance on a single-sensor-based system, considering each of the accelerometer, the orientation sensor and the magnetometer. We found that the authentication accuracy for measurements from the orientation sensor alone is worse than that of the accelerometer alone or the magnetometer alone. Then, we test a two-sensors-based system, using pairwise combinations from these three sensors. This showed that the combination of multiple sensors can improve the accuracy of the resulting authentication. We then combined the measurements from all three sensors, and showed that while there was a slight performance improvement, this incremental improvement is much less than going from one to two sensors, and the authentication accuracy is already above 90%, reaching 95%. We also show that our method allows the users to adjust their security levels by changing the sampling rate of the collected data.
The main contributions of our paper are summarized below.
-
•
We propose a multi-sensor-based system to achieve continuous and implicit authentication, which is accurate, efficient and flexible.
-
•
We compare our three-sensor-based method with single-sensor and two-sensors-based methods on two real data sets. Our three-sensor-based method is shown to have the best performance.
-
•
We also analyze the balance between the authentication accuracy and the training time. We give a reasonable trade-off with respect to the sampling rate and the data size, that is practical and meaningful in the real world environment of commodity smartphone users.
2 BACKGROUND
| Devices | Sensors | Method | Accuracy |
|
|
||||||||||
|---|---|---|---|---|---|---|---|---|---|---|---|---|---|---|---|
| Our method |
|
|
SVM |
|
|
No | |||||||||
|
Android |
|
|
n.a. |
|
No | |||||||||
|
Nexus S |
|
|
71.3% | n.a. | Yes | |||||||||
|
n.a. | GPS |
|
86.6% |
|
No | |||||||||
|
|
screen |
|
|
n.a. | Yes | |||||||||
|
|
screen | sliding pattern | 95.7% |
|
Yes | |||||||||
|
|
accelerometer | K-NN |
|
|
Yes |
2.1 Smartphone inputs and sensors
A unique feature of a smartphone is that it is equipped with a lot of sensors. Table 1 lists some common sensors in some of the most popular smartphones. Table 2 lists the sensors’ functionality, description of the measurements made, what it can be used for in terms of user or smartphone authentication, and whether Android permissions are required to read the sensor’s measurements.
Smartphone sensor information include measurements from an accelerometer, gyroscope, magnetometer, orientation sensor, ambient light, proximity sensor, barometric pressure and temperature. Other more privacy sensitive inputs include a user’s location as measured by his GPS location, WLAN, cell tower ID and Bluetooth connections. Also privacy sensitive are audio and video inputs like the microphone and camera. The contacts, running apps, apps’ network communication pattern, browsing history, screen on/off state, battery status and so on, can also help to characterize a user.
2.2 Related work
Table 3 summarizes and compares our work with past work on sensor-based authentication.
With the increasing development of mobile sensing technology, collecting many measurements through sensors in smartphones is now becoming not only possible, but quite easy through, for example, Android sensor APIs. Mobile sensing applications, such as the CMU MobiSens [Wu et al., 2013], run as a service in the background and can constantly collect sensors’ information from smartphones. Sensors can be either hard sensors (e.g., accelerometers) that are physically-sensing devices or soft sensors that record information of a phone’s running status (e.g., screen on/off).
Continuous authentication on smartphones is likely to become an interesting new research area, given the easily accessible data today in smartphones.
In [Kayacık et al., 2014], a lightweight, and temporally & spatially aware user behavior model is proposed for authentication based on both hard and soft sensors. They considered four different attacks and showed that even the informed insider can be detected in 717 seconds. However, they did not quantitatively show the accuracy. In comparison, our method not only clearly shows high accuracy performance but also requires much less detection time (e.g., we only need 20 seconds to detect an abnormal user while training the profiles for less than 10 seconds.)
SenSec [Zhu et al., 2013] constantly collects data from the accelerometer, gyroscope and magnetometer, to construct the gesture model while the user is using the device. SenSec is shown to achieve an accuracy of 75% in identifying users and 71.3% in detecting the non-owners. However, they ask users to follow a script, i.e., a specific series of actions, for authentication. In comparison, we do not need users to follow a specific script while still getting good authentication accuracy, higher than 90%.
In [Buthpitiya et al., 2011], an n-gram geo-based model is proposed for modeling a user’s mobility pattern. They use the GPS sensor to demonstrate that the system could detect abnormal activities (e.g., a phone being stolen) by analyzing a user’s location history, and the accuracy they achieve is 86.6%. However, they just utilize a single sensor for authentication, which largely limits their performance. By exploiting multiple sensors, our method achieves better accuracy.
Biometric-based systems have also been used to achieve continuous and unobservable authentication for smartphones [Trojahn and Ortmeier, 2013] [Li et al., 2013] [Nickel et al., 2012]. However, they ask users to follow a script for authentication. In comparison, we do not need users to follow a specific script while still getting good authentication accuracy. [Trojahn and Ortmeier, 2013] developed a mixture of a keystroke-based and a handwriting-based method to realize authentication through the screen sensor. Their approach has 11% false acceptance rate and 16% false rejection rate. [Li et al., 2013] proposed another biometric method to do authentication for smartphones. They exploited five basic movements (sliding up, down, right, left and tapping) and the related combinations as the user’s features, to perform authentication. An accelerometer-based biometric gait recognition to authenticate smartphones through k-NN algorithm was proposed in [Nickel et al., 2012]. Their work is based on the assumption that different people have different walking patterns. Their process only takes 30 seconds. However, their approach asks the users to follow a script, where they just record the data when the user is walking. In comparison, we do not need the user to follow any script, which means that we can provide continuous protection without user interaction, while their approach can only guarantee security for walking users.
The fact that sensors reflect an individual’s behavior and environment can not only be used for authentication, but can also lead to new attacks. [Xu et al., 2012] proposed an attack to infer a user’s input on a telephone key pad from measurements of the orientation sensor. They used the accelerometer to detect when the user is using a smartphone, and predicted the PIN through the use of gyroscope measurements.
Sensors also reflect environmental information, which can be used to reveal some sensitive information. By using measurements from an accelerometer on a smartphone to record the vibrations from a nearby keyboard [Marquardt et al., 2011], the authors could decode the context. In [Michalevsky et al., 2014], the authors show that the gyroscope can record the vibration of acoustic signals, and such information can be used to derive the credit card number.
3 KEY IDEAS
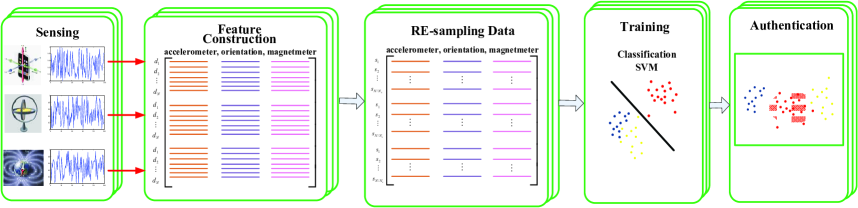
Some past work only consider one sensor to do authentication [Buthpitiya et al., 2011][Trojahn and Ortmeier, 2013][Li et al., 2013][Nickel et al., 2012]. We will show that the authentication accuracy can be improved by taking other sensors into consideration. We propose a multi-sensor-based technology with a machine learning method for implicit authentication, which only takes a short time to detect the abnormal user, but also needs less than 10 seconds to retrain the user’s profile every day. First, we collect the data from the selected sensors. Then, we use the SVM technique as the classification algorithm to differentiate the usage patterns of various users and authenticate the user of the smartphone.
Our methodology can be extended to other sensors in a straight-forward manner. Figure 1 shows our methodology, and the key ideas are presented below.
3.1 Sensor Selection
There are a lot of sensors built into smartphones nowadays as shown in Table 1 and Table 2. With smartphones becoming more connected with our daily lives, a lot of personal information can be stored in the sensors. The goal is to choose a small set of sensors that can accurately represent a user’s characteristics. In this paper, we experiment with three sensors that are commonly found in smartphones: accelerometers, orientation sensors and magnetometers. They also represent different information about the user’s behavior and environment: the accelerometer can detect coarse-grained motion of a user like how he walks [Nickel et al., 2012], the orientation sensor can detect fine-grained motion of a user like how he holds a smartphone [Xu et al., 2012], and the magnetometer measurements can perhaps be useful in representing his environment. Furthermore, these sensors do not need the user’s permission to be used in Android applications, which is useful for continuous monitoring for implicit authentication.
Also, these three sensors do not need the user to perform a sequence of actions dictated by a script–– hence facilitating implicit authentication. Note that our method is not limited to these three sensors, but can be easily generalized to different selections of hard or soft sensors, or to incorporate more sensors.
3.2 Data Sets and Re-sampling
We use two data sets, a new one which we collected locally by ourselves which we call the PU data set, and another data set which we obtained from the authors of a published paper [Kayacık et al., 2014], which we call the GCU data set.
The PU data set is collected from 4 graduate students in Princeton University in 2014 based on the smartphone, Google Nexus 5 with Android 4.4. It contains sensor data from the accelerometer, orientation sensor and magnetometer with a sampling rate of 5 Hz. The duration of the data collected is approximately 5 days for each user. Each sensor measurement consists of three values, so we construct a vector from these nine values. We use different sampling rates as a factor in our experiments, to construct data points.
We use the second data set, called the GCU dataset version 2 [Kayacık et al., 2014], for comparison. This is collected from 4 users consisting of staff and students of Glasgow Caledonian University. The data was collected in 2014 from Android devices and contains sensor data from wifi networks, cell towers, application use, light and sound levels, acceleration, rotation, magnetic field and device system statistics. The duration of the data collected is approximately 3 weeks. For better comparison with our PU data set, we only use the data collected from the accelerometer, orientation sensor and magnetometer data.
The sensor measurements originally obtained are too large to process directly. Hence, we use a re-sampling process to not only reduce the computational complexity but also reduce the effect of noise by averaging the data points. For example, if we want to reduce the data set by 5 times, we average 5 contiguous data points into one data point. In section 4, we will show that the time for training a user’s profile can be significantly reduced by re-sampling.
3.3 Support Vector Machines
The classification method used by prior work did not give very accurate results. Hence, we propose the use of the SVM technique for better authentication accuracy.
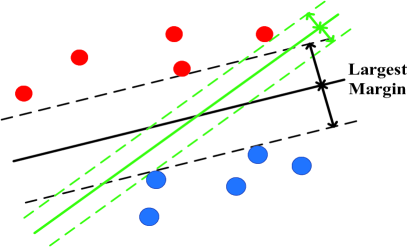
Support Vector Machines (SVMs) are state-of-the-art large margin classifiers, which represent a class of supervised machine learning algorithms first introduced by [Vapnik and Vapnik, 1998]. SVMs have recently gained popularity for human activity recognition on smartphones [Anguita et al., 2012]. In this section, we provide a brief review of the related theory of SVMs [Cristianini and Shawe-Taylor, 2000], [Vapnik and Vapnik, 1998].
After obtaining the features from sensors, we use SVM as the classification algorithm in the system. The training data is represented as for data-label pairs. For binary classification, the data space is and the label set is . The predictor is . The objective function is . The SVM finds a hyperplane in the training inputs to separate two different data sets such that the margin is maximized. Figure 2 illustrates the concept of SVM classification. A margin is the distance from the hyperplane to a boundary data point. The boundary point is called a support vector and there may exist many support vectors. The most popular method of training such a linear classifier is by solving a regularized convex optimization problem:
| (1) |
where
| (2) |
|
5 | 10 | 20 | 40 | 60 | 120 | 240 | 360 | 480 | 600 | 900 | 1200 | ||||||||||||
| acc(PU) | 90.1 | 88.3 | 85.4 | 85.3 | 84.5 | 84.0 | 80.2 | 79.2 | 76.4 | 69.2 | 68.8 | 58.6 | ||||||||||||
| mag(PU) | 91.0 | 88.9 | 86.2 | 84.6 | 83.4 | 74.7 | 73.3 | 73.7 | 68.0 | 66.4 | 62.2 | 60.2 | ||||||||||||
| ori(PU) | 76.5 | 74.2 | 72.2 | 71.3 | 69.8 | 67.1 | 65.8 | 64.7 | 63.9 | 62.1 | 60.4 | 59.0 | ||||||||||||
| acc+mag(PU) | 92.0 | 90.0 | 86.4 | 86.6 | 85.9 | 85.3 | 81.5 | 80.3 | 77.9 | 70.6 | 70.5 | 60.4 | ||||||||||||
| acc+ori(PU) | 91.8 | 90.3 | 87.7 | 86.2 | 86.1 | 83.3 | 82.0 | 80.6 | 77.3 | 72.2 | 69.1 | 67.1 | ||||||||||||
| mag+ori(PU) | 92.8 | 91.1 | 87.7 | 86.7 | 84.7 | 86.5 | 81.3 | 74.0 | 69.1 | 65.9 | 63.2 | 58.3 | ||||||||||||
| all(PU) | 93.9 | 92.8 | 90.1 | 89.1 | 87.2 | 85.2 | 84.3 | 82.7 | 78.7 | 72.4 | 70.8 | 67.2 | ||||||||||||
| acc(GCU) | 91.0 | 88.4 | 87.8 | 87.9 | 87.5 | 82.4 | 83.1 | 77.8 | 78.3 | 80.2 | 75.3 | 73.0 | ||||||||||||
| mag(GCU) | 92.3 | 91.2 | 91.0 | 85.7 | 85.2 | 83.4 | 79.5 | 76.7 | 75.3 | 72.2 | 69.8 | 69.5 | ||||||||||||
| ori(GCU) | 64.2 | 63.9 | 63.8 | 60.8 | 60.7 | 60.6 | 60.0 | 60.0 | 59.1 | 58.0 | 57.5 | 57.3 | ||||||||||||
| acc+mag(GCU) | 95.5 | 95.8 | 94.7 | 93.7 | 92.7 | 91.8 | 89.2 | 86.7 | 84.0 | 83.1 | 81.4 | 79.6 | ||||||||||||
| acc+ori(GCU) | 96.4 | 96.6 | 95.5 | 94.3 | 93.1 | 92.0 | 90.0 | 87.1 | 84.7 | 83.5 | 82.7 | 79.4 | ||||||||||||
| mag+ori(GCU) | 91.8 | 90.3 | 87.7 | 86.2 | 84.3 | 82.2 | 80.8 | 79.1 | 76.2 | 73.2 | 71.1 | 70.1 | ||||||||||||
| all(GCU) | 97.4 | 97.1 | 96.7 | 95.7 | 95.3 | 93.1 | 90.0 | 89.1 | 87.5 | 85.9 | 83.1 | 80.2 | ||||||||||||
The margin is in SVM. So, Equation 1 minimizes the reciprocal of the margin (first part) and the misclassification loss (second part). The loss function in SVM is the Hinge loss (Equation 2) [Gentile and Warmuth, 1998]. Sometimes, we need to map the original data points to a higher dimensional space by using a kernel function so as to make training inputs easier to separate. In our classification, we label the smartphone owner’s data as positive and all the other users’ data as negative. Then, we exploit such a model to do authentication. Ideally, only the user who is the owner of the smartphone is authenticated, and any other user is not authenticated. In our experiments, we selected LIBSVM [Chang and Lin, 2011] to implement the SVM. The input of our experiment is n positive points from the legitimate user and n negative data points from randomly selected n other users. The output is the user’s profile for the legitimate user.
4 EXPERIMENTAL RESULTS
Figure 1 shows the steps in our experiments. The following are some settings in our experiments:
-
•
We use both the PU data set and the GCU data set.
-
•
We use accelerometer, magnetometer and orientation sensors (can be extended to other sensors).
-
•
We re-sample the data by averaging the original data, with the sampling rate changing from 1 second to 20 minutes.
-
•
Each data is a 9-dimensional vector (three values for each sensor). We use SVM to train the data within one day to obtain a user’s profile.
-
•
We label one user’s data as positive and the other users’ data as negative, and randomly pick equivalent data from both positive and negative sets.
-
•
We experiment with data from one sensor, a pair of two sensors, and all three sensors to train the user’s profile. We show that multi-sensor-based authentication indeed improves the authentication accuracy.
-
•
In our experiments, we use 10-fold cross validation, which means that the size of training data over the size of training data and testing data is 1/10.
4.1 Single-sensor authentication
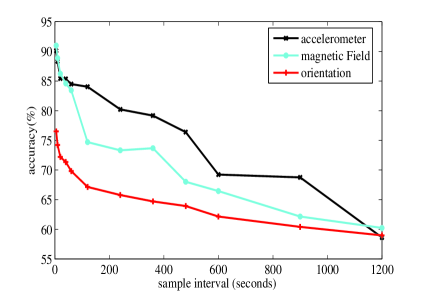
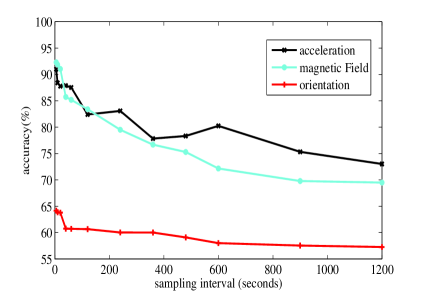
From Figure 3, we observe the single-sensor-based system in both the PU data set and the GCU data set. First, we find that the accuracy increases with faster sampling rate because we use more detailed information from each sensor. Second, an interesting finding is that the accelerometer and the magnetometer have much better accuracy performance than the orientation sensor, especially for the GCU data set. We think this is because they both represent a user’s longer-term patterns of movement (as measured by the accelerometer) and his general environment (as measured by the magnetometer). The orientation sensor represents how the user holds a smartphone [Xu et al., 2012], which may be more variable. Therefore, the accelerometer and magnetometer have better authentication accuracy. The difference is more marked in the GCU data set, but the overall relative accuracy of the three sensors is the same in both data sets. The accuracy is below 90% even for fast sampling rates like 10 seconds (see also Table 5).
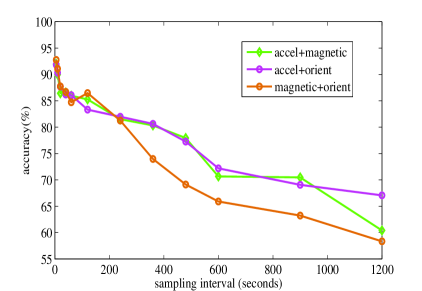
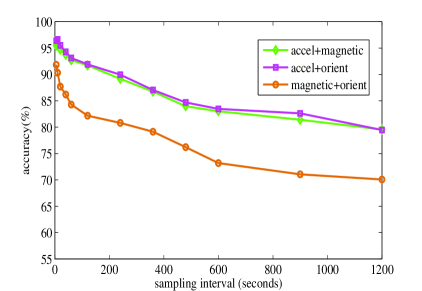
4.2 Two-sensor authentication
Fig. 4 shows that for all pairwise combinations, accuracy increases with faster sampling rate. The combination of data from two sensors indeed gives better authentication accuracy than using a single sensor (see Table 5). The average improvement from one sensor to two sensors is 7.4% in PU data set (14.6% in GCU data set) when the sampling rate is 20 seconds. Another interesting finding is that using a combination of magnetometer and orientation sensors is worse than the other two pairs which include an accelerometer. In fact, the combination of magnetometer and orientation sensors is not necessarily better than using just the accelerometer (see also Table 4). Therefore, choosing good sensors is very important. Also, using higher sampling rate gives better accuracy.

|
1 | 2 | 5 | 10 | 20 | 40 | 60 | |
|---|---|---|---|---|---|---|---|---|
|
33502s | 1855s | 170.72s | 39.85s | 6.07s | 1.19s | 0.51s | |
| training time (GCU Data Set) | 23101s | 485s | 62.41s | 9.43s | 1.02s | 0.21s | 0.17s |
4.3 Three-sensor authentication
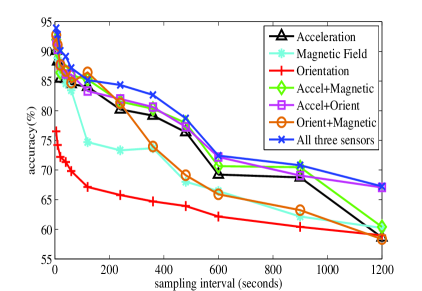
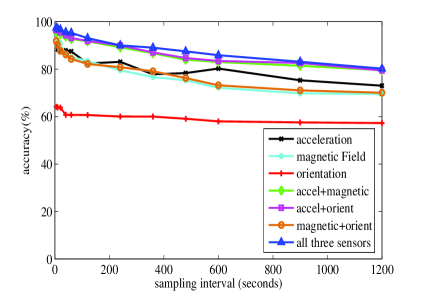
Now, we compare the three-sensor-based system with one and two sensor-based authentication experiments. From Figure 5 and Table 4, we observe that the three-sensor results give the best authentication accuracy, as represented by the top line with triangles in both data sets, seen more clearly as the highest value in each column in Table 4. Again, we find that the accuracy increases with faster sampling rates because we use more detailed information from each sensor.
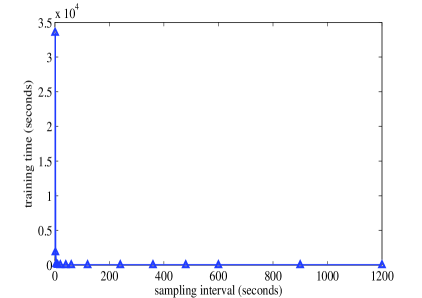
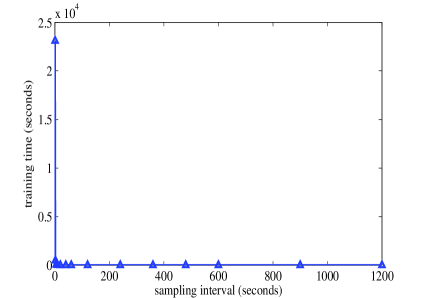
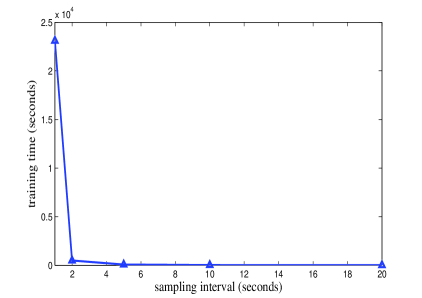
4.4 Training Time vs. Sampling Rate
In the rest of the evaluations below, we use the three-sensor-based system, since it has the best authentication accuracy.
From Figure 5 and Table 4, when the sampling rate is higher than 4 minutes (samples every 240 seconds or less), the accuracy in the PU data set is better than 80%, while that in the GCU data set is better than 90%. The average improvement from two sensors to three sensors is 3.3% in PU data set (4.4% in GCU data set) when the sampling rate is 20 seconds. Furthermore, when the sampling rate is higher than 20 seconds, the accuracy in the PU data set is better than 90%, while that in the GCU data set is better than 95%.
Figure 6 and table 5 shows that a higher sampling rate (smaller sampling interval) needs more time to train a user’s profile. The time exponentially increases with the increase of the sampling rate. It is a trade-off between security and convenience. However, the good news is that when the sampling interval is about 20 seconds, it only needs less than 10 seconds in the PU data set (and roughly 1 second in the GCU data set) to train a user’s profile, but the accuracy is higher than 90% (and 95% in the GCU data set), as seen from Table 5. It means that a user only needs to spend less than 10 seconds to train a new model to do the implicit authentication for the whole day in the PU data set and only 1 second for the GCU data set.
These findings validate the effectiveness of our method and its feasibility for real-world applications. Furthermore, our method can be customized for users. They can change their security level by easily changing the sampling rate of sensors in their smartphones.
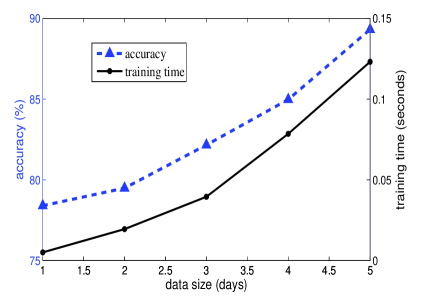
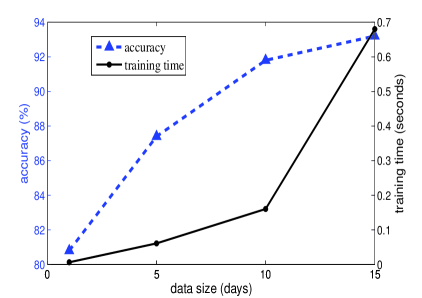
4.5 Accuracy and Time vs. Data size
Figure 7 shows another trade-off between security and convenience. We choose a sampling interval of 10 minutes and a training data size ranging from 1 day to 5 days in the PU data set (and 1 day to 15 days in the GCU data set). The blue dashed line with triangles shows that the accuracy increases with the increase of training data size. The black solid line with circles shows that the training time increases with the increase of training data size.
5 CONCLUSION
In this paper, we utilize three sensors: the accelerometer, the orientation sensor and the magnetometer. We apply the SVM technique as the classification algorithm in the system, to distinguish the smartphone’s owner versus other users, who may potentially be attackers or thieves. In our experiments, we compare the authentication results for different sampling rates and different data sizes, which show a trade-off between accuracy performance and the computational complexity. Furthermore, we experiment with data from a single sensor and from a combination of two sensors, to compare their results with data from all three sensors. We find that the authentication accuracy for the orientation sensor degrades more than that of the other two sensors. Therefore, the data collected from the orientation sensor is not as important as that from the accelerometer and magnetometer, which tend to measure more stable, longer-term characteristics of the user’s coarse-grained movements and his general physical location, respectively.
Utilizing sensors to do implicit user authentication is very interesting and promising. Our work also suggests some other interesting research directions. First, we can use more detailed sensors’ information to further improve the authentication accuracy. Second, we can try to combine the time information with frequency information to better obtain a user’s profile. Many other issues relating to the user’s privacy remain. It is also interesting to launch an attack through the sensors’ information because our research also shows that indeed, sensors can represent a user’s characteristic behavior and physical environment.
ACKNOWLEDGEMENTS
This work was supported in part by NSF CNS-1218817. We also appreciate the help of Dr. Gunes Kayacik at Glasgow Caledonian University for providing us the GCU data set.
REFERENCES
- [Anguita et al., 2012] Anguita, D., Ghio, A., Oneto, L., Parra, X., and Reyes-Ortiz, J. L. (2012). Human activity recognition on smartphones using a multiclass hardware-friendly support vector machine. In Ambient assisted living and home care, pages 216–223. Springer.
- [Buthpitiya et al., 2011] Buthpitiya, S., Zhang, Y., Dey, A. K., and Griss, M. (2011). n-gram geo-trace modeling. In Pervasive Computing.
- [Chang and Lin, 2011] Chang, C.-C. and Lin, C.-J. (2011). LIBSVM: A library for support vector machines. ACM Transactions on Intelligent Systems and Technology, 2:27:1–27:27.
- [ConsumerReports, 2013] ConsumerReports (2013). Keep your phone safe: How to protect yourself from wireless threats. Consumer Reports, Tech.
- [Cristianini and Shawe-Taylor, 2000] Cristianini, N. and Shawe-Taylor, J. (2000). An introduction to support vector machines and other kernel-based learning methods. Cambridge university press.
- [Gentile and Warmuth, 1998] Gentile, C. and Warmuth, M. K. (1998). Linear hinge loss and average margin. In Conference and Workshop on Neural Information Processing Systems, volume 11, pages 225–231.
- [Kayacık et al., 2014] Kayacık, H. G., Just, M., Baillie, L., Aspinall, D., and Micallef, N. (2014). Data driven authentication: On the effectiveness of user behaviour modelling with mobile device sensors. Mobile Security Technologies.
- [Li et al., 2013] Li, L., Zhao, X., and Xue, G. (2013). Unobservable re-authentication for smartphones. In Network and Distributed System Security Symposium.
- [Marquardt et al., 2011] Marquardt, P., Verma, A., Carter, H., and Traynor, P. (2011). (sp) iphone: decoding vibrations from nearby keyboards using mobile phone accelerometers. In ACM Conference on Computer and Communications Security.
- [Michalevsky et al., 2014] Michalevsky, Y., Boneth, D., and Nakibly, G. (2014). Gyrophone: Recognizing speech from gyroscope signals. In USENIX Security.
- [Nickel et al., 2012] Nickel, C., Wirtl, T., and Busch, C. (2012). Authentication of smartphone users based on the way they walk using k-nn algorithm. In Intelligent Information Hiding and Multimedia Signal Processing (IIH-MSP), 2012 Eighth International Conference on.
- [Trojahn and Ortmeier, 2013] Trojahn, M. and Ortmeier, F. (2013). Toward mobile authentication with keystroke dynamics on mobile phones and tablets. In Advanced Information Networking and Applications Workshops (WAINA), 2013 27th International Conference on.
- [Vapnik and Vapnik, 1998] Vapnik, V. N. and Vapnik, V. (1998). Statistical learning theory, volume 2. Wiley New York.
- [Wu et al., 2013] Wu, P., Zhu, J., and Zhang, J. Y. (2013). Mobisens: A versatile mobile sensing platform for real-world applications. Mobile Networks and Applications, 18(1):60–80.
- [Xu et al., 2012] Xu, Z., Bai, K., and Zhu, S. (2012). Taplogger: Inferring user inputs on smartphone touchscreens using on-board motion sensors. In Proceedings of the fifth ACM conference on Security and Privacy in Wireless and Mobile Networks.
- [Zhu et al., 2013] Zhu, J., Wu, P., Wang, X., and Zhang, J. (2013). Sensec: Mobile security through passive sensing. In International Conference on Computing, Networking and Communications.