Segmenting Dermoscopic Images
Abstract
We propose an automatic algorithm, named SDI, for the segmentation of skin lesions in dermoscopic images, articulated into three main steps: selection of the image ROI, selection of the segmentation band, and segmentation. We present extensive experimental results achieved by the SDI algorithm on the lesion segmentation dataset made available for the ISIC 2017 challenge on Skin Lesion Analysis Towards Melanoma Detection, highlighting its advantages and disadvantages.
1 Introduction
Several diagnostic protocols are usually adopted by dermatologists for analyzing and classifying skin lesions, such as the so-called ABCD-rule of dermoscopy [1]. Due to the subjective nature of examination, the accuracy of diagnosis is highly dependent upon human vision and dermatologist’s expertise. Computerized dermoscopic image analysis systems, based on a consistent extraction and analysis of image features, do not have the limitation of this subjectivity. These systems involve the use of a computer as a second independent and objective diagnostic method, which can potentially be used for the pre-screening of patients performed by non-experienced operators. Although computerized analysis techniques cannot provide a definitive diagnosis, they can improve biopsy decision-making, which some observers feel is the most important use for dermoscopy [2]. Recently, numerous researches on this topic propose systems for the automated detection of malignant melanoma in skin lesions (e.g., [3, 4, 5, 6, 7, 8]). In our previous study on dermoscopic images [6], the segmentation of the skin area and the lesion area was achieved by a semi-automatic process based on Otsu algorithm [9], supervised by a human operator. Here, we propose a full automatic segmentation method consisting of three main steps: selection of the image ROI, selection of the segmentation band, and segmentation.
2 SDI Algorithm
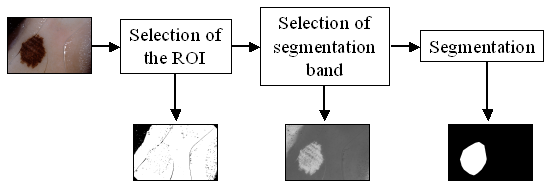
The block diagram of the segmentation algorithm proposed for dermoscopic images, named SDI algorithm, is shown in Fig. 1. The three main steps are described in the following.
2.1 Selection of the Image ROI
In order to achieve an easier and more accurate segmentation of the skin lesion, it is advisable to select the region of interest (ROI), i.e., the subset if image pixels that belong to either the lesion or the skin. This region excludes image pixels belonging to (usually dark) areas of the image border and/or corners, as well as those belonging to hair, that will not be taken into account in the subsequent steps of the SDI algorithm.
In the proposed approach, the Value band of the image in the HSV color space is chosen in order to select dark image pixels; these are excluded from the ROI if they cover most of the border or the angle regions of the image.
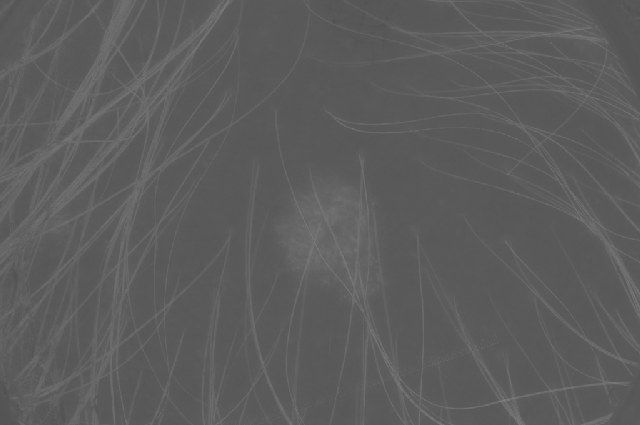
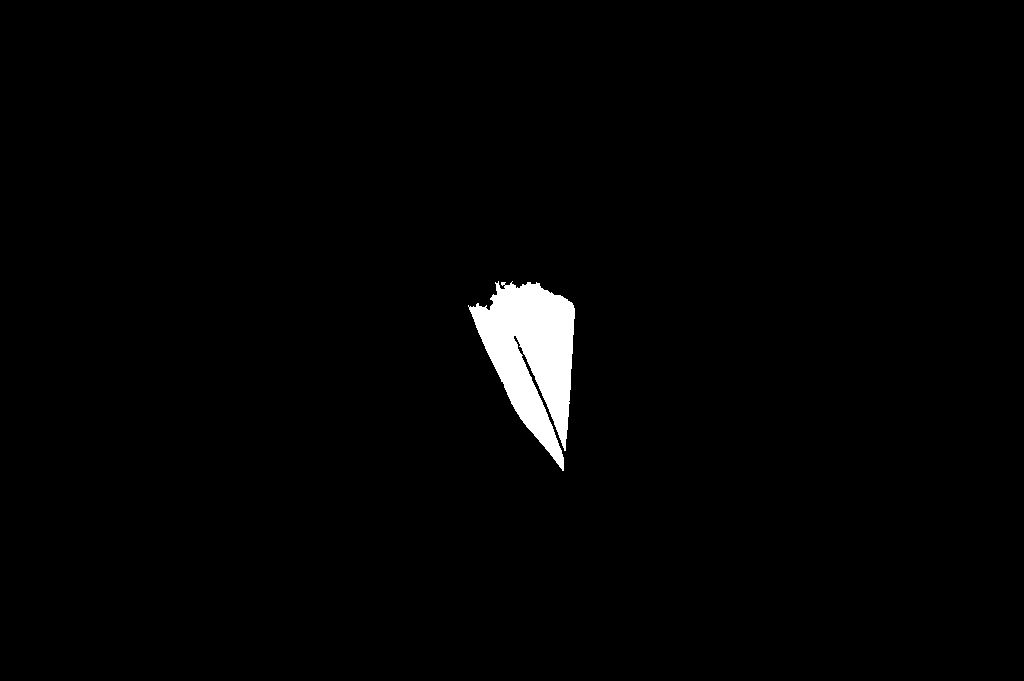
Concerning hair, many highly accurate methods have been proposed in the literature [7]. Here, we adopted a bottom-hat filter in the Red band of the RGB image.
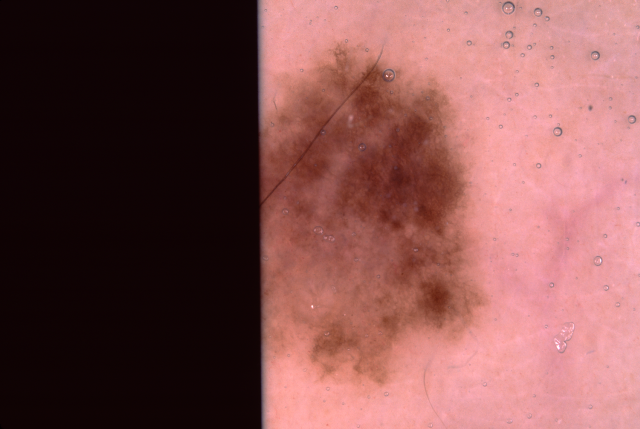
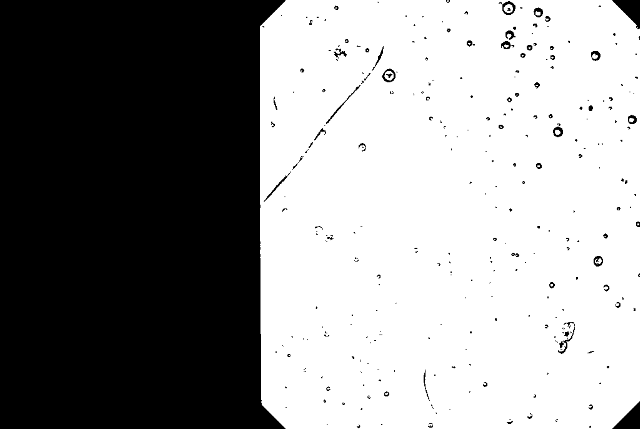
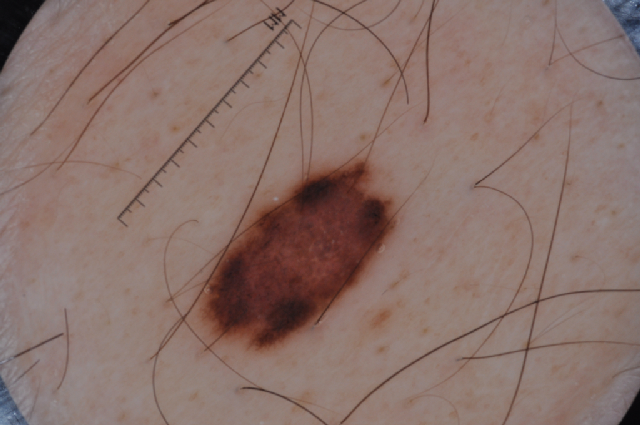
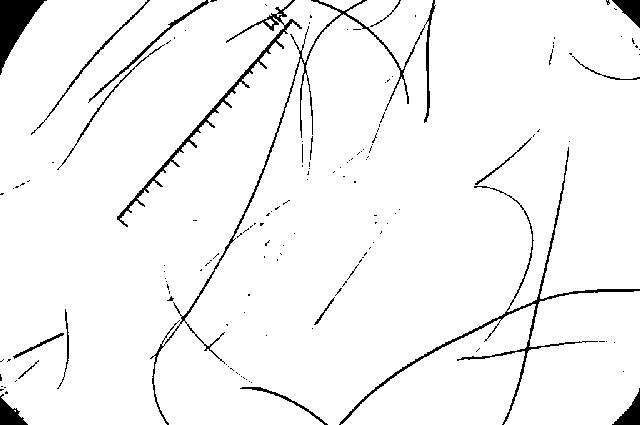
An example of the ROI selection process is reported in Fig. 2 for the ISIC 2017 test image no. 15544. Here, we observe that the wide dark border on the left of the image, as well as the dark hair over the lesion, have properly been excluded from the ROI mask.
 |
 |
| (a) | (b) |
2.2 Selection of the Segmentation Band
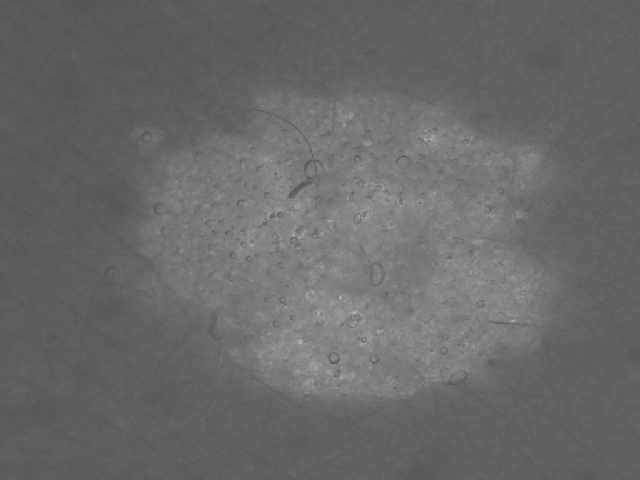
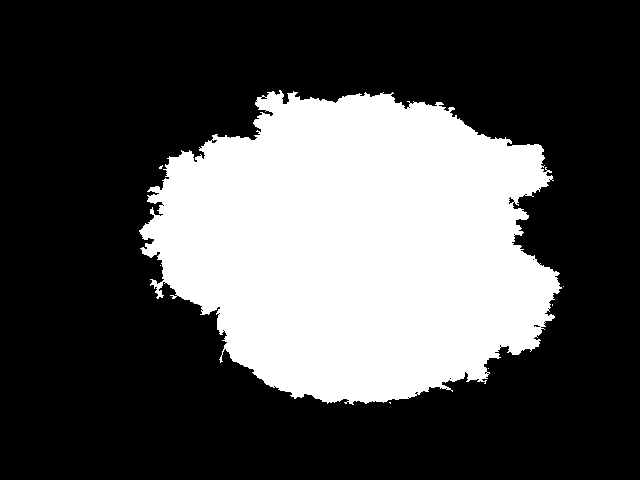
Lesion segmentation can be made easier if the proper color band of the dermoscopic image is chosen. After thorough experimentation, we selected two color bands that allow proper segmentation: the Red band (Rnorm) in the normalized RGB color space and the Value band (V) of the image in the HSV color space.
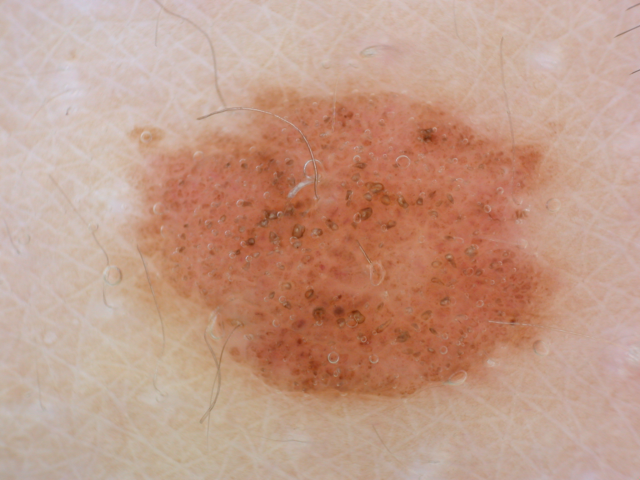
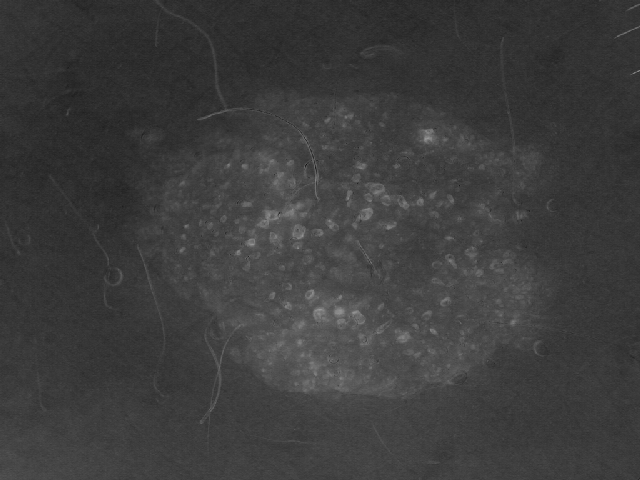
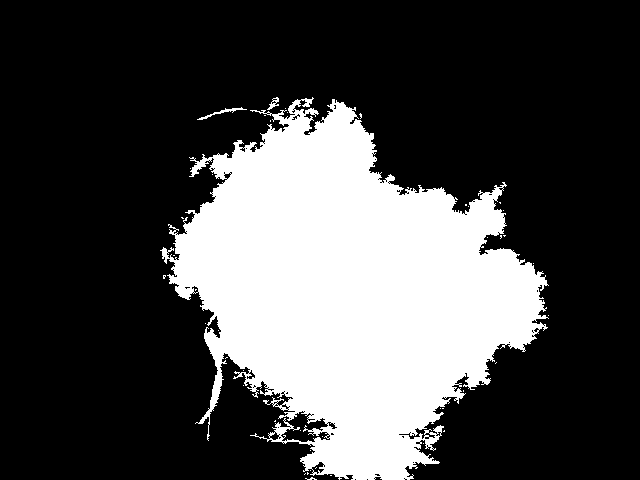
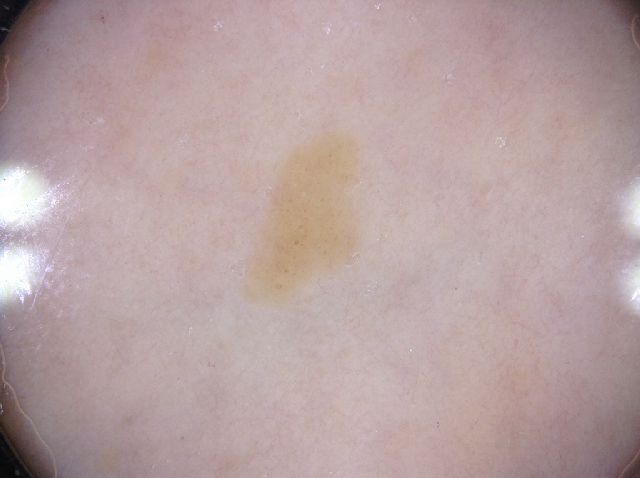
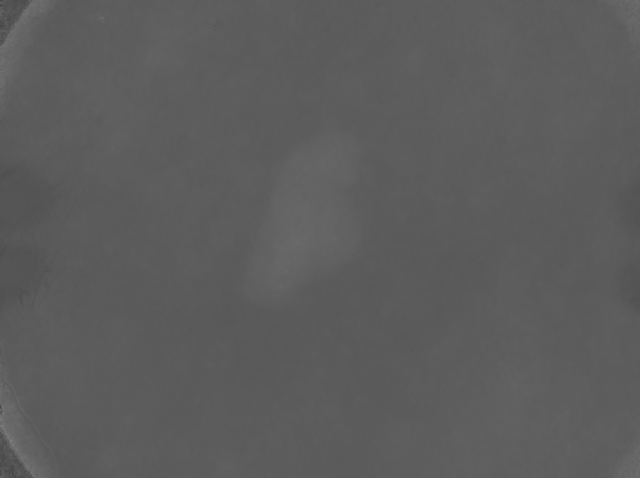
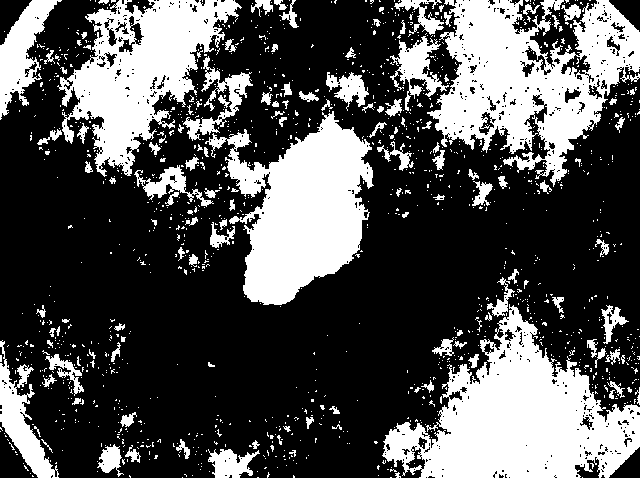
Indeed, Rnorm is often a good choice for segmentation of dermoscopic images, as the normalized RGB space eliminates the effect of varying intensities due to uneven illumination and it is free from shadow and shading effects. For example, for ISIC training image 122 (first row of Fig. 3-(a)) the Rnorm band (Fig. 3-(b)) is not affected by the uneven illumination of the image (brighter in the upper part), and its binarization (Fig. 3-(c)) provides a quite faithful lesion segmentation. Instead, the V band (Fig. 3-(d)) is affected by the uneven illumination and its binarization (Fig. 3-(e)) includes into the segmentation mask also scarcely illuminated skin areas in the bottom of the lesion.
However, there are cases where the V band is a better choice, as shown for ISIC training image 12481 (second row of Fig. 3). Here, the Rnorm band almost annihilates the discrimination of the lesion by the surrounding skin, leading to a wrong segmentation, while thresholding in V band provides an almost perfect segmentation.
A comparison of the segmentations provided by the two color bands allows us to automatically select the most appropriate for the final segmentation.
 |
 |
 |
 |
 |
 |
 |
 |
 |
 |
| (a) | (b) | (c) | (d) | (e) |
2.3 Segmentation
Once the proper color band of the image has been selected, segmentation is achieved by the Otsu algorithm, that computes the optimal threshold separating the two classes of pixels (skin and lesion) so that their intra-class variance is minimal [9].
The lesion area is then selected in the obtained binary mask as the connected component having maximum area. This choice is based on the assumption that dermoscopic images tend to mainly frame the lesion to be analyzed, that thus appear in the image as the predominant objects over the patient skin.
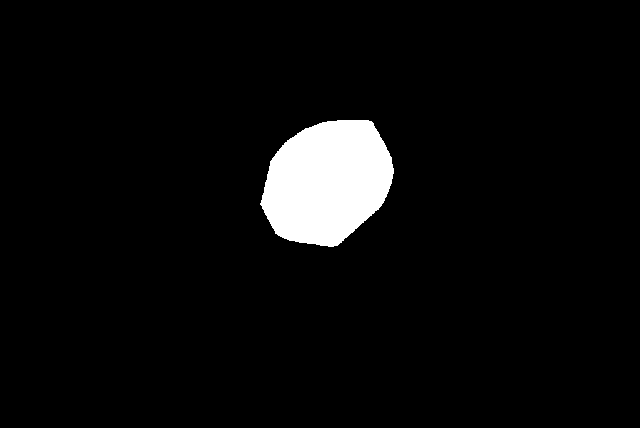
The convex hull of the segmented lesion is then adopted as final segmentation result. Indeed, although the segmented lesion better highlights the lesion contours, generally its convex hull better conforms to the ground truth provided by the dermatologist.
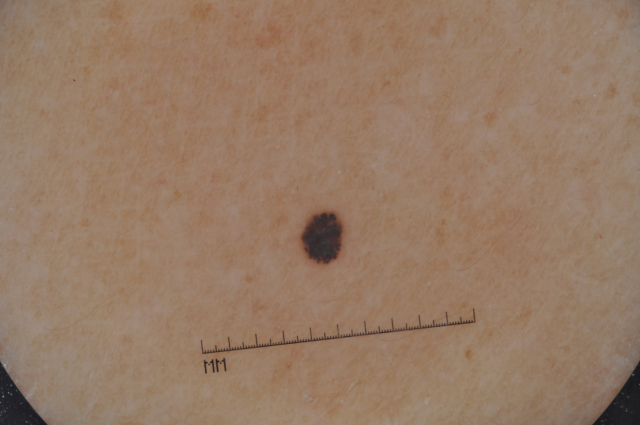
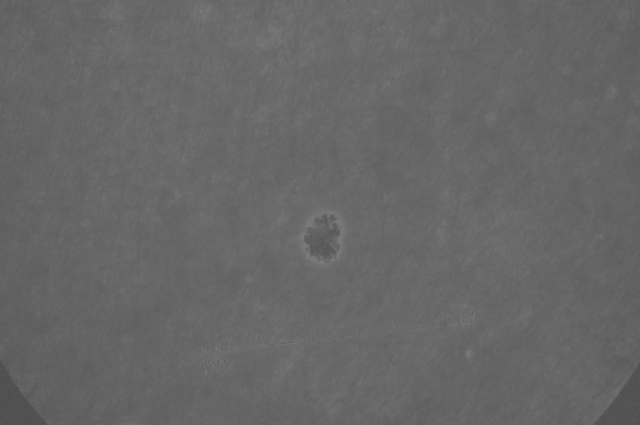
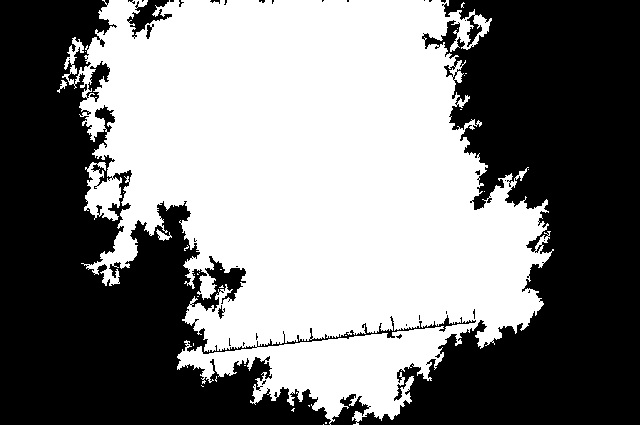
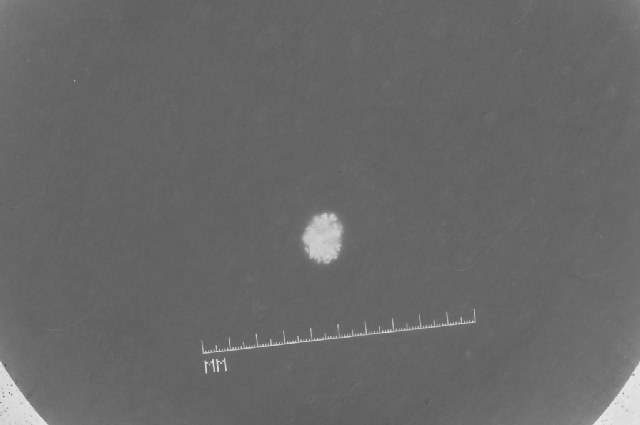
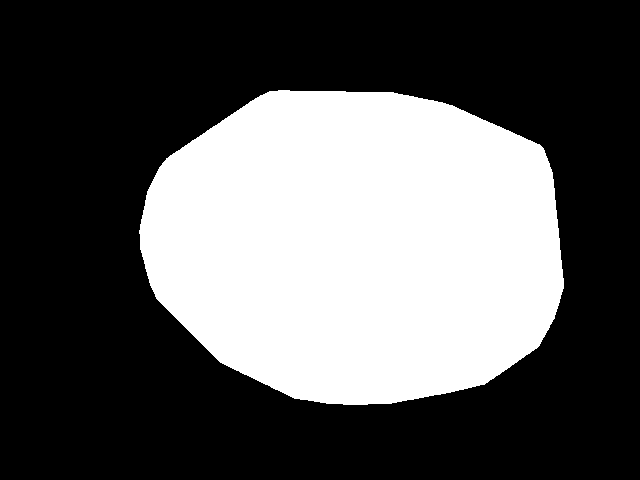
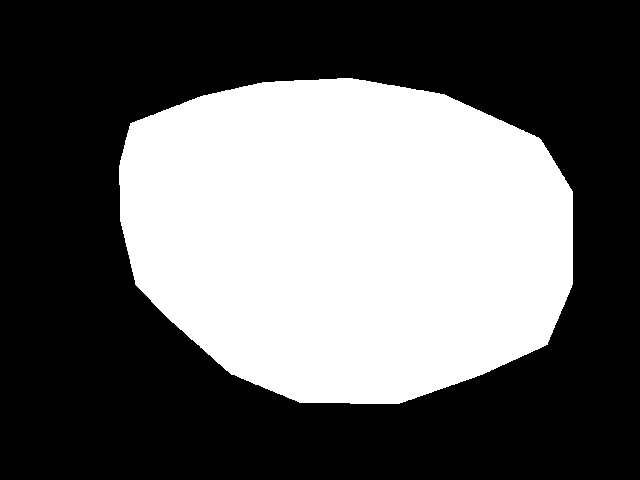
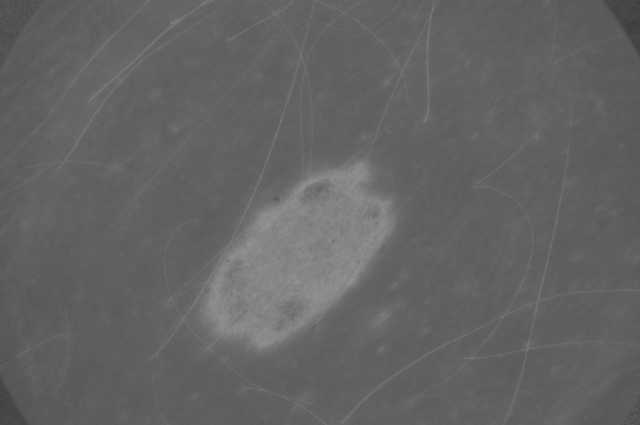
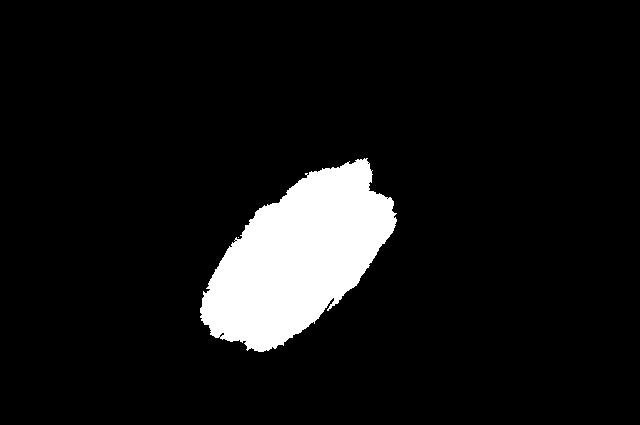
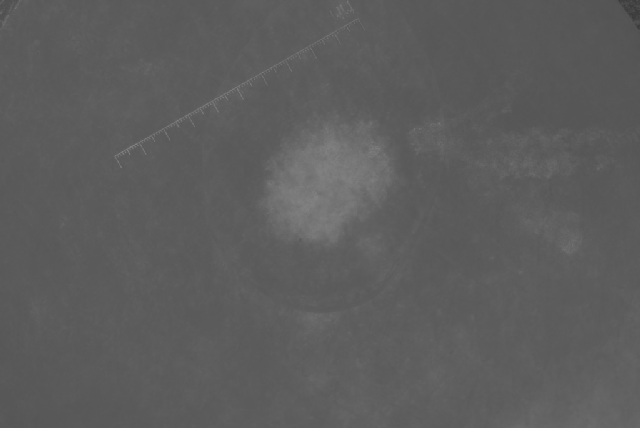
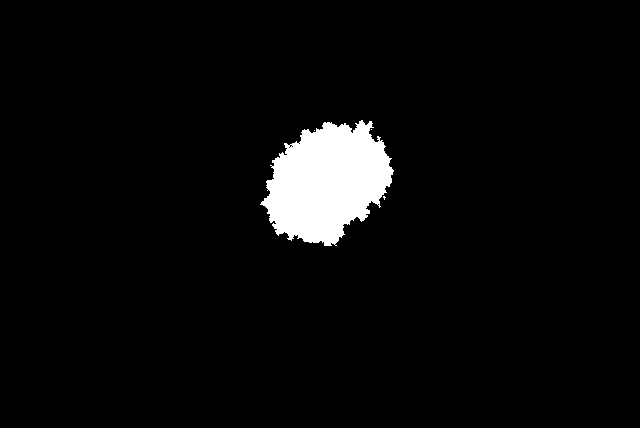
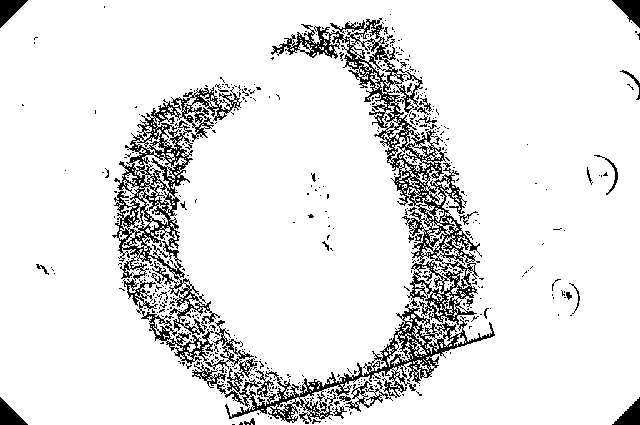
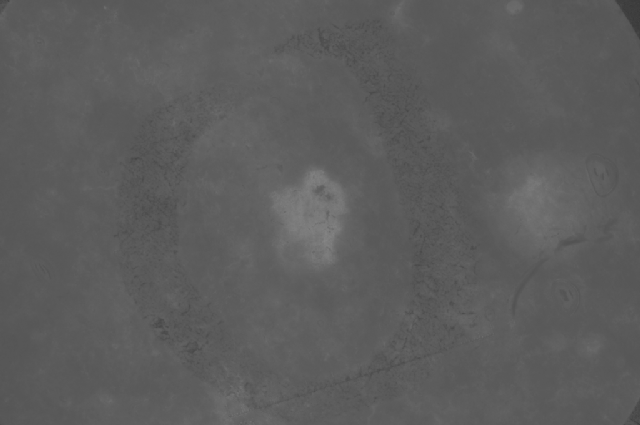
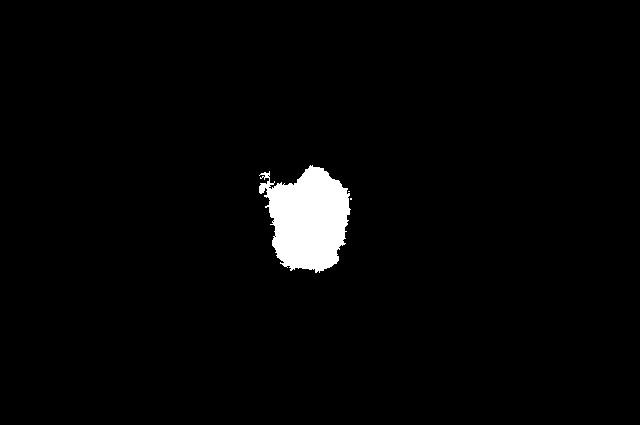
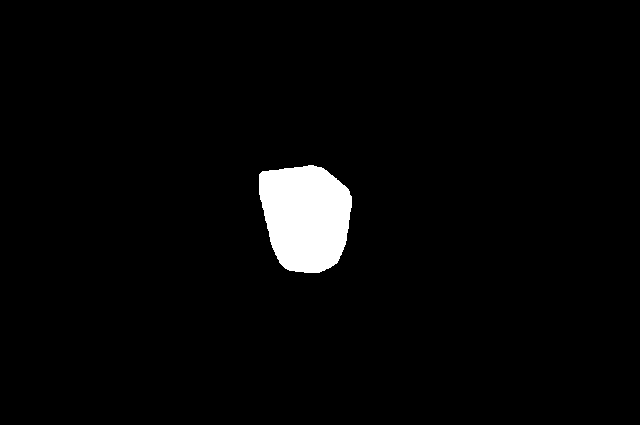
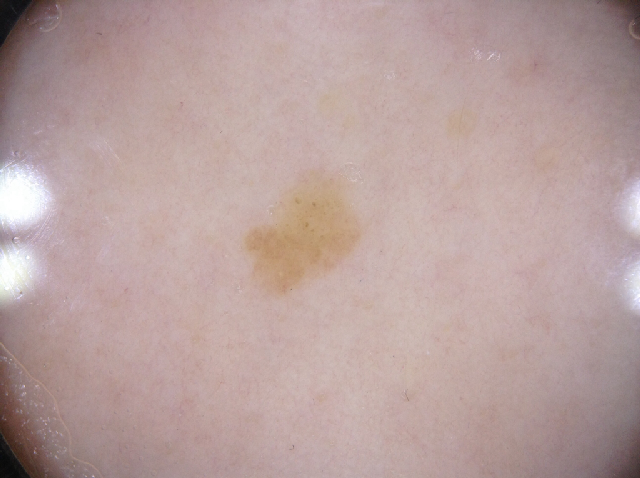
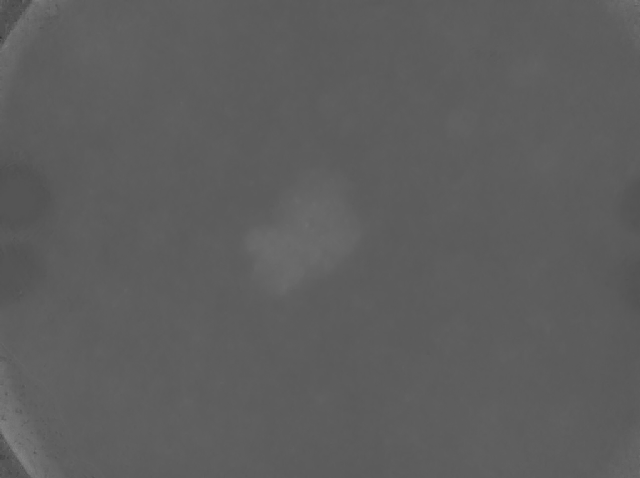
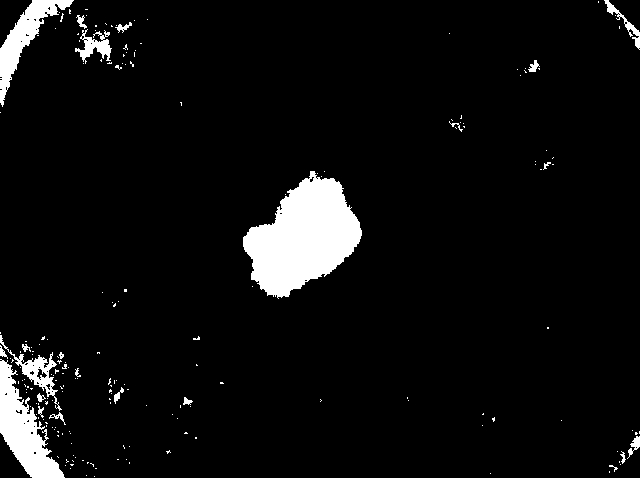
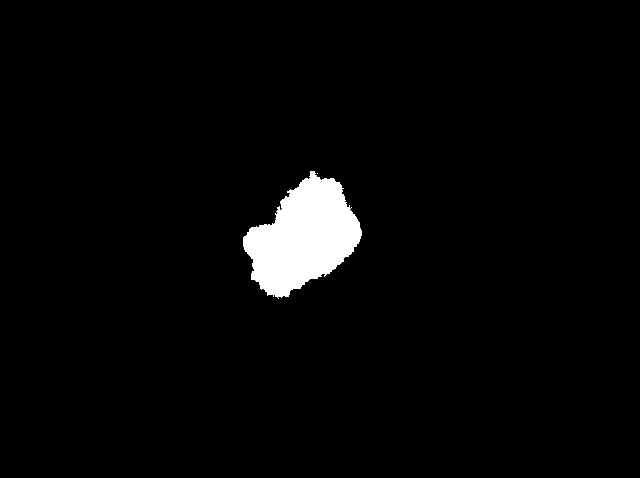
An example of the segmentation process is reported in Fig. 4 for the ISIC 2017 train image no. 122. Here, we observe that the initial SDI segmentation (the connected component having maximum area, reported in Fig. 4-(b)) provides a quite faithful segmentation of the image lesion (Fig. 4-(a)). The final SDI segmentation (the convex hull, reported in Fig. 4-(c)) gives a lesion segmentation that is much rougher, but more similar to the ground truth mask (Fig. 4-(d)).
|
|
 |
 |
| (a) | (b) | (c) | (d) |
3 Analysis of Experimental Results
Here we analyze in detail some of the results achieved by the SDI algorithm on the test segmentation set of the ISIC 2017 challenge, highlighting pro’s and con’s.
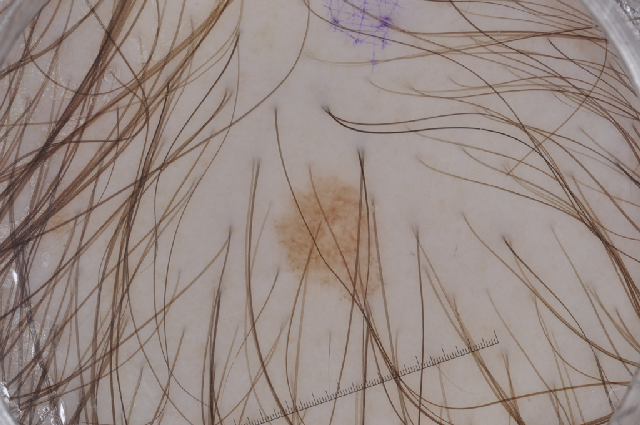
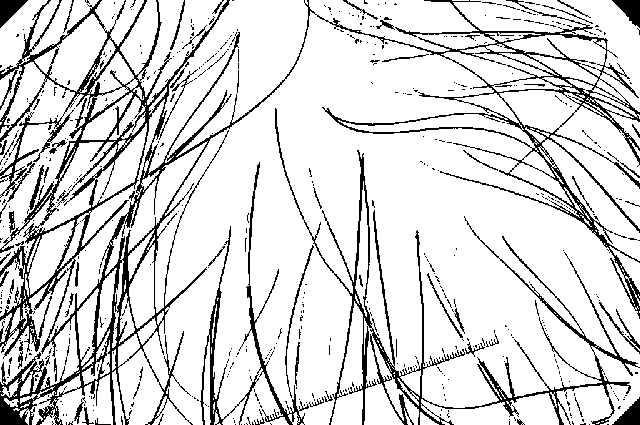
In Fig. 5, we report two examples showing that the bottom-hat filter adopted for excluding hair from the image ROI performs quite well.
 |
 |
 |
 |
 |
 |
 |
 |
 |
 |
| (a) | (b) | (c) | (d) | (e) |
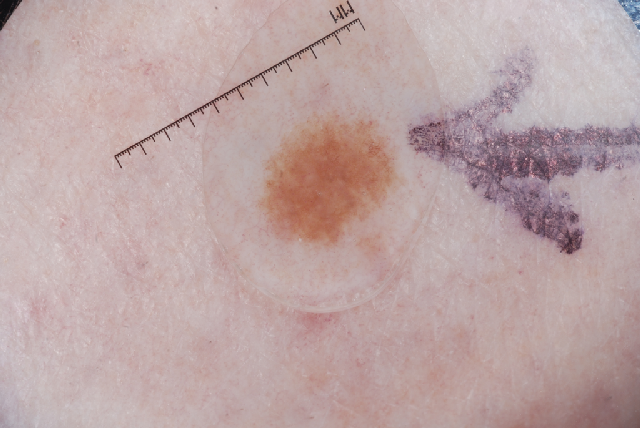
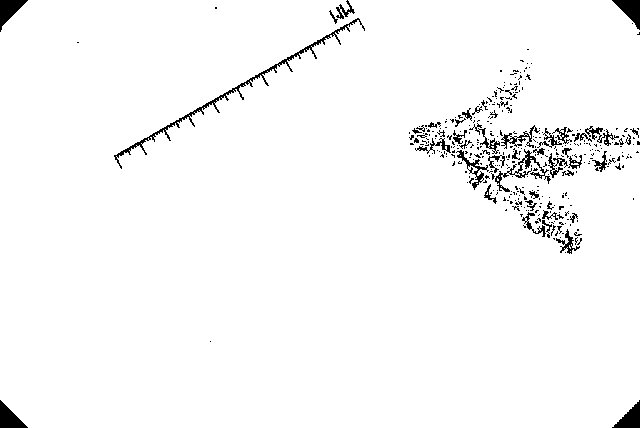
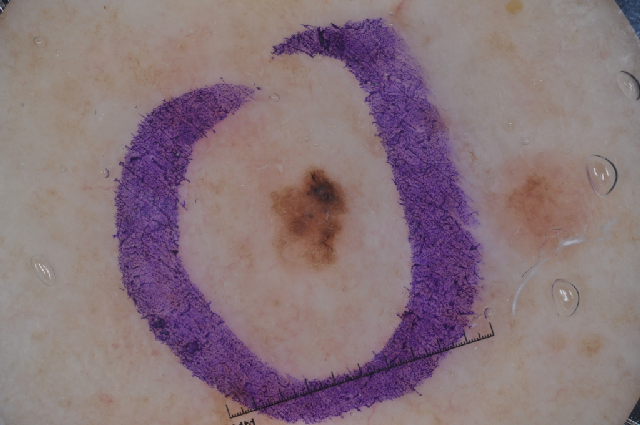
Fig. 6 shows that the selection of the image ROI partly succeeds in excluding from the ROI also ink marker signs. Moreover, the remaining ink pixels that are included into the ROI do not affect the final segmentation, thanks to the selection of the Rnorm band for segmentation.
 |
 |
 |
 |
 |
 |
 |
 |
 |
 |
| (a) | (b) | (c) | (d) | (e) |
We point out the choice of the connected component having the maximum area is not always the best for selecting a correct lesion segmentation. An extreme example is shown in Fig. 7. Here, we can observe that image 14574 is perfectly segmented, while image 14575, that looks pretty similar to the previous one, is wrongly segmented. The error is due to a very different binarization (Fig. 7-(c)), leading to the wrong connected component.
 |
 |
 |
 |
 |
 |
 |
 |
 |
 |
| (a) | (b) | (c) | (d) | (e) |
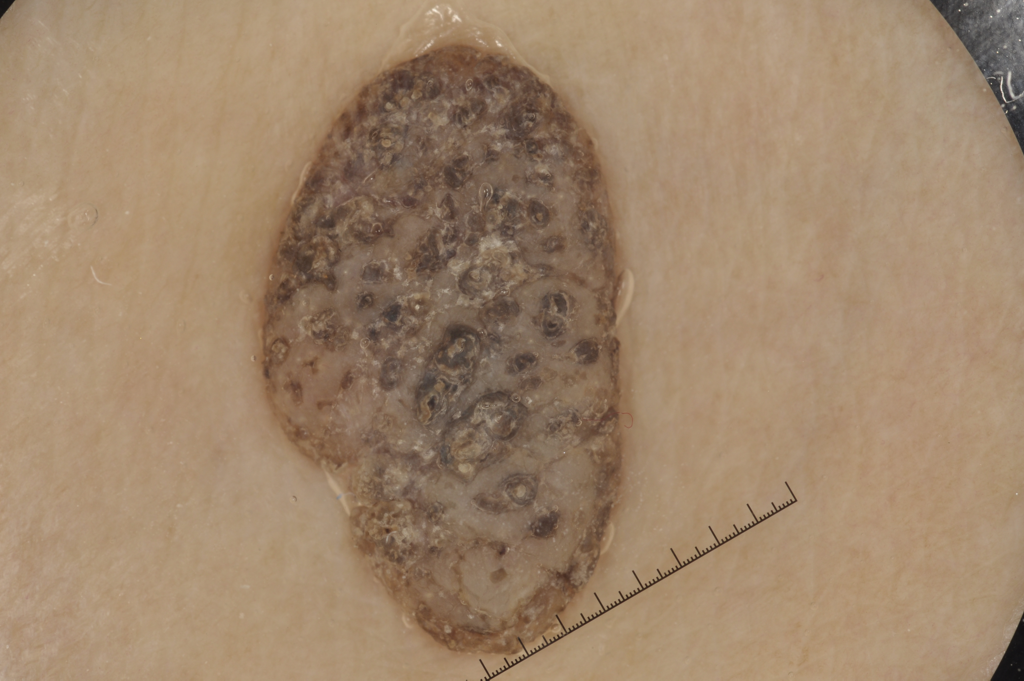
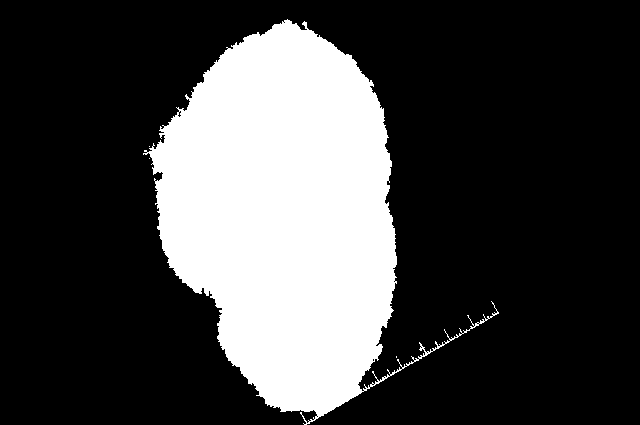
Finally, we observe that, although most of the times the convex hull of the initial SDI segmentation better conforms to the ground truth (see Fig. 4), it can erroneously include into the final segmentation also wide skin areas. This is the case, for example, of image 12272 (Fig. 8), where the ruler mark has been erroneously included into the initial SDI segmentation, leading to a too wide convex hull in the final result.
 |
 |
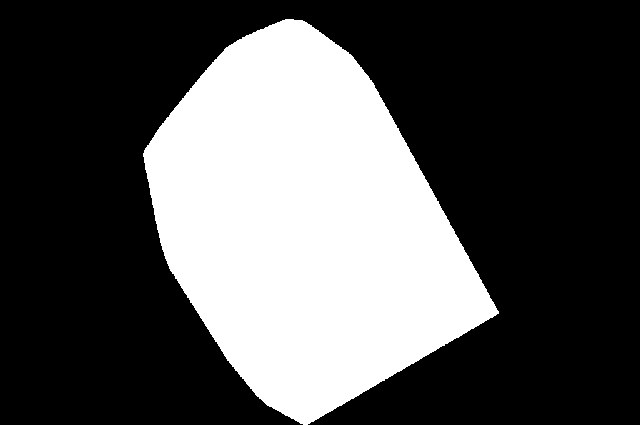 |
| (a) | (b) | (c) |
4 Conclusions
We proposed the SDI algorithm for dermoscopic image segmentation, consisting of three main steps: selection of the image ROI, selection of the segmentation band, and segmentation. The reported analysis of experimental results achieved by the SDI algorithm on the ISIC 2017 dataset allowed us to highlight its pro’s and con’s. This leads us to conclude that, although some accurate results can be achieved, there is room for improvements in different directions, that we will go through in future investigations.
Acknowledgments
This research was supported by LAB GTP Project, funded by MIUR.
References
- [1] W. Stolz, A. Riemann, A. B. Cognetta, l. Pillet, W. Abmayr, D. Holzel, P. Bilek, F. Nachbar, M. Landthaler, and O. Braun-Falco, “Abcd rule of dermoscopy: a new practical method for early recognition of malignant melanoma,” European Journal of Dermatology, vol. 4, pp. 521–527, 1994.
- [2] M. Burroni, R. Corona, G. Dell’eva, F. Sera, R. Bono, P. Puddu, R. Perotti, F. Nobile, L. Andreassi, and P. Rubegni, “Melanoma computer aided diagnosis: Reliability and feasibility study,” Clinical Cancer Research, vol. 10, pp. 1881–1886, 2004.
- [3] M. E. Celebi, H. A. Kingravi, B. Uddin, H. Iyatomi, Y. A. Aslandogan, W. V. Stoecker, and R. H. Moss, “A methodological approach to the classification of dermoscopy images.” Computerized Medical Imaging and Graphics, vol. 31, no. 6, pp. 362–373, September 2007.
- [4] M. E. Celebi, H. Iyatomi, G. Schaefer, and W. V. Stoecker, “Lesion border detection in dermoscopy images,” Computerized Medical Imaging and Graphics, vol. 33, no. 2, pp. 148–153, 2009.
- [5] I. Maglogiannis and C. N. Doukas, “Overview of advanced computer vision systems for skin lesions characterization,” IEEE Transactions on Information Technology in Biomedicine, vol. 13, no. 5, pp. 721–733, 2009.
- [6] V. Cozza, M. R. Guarracino, L. Maddalena, and A. Baroni, “Dynamic clustering detection through multi-valued descriptors of dermoscopic images,” Statistics in Medicine, vol. 30, no. 20, pp. 2536–2550, 2011. [Online]. Available: http://dx.doi.org/10.1002/sim.4285
- [7] M. E. Celebi, T. Mendonca, and J. S. Marques, Eds., Dermoscopy Image Analysis. CRC Press, 2015.
- [8] M. E. Celebi, Q. Wen, H. Iyatomi, K. Shimizu, H. Zhou, and G. Schaefer, “A state-of-the-art survey on lesion border detection in dermoscopy images,” in Dermoscopy Image Analysis, M. E. Celebi, T. Mendonca, and J. S. Marques, Eds. CRC Press, 2015, pp. 97–129.
- [9] N. Otsu, “A threshold selection method from gray-level histograms,” IEEE Trans. Syst., Man, Cybern., vol. 9, no. 1, pp. 62–66, 1979.
- [10] “Isic 2017 challenge on skin lesion analysis towards melanoma detection,” 2017. [Online]. Available: http://challenge2017.isic-archive.com/