Hyperuniform disordered phononic structures
Abstract
We demonstrate the existence of large phononic band gaps in designed hyperuniform (isotropic) disordered two-dimensional (2D) phononic structures of Pb cylinders in epoxy matrix. The phononic band gaps in hyperuniform disordered phononic structures are comparable to band gaps of similar periodic structures, for both out-of-plane and in-plane polarizations. A large number of localized modes is identified near the band edges, as well as, diffusive transmission throughout the rest of the frequency spectrum. Very high- cavity modes for both out-of-plane and in-plane polarizations are formed by selectively removing a single cylinder out of the structure. Efficient waveguiding with almost 100% transmission trough waveguide structures with arbitrary bends is also presented. We expand our results to thin three-dimensional layers of such structures and demonstrate effective band gaps related to the respective 2D band gaps. Moreover, the drop in the factor for the three-dimensional structures is not more than three orders of magnitude compared to the 2D ones.
I Introduction
Phononic crystals, artificial materials with periodically arranged compounds, were introduced more than two decades ago as the elastic waves analogue of photonic crystals Sigalas and Economou (1993); Kushwaha and Halevi (1994). These materials, either in two or three dimensions, are capable of exhibiting large frequency regions of prohibited propagation of elastic waves, the so-called phononic band gaps (PBGs). Phononic crystals have been efficiently used in applications including audible filters Vasseur et al. (2002), acoustic diodes Li et al. (2011) and cloaking Chen and Chan (2010), ultrasound imaging Sukhovich et al. (2008), optomechanics Aspelmeyer et al. (2014), heat conduction Maldovan (2013); Davis and Hussein (2014).
On the other hand, the hyperuniformity concept was first introduced as an order metric for ranking point patterns according to their local density fluctuations Torquato and Stillinger (2003). Hyperuniform structures cover the intermediate regime between random and periodic structures, and exhibit properties usually associated with both of these two extremes. Hyperuniform stealthy disordered photonic structures exhibit large isotropic photonic band gaps and are capable of blocking light of all polarizations Florescu et al. (2009); Man et al. (2013a); Muller et al. (2014). Therefore, they can be efficiently used in the design of low dielectric contrast band gaps Man et al. (2013b), high- optical cavities Florescu et al. (2013); Amoah and Florescu (2015a), free-form waveguides Florescu et al. (2013); Man et al. (2013b); Florescu et al. (2010), polarizers Zhou et al. (2016), plasmon-enhanced Raman spectroscopy Zito et al. (2014), quantum cascade lasers Degl’Innocenti et al. (2016), etc.
Markedly, compared with the studies of disorder in photonic systems, research on disordered phononic systems has been sparse. There have been some studies focused on two-dimensional (2D) Zuo-Dong and Jian-Chun (2005); Wagner et al. (2015) and three-dimensional (3D) Limonov and Rue (2012); Sainidou et al. (2005); Still et al. (2008) disordered phononic structures, but these structures were not ideally suited for opening large phononic band gaps (PBGs). The most insightful study into disorder has been by Chen et al. Chen and Wang (2007). The study of disorder in elastic media is relevant for macroscopic scale applications, such as control of seismic waves Larose et al. (2004) and modeling of rocks Shahbazi et al. (2005) to the micro- and nano-scale applications, including acoustic filters Tourin et al. (2006), piezoelectric materials Li et al. (2007); Wang et al. (2008), aviation Lin et al. , bio-materials Davies et al. (2014), fracture Davies et al. (2014); Shekhawat et al. (2013), manipulation of the thermal conductance Zen et al. (2014); Maldovan (2013); O’Connor and Lebowitz (1974); Maire et al. (2015), etc. Moreover appropriately designed disordered phononic systems can suppress wave transport for a wider range of frequencies than their periodic counterparts Sainidou et al. (2005). Designed hyperuniform disordered phononic structures (HDPS) have the advantage of exploiting both structural disorder, due to the absence of translation symmetry, and sort-scale ordering, due to the high degree of hyperuniformity. This combination makes them ideal for phonon manipulation since they can exhibit large band gaps, isotropy and diffusive propagation at the same time. Therefore they can play a very important role in all the above mentioned application areas.
In this paper we introduce and analyze HDPS. Such structures exhibit structural disorder, while being statistically isotropic Torquato and Stillinger (2003); Uche et al. (2004). Moreover, they are designed from totally disordered initial states, therefore they have no sign of underlying periodicity, which differentiates them from all previous structures studied in the literature. The radial distribution function and the diffraction patterns (2D Fourier transform) of the structure are used to investigate the correlated disorder of the structure. The material parameters used are the same as those used by Chen at al. Chen and Wang (2007); Chen et al. (2010). In Sec. II the band structure of such HPDS is discussed for all polarizations. Large phononic band gaps, similar to the periodic case, are observed. To identify the origin of these gaps we introduce the concentration factor, previously used in the photonic hyperuniform structures, for both out-of-plane (pure transverse) and in-plane (mixed longitudinal-transverse) elastic modes. Localized modes and propagation of elastic waves in these structures are thoroughly investigated. In Sec. III high- cavity modes are introduced into the structures by removing single cylinders and thoroughly analyzed. Moreover, waveguiding through arbitrary shaped waveguides with HDPS-like walls is extensively discussed. Sec. IV extends the previous results in finite thickness 3D slabs.
II Frequency Bands of 2D structures
A hyperuniform point pattern is a point pattern in real space for which the number variance within a spherical sampling window of radius (in dimensions) grows more slowly than the window volume () for large . We furthermore consider that the point pattern is stealthy, i.e., the structure factor , defined as Torquato and Stillinger (2003)
| (1) |
where are vectors in the reciprocal space and , are the positions of the particles, is isotropic and vanishes for a finite range of wave numbers for some positive critical wave vector, Batten et al. (2008). The size of this region can be expressed through the so-called stealthy parameter , where the number of linearly independent vectors where and in the present case Batten et al. (2008); Florescu et al. (2009).
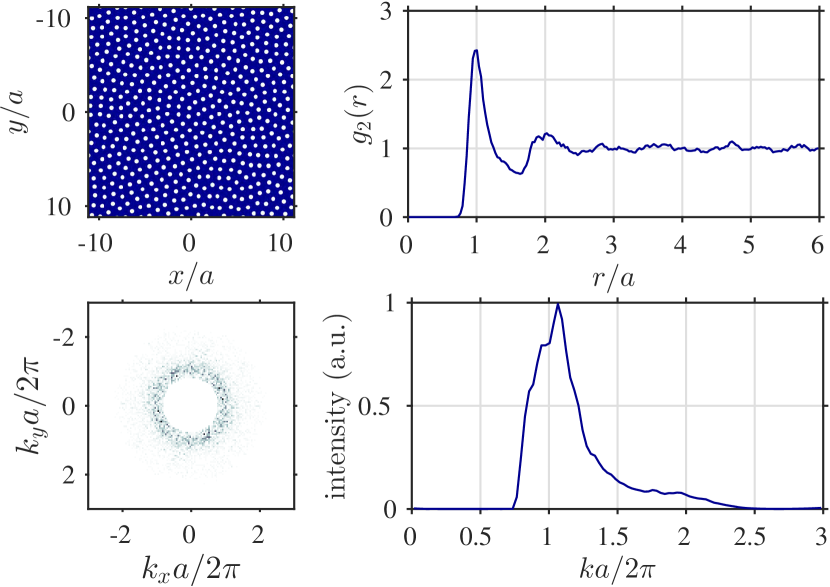
We consider, as a working example, an HDPS consisting of identical cylinders with a radius , being the average distance among the centers of the cylinders, distributed according to a stealthy hyperuniform point pattern, as shown in Fig. 1(a), with . We consider a supercell of the structure with dimensions . Fig. 1(b) depicts the radial distribution function, Torquato and Stillinger (2003). We can clearly identify two peaks corresponding to first and second neighbor average distance. Fig. 1(c) depicts the magnitude of the 2D Fourier components (structure factor) of the image of structure (Fig. 1(a)), i.e. the structure factor of the decorated point pattern. This structure factor differs from the structure factor of the point pattern only at the high- values, i.e. outside the region of the ring we observe in Fig. 1(c). The “stealthiness” of the structure can be clearly identified by the radial symmetry and the region of vanishing structure factor within a circle of radius with , as shown in Fig. 1(d).
Let us now consider the propagation of elastic waves through the structure. We are interested in the frequency-domain response of the structures, i.e., we solve for fields of the form , where the (complex) time-independent elastic field component at position and the angular frequency. The time-independent wave equation in an inhomogeneous isotropic medium characterized by position-dependent mass density and position-dependent Lamè coefficients and takes the form Chen et al. (2010)
| (2) |
where the tensor gradient of the displacement field and the transpose of the tensor gradient. A 2D structure is composed of infinite-height cylinders, i.e. the system is considered to be homogeneous along the direction and propagation is restricted in the plane. In this case Eq. (2) splits into two independent sets of equations, namely,
| (3) |
for elastic waves polarized along the axis and
| (4) | |||||
for elastic waves polarized parallel to the plane, where and . We note that Eq. (3) is a pseudo-scalar equation for the component of the purely transverse elastic field, however Eq. (4) couples the and components of the elastic field. Moreover, is a mixture of a longitudinal and a transverse component. In order to separate the longitudinal and transverse components we can use the displacement potentials and , which are defined by the equation
| (5) |
The wave equations satisfied by the displacement potentials, and , can be written in the form
| (6) |
and
| (7) |
where and the longitudinal wave and transverse wave velocities, respectively White (1958). Therefore the scalar potential is connected to purely longitudinal waves, while the vector potential is connected to purely transverse (shear) waves. Moreover for the in-plane waves we consider here it can be easily shown that . These potentials carry the same phase shift information as the initial fields. However these potentials need not be continuous along interfaces. We note that the quantity , which in the linear elastic regime describes the angle of shear rotations (transverse part of the field) around the axis Malvern (1969), is proportional to , while the quantity , which express local changes in the volume (area for 2D) of the structure Malvern (1969), is proportional to .
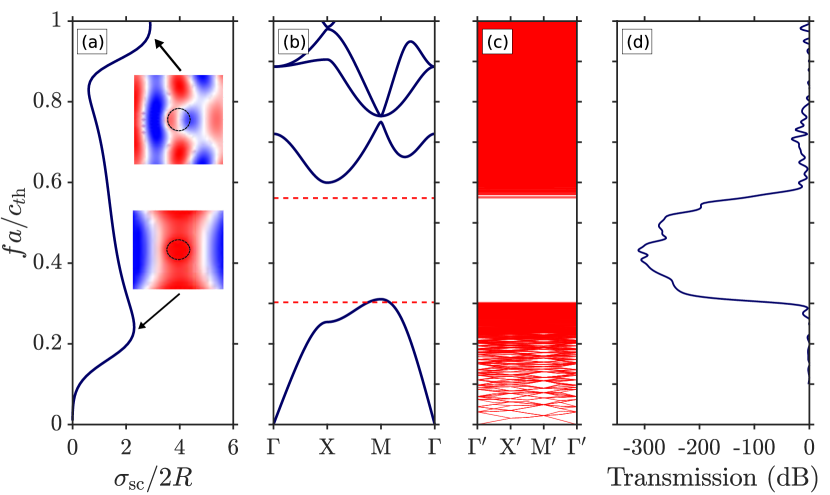
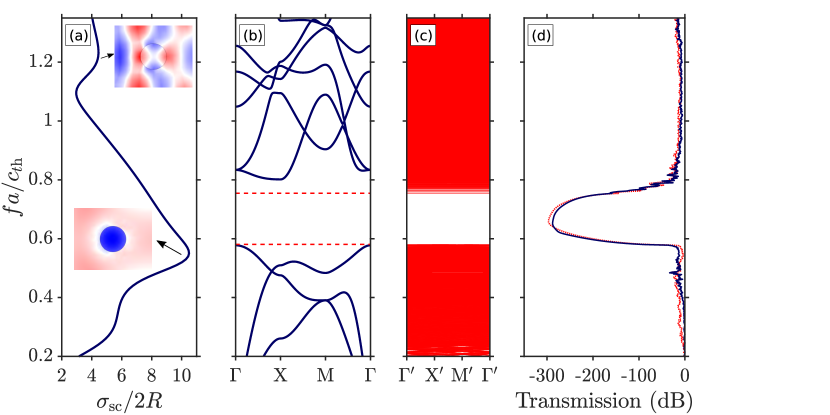
We consider cylinders made of lead (Pb) with density g/cm3, transverse velocity 2160 m/s, and longitudinal velocity m/s in an epoxy host matrix with g/cm3, m/s, and m/s, respectively Chen and Wang (2007). The filling fraction of the structure is . These materials and the filling fraction correspond to the ones used in the literature for a 2D disordered structure, originating from a square lattice Chen and Wang (2007); Chen et al. (2010), for comparison. However the results are expected to be similar for other relatively hard disks in relatively soft embedding solids. Moreover the filling fraction is not optimized for the disordered case although the size of the band gaps of the HDPS as compared to the periodic one suggests that it is close to the optimum value. The phononic band structure for such a 2D arrangement of cylinders can have two distinct type of elastic modes: out-of-plane (pure transverse) modes, similar to 2D TM photonic modes and in-plane (mixed longitudinal and transverse) modes, corresponding to the 2D TE photonic modes. The band structure for the out-of-plane modes is shown in the left-hand diagram of Fig. 2, calculated with a finite element commercial software (COMSOL Multiphysics®). The PBGs for such disordered structures turn out to be equivalent to the fundamental band gap in periodic systems in the sense that the spectral location of the TM gap, for example, is determined by the resonant modes of the individual cylinders (Mie resonances). Indeed, in the middle diagram of Fig. 2, we see that the frequency of the lower edge of the band gaps is in a nice agreement with the first mode of the cylinder, as calculated using Ref. White, 1958, and in good agreement with calculations using FEM.
The PBG for the HDPS are equivalent to the fundamental band gap in periodic systems, since in the former case the band gap occurs between the , bands, instead of the first and second band of the periodic structure and we have exactly scatterers in each unit (super)cell. This can be interpreted in terms of an effective folding due to this “average” periodicity, which the HDPS exhibits due to the short-range geometric order. In the disordered (periodic) structure the PBG extends from () to (), i.e., in the disordered case the PBG () has almost the same size as the periodic one (). However there is a large number of edge states (localized modes) on both sides of the PBG in the disordered case, as was also the case for pure random 2D phononic structures Chen et al. (2010). We note that frequency scales with length and if we consider, e.g., m then the HDPS PBG extends from 350 to 650 MHz.
The transmission through a finite, along the axis, slab of the disordered structure of length is shown in the right-hand diagram of Fig. 2. We impose periodic boundary condition along the axis and perfectly matched layers (PML) along the axis. The excitation is done by a uniform load with a direction along the axis. We can clearly identify that the transmission becomes vanishingly small inside the PBG. Moreover, above the PBG the diffusive propagation of the waves retains relatively small values for the transmission. This is connected to the observation made by Sainidou et al. Sainidou et al. (2005) regarding the enlargement of the transmission gap in a disordered phononic structure.
In order to explore the origin of the PBGs in the HDPS we employ the so-called concentration factor, which in the photonics case is strongly related to the appearance of band gaps Man et al. (2013b). The concentration factor relates to the idea that the eigenmodes are minimized states of an energy functional Man et al. (2013b), and can be defined as
| (8) |
where is the position-dependent mass density. We note that are the eigenmodes of the eigenvalue problem of the elastic field Sainidou et al. (2004) and is proportional to the kinetic energy density. We expect a PBG to open up when, with increasing energy/frequency, the modes can no longer spatially distribute in the same manner but have to drastically change the location or number of nodes, changing between the two distinct manners of propagation, i.e., elastic wave hoping coherently from a cylinder to its neighbors (coupled resonances) and wave propagation mainly through the host material Kafesaki et al. (1995).
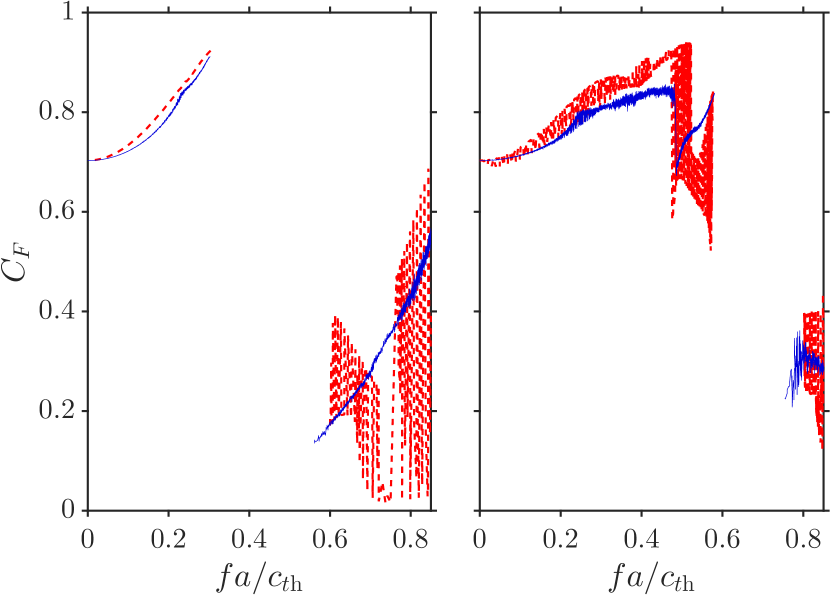
Indeed, the left-hand panel of Fig. 3 shows the sudden drop of the , above the band edge, which implies that now the kinetic energy is mainly distributed in the host matrix, while below the PBG it was mainly distributed inside the cylinders. For the periodic structure there is strong dispersion of the position of the curves for different values which is a direct consequence of the fact that the periodic structure is an anisotropic structure, while the HDPS is an isotropic one. Finally, we note a slight anomaly of at about , connected to the change in the spatial distribution of the modes, as we discuss in the next paragraph.
The real part of the component of the elastic displacement field, , is presented in Fig. 4. In the long wavelength limit [Fig. 4(a)] the HDPS seems to act as a homogeneous effective medium, however the inhomogeneity still plays an important role and we observe strong enhancement of the field on specific cylinders, or aggregates of cylinders acting as local scatterers. At higher frequencies, below the band gap, the modes mostly resemble monopole like modes, with cylindrical symmetry of the displacement field within the cylinders and the energy concentrated within the cylinders, suggesting a hoping mechanism for transmission. We clearly see that as we go pass , i.e from Fig. 4(a) to Fig. 4(b) the modes change from collective to more isolated ones, connected to the slight change in . Moreover there is a phase difference of approximately 180 of the field among neighboring cylinders. We also note that there is a large number of strongly localized modes in the vicinity of the PBG (edge states). The two modes in Figs. 4(c) and 4(d) are such an example exactly at the band edge. Above the PBG there is increased concentration of the fields between the scatterers, which supports the idea that the elastic waves are diffusely transmitted in between the scatterers. Moreover the modes above the band gap show a dipole-like behavior, similar to the one of the second resonance of the single cylinder (see the left-hand diagram of Fig. 2).
Let us now consider the in-plane modes which, being a mixture of longitudinal and transverse waves, are expected to have a more complex behavior. The band structure for these modes is shown in Fig. 5(c). In Fig. 5(b) we show the band structure of the corresponding periodic structure with the same filling fraction. We note that the Brillouin zones in the two cases are not the same, due to the effective folding of the HDPS. The area of the HDPS supercell band structure (denoted by prime symbols) is the of the periodic one. However, in the long wavelength limit the band structures have the same slopes, as expected for a homogenized material of the same filling fraction. Moreover, in this case the opening of the band gap occurs between the bands 1500 and 1501, instead of the third and fourth band of the periodic structure, indicating again a 500 folding due to the “average” periodicity (short-range order) of the structure.
However, for the in-plane polarization the HDPS (periodic structure) band gap extends from () to (), i.e., in the disordered case the band gap () is smaller than the periodic one (), implying that the in-plane modes are more sensitive to disorder. Of course, the band gap is still quite large due to existence of the sort-range order in the HDPS. We should also note that in this case the structure supports many edge states (localized modes). Moreover, interestingly enough, the lower band edge of the HDPS and the periodic structure coincide. This is not accidental, but has to do with the localized mode of the single cylinder, shown in the lower inset of Fig. 5(a), which interacts with the band gap and forms the lower band edge mode. For this mode see also Fig. 6(d) and relevant discussion. However, the upper band edge has shifted to lower frequencies due to the formation of a large number of localized modes near the top band gap edge. Moreover the modes above the band gap edge resemble the field profile of the single mode shown in the upper inset of Fig. 5(a).
The transmission in this case, shown in the right-hand diagram of Fig. 5, has similar behavior as for the out-of-plane polarization and is almost independent of the polarization of the incident wave. We can again see that due to diffusive propagation transmission is low above the band gap. For the in-plane waves the drop in the transmission ( dB) within the band gap is somewhat smaller compared to the out-of-plane ones ( dB). These results indicate that the in-plane modes are more affected by the disorder. However, overall, we still have sufficiently large band gaps and corresponding transmission drops.
In the right-hand diagram of Fig. 3 we show the concentration factor for the in-plane modes. We again see a similar behavior with the kinetic energy distribution concentrated inside the cylinders below the band gap and outside the cylinders above the band gap. However in this case both the periodic structure and the HDPS exhibit stronger anisotropy than in the out-of-plane polarization. Moreover, abruptly drops at about , while remaining almost constant in the region 0.42–, connected to the fact that there is a decrease in the density of states, as is indicated by the decreased density in the number of bands we find over this region. Such a behavior mirrors a similar behavior in photonics Tsitrin et al. (2015).
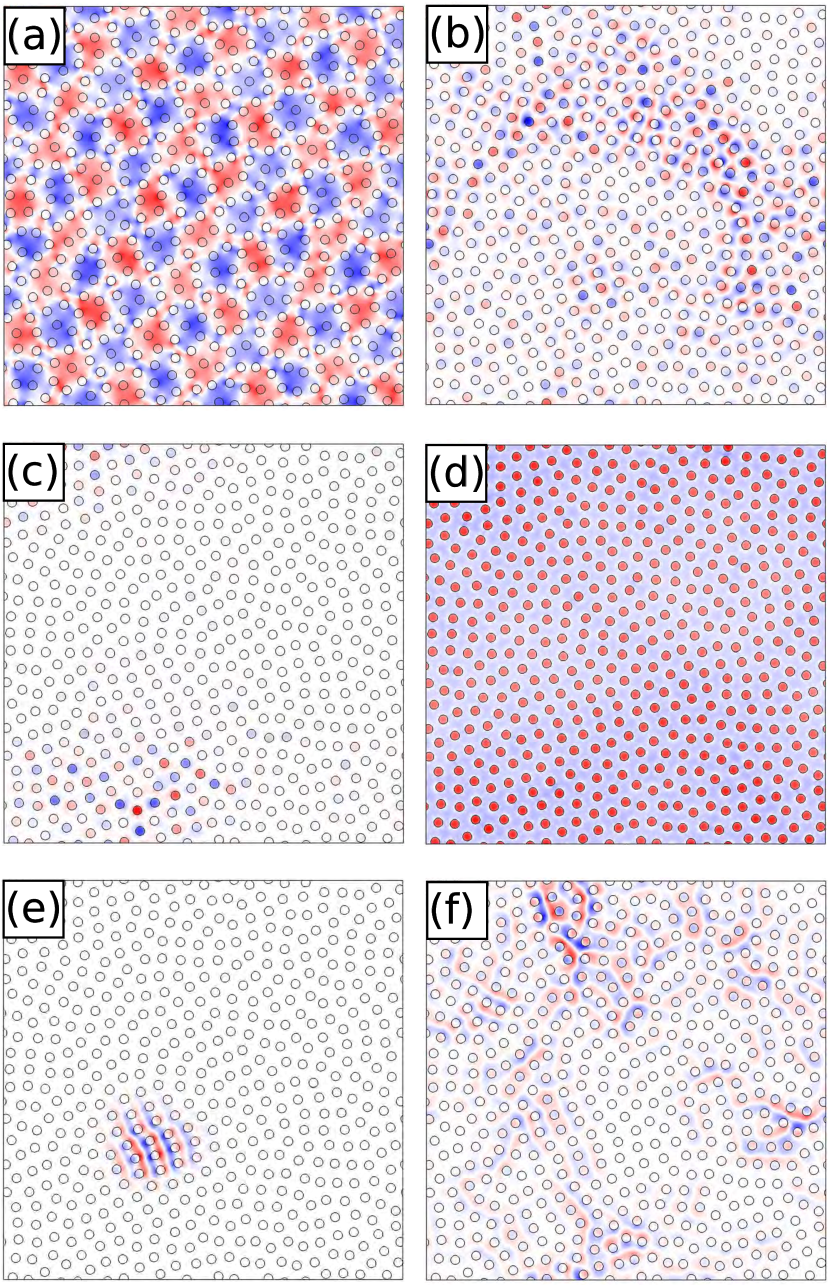
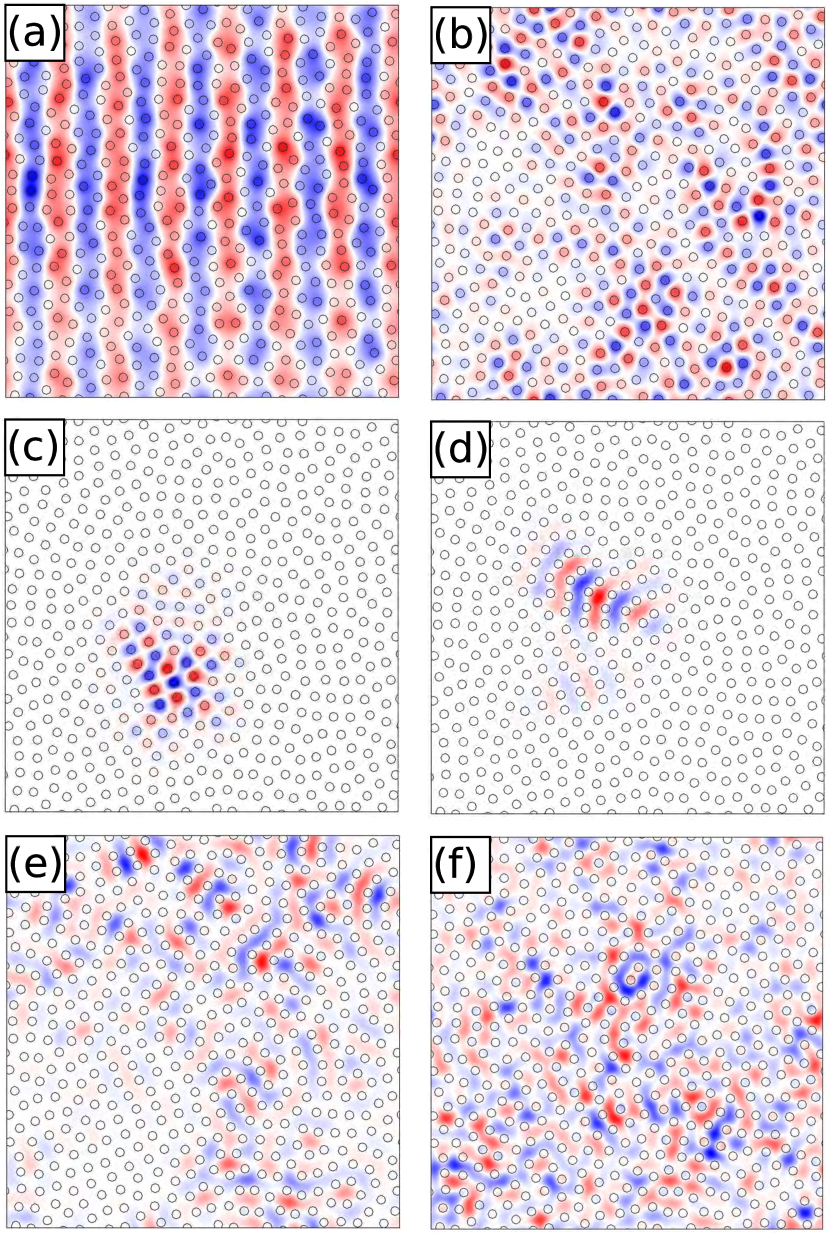
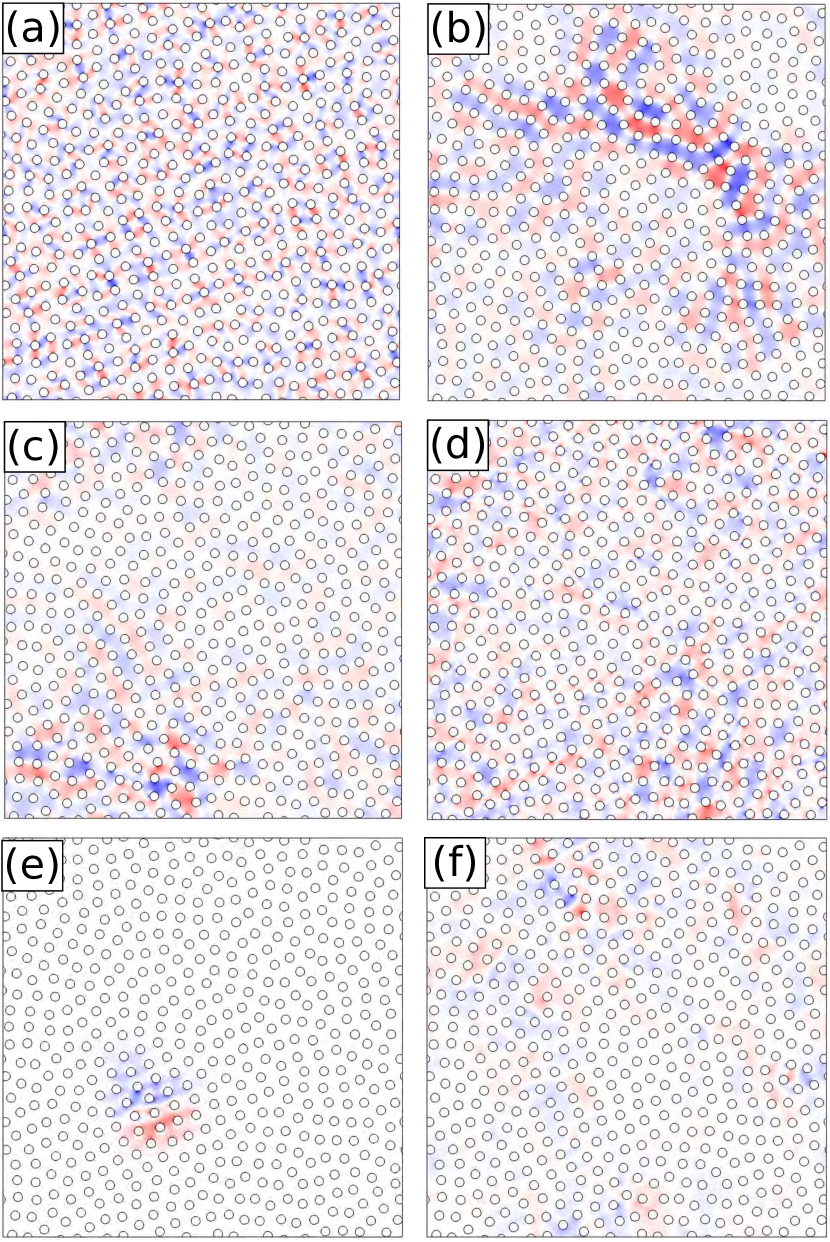
Fig. 6(a) depicts the transverse component of a mode well below the band gap (long wavelengths). We see collective oscillations of corresponding to aggregates of four to six cylinders. As we approach the modes display a mixed character [see Fig. 6(b)]. The smoothness of the disordering vanishes and local excitation can be separated into cylindrical symmetry modes within the cylinders and mirror-symmetric modes with one nodal plane within the cylinders, resembling dipole-like shaped modes. The modes are still very extended. However, just a little bit higher in frequency [Fig. 6(c)] the modes rapidly localize. Interestingly whilst doing so they keep their mixed-resonance character. At even higher frequencies the modes take on a clear monopole-like appearance and gradually evolve from localized back to extended. Initially the monopole-like resonances have alternating phase on each inclusion, however, as maximum localization is surpassed the phase behavior begins to cluster and eventually fully correlates, just below the absolute band gap [Fig. 6(d)]. This behavior is quite peculiar and was not found for the out-of-plane modes. The origin of this effect has to do with the existence of the highly localized torsional mode near the band gap edge, which interacts with the band gap and results in the formation of the band edge mode shown in Fig. 6(d). In both the periodic and the disordered case this mode has the same shape and since it is localized in the cylinders it propagates with a very small group velocity ( 0.001) through a hoping mechanism. As a result the geometrical disorder is not affecting strongly this mode. At the upper band edge the modes exhibit the usual tight localization [Fig. 6(e)], while at even higher frequencies the modes become more extended but still highly diffusive [Fig. 6(f)].
There are some similarities to the photonics case in the sense that we observe the displacement field localized mainly inside, below the band gap, and outside the cylinders, above the band gap. Moreover we see that the ballistic transport, at low wavelengths, is acompanied with excitation of local modes in the cylinders, while we see diffusive transport well above the band gap. However, the modes also show important differences. Firstly, we see in general a higher localization of the modes. Secondly, a delocalized band edge mode, with a very low group velocity 0.001, was identified in the lower edge of the band gap, due to the existence of a torsional mode at the lower edge of the band gap. Such an extended mode was not observed previously in hyperuniform photonic structure. Thirdly, the modes above the band gap remain localized for a large frequency region, up to about 0.81, before turning to diffusive modes. We note that these results could in principle be found also in the photonics case for appropriate combination of material parameters.
The longitudinal component of the fields is shown in Fig. 7. In contrast to the transverse components the longitudinal ones exhibit always a stronger delocalization and no obvious correlations. However at high frequencies [see, e.g., Fig. 7(e,f)] the mode profiles of the longitudinal and the transverse components become quite similar, showing the striking behavior of spreading out continuously along curvy planes among the scatterers.
III Cavities and waveguides
A cavity in a HDPS can be created by simply reducing the radius of a single cylinder or totally removing it. In the photonics case it was observed that the localized modes have some resemblance to the modes at the band edge. We expect some differences to the cavity and waveguide modes of photonic band gap structures, due to the different mode behavior around the band gap for the in-plane modes of the phononic structure.
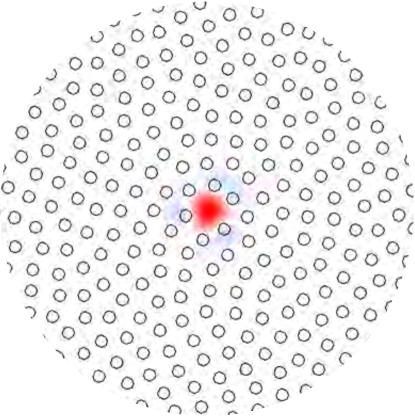
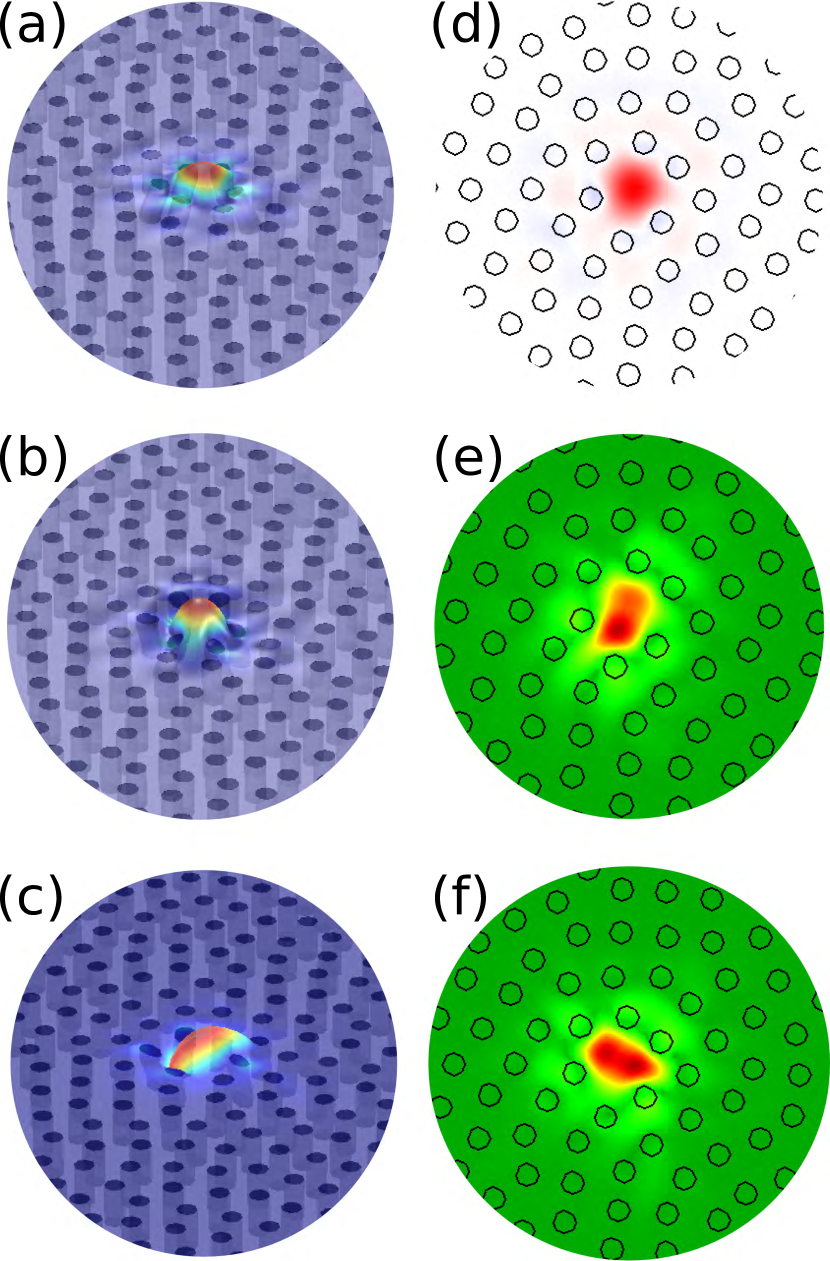
Fig. 8 shows the out-of-plane resonant cavity mode introduced by removing a cylinder from the HDPS. In this case we consider a finite number of 499 cylinders and substitute the periodic boundary conditions with PML. The cavity mode, which has a cylindrical symmetry, occurs at and has a very high -factor of about . A careful look in the mode profile also reveals the flexibility of the mode to exactly adjust its shape around the surrounding cylinders. We note that this value is much larger than what is usually found in the literature on phononic cavities. The reason for that is that we do not take into account phonon-phonon scattering which limits the intrinsic Q-factor. This intrinsic Q-factor is usually of the order of or less depending on specific frequencies and materials considered_realizing_2010 . As a result usually a limited number of layers is enough to achieve this intrinsic Q-factor while in our case there are about 11 layers surrounding the cavity. Therefore in all cases considered we are well above that point and only intrinsic Q-factor limits should be considered on specific applications.
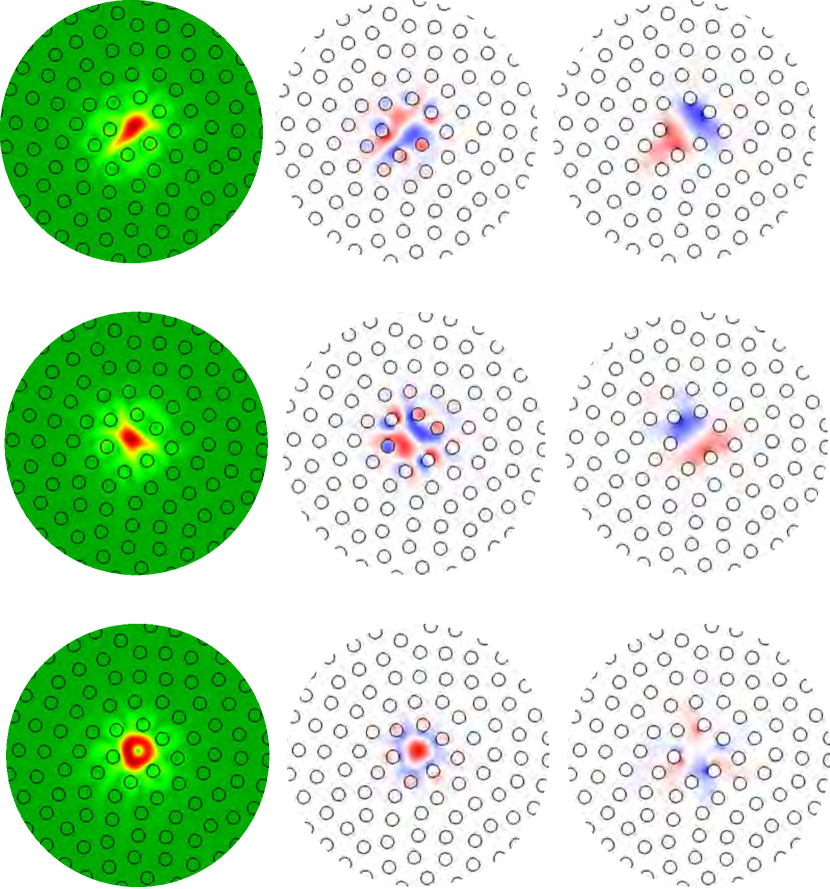
Fig. 9 shows the in-plane resonant modes of the cavity. In this case three cavity modes are formed. The first two modes, at () and (), appear elongated with a plane of nearly mirror symmetry, almost normal between them. The lower-frequency more spread out in the lateral direction by approximately . The higher-frequency mode is more tightly confined along the symmetry direction and its shape appears more strongly influenced by the adjacent scatterers. The highest-frequency mode at with has a nearly cylindrical symmetry.
In phononic crystals, removing a row of cylinders generates a channel through which elastic waves with frequencies within the PBG can propagate, i.e., waveguide modes. Elastic waves cannot propagate elsewhere in the structure outside the channel because there are no elastic modes to couple to. However, the waveguides must be composed of segments whose orientation is confined to the high-symmetry directions of the crystal. As a result, the waveguide bends of or can be easily achieved Khelif et al. (2004), but bends at an arbitrary angle lead to significant scattering losses due to excessively strong scattering at the bend junction. However in the case of the HDPS the distribution of cylinders around the bend junction are statistically isotropic. If the defect mode created by the removal of cylinders falls within the PBG, the bend can then be oriented at an arbitrary angle.
We note that we could couple such high- cavity modes to create a line of defects and thereof coupled-cavity waveguide modes Khelif et al. (2003). However we employ here a more efficient and flexible bottom-up design strategy previously introduced for photonic structures Amoah and Florescu (2015b). We define the path of the waveguide first and then built the structure around it. Specifically, we distribute periodically cylinders on curves parallel to the waveguide line and then distribute the rest of the scatterers in a nearly isotropic and homogeneous manner around the waveguide. We use one layer of ordered cylinders to shape a waveguide with a sharp bend (as shown in Fig. 11) and leave the rest of the structure disordered. It is worth-noting that in the photonics case it is not enough to consider only one layer of ordered cylinders, but at least three. We think the main reason for this is the fact that phonons are strongly localized around defects, as we can see from Figs. 8 and 9.

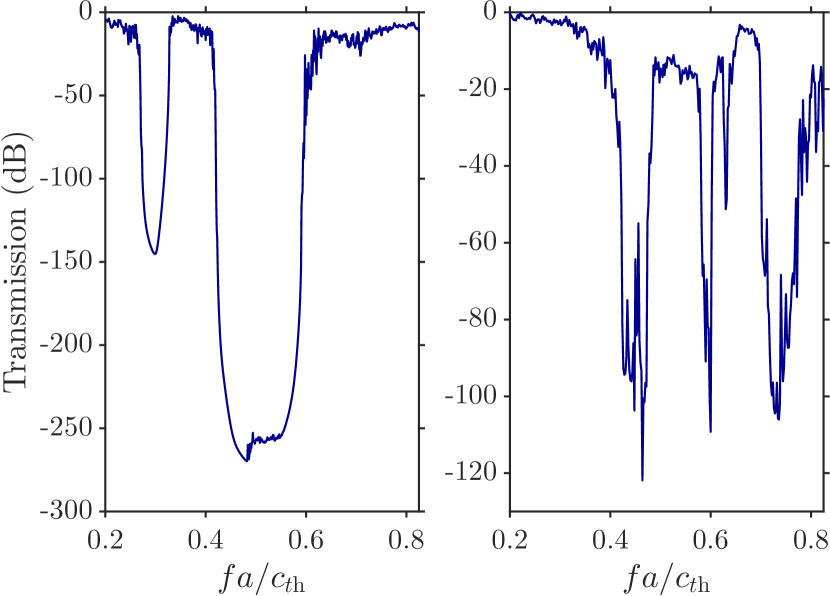
The left-hand diagram of Fig. 10 shows the transmission spectrum through the waveguide for out-of-plane polarization. In order to trigger efficiently the transmission through the waveguide we consider a Gaussian load profile centered at the waveguide region, with a width of . We see an almost transmission for this structure within the corresponding HDPS band gap. For the in-plane polarization (see right-hand diagram of Fig. 10) we again observe efficient waveguiding of about transmission and very strong confinement of the mode within the frequency region of the corresponding HDPS band gap. However there are some significant drops in the transmission around and . This is probably due to multimode behavior in that region, but we do not intent to further investigate such details in the current manuscript.
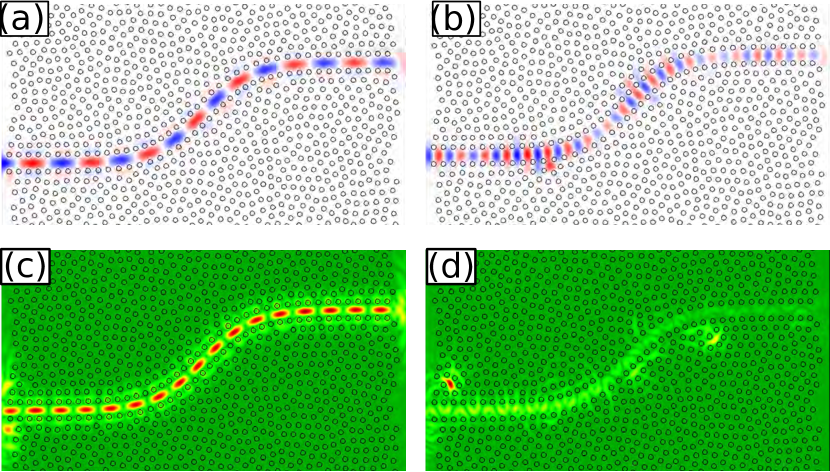
In Figs. 11(a) and (b) we show the field profile for continuous wave (CW) excitation normal to the plane at , well inside the waveguide frequency region, and at , at the edge of the waveguide frequency region. It is clear that the field is highly localized, although in the latter case there are scattering losses and the field attenuates along the waveguide. As expected in the second case the elastic field has a much smaller wavelength, as we can identify by the phase shift. In Figs. 11(c) and (d), we show the magnitude of the in-plane polarized elastic field at , where we have a high transmission of almost and at , at the strong drop of the transmission (see Fig. 10). In the former case the field is highly localized along the waveguide. However in the latter case the field has strong scattering (diffusive) losses inside the HPDS-like material.
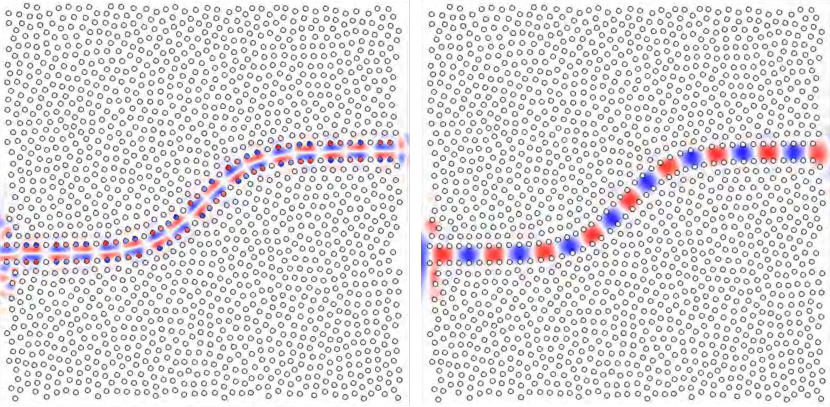
In order to further understand the behavior of the in-plane field, we present the decomposition of the in-plane polarized elastic field at [Fig. 11(c)] in (transverse component) and (longitudinal component) in the left- and right-hand diagram of Fig 12, respectively. We can identify the wavelength from the sign change of the components along the waveguide. Moreover the longitudinal component is somewhat better localized within the waveguide region, while the transverse one expands in the region of the ordered arrays of cylinders. And this is the small difference in the strength of the localization among the out-of-plane [Fig. 11(a)] and the in-plane [Fig. 11(c)] polarized elastic fields.
IV Finite thickness HDPS
We finally consider a thin finite slab of the HDPS of thickness along the axis. In this case we expect Lamb waves, drastically modulated by the HDPS inhomogeneities, to propagate through the structure. We note that for such structures the in-plane and out-of-plane modes are no longer decoupled, but interact with each other. We consider that the HDPS has a finite length of along the axis and use PML to account for propagating modes that travel along the axis in the (infinite) surrounding epoxy material. On, the other hand we still consider periodic boundary conditions for the axis. Finally we consider stress free top and bottom surfaces ( axis).
The left-hand diagram of Fig. 13 shows the transmission through this structure for an excitation along the axis. We can clearly identify the large transmission drops within the corresponding PBGs (see left-hand diagrams of Figs. 2 and 5). However in this 3D case there is a large number of localized modes within this region, as we can identify from the transmission peaks. Therefore no absolute band gap exists in this case. We also note that, independently of the load polarization, we can see significant transmission drops corresponding to the frequency regions of the 2D PBGs of both the in-plane and out-of-plane modes, since all the modes are now coupled. However the transmission gaps are somewhat shifted, as a result of the finite thickness of the HDPS and the need for the modes to redistribute their energy profiles in a finite extent along the axis (modulated Lamb waves). When we excite this 3D structure with a uniform load along the axis most of the localized modes are not excited and we get a clearer picture within the transmission band gaps.
Moreover, we expect the finite thickness of the HDPS to affect strongly the cavity modes. As we already mentioned in this case there is no absolute band gap and no characterization of the modes according to their polarization. Therefore, even in the large transmission dips we were able to identify a large number of localized modes. However among them the ones corresponding to the 2D cavity modes are easily identified from their very high factors. Specifically, in Fig. 14 we show the modes with high factors. We can identify three such modes. The first, at [Fig. 14(a)] with , originates from the out-of-plane mode at (), as we can verify by direct comparison of Fig. 14(d) with Fig. 8. The modes at () and () resemble the elongated displacement profiles of the modes at () and () [see Fig. 9(a,b)], although there is significant change in the displacement profiles.
V Conclusions
We introduced a new class of structurally disordered phononic crystals, hyperuniform disordered phononic structures (HDPS). These structures are made from initially arbitrary point patterns by applying strong correlations among the points and finally decorating them with a specific pattern, so that the structure factor becomes isotropic and vanishes for all -vectors within a specific radius. Such structures can be clearly identified (see Fig. 1) as amorphous phononic structures. Although we only consider here cylindrical inclusions we expect similar results independently of the shape of the scatterers, and even for more complex decorations, such as continuous networks originating, similarly to the photonics case Florescu et al. (2009). In such structures both ballistic propagation (at lower wavelengths) and diffusive transport (at higher frequencies) together with large phononic band gaps can coexist.
By using finite element method calculations and super cell techniques the band structure of HPDS has been calculated. Large PBGs, similar to the periodic counterparts, have been identified. Such large band gaps cannot be found in completely random phononic structures. Moreover a large number of localized modes was found within the frequency region of interest. As a result, huge transmission drops have been observed in the frequency regions of the corresponding band gaps, for all polarizations. These results indicate that these structures can be used as frequency filters, with the added advantage of being highly isotropic. This latter characteristic makes them also strong candidates for in- and out-coupling of free-space elastic waves with waveguides.
High- cavity modes can be, therefore, easily implemented. We showed here an example of a high- cavity by removing a single cylinder. However, we expect this to be the case even by just altering the size or misplace one or more cylinders, depending on the mode localization we want to achieve. We were able to find extremely large Q-factors, ignoring intrinsic phonon-phonon scattering, and strong localization of the field profile. Combined with the fact that in these structures diffusive propagation and a large number of localized modes are observed, such structures can be efficiently used for thermal conductivity reduction Maldovan (2013); Davis and Hussein (2014); Maire et al. (2015). Moreover the fact that these structures are also very efficient in photonics applications implies that they can be also used to create optomechanical and/or phoxonic devices Eichenfield et al. (2009); Aspelmeyer et al. (2014); Lucklum et al. (2013); Djafari-Rouhani et al. (2016). Waveguiding in such structures can also be very efficient. It is shown that 100% transmission through arbitrary bends is possible, due to isotropy. This is a very important result, since this behavior cannot been found in conventional periodic structures, where you need to follow high symmetry lines. Therefore such structures are very strong candidates for phononic integrated circuits III and El-Kady (2009).
We have also shown that 3D thin layer HDPS behave similar to the 2D ones, in terms of the large effective band gaps and the existence of high- cavity modes. This is an important aspect for practical applications, since very thick (2D) structures are, in many cases, not efficient. Although we mainly discuss micro and nano-scale applications we expect that the understanding and control of such coupling between random and short-range ordered structures is important in the macroscale as well, such as in the understanding of seismic wave propagation, fracture in complex structures, as well as bio-materials, which all include some kind of correlated disorder.
Data availability. The data underlying the findings of this study are available without restriction. Details of the data and how to request access are available from the University of Surrey publications repository: https://doi.org/10.15126/surreydata.00813700.
Acknowledgements.
This work was partially supported by the University of Surrey’s FRSF and IAA awards to MF, EPSRC (United Kingdom) Strategic Equipment Grant No. EP/L02263X/1 (EP/M008576/1) and EPSRC (United Kingdom) Grant EP/M027791/1.References
- Sigalas and Economou (1993) M. Sigalas and E. N. Economou, Solid State Commun. 86, 141 (1993).
- Kushwaha and Halevi (1994) M. S. Kushwaha and P. Halevi, Appl. Phys. Lett. 64, 1085 (1994).
- Vasseur et al. (2002) J. O. Vasseur, P. A. Deymier, A. Khelif, P. Lambin, B. Djafari-Rouhani, A. Akjouj, L. Dobrzynski, N. Fettouhi, and J. Zemmouri, Phys. Rev. E 65, 056608 (2002).
- Li et al. (2011) X.-F. Li, X. Ni, L. Feng, M.-H. Lu, C. He, and Y.-F. Chen, Phys. Rev. Lett. 106, 084301 (2011).
- Chen and Chan (2010) H. Chen and C. T. Chan, J. Phys. D: Appl. Phys. 43, 113001 (2010).
- Sukhovich et al. (2008) A. Sukhovich, L. Jing, and J. H. Page, Phys. Rev. B 77, 014301 (2008).
- Aspelmeyer et al. (2014) M. Aspelmeyer, T. J. Kippenberg, and F. Marquardt, Rev. Mod. Phys. 86, 1391 (2014).
- Maldovan (2013) M. Maldovan, Nature 503, 209 (2013).
- Davis and Hussein (2014) B. L. Davis and M. I. Hussein, Phys. Rev. Lett. 112, 055505 (2014).
- Torquato and Stillinger (2003) S. Torquato and F. H. Stillinger, Phys. Rev. E 68, 041113 (2003).
- Florescu et al. (2009) M. Florescu, S. Torquato, and P. J. Steinhardt, PNAS 106, 20658 (2009).
- Man et al. (2013a) W. Man, M. Florescu, E. P. Williamson, Y. He, S. R. Hashemizad, B. Y. C. Leung, D. R. Liner, S. Torquato, P. M. Chaikin, and P. J. Steinhardt, PNAS 110, 15886 (2013a).
- Muller et al. (2014) N. Muller, J. Haberko, C. Marichy, and F. Scheffold, Adv. Opt. Mat. 2, 104 (2014).
- Man et al. (2013b) W. Man, M. Florescu, K. Matsuyama, P. Yadak, G. Nahal, S. Hashemizad, E. Williamson, P. Steinhardt, S. Torquato, and P. Chaikin, Opt. Express 21, 19972 (2013b).
- Florescu et al. (2013) M. Florescu, P. J. Steinhardt, and S. Torquato, Phys. Rev. B 87, 165116 (2013).
- Amoah and Florescu (2015a) T. Amoah and M. Florescu, Phys. Rev. B 91, 020201 (2015a).
- Florescu et al. (2010) M. Florescu, S. Torquato, and P. J. Steinhardt, Appl. Phys. Lett. 97, 10 (2010), arXiv:1011.1698 .
- Zhou et al. (2016) W. Zhou, Z. Cheng, B. Zhu, X. Sun, and H. K. Tsang, IEEE J. Sel. Top. Quant. 22, 1 (2016).
- Zito et al. (2014) G. Zito, G. Rusciano, G. Pesce, A. Dochshanov, A. Malafronte, G. Ausanio, and A. Sasso, in Photonics Conference, 2014 Third Mediterranean (2014) pp. 1–3.
- Degl’Innocenti et al. (2016) R. Degl’Innocenti, Y. D. Shah, L. Masini, A. Ronzani, A. Pitanti, Y. Ren, D. S. Jessop, A. Tredicucci, H. E. Beere, and D. A. Ritchie, Sci. Rep. 6, 19325 (2016).
- Zuo-Dong and Jian-Chun (2005) Y. Zuo-Dong and C. Jian-Chun, Chinese Phys. Lett. 22, 889 (2005).
- Wagner et al. (2015) M. R. Wagner, B. Graczykowski, J. S. Reparaz, A. E. Sachat, M. Sledzinska, F. Alzina, and C. M. S. Torres, arXiv:1511.07398 [cond-mat] (2015), arXiv: 1511.07398.
- Limonov and Rue (2012) M. F. Limonov and R. M. D. L. Rue, Optical Properties of Photonic Structures: Interplay of Order and Disorder (CRC Press, 2012) google-Books-ID: 5gABZZ_KCR0C.
- Sainidou et al. (2005) R. Sainidou, N. Stefanou, and A. Modinos, Phys. Rev. Lett. 94, 205503 (2005).
- Still et al. (2008) T. Still, W. Cheng, M. Retsch, R. Sainidou, J. Wang, U. Jonas, N. Stefanou, and G. Fytas, Phys. Rev. Lett. 100, 194301 (2008).
- Chen and Wang (2007) A. L. Chen and Y.-S. Wang, Physica B: Condensed Matter 392, 369 (2007).
- Larose et al. (2004) E. Larose, L. Margerin, B. A. van Tiggelen, and M. Campillo, Phys. Rev. Lett. 93, 048501 (2004).
- Shahbazi et al. (2005) F. Shahbazi, A. Bahraminasab, S. M. Vaez Allaei, M. Sahimi, and M. R. R. Tabar, Phys. Rev. Lett. 94, 165505 (2005).
- Tourin et al. (2006) A. Tourin, F. Van Der Biest, and M. Fink, Phys. Rev. Lett. 96, 104301 (2006).
- Li et al. (2007) F.-M. Li, M.-Q. Xu, and Y.-S. Wang, Solid State Communications 141, 296 (2007).
- Wang et al. (2008) Y.-Z. Wang, F.-M. Li, W.-H. Huang, and Y.-S. Wang, Journal of the Mechanics and Physics of Solids 56, 1578 (2008).
- (32) J. Lin, C. Knoll, and C. Willey, in 47th AIAA/ASME/ASCE/AHS/ASC Structures, Structural Dynamics, and Materials Conference (American Institute of Aeronautics and Astronautics).
- Davies et al. (2014) B. Davies, A. King, P. Newman, A. Minett, C. R. Dunstan, and H. Zreiqat, Scientific Reports 4, 7538 (2014).
- Shekhawat et al. (2013) A. Shekhawat, S. Zapperi, and J. P. Sethna, Phys. Rev. Lett. 110, 185505 (2013).
- Zen et al. (2014) N. Zen, T. A. Puurtinen, T. J. Isotalo, S. Chaudhuri, and I. J. Maasilta, Nat Commun 5, 3435 (2014).
- O’Connor and Lebowitz (1974) A. J. O’Connor and J. L. Lebowitz, Journal of Mathematical Physics 15, 692 (1974).
- Maire et al. (2015) J. Maire, R. Anufriev, H. Han, S. Volz, and M. Nomura, arXiv:1508.04574 [cond-mat] (2015), arXiv: 1508.04574.
- Uche et al. (2004) O. U. Uche, F. H. Stillinger, and S. Torquato, Phys. Rev. E 70, 046122 (2004).
- Chen et al. (2010) A.-L. Chen, Y.-S. Wang, J.-B. Li, and C. Zhang, Waves in Random and Complex Media 20, 104 (2010).
- Batten et al. (2008) R. D. Batten, F. H. Stillinger, and S. Torquato, J. Appl. Phys. 104, 033504 (2008).
- White (1958) R. M. White, The Journal of the Acoustical Society of America 30, 771 (1958).
- Malvern (1969) L. E. Malvern, Introduction to the Mechanics of a Continuous Medium (Englewood Cliffs, N.J.: Prentice-Hall, 1969).
- Sainidou et al. (2004) R. Sainidou, N. Stefanou, and A. Modinos, Phys. Rev. B 69, 064301 (2004).
- Kafesaki et al. (1995) M. Kafesaki, M. M. Sigalas, and E. N. Economou, Solid State Commun. 96, 285 (1995).
- Tsitrin et al. (2015) S. Tsitrin, E. P. Williamson, T. Amoah, G. Nahal, H. L. Chan, M. Florescu, and W. Man, Sci. Rep. 5, 13301 (2015).
- (46) D. Goettler , M. Su, Z. Leseman, Y. Soliman, R. Olsson, I. El-Kady, J. Appl. Phys. 108, 084505 (2010).
- Khelif et al. (2004) A. Khelif, A. Choujaa, S. Benchabane, B. Djafari-Rouhani, and V. Laude, Appl. Phys. Lett. 84, 4400 (2004).
- Khelif et al. (2003) A. Khelif, A. Choujaa, B. Djafari-Rouhani, M. Wilm, S. Ballandras, and V. Laude, Phys. Rev. B 68, 214301 (2003).
- Amoah and Florescu (2015b) T. Amoah and M. Florescu (Proc. SPIE, 2015) p. 95460F.
- Eichenfield et al. (2009) M. Eichenfield, J. Chan, R. M. Camacho, K. J. Vahala, and O. Painter, Nature 462, 78 (2009).
- Lucklum et al. (2013) R. Lucklum, M. Zubtsov, and A. Oseev, Anal Bioanal Chem 405, 6497 (2013).
- Djafari-Rouhani et al. (2016) B. Djafari-Rouhani, S. El-Jallal, and Y. Pennec, Comptes Rendus Physique Phononic crystals / Cristaux phononiques, 17, 555 (2016).
- III and El-Kady (2009) R. H. O. III and I. El-Kady, Meas. Sci. Technol. 20, 012002 (2009).