SNSN-323-63
Single-top quark cross-section measurements in ATLAS
Dominic Hirschbühl111email: dominic.hirschbuehl@cern.ch
on behalf of the ATLAS collaboration
Bergische Universität Wuppertal, 42119 Wuppertal, Germany
This article presents measurements of all three single top-quark production channels. Detailed measurements of -channel single top-quark production using data collected by the ATLAS experiment in proton–proton collisions at a centre-of-mass energy of 8 TeV are shown as well es first results using 13 TeV at the LHC. The associated production of a top quark and a boson is presented for data collected at 13 TeV, while the first evidence of single top-quark production in the -channel is shown for data collected at 8 TeV.
PRESENTED AT
International Workshop on Top Quark Physics
Olomouc, Czech Republic, September 19–23, 2016
1 Introduction
At leading order (LO) in perturbation theory, single top-quark production is described by three
subprocesses that are distinguished by the virtuality of the exchanged boson.
The dominant process is the -channel exchange, where a light quark from one
of the colliding protons interacts with a -quark from another proton by exchanging a virtual boson.
The total inclusive cross-sections of top-quark and top-antiquark production in
the -channel in proton–proton collisions at a centre-of-mass
energy TeV are predicted to be
pb proton–proton and pb for top-antiquark production
and at TeV to be pb and
pb at next-to-leading order (NLO)
precision in QCD [1, 2].
The second highest production cross section is predicted for the associated
production of a boson and a top quark ().
The cross-section of the channel at NLO with next-to-next-to-leading logarithmic
soft-gluon corrections is calculated as
pb [3] for TeV.
The -channel production of a top quark and a -quark () for
yields the smallest cross section
of pb in NLO QCD [4].
In the following, measurements of all three production channels
using data collected by the ATLAS experiment [6] in
collisions either at TeV
corresponding to an integrated luminosity of 20.2 fb-1
or TeV at the LHC corresponding to an integrated luminosity of
3.2 fb-1 are presented.
2 -channel single top-quark production
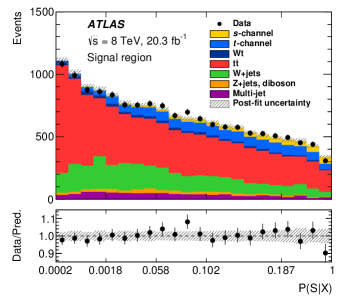
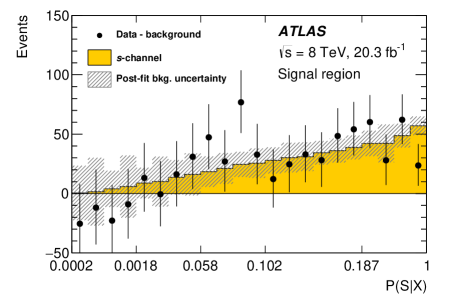
The analysis for -channel single top-quark production is performed using collision data at TeV. Events are selected if they have either of an electron or muon, two jets, where both have to be identified as a jet containing -hadrons (-tagged jet) and large missing transverse momentum . After the preselection, the main background are top-quark pair-production () and +jets production. In order to separate the signal from the large background contributions, a matrix element method discriminant is used, see Fig. 1. The signal is extracted from the data utilising a profile likelihood fit, which leads to a measured cross-section of pb [7]. Dominating uncertainties are Monte Carlos (MC) statistics, jet energy resolution, and the modelling of the -channel single top-quark process. The result, which is in agreement with the SM prediction, corresponds to an observed significance of 3.2 standard deviations.
3 Associated Wt production
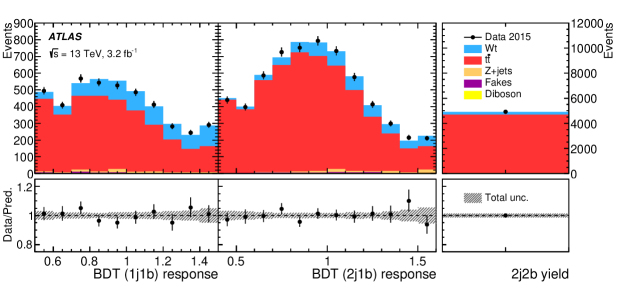
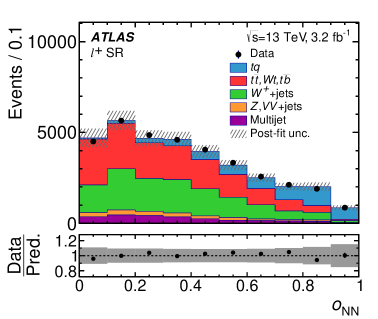
The inclusive cross-section for the associated production of a boson and top quark is measured using dilepton events with at least one -tagged jet. Events are separated into signal and control regions based on the number of selected jets and -tagged jets, and the signal is separated from the background using a boosted decision tree (BDT) discriminant, shown in Fig. 2 The cross-section is extracted by fitting templates to the BDT output distribution, and is measured to be pb [8]. Main uncertainties are coming from the jet energy scale (JES) and the modelling of the top-quark processes.
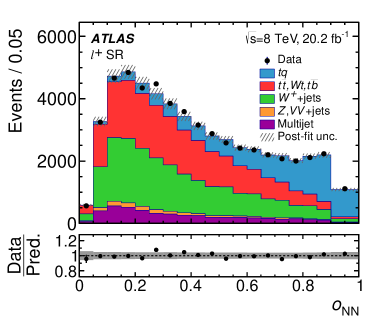
4 -channel single top-quark production
The experimental signature of -channel single top-quark candidate events is
given by one charged lepton (electron or muon), large
and two jets.
Exactly one of the two jets is required to be -tagged.
The main background contributions are the and +jets processes.
In order to separate signal from background an artificial neural network is
used, shown in Fig. 3
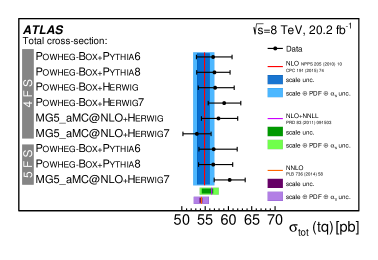
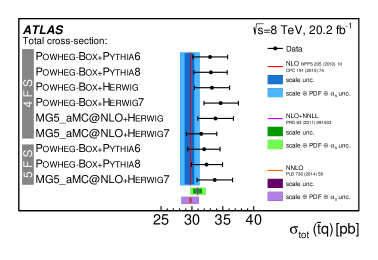
For the TeV data; the total and fiducial cross-sections are
measured for both top quark and top antiquark production.
The fiducial cross-section is measured with a precision of 5.8%
(top quark) and 7.8% (top antiquark), respectively [9].
A comparison with different MC generator setups is shown in
Fig. 4 for the extrapolated total cross section.
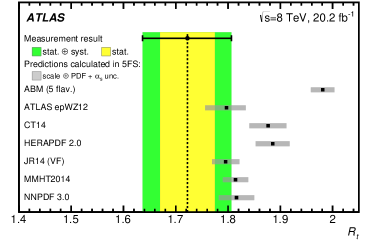
In addition, the cross-section ratio of top-quark to top-antiquark production
is measured, resulting in a precise value to compare with predictions,
and presented in
Fig. 5(left).
Dominant uncertainties for these measurements are the JES and modelling of the
top-quark processes.
The total cross-section is used to extract
the coupling: ,
which corresponds to at the 95% confidence level,
when assuming and restricting the range of to
the interval .
Requiring a high value of the neural-network discriminant leads to relatively
pure -channel samples, which are used to measure differential cross-sections.
Differential cross-sections as a function of the transverse momentum and
absolute value of the rapidity of the top quark, the top antiquark,
as well as the accompanying jet from the -channel scattering are
measured at particle level and parton level.
All measurements are compared to different Monte Carlo predictions as well as
to fixed-order QCD calculations where these are available.
The SM predictions provide good descriptions of the data.
For the TeV data; the the total
cross-sections for both top quark and top antiquark production are measured to
be and , respectively [10].
The cross-section ratio is found to be and compared with
predictions from different PDF groups in Fig. 5 (right).
The coupling at the vertex is determined to be and
a lower limit on the CKM matrix element is set, giving at the
95% CL.
These measurements are dominated by systematic uncertainties,
from which the uncertainties connected with MC generators are the biggest ones.
References
- [1] J. M. Campbell, R. Frederix, F. Maltoni and F. Tramontano, Phys. Rev. Lett. 102 (2009) 182003
- [2] P. Kant, O. M. Kind, T. Kintscher, T. Lohse, T. Martini, S. M lbitz, P. Rieck and P. Uwer, Comput. Phys. Commun. 191 (2015) 74
- [3] N. Kidonakis, PoS DIS 2015 (2015) 170
- [4] T. Stelzer, Z. Sullivan and S. Willenbrock, Phys. Rev. D 58 (1998) 094021
- [5] G. Bordes and B. van Eijk, Nucl. Phys. B 435 (1995) 23.
- [6] ATLAS Collaboration, JINST 3 (2008) S08003.
- [7] ATLAS Collaboration, Phys. Lett. B 756 (2016) 228
- [8] ATLAS Collaboration, arXiv:1612.07231 [hep-ex].
- [9] ATLAS Collaboration, arXiv:1702.02859 [hep-ex].
- [10] ATLAS Collaboration, arXiv:1609.03920 [hep-ex].