Nonlinear continuous-wave optical propagation in nematic liquid crystals: interplay between reorientational and thermal effects
Abstract
Thanks to their unique properties, nematic liquid crystals feature a variety of mechanisms for light-matter interactions. For continuous-wave optical excitations, the two dominant contributions stem from reorientational and thermal nonlinearities. We thoroughly analyze the competing roles of these two nonlinear responses with reference to self-focusing/defocusing and, eventually, the formation of nonlinear diffraction-free wavepackets, the so-called spatial optical solitons. To this extent we refer to dye-doped nematic liquid crystals in planar cells and continuous-wave beams at two distinct wavelengths in order to adjust the relative weights of the two responses. The theoretical analysis is complemented by numerical simulations in the highly nonlocal approximation and compared to experimental results.
I Introduction
Liquid crystals (LCs) are a fascinating state of matter, simultaneously exhibiting physical properties usually associated with either solids or liquids. This is due, with some exceptions Kim et al. (2012), to the decoupling between positional and orientational order of the constituting organic molecules: depending on the chemical structure and external physical conditions (temperature, pressure), molecular position and orientation are characterized by a different symmetry DeGennes and Prost (1993). In this Paper, we focus on the case in which the position of the molecules is random on the long range, whereas their direction shows a finite degree of orientational order, i.e., on the nematic phase.
Composition and arrangement of LCs reflect on their physical and optical properties: LCs usually behave as anisotropic crystals, but with a pointwise direction of the principal axes DeGennes and Prost (1993). At the same time, the high mobility of the LC molecules favors a high degree of tunability through the application of external electric and/or magnetic fields, regardless of their oscillation frequency. Thermotropic LCs are also highly sensitive (including phase transitions) to temperature changes Tsai et al. (2003). All these characteristics have been exploited in several areas, the most important being the display technology Wu and Yang (2006). In optics and photonics, LCs are currently used in many other applications, involving optical signal processing with tunable devices Maune et al. (2003), temperature sensing Moreira et al. (2004), tunable lasing action Coles and Morris (2010), spatial light modulation Zhang et al. (2014), wavefront manipulation via the Berry phase Marrucci et al. (2006), among others.
The strong tunability of LCs is present even at optical frequencies. Thus, LCs feature a very strong optical nonlinearity Tabiryan and Zeldovich (1980). Depending on the excitation, different kinds of nonlinear mechanisms come into play, such as reorientational, thermal, photorefractive, electrostrictive, electronic responses, as well as due to modulation of the order parameter Khoo (1995); Wong and Shen (1973); Durbin et al. (1981); Peccianti et al. (2010); Piccardi et al. (2011). Hence, on the one hand LCs are an ideal workbench to investigate the interplay between different nonlinearities Warenghem et al. (2008); Burgess et al. (2009); Laudyn et al. (2015), on the other hand nonlinear optics helps studying the properties of new LC mixtures, including those doped with dyes Jánossy and Kósa (1992); Muenster et al. (1997); Ferjani et al. (2006).
In the context of nonlinear optics, materials often exhibit an overall response resulting from the combination of various processes Marte (1994). The interplay/competition of nonlinear mechanisms leads to a rich scenario of all-optical phenomena Maucher et al. (2016), in many cases adding extra degrees of tunability and disclosing new ways to optical manipulation and signal processing. Early examples to this extent concerned the study of an intensity-dependent refractive index in Kerr materials with additional higher order contributions Lawrence et al. (1994); Wright et al. (1995); Shim et al. (2012).
To date, a number of side and higher-order effects have been combined with a self-focusing cubic response as means to stabilize two-dimensional (2+1)D soliton solutions, in time or in space Buryak et al. (1995); Quiroga-Teixeiro and Michinel (1997); Mihalache et al. (2006a); Falcão Filho et al. (2013), while other examples of the occurrence of two distinct nonlinear responses include spatio-temporal confinement of light into bullets, predicted in nonlocal/noninstantaneous media Silberberg (1990); Mihalache et al. (2006b); Burgess et al. (2009).
In this Paper we address the interplay and competition of the two dominant LC nonlinearities when the input is a continuous wave (CW), that is, reorientational and thermo-optic responses to light. We consider a standard planar cell much longer than the diffraction length of the input beam in order to study the mutual role of linear diffraction and nonlinear effects. In fact, both nonlinearities manifest as point-wise changes in the refractive index. At the same time, both of them exhibit a highly nonlocal character, i.e., a light-induced perturbation much wider than the exciting beam Snyder and Mitchell (1997); Conti et al. (2003); Rotschild et al. (2005). Since reorientation usually dominates over thermo-optical effects in pure LCs, we consider a specific guest dopant added to the host LC mixture in order to enhance light absorption in a specific range of wavelengths Warenghem et al. (2008); Laudyn et al. (2015). Thereby, employing one wavelength inside and one outside the absorption band of the dye, we can evaluate the interaction of the two responses when simultaneously excited. Using the highly nonlocal approximation Snyder and Mitchell (1997), we model the behavior of the two nonlinearities when acting alone or together, considering both the propagation of a single beam or the interaction of two beams at different wavelengths. Finally, we compare our theoretical findings with experimental measurements.
II Nonlinear light propagation in Nematic Liquid Crystals
In the nematic phase (nematic LCs, NLCs), the molecules lack positional order on the long range, but have a high degree of orientational order on macroscopic distances DeGennes and Prost (1993). NLCs are usually featured by a cylindrical symmetry around an axis, termed molecular director . The field provides the average direction of the long axes in any given point Khoo (1995); optically, is the optic axis of the effective uniaxial medium. To determine the values of each element of the dielectric tensor, further data on the molecular distribution are required, including the order parameter , which roughly corresponds to the standard deviation of the molecular distribution around . The two independent eigenvalues of the dielectric tensor are and , corresponding to plane waves propagating with phase velocities and , respectively ( is the speed of light in vacuum) and electric fields oscillating orthogonal or parallel to for or , respectively. The thermo-optic effect in NLCs stems from the marked dependence of on temperature DeGennes and Prost (1993), in turn due to the temperature dependence of the refractive indices and Simoni (1997)
| (1) | ||||
| (2) |
where is the temperature of the nematic-isotropic transition for a given NLC mixture, whereas and are fitting parameters derived from experimental measurements Li and Wu (2004). From Eqs. (1-2) it is clear that increases with temperature if [ for positive NLCs], whereas decreases at double rate with respect to . Fundamental Derrien et al. (2000) and higher-order solitons Hutsebaut et al. (2004) based on thermal nonlinearity have been reported in NLCs.
For a given direction of the wave vector , the eigensolutions of the Maxwell’s equations corresponding to and are ordinary and extraordinary plane waves, respectively. The ordinary electric field (wave) is always orthogonal to the director and the phase velocity of the wave is . Conversely, the extraordinary (wave) electric field is coplanar with the wave vector and the director , with a phase velocity which depends on the orientation angle between and Simoni (1997) ():
| (3) |
Moreover, the extraordinary beam propagates in the plane with a Poynting vector tilted with respect to the wave vector by the walk-off angle Alberucci et al. (2010), where is the optical anisotropy, usually positive in NLCs.
As already stated, the dominant nonlinear optical responses in NLCs excited by CW lasers are thermal and reorientational. Thermal nonlinear effects occur, for example, when absorption causes a reduction of the order parameter, with a net decrease (increase) of () Braun et al. (1993); Warenghem et al. (1998) [Eqs. (1-2)]. Instead, the reorientational nonlinearity originates from collective rotation of molecules induced by light Khoo (1995); Tabiryan and Zeldovich (1980); Durbin et al. (1981). In the case of reorientation, the electric field of a light beam induces a molecular dipole which tends to align to . The net result is an electromagnetic torque . The equilibrium position of the director is determined by the balance between the torque and the elastic forces associated with intermolecular links and anchoring conditions, the latter set at the cell edges Khoo (1995). When light is purely extraordinary polarized, the all-optical reorientation of the director results in an increase of , leading in turn to an increase in , as stated by Eq. (3). The net effect is beam self-focusing. The reorientational nonlinearity is polarization-dependent as well: ordinary input beams orientate the molecules only beyond the Fréedericksz threshold Durbin et al. (1983), whereas extraordinary beams can induce nonlinear effects at very low powers Zeldovich et al. (1980).
When an polarized bell-shaped beam propagates in NLCs, self-focusing at mW excitations can yield light self-confinement and the generation of bright spatial solitons, also termed nematicons Peccianti and Assanto (2012), due to the self-induced transverse refractive index profile. Nematicons are self-trapped beams as well as light induced waveguides for co-polarized signal(s); they can be controlled/routed all-optically, electro-optically, magneto-optically as well as by refractive perturbations, interfaces, boundaries, leading to the implementation of guided-wave circuits for signal addressing and processing Peccianti et al. (2004); Beeckman et al. (2006); Piccardi et al. (2008); Izdebskaya et al. (2010); Assanto (2012); Laudyn and Karpierz (2013); Piccardi et al. (2014); Izdebskaya (2014); Izdebskaya et al. (2017).
An important feature of self-trapped beams in NLCs is the high degree of nonlocality characterizing the light-induced refractive index potential. As a matter of fact, the light-written index well extends far beyond the beam profile itself, thus preventing the insurgence of catastrophic collapse Conti et al. (2003); Bang et al. (2002). In this limit the nonlinear index change can be approximated by a parabolic shape , i.e., the system resembles a quantum harmonic oscillator Snyder and Mitchell (1997). In writing the expression for , we assumed , with the plane normal to the wave vector. Nematicons are shape preserving, but in general spatial solitons in NLCs breathe with excitation dependent periodic oscillations in width and peak intensity Conti et al. (2004). The -dependence of the beam width for light propagating in a parabolic index well is given by Snyder and Mitchell (1997); Alberucci et al. (2015, 2016)
| (4) |
with the average refractive index and, in the nonlinear case, depending on the light distribution.
Here we are interested in the competition between reorientational and thermal effects. In order to study the interplay between these two responses, we employed dye-doped nematic liquid crystals to enhance the optical absorption in a finite region of the spectrum Warenghem et al. (1998), as detailed in the following section.
III Sample geometry and material properties
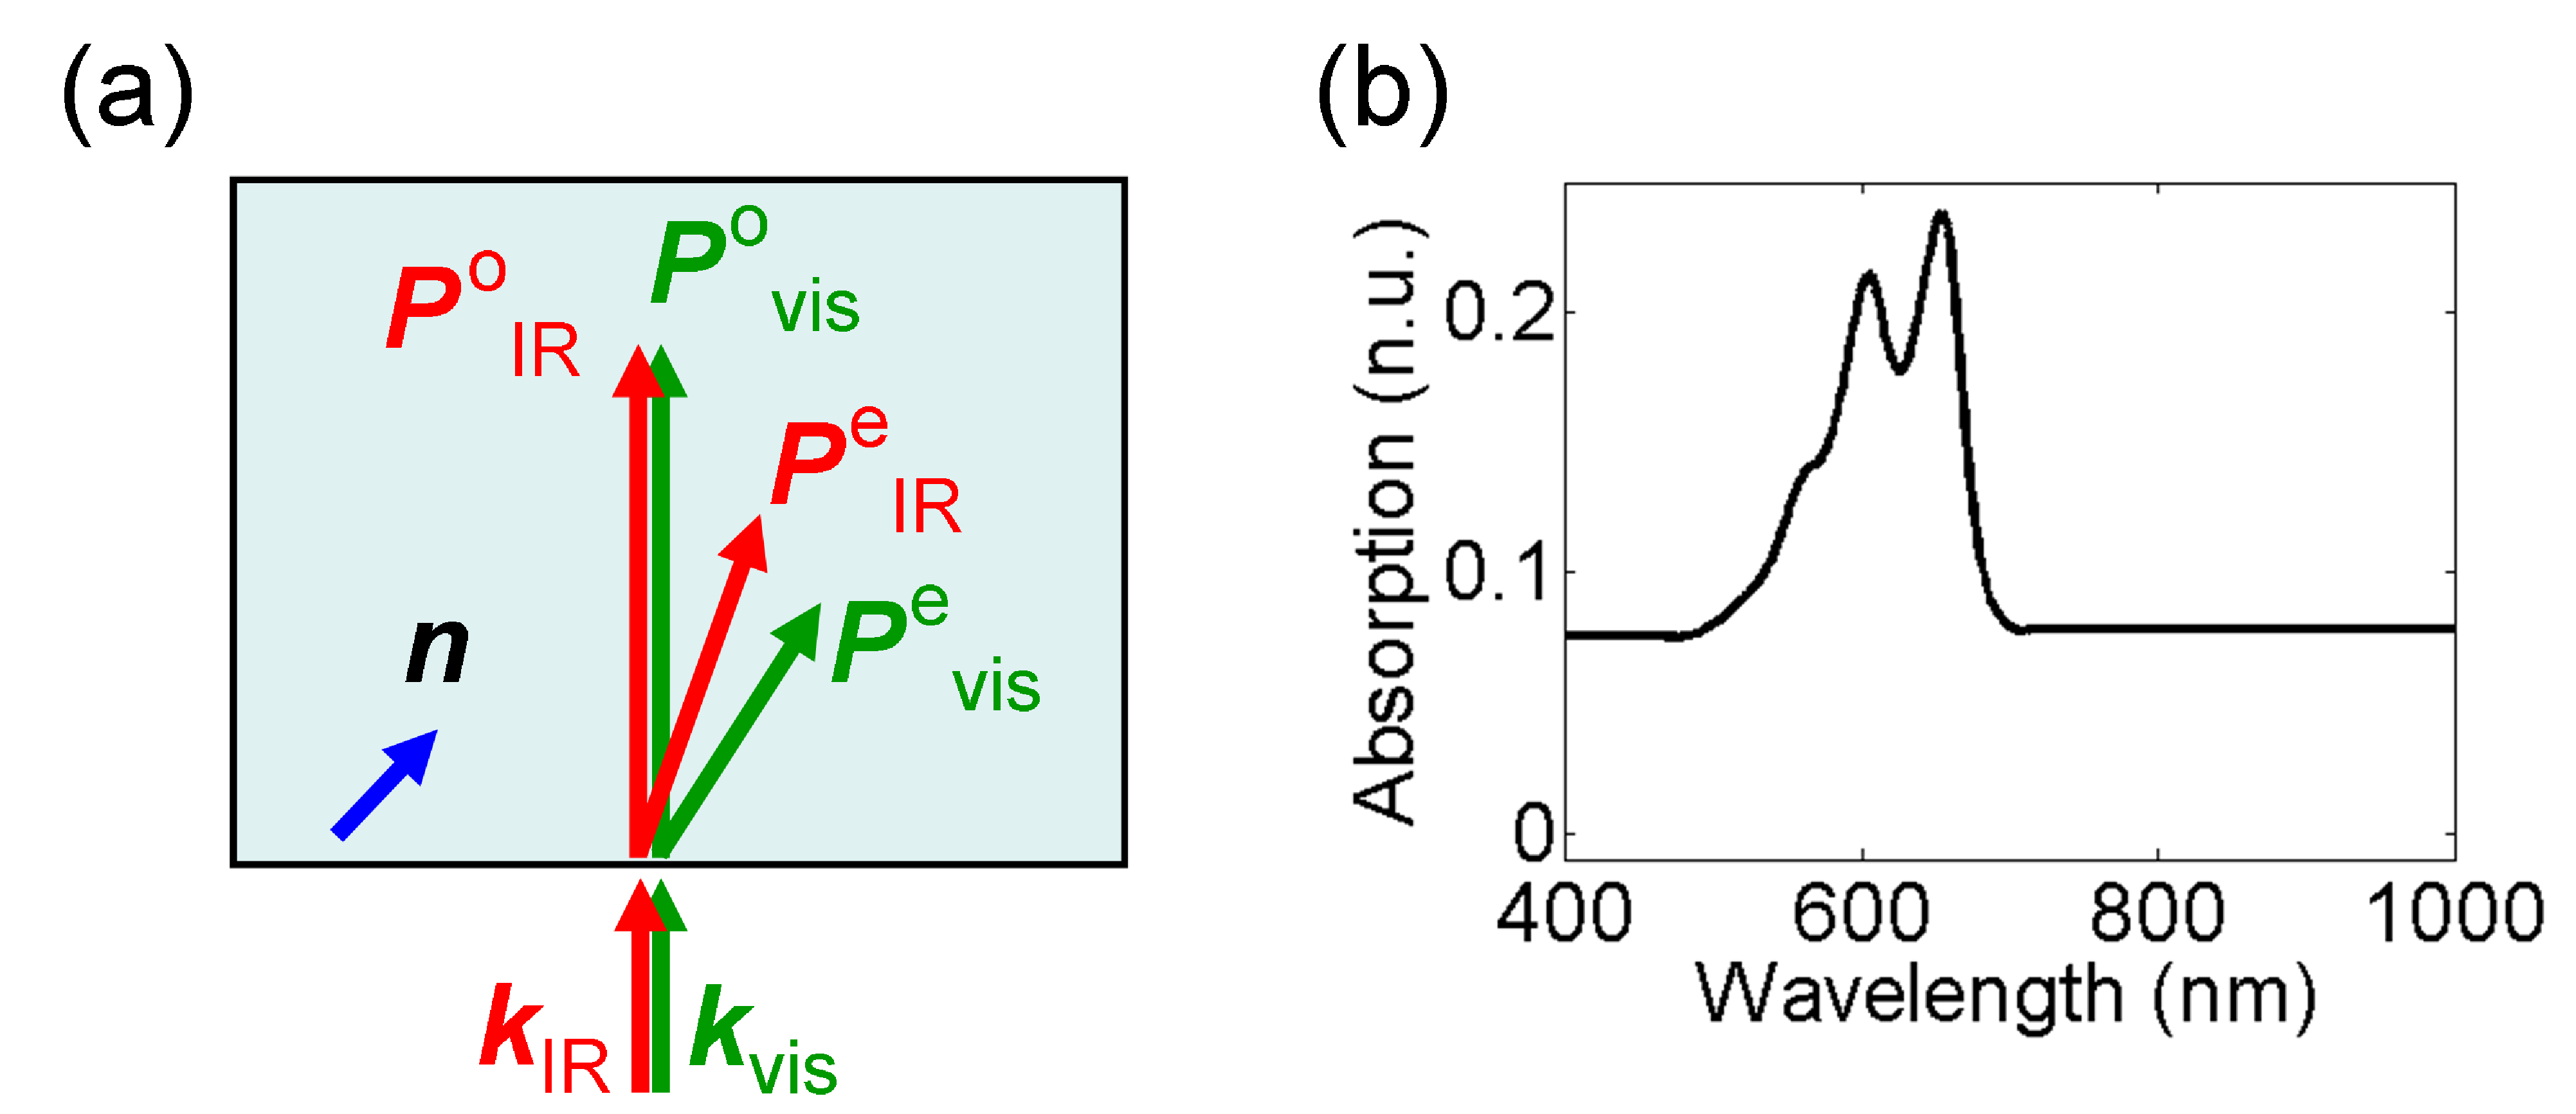
The sample is sketched in Fig. 1(a). To contain the NLC and maintain the desired molecular alignment, a planar cell was realized with two parallel glass slides separated by m, with the inner interfaces mechanically rubbed to yield uniform planar anchoring of the director at with respect to the axis. The cell was filled with the host 6CHBT (, nm and , nm, room temperature) doped with of the Sudan Blue dye Milanchian et al. (2012), the latter showing a main absorption peak at nm [see Fig. 1(b)].
Light attenuation in an NLC sample can be described by the (intensity) absorption coefficient :
| (5) |
The term corresponds to the Rayleigh-like scattering, thus implying no changes in temperature. Conversely, the term accounts for inelastic scattering, responsible for warming up the sample. When a resonant dye is added to the NLC host, in the limit of small concentrations only the term changes, allowing to control the amount of heat generated by light in the NLC. In addition, the strong NLC anisotropy yields -in general- a dichroic response, with depending on the polarization.
We used two CW laser beams of different wavelengths to change the relative weight of the two nonlinear responses. The beam at nm, away from the dye resonance, excites reorientation. The second beam, with wavelength nm is within the absorption band of Sudan Blue to enhance the thermal nonlinearity Warenghem et al. (2008). The two beams are coupled into the sample by focusing them with a microscope objective to a waist of m at the input section . The beam evolution is observed by collecting the out-of-plane scattered light with a CCD camera and a microscope.
IV Comparison between reorientational and thermal nonlinearities
IV.1 Reorientational nonlinearity
The most known all-optical effect in NLC for CW excitations is the reorientational nonlinearity. Describing the director distribution by the angle , molecular reorientation in the single elastic constant approximation obeys DeGennes and Prost (1993)
| (6) |
where is the slowly varying envelope of the propagating field. In Eq. (6) we wrote explicitly the dependence of the material parameter ( and ) on the temperature . Eq. (6) is valid for a linear input polarization, with the field parallel to (the ordinary component in the unperturbed NLC, with reorientation in the plane) or to (extraordinary component, reorientation in ). As well known, the ordinary wave is subject to the optical Fréedericksz threshold, that is, the director starts to rotate only beyond a given optical power Durbin et al. (1981); Braun et al. (1993); conversely, the extraordinary component undergoes threshold-less reorientation, allowing for the observation of self-focusing even at modest powers. In particular, for small reorientations ( and ) we can assume in the sine term in Eq.(6), the latter thus becoming a Poisson’s equation, linear in beam intensity . Hereafter we will proceed in the small reorientation approximation when solving Eq. (6), consistently with the configuration shown in Section III and described by Alberucci et al. (2010).
IV.2 Thermal nonlinearity
Simultaneously to the torque exerted on the NLC molecules, the beam heats the sample through absorption. Neglecting convection Beeckman et al. (2005), the temperature fulfills a Poisson’s equation
| (7) |
where is the vacuum impedance. In Eq. (7) both the optical absorption and the refractive index change according to the polarization (with ordinary index or extraordinary index given by Eq. (3)) of the propagating wave. In writing Eq. (7) we neglected the spatial anisotropy of the thermal conductivity in NLC.
IV.3 Interplay between heat flow and molecular reorientation
Equations (6-7) allow us to compute the nonlinear perturbation of the temperature distribution and the director field. Once and are known, Eqs. (1-3) allow to describe the overall index well - or according to the input polarization- induced by light.
The relative weight of the two nonlinearities and their consequent interplay can be addressed assuming a Gaussian intensity profile and neglecting the derivative in the propagation direction (i.e., the Poynting vector) in Eqs. (6-7): in this limit a closed form solution can be found for the Poisson’s equation. The maximum transverse reorientation and temperature (on beam axis) are then Alberucci and Assanto (2007)
| (8) | ||||
| (9) |
where , , is the room temperature and is the beam power. Noteworthy, neither nor depend explicitly on the wavelength. We stress that, if the boundary conditions applied to Eqs. (6-7) are the same 111In actual cases this is valid, at least to first approximation: the temperature is assumed equal to at the edges of the sample, whereas the optical reorientation vanishes at the interfaces under strong anchoring conditions., the spatial profile of the nonlinear perturbation is the same for both the nonlinear mechanisms. This is true whenever the anisotropy in the elastic properties and in the thermal conductivity of the NLC is neglected. In other words, the ratio between reorientational and thermal contributions does not vary point by point, at least for small variations of and across the sample. A key parameter is the magnitude of the parabolic index well , unambiguously determining the intensity distribution of a single beam in the highly nonlocal limit. A simple analytical relationship between and the beam intensity peak can be easily found by a Taylor’s expansion Conti et al. (2004). For the reorientational and the thermal cases we respectively find
| (10) | ||||
| (11) |
with a fit coefficient (equal to 2) introduced to improve the matching between model and exact solutions Ouyang et al. (2006); Alberucci et al. (2014a).
The two quantities and can be substituted into Eq. (4) to find how the beam radius varies along . Assuming in agreement with Eqs. (10-11), the beam width evolves according to Alberucci et al. (2016)
| (12) |
Let us now discuss the character -focusing or defocusing- of the two nonlinearities with respect to the initial temperature of the NLC layer. The coefficient is always positive because reorientation increases the refractive index. Conversely, can be either positive or negative, in agreement with Eqs. (1-2). In particular, is negative, whereas changes its sign as the director orientation varies via the coefficient , with changing the relative weight of and in determining [see Eq. (3)] Simoni (1997). Since for small anisotropy we can write
| (13) |
| (14) |
Equation (14) states that, in our configuration with , the thermo-optic response for the extraordinary component is defocusing when . When the response is defocusing if is satisfied. For example, at nm in the mixture 6CHBT with , Eq. (14) is negative only for temperatures above 307K. Finally, the magnitude of the nonlinear effects increases as the temperature approaches the transition temperature Simoni (1997).
IV.4 Ordinary polarization
The ordinary case is quite simple: below the Fréedericksz threshold, only the thermal nonlinearity is active, thus light undergoes self-focusing (defocusing) when () Piccardi et al. (2011), with beam dynamics determined by Eqs. (9) and (11). Reorientation occurs above the threshold, so both the nonlinear mechanisms take place at the same time. A crucial issue is whether reorientation or nematic-isotropic transition takes place first. To answer, let us assume a beam invariant along ; the power corresponding to the Fréedericksz threshold is found from (8) by setting . The optical threshold power is then Alberucci et al. (2014b)
| (15) |
Similarly, starting from (9), the power required to reach the nematic-to-isotropic transition is
| (16) |
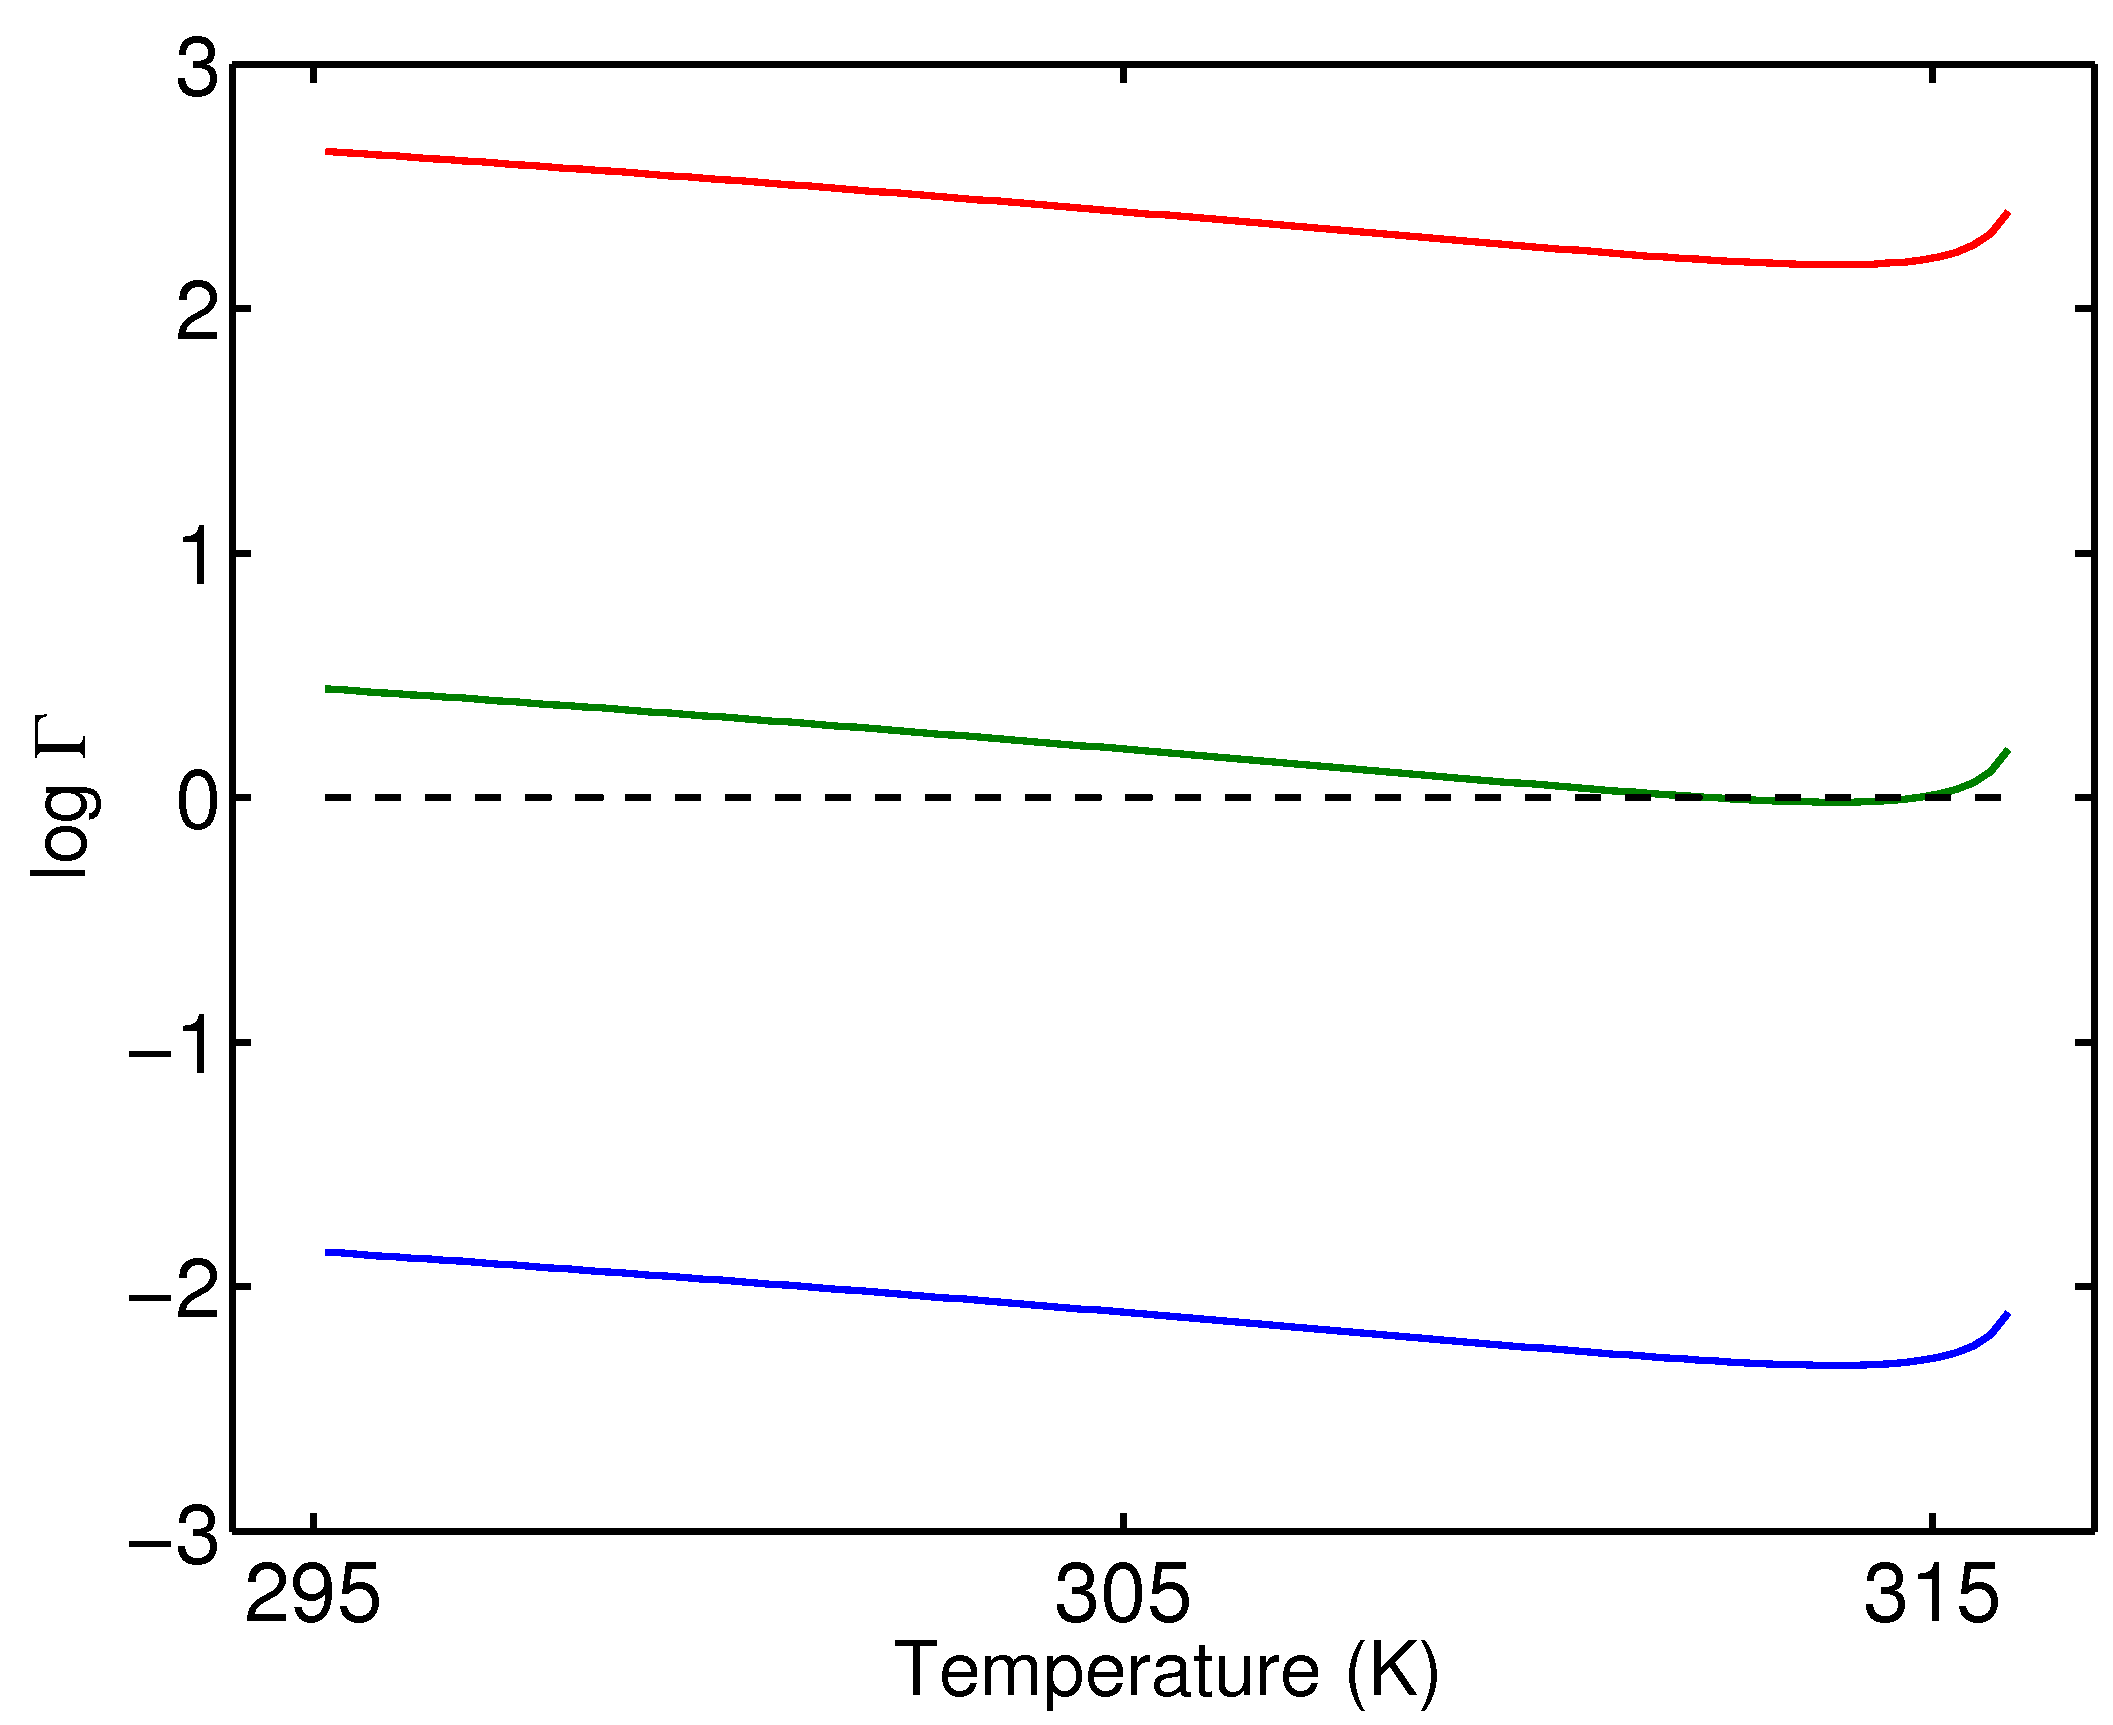
As expected, the ratio , determining which phenomenon occurs first, does not depend on the beam width but only on material parameters, the latter depending on wavelength and temperature. The logarithm of the ratio is graphed in Fig. 2 versus sample temperature for three values of absorption. When is lower than 1, the threshold is overcome before the transition to the isotropic phase. Conversely, when the Fréedericksz transition is preceded (hence, washed out) by the phase transition from the nematic to the isotropic state.
IV.5 Extraordinary polarization
The extraordinary polarization case is more complicated tham the previous one due to direct competition of two nonlinearities with opposite signs [see Eq. (14)]. The dominant term can be found by a direct comparison between Eq. (10) and Eq. (11). The overall nonlinear effect will be focusing when
| (17) |
Using Eqs. (13) and (14), conserving only the lowest order terms in , Eq. (17) can be recast as
| (18) |
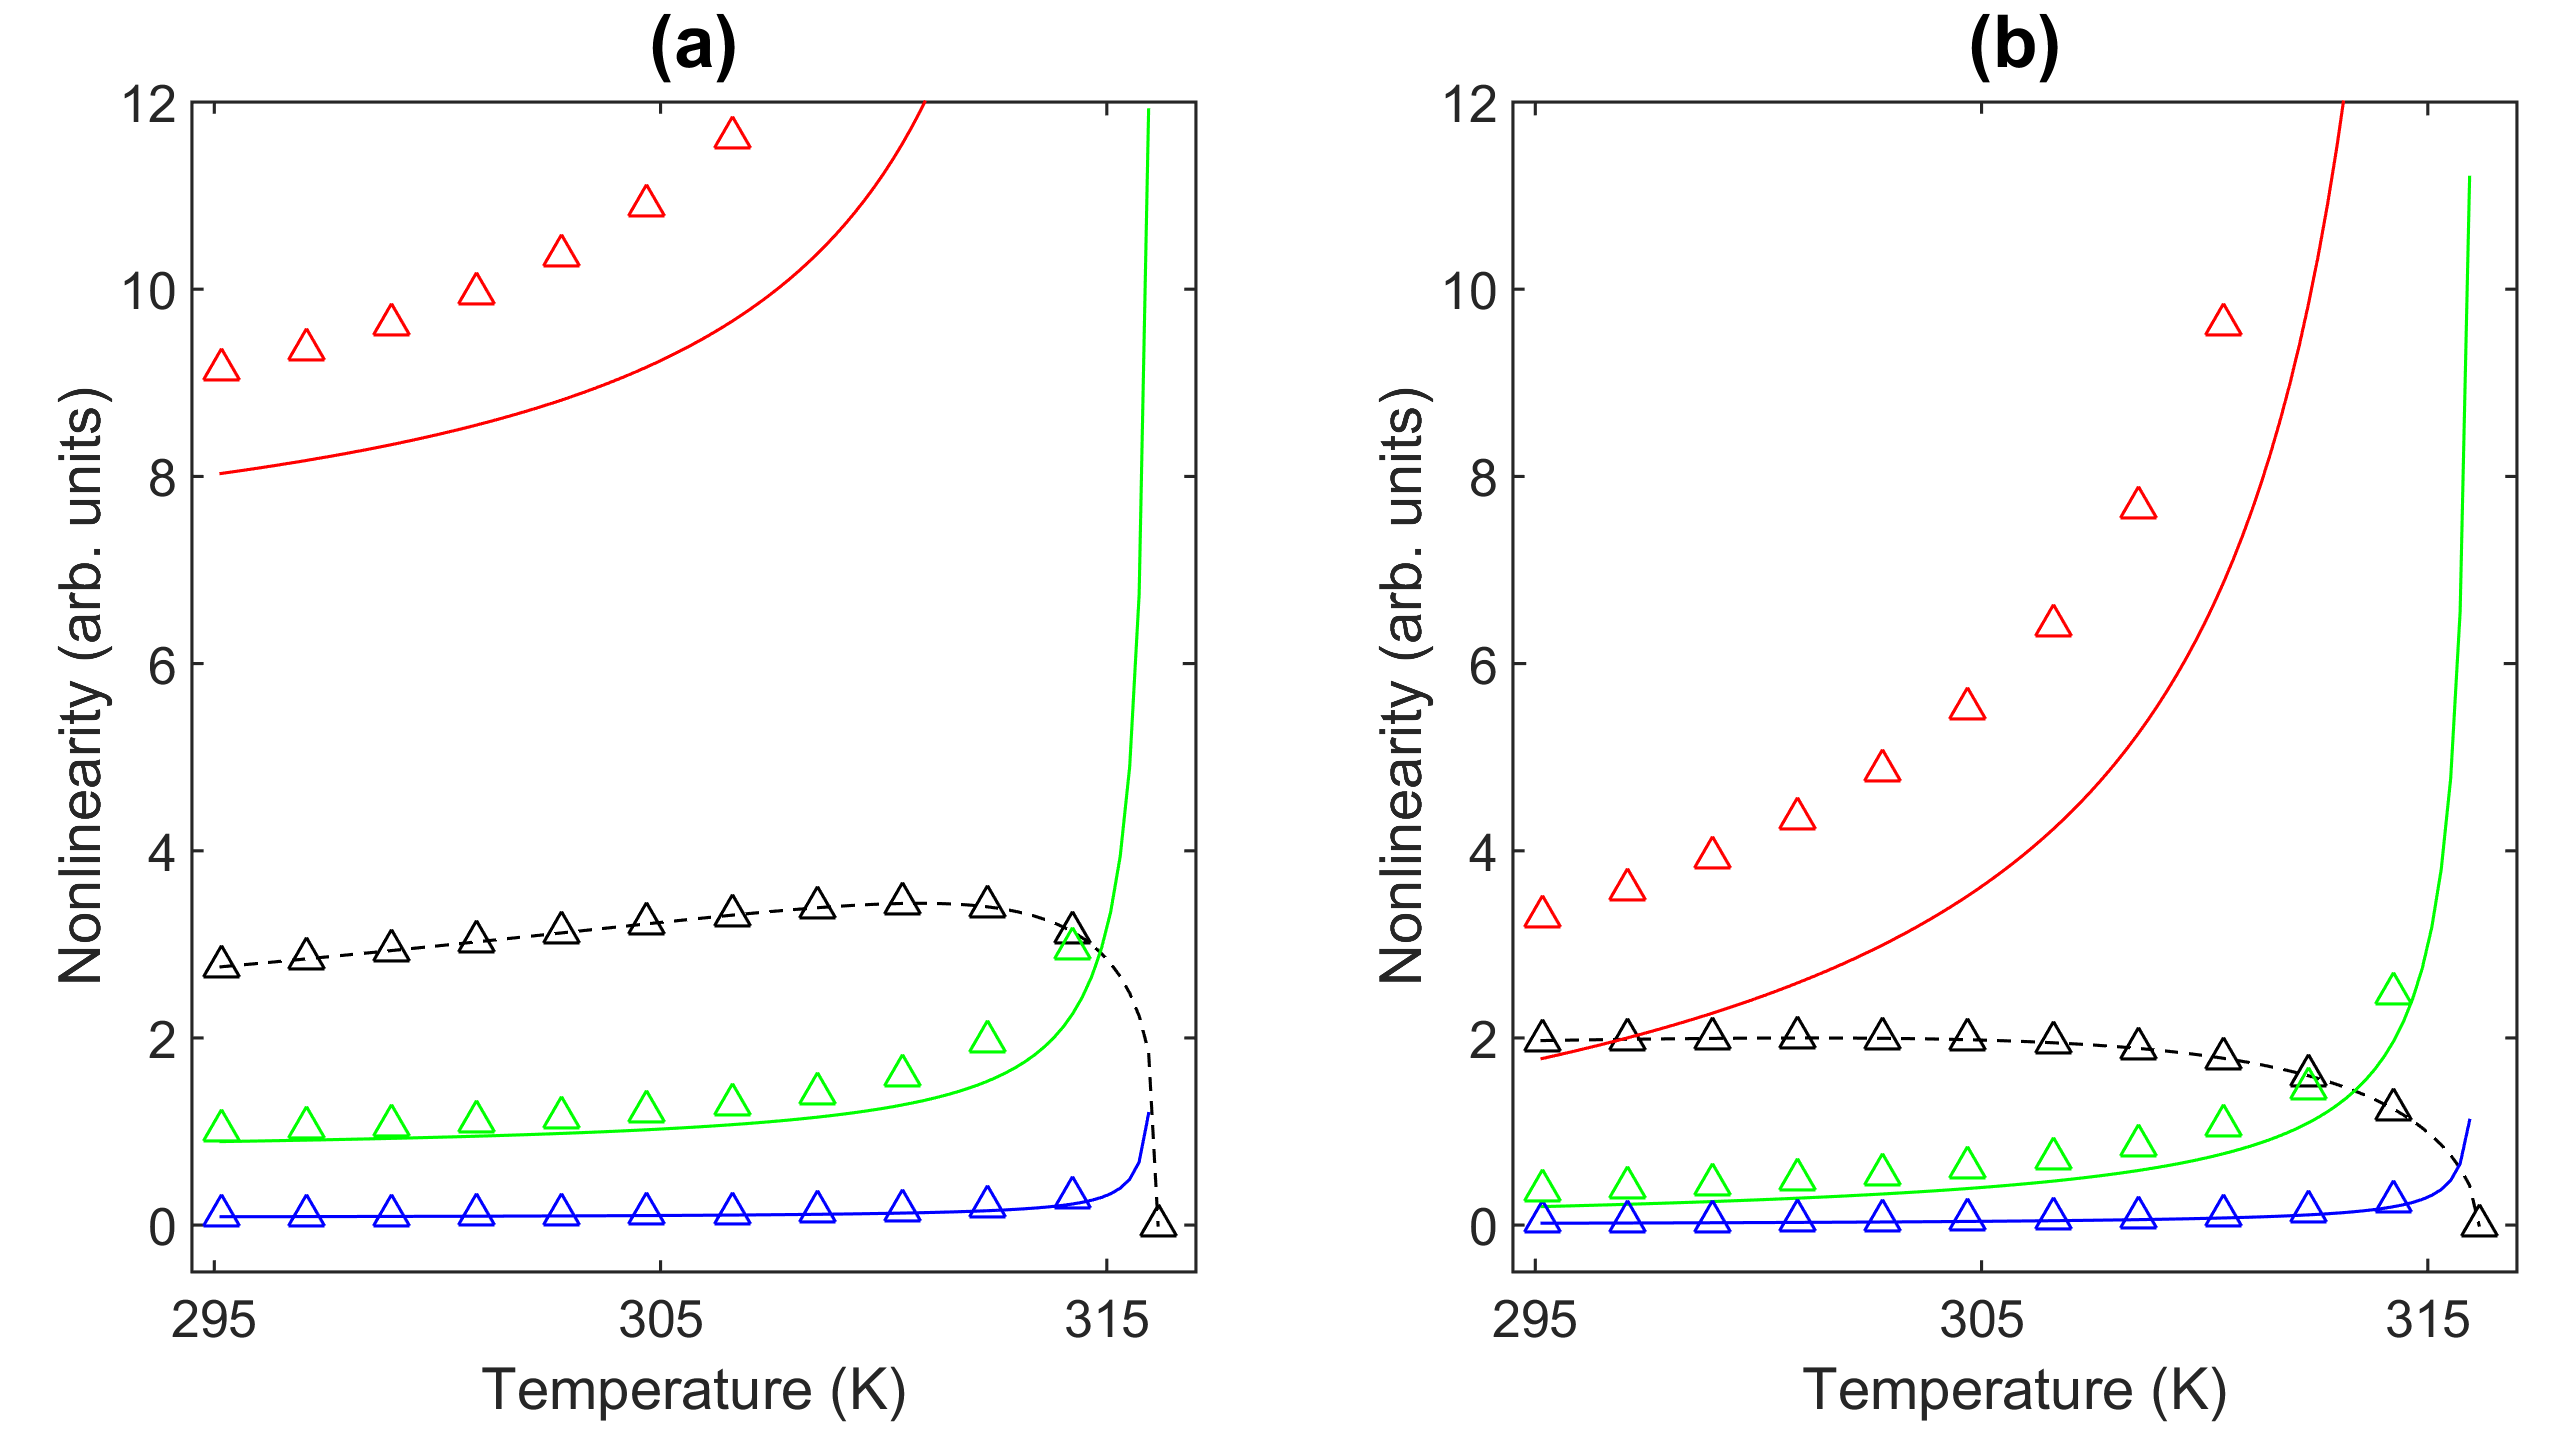
Typical results are illustrated in Fig. 3 for parameters corresponding to the mixture 6CHBT. The overall nonlinearity will be defocusing (i.e. thermal heating prevailing on molecular reorientation) in the presence of a large absorption. When the absorption reduces, reorientation becomes dominant. The relative weight of the two mechanisms depends on temperature: thermal effects undergo a steep increase close to , thus reorientation dominates over heating for temperatures far below the transition. The temperature interval where the torque prevails on heating gets wider as absorption diminishes, becomes very narrow for undoped NLC ( m-1). Figure 3 also shows that reorientational effects are lower in the green than in the IR, if the thermal absorption is supposed to be the same at the two wavelengths.
IV.6 Scalar fundamental soliton in dye-doped 6CHBT
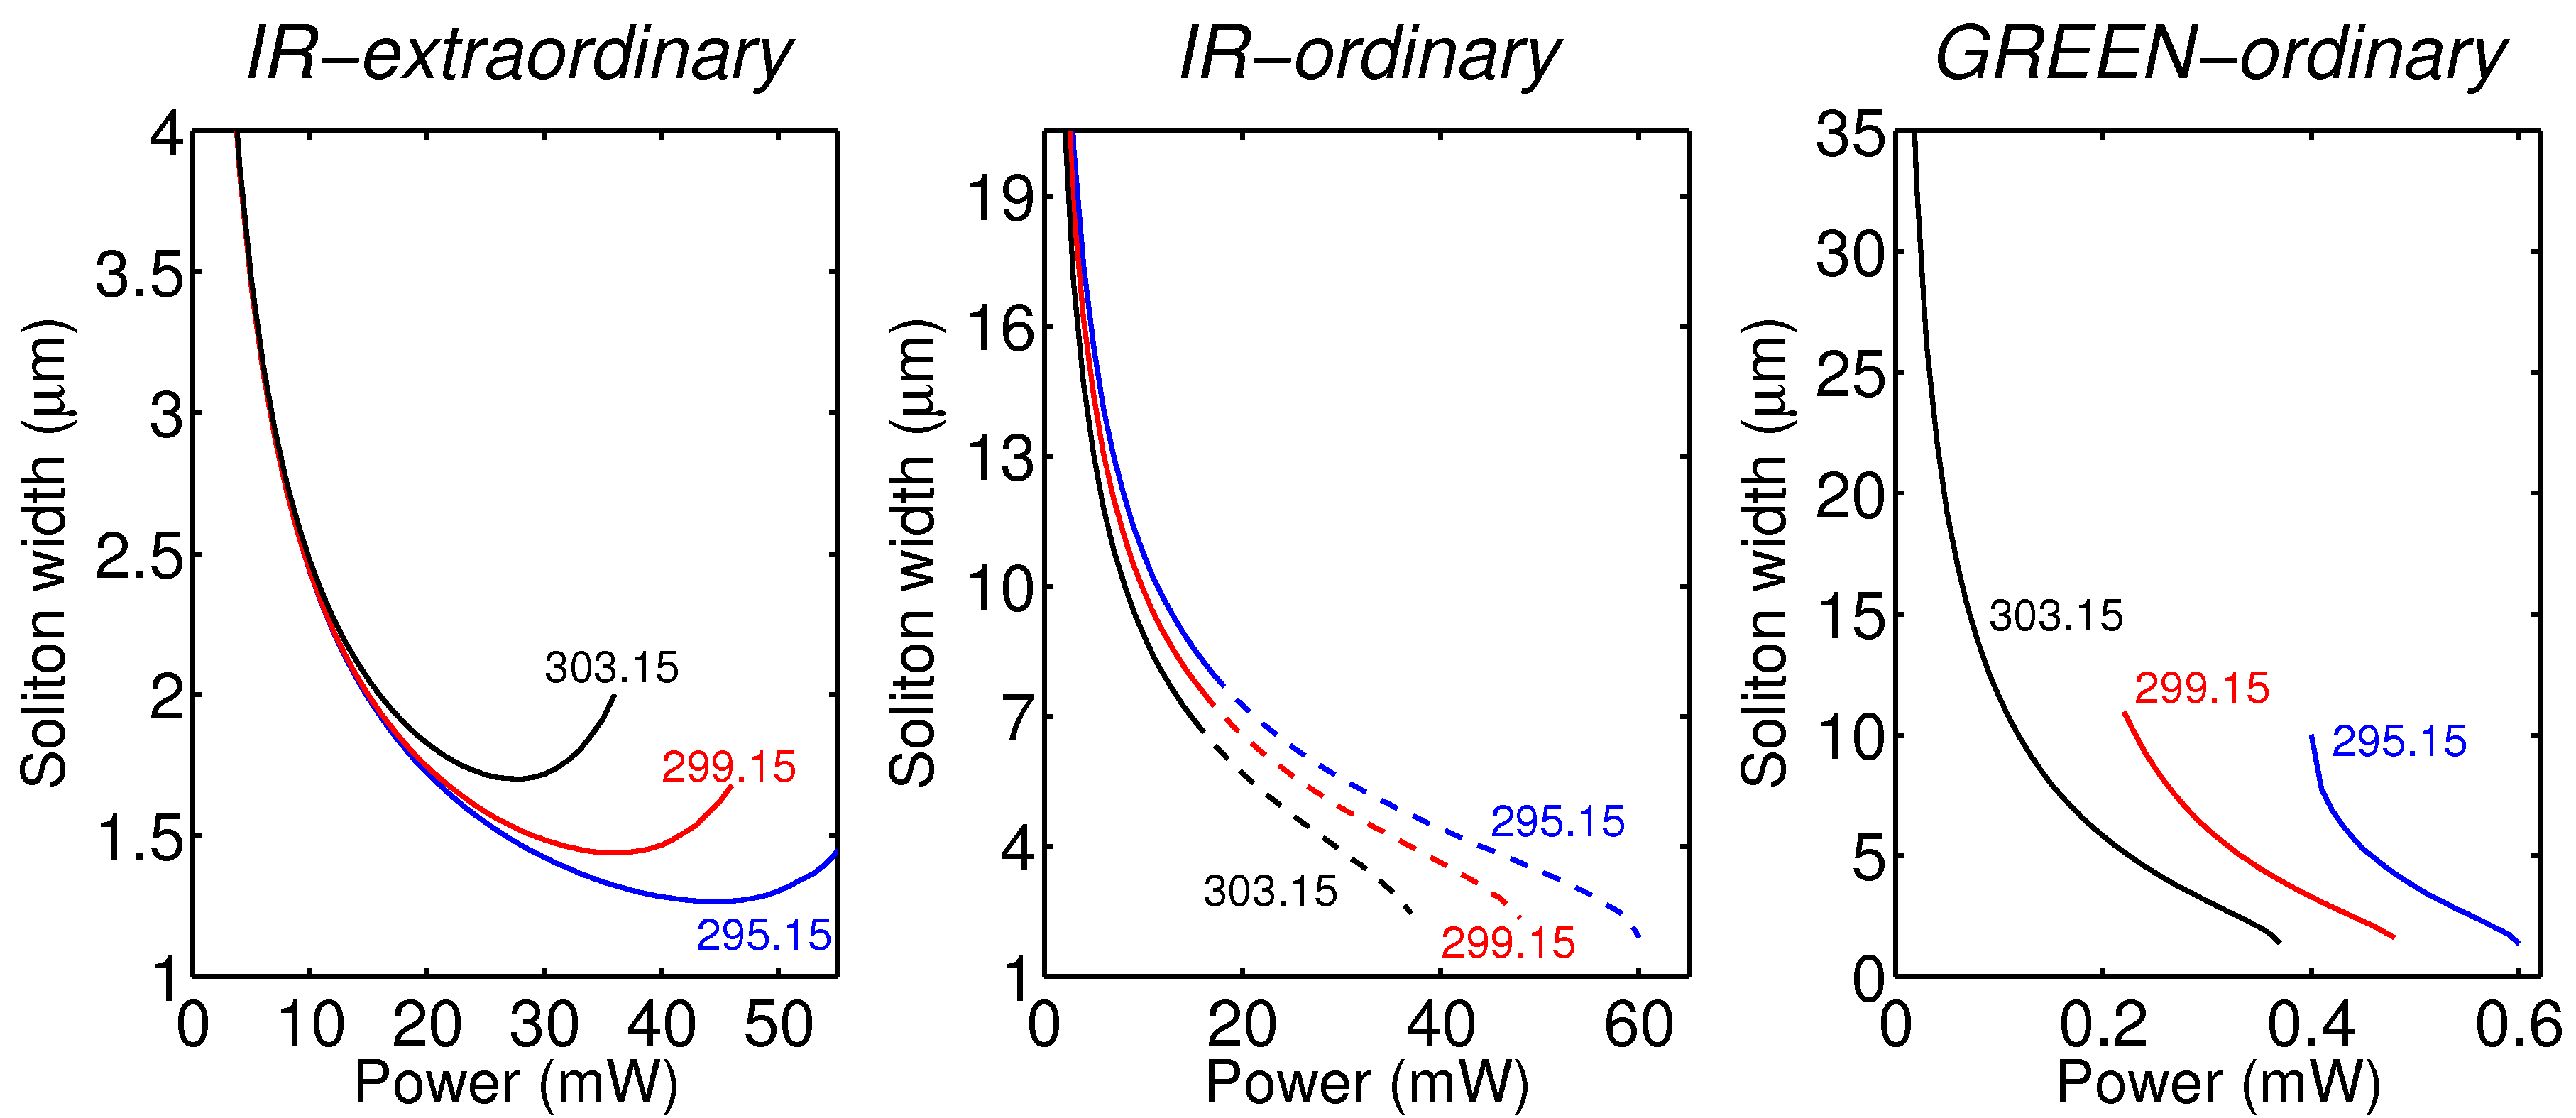
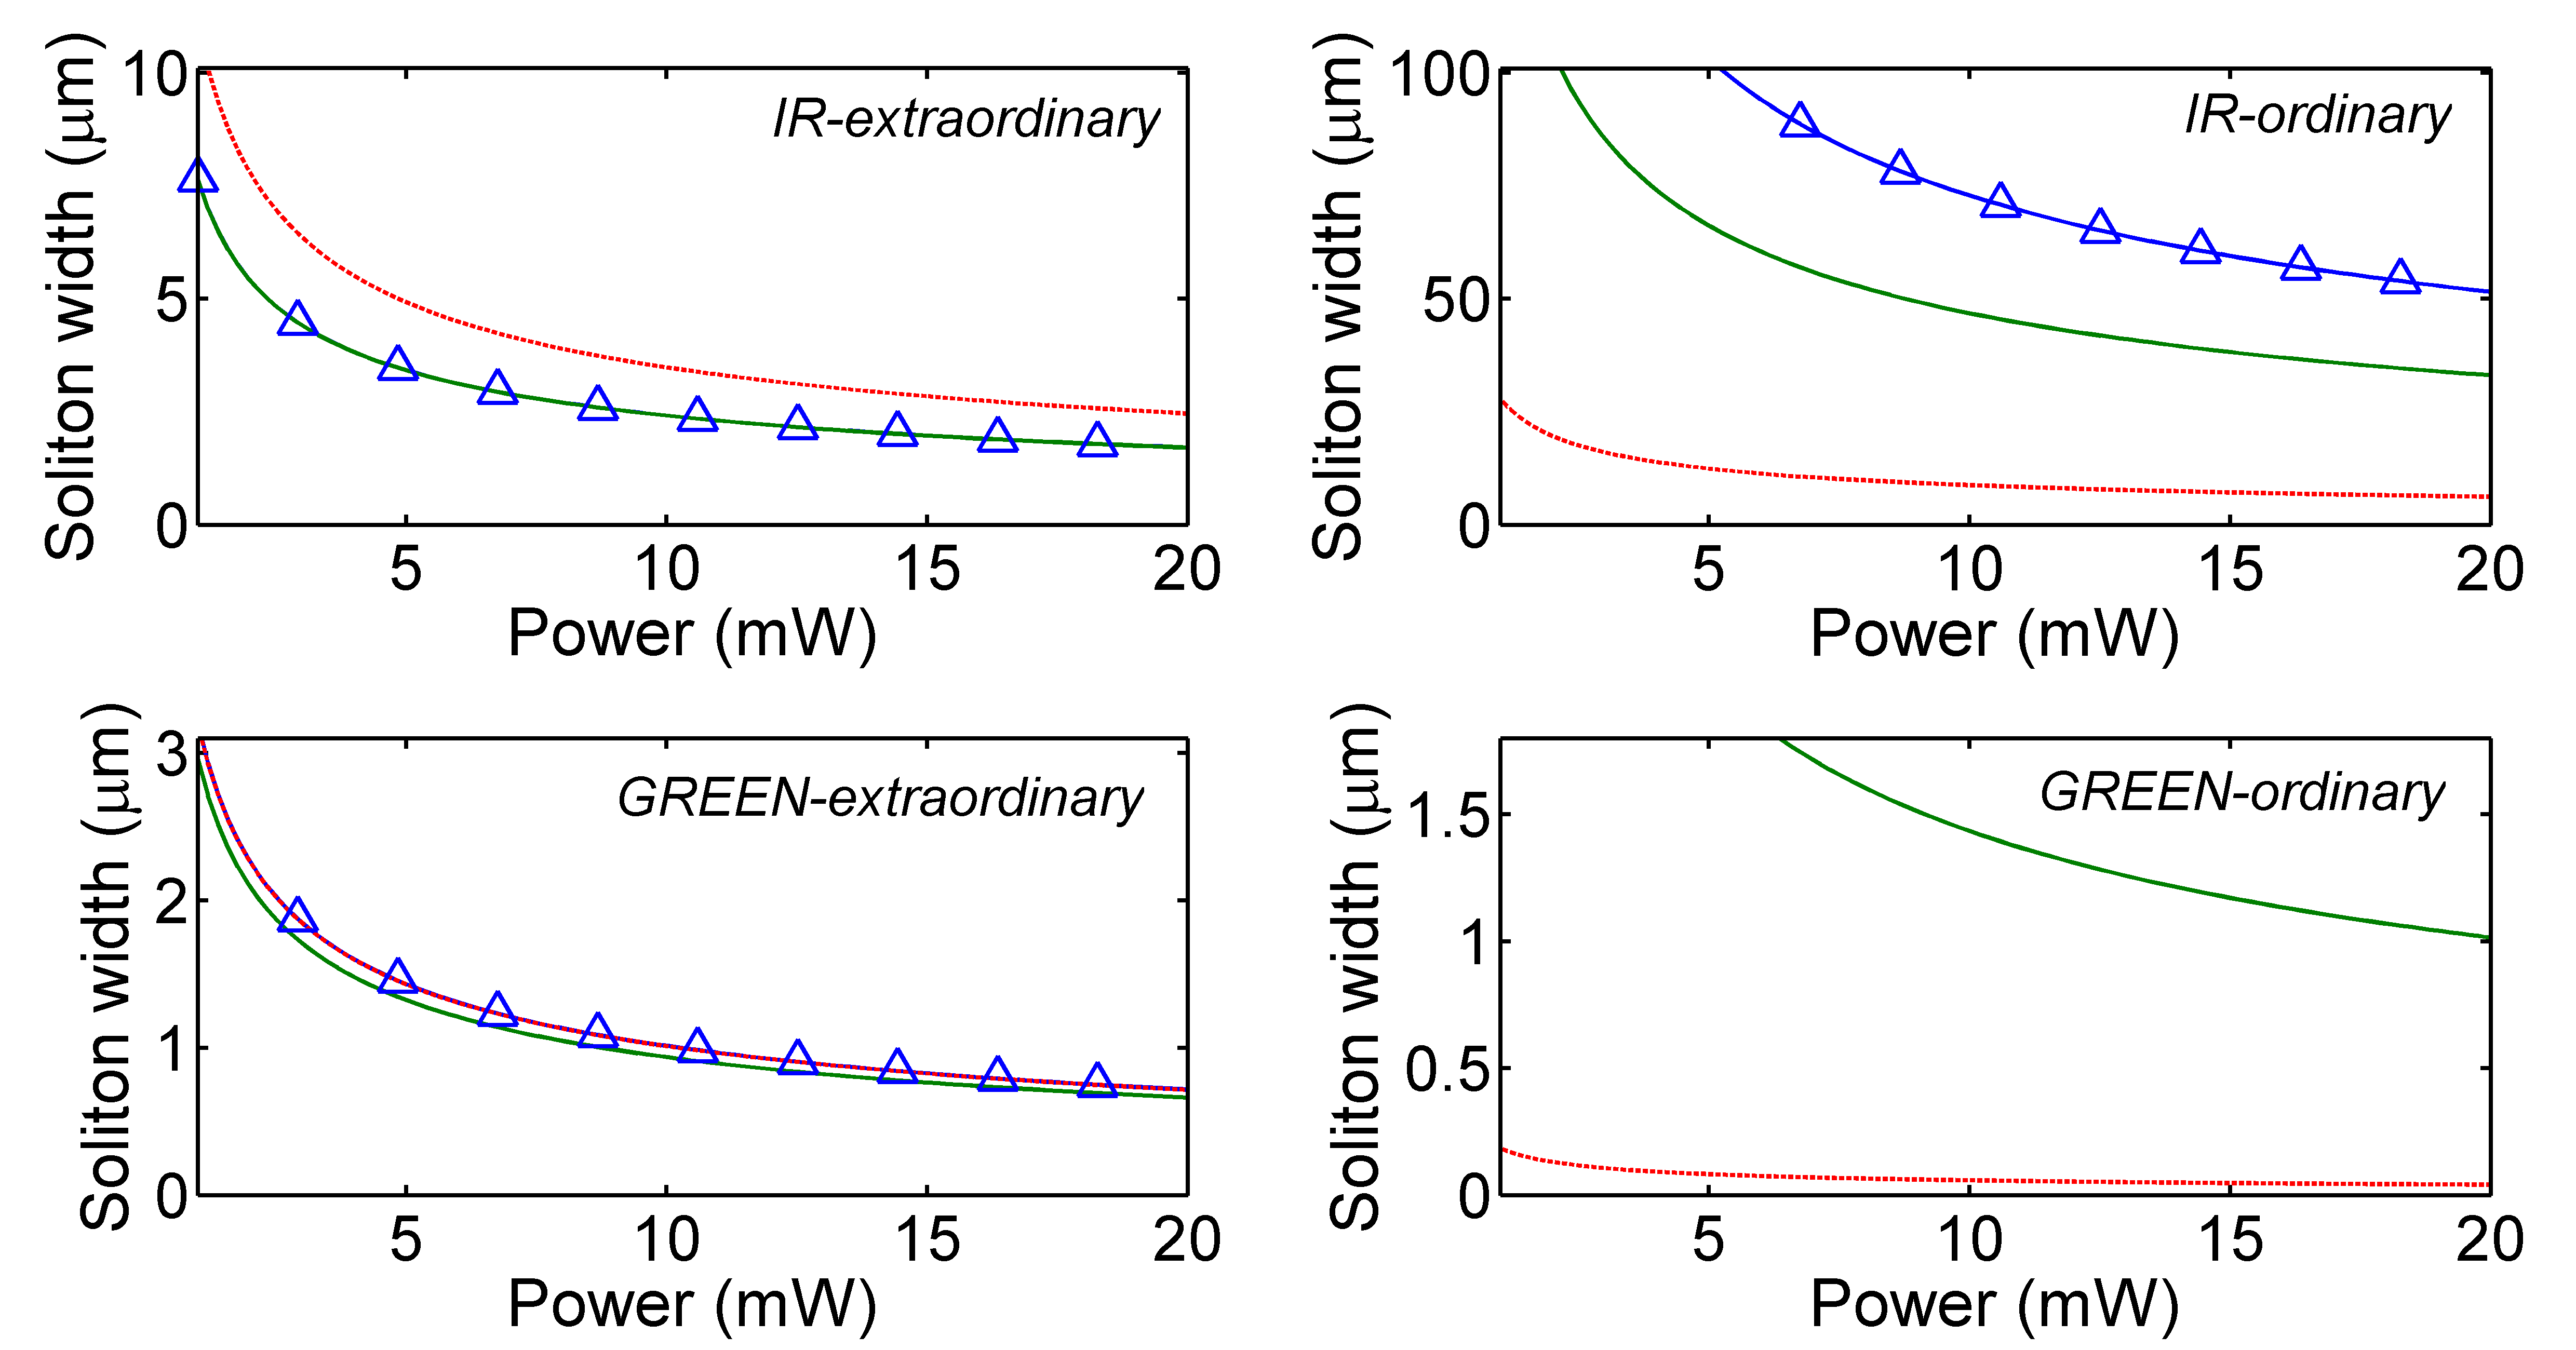
Let us now specialize our general considerations to the sample we used in experiments and detailed in Section III. For the sake of simplicity, we neglect NLC dichroism and take independent from the wave polarization. We can estimate a strong absorption , equal to about 9 m-1, for nm due to the presence of the dopant. At nm no resonance with the dye is excited (negligible ) and m-1, as in standard NLC. Figure 4 graphs the width of the fundamental (single-humped) soliton versus input power of the beams at the two wavelengths. These solitary waves are scalar, i.e., they encompass only one polarization (ordinary or extraordinary) at a given wavelength. The soliton features have to account for both nonlinearities with a twofold interplay: on one side, a direct competition between the two nonlinear index wells, i.e., between the two all-optical wave-guiding effects quantified by Eqs. (10-11) and plotted in Fig. 3 for the extraordinary polarization; on the other side, an increase in temperature changes the material properties, including the elastic response (via the effective Frank’s constant ) and the dielectric response according to Eqs. (1-2) (see Section VIII.2 and Fig. 11 in the Appendix for more details) 222In general, optical reorientation also modulates the thermal properties. We neglect this correction consistently with the background orientation , as remains small with respect to ..
The IR beam is able to excite a bright soliton with either input polarizations. When the polarization is extraordinary (-polarized beam) reorientation always overcomes thermal effects [see Fig. 3(b)]. An upper bound for soliton power exists due to the isotropic-to-nematic transition [see Eq. (16)]. The soliton width does not decrease monotonically with power, owing to a decrease in the reorientational respone via heating [see Fig. 3(b)]. The ordinary wave can also excite a soliton of purely thermal origin, even if such solitons are much wider than reorientational ones (tens of microns with respect to a few microns for typical powers, see Fig. 4). With reference to the reorientational soliton, the thermal effect increases as the transition to the isotropic phase is approached (Fig. 10). Noteworthy, to ensure the observability of a scalar thermal soliton, the power must remain below the Fréedericksz threshold, the latter given by Eq. (15) once the waist of the corresponding soliton is used instead of the generic beam width . In Fig. 4 (center panel) the existence branches where the Fréedericksz threshold is surpassed are marked by dashed lines.
Due to the much larger absorption and the different dispersion, self-trapping of green waves strongly differs from the infrared case. First, the extraordinary component never forms a bright soliton owing to the dominant defocusing of thermal origin (Fig. 3). Conversely, an ordinary-wave thermal soliton can fe formed. Due to the magnitude of the absorption, the soliton can be very narrow (see Fig. 12), but self-trapping can take place at very small powers (less than 1mW) and in a very narrow range dependent on the initial temperature . Similarly to the IR case, the power upper bound corresponds to the nematic-to-isotropic phase transition at . The lower bound is associated with the peculiar dispersion of at this wavelength: for K the ordinary index decreases with temperature (see Fig. 10 in the appendix), thus a bright soliton can exist only when the power inverts the sign of the nonlinearity and yields self-focusing. In agreement with this, the existence curves for solitons shift towards lower powers as the initial temperature increases.
V Evolution of the beam width
In this section, using Eqs. (4) and (10-11), we use the semi-analytical model of Ref. Karimi et al. (2016) to study theoretically how a fundamental Gaussian beam propagates in doped NLC, considering both polarizations separately and two wavelengths, one off-resonance (IR) and one (green) strongly absorbed. As input, we will take a Gaussian beam of input width and possessing a flat phase profile in the input section .
V.1 IR beam alone
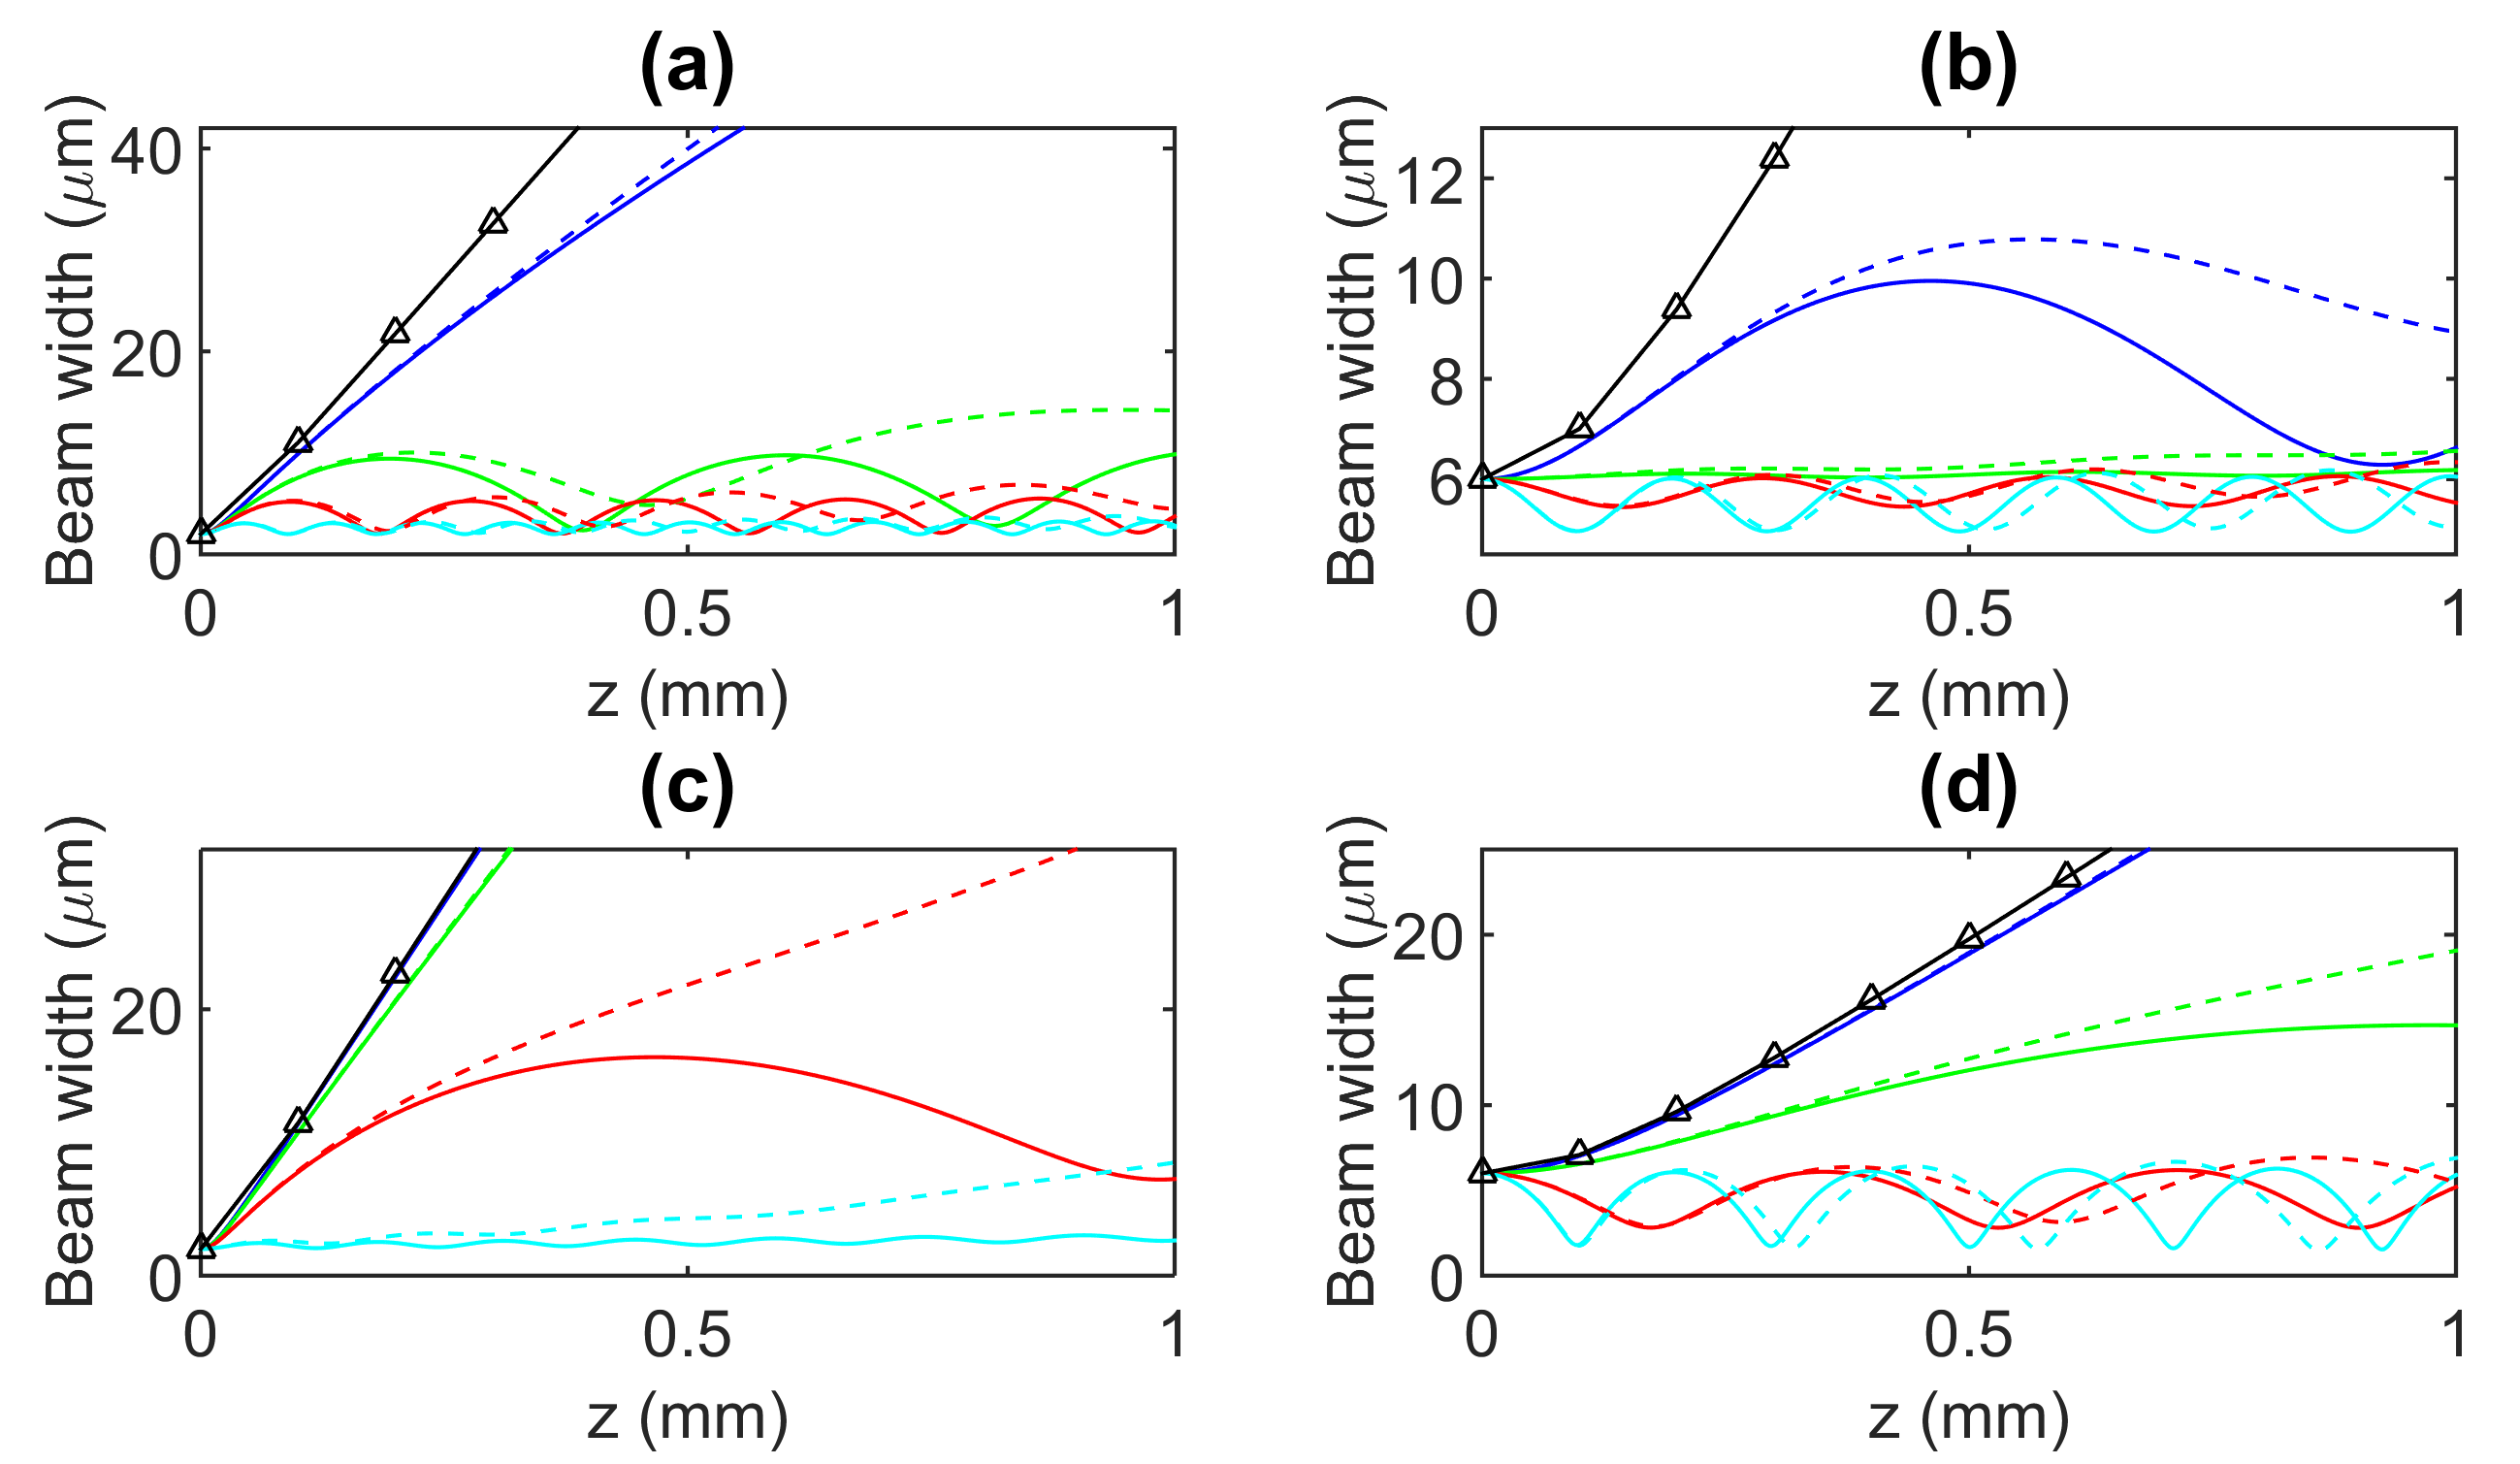
The behavior of the IR beam width versus was computed numerically by solving Eq. (4) for different input powers and is plotted in Fig. 5. For the extraordinary component [Fig. 5(a-b)], we only accounted for the reorientational index well given by Eq. (10), as it is predominant with respect to the thermal effect (see Fig. 3); in the calculation, however, we included the thermal modulation of the NLC parameters (refractive indices and elastic constants) through absorption. In agreement with previous literature, strong self-focusing yields spatial solitons at a few mW powers. The dynamics of soliton formation depends on the input beam width: self-focusing of wider beams is eased owing to less diffraction Karimi et al. (2016). Losses due to Rayleigh scattering (not contributing to thermal heating) affect self-trapping and increase both the average beam width in propagation and the oscillation period (see solid and dashed lines in Fig. 5).
In the ordinary polarization, the beam follows a similar dynamics induced by the thermal nonlinearity, which is the only one active for powers below the Fréedericksz transition (expressed by Eq. (15)). Even though the power required for self-focusing is much higher because of a lower nonlinearity, the influence of scattering losses and input beam width is analogous to the extraordinary case.
V.2 Green beam alone
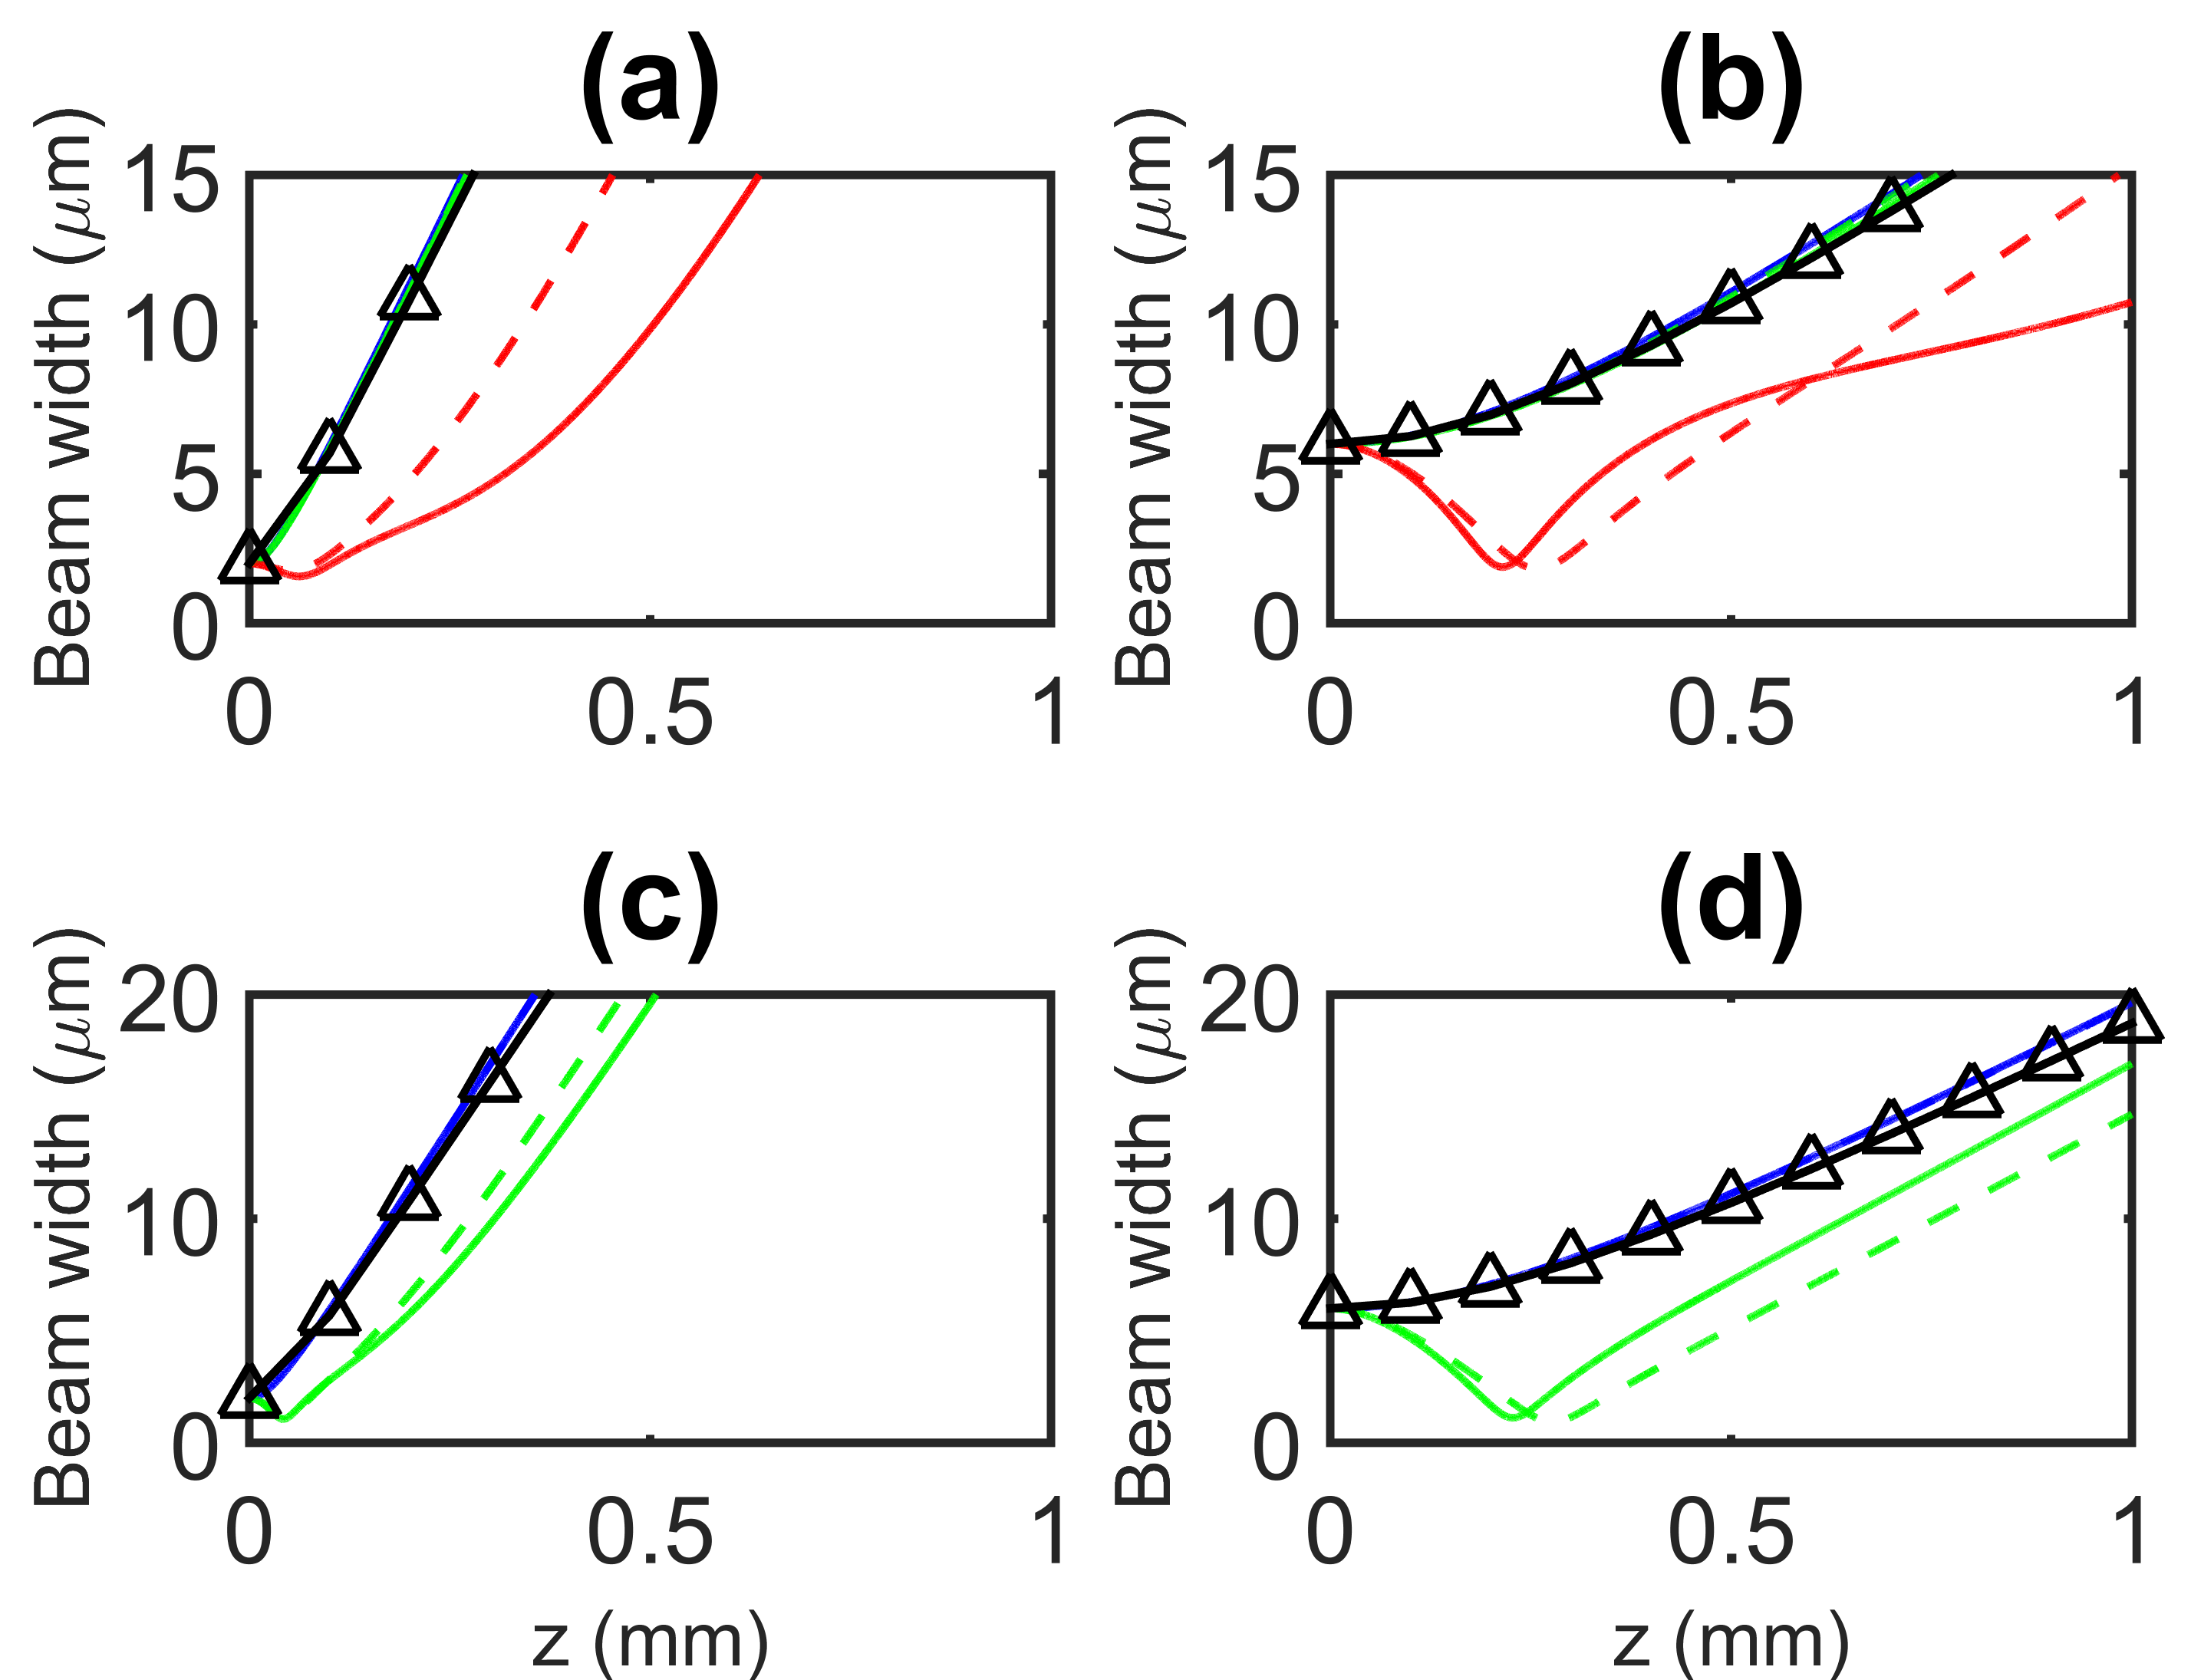
The behavior of the green beam, when the input polarization is ordinary, is plotted in Fig. 6. At low powers, small increases in beam divergence are observed owing to the defocusing sign of for K (see Fig. 10). At higher powers, the thermal nonlinearity becomes self-focusing. Due to the higher absorption in the green, self-lensing is stronger near the input interface with respect to the infrared case, but self-trapping fades away more rapidly due to larger losses. In fact, as the absorption increases (e.g., larger concentration of dopants), the minimum beam width gets smaller but, at the same time, the beam starts to freely diverge after shorter propagation distances . This effect is prominent for small input beam widths [see Fig. 6(a,c)]. For wider input beams, self-trapping is more prone to occur and survives on larger distances from the input interface as well [Fig. 6(b,d)].
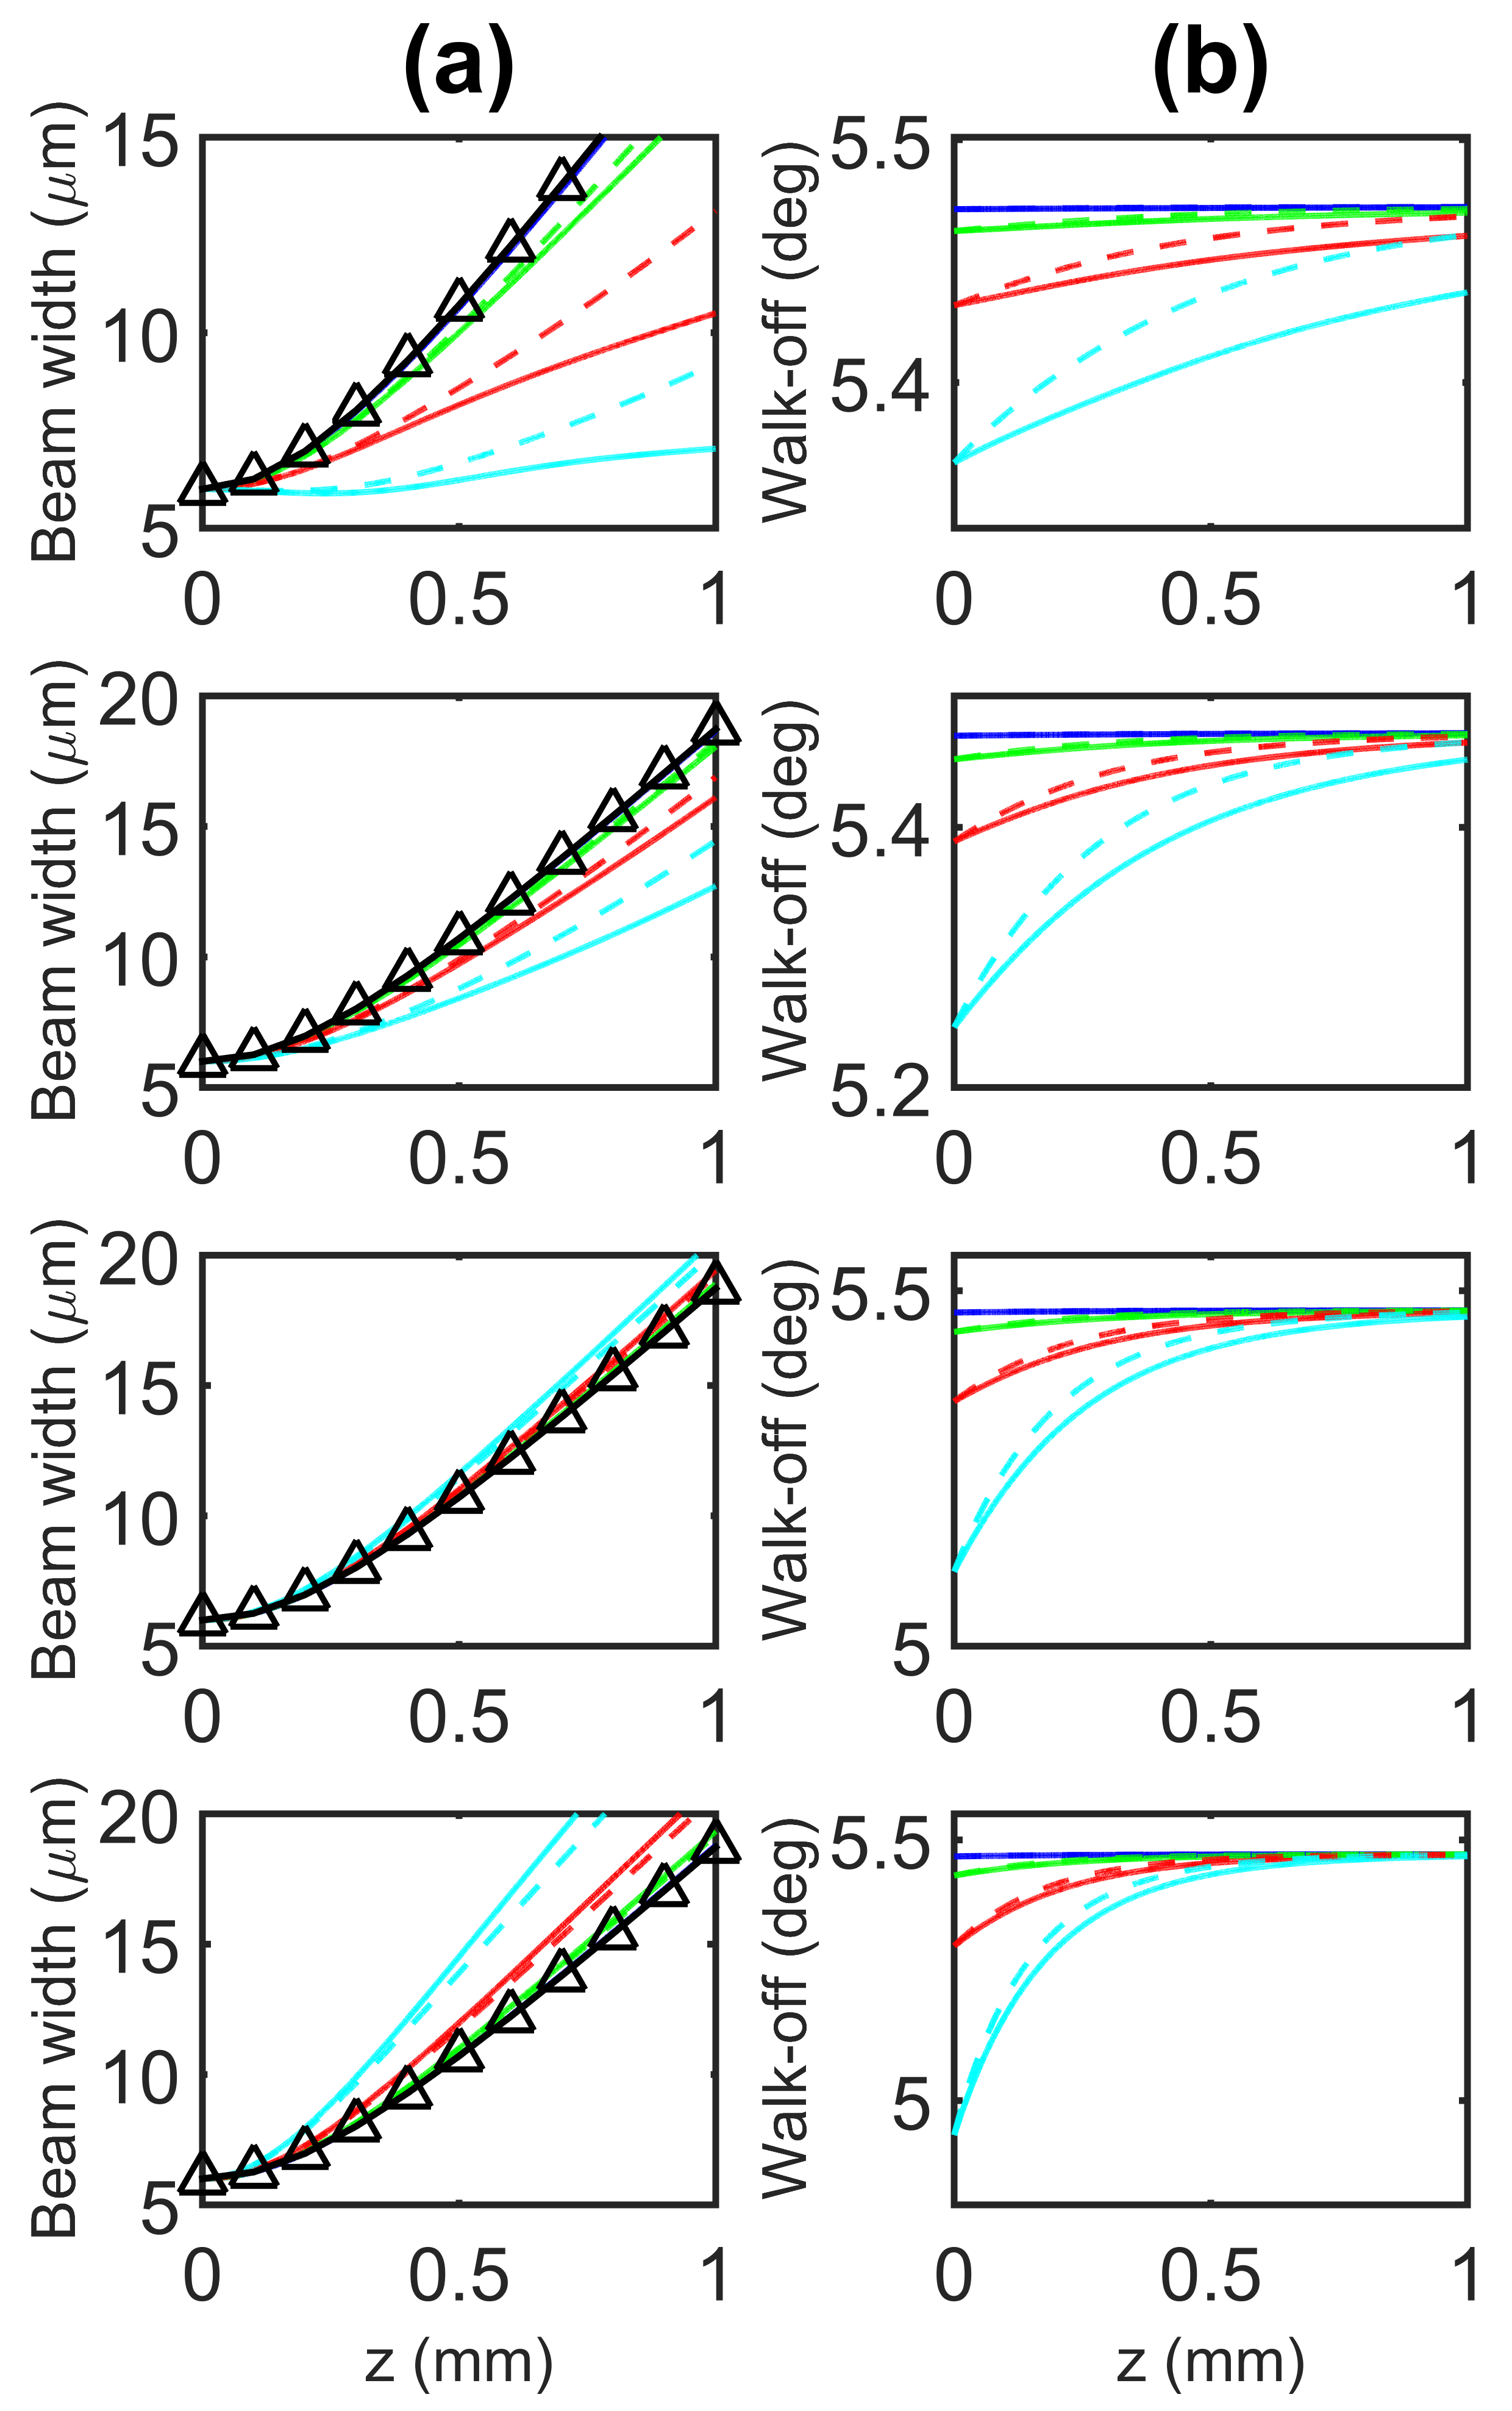
The propagation of the extraordinary green beam is more involved than in the infrared case: due to the large absorption, thermal and reorientational nonlinearities are comparable, and both have to be accounted for simultaneously. Figure 7(a) plots beam width versus for an input width of 2 m and four absorption coefficients . For small absorption, reorientation is dominant and an overall focusing takes place. Between m-1 and m-1, the thermal response overcomes the reorientational nonlinearity, yielding a monotonic increase in beam divergence versus input power as compared to the linear case, i.e., self-defocusing in agreement with Fig. 3. Due to the large increase in temperature, an extraordinary beam is also able to change its own trajectory: the light-induced temperature increments yield a power-dependent change in walk-off via Eqs. (1-2). In particular, for walk-off decreases with power: the wave-fronts remain unperturbed (the average wave vector remains normal to ) but the Poynting vector changes direction. Fig. 7(b) shows the computed walk-off angle versus . For , the walk-off tends to , i.e., the beam direction with respect to corresponds to the linear case. Power-driven variations in walk-off mimic the trend of the maximum temperature , with an exponential decay along with slope given by the overall losses .
VI Co-propagation of a weak probe and an intense IR beam
In this section we will investigate experimentally the light propagation when the impinging wavelength is outside the dye absorption band: in our case nm. We launched a linear polarization exciting either ordinary (-polarized) or extraordinary (-polarized) waves.
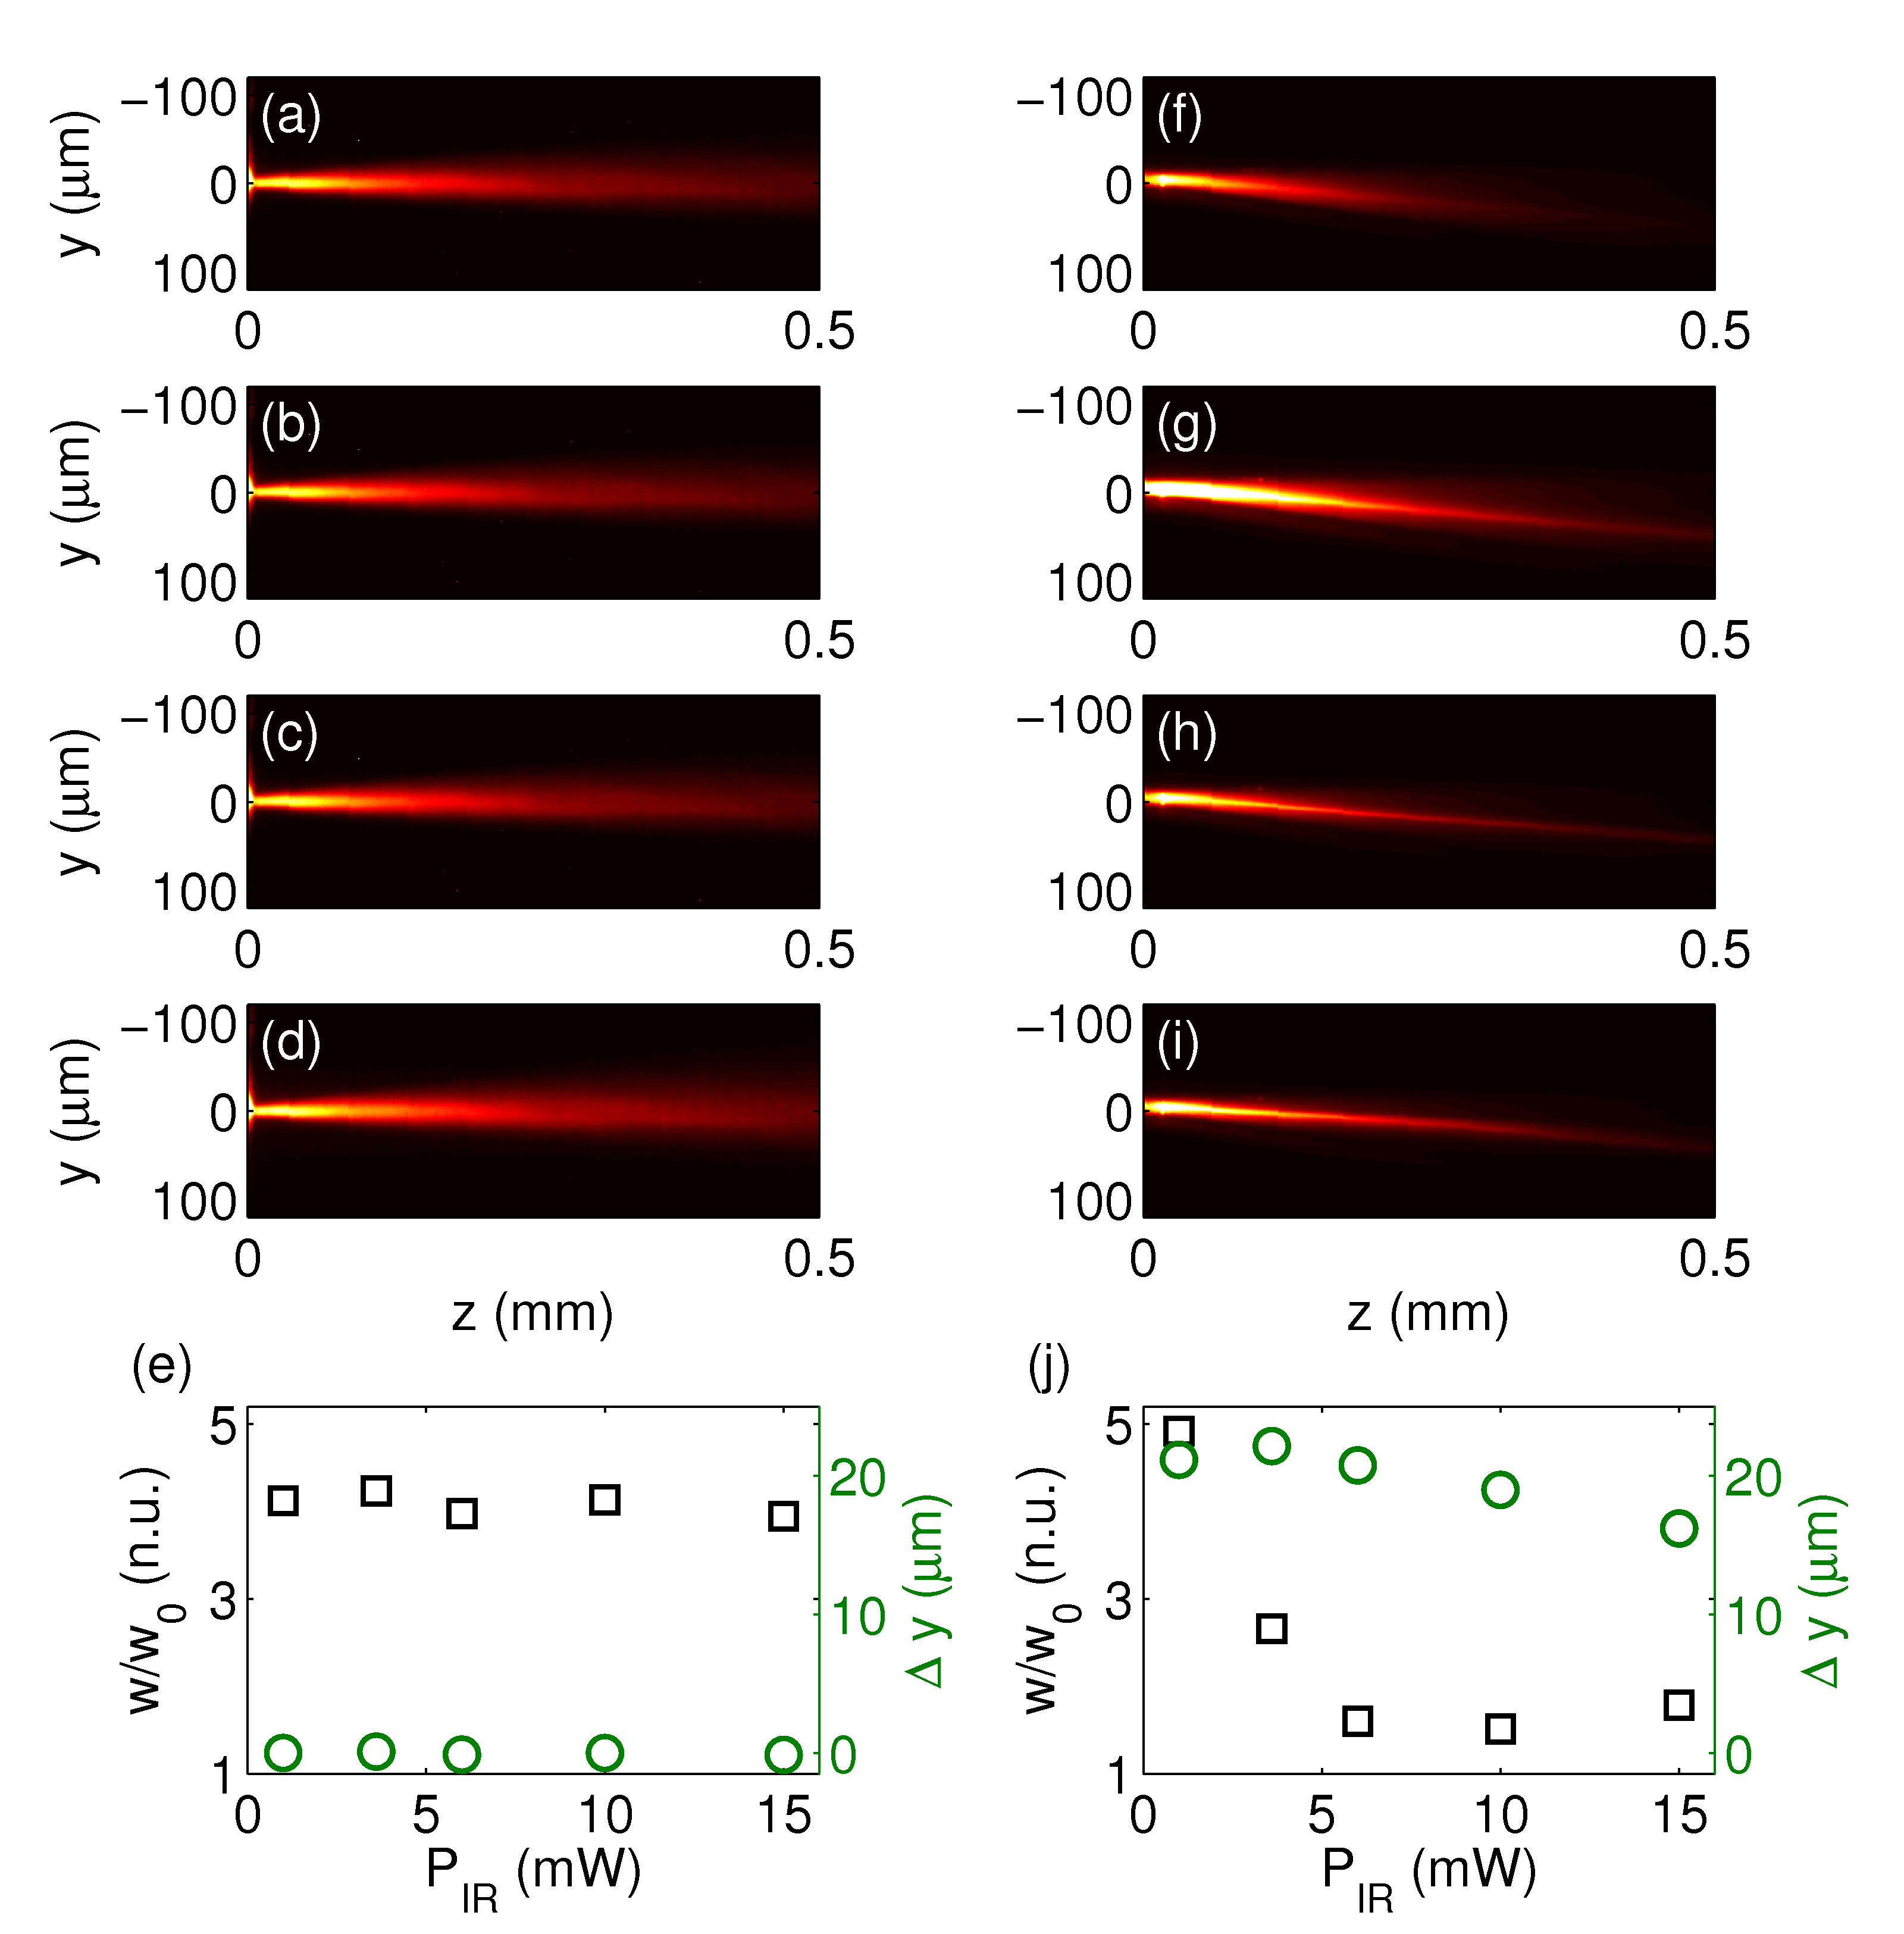
Figure 8 illustrates the propagation of a weak probe (green) beam at W, unable to excite either the reorientational nonlinearity or appreciable thermal effects, co-polarized and co-launched with an intense IR beam. The IR beam impinges normally to the sample, both for extraordinary and ordinary polarizations; the probe is launched so that its path in the NLC overlaps with the IR. Thus, the green beam wave vector in the extraordinary polarization is tilted so that the two waves share the same Poynting vector direction, regardless of dispersion and walk-off (Fig. 10).
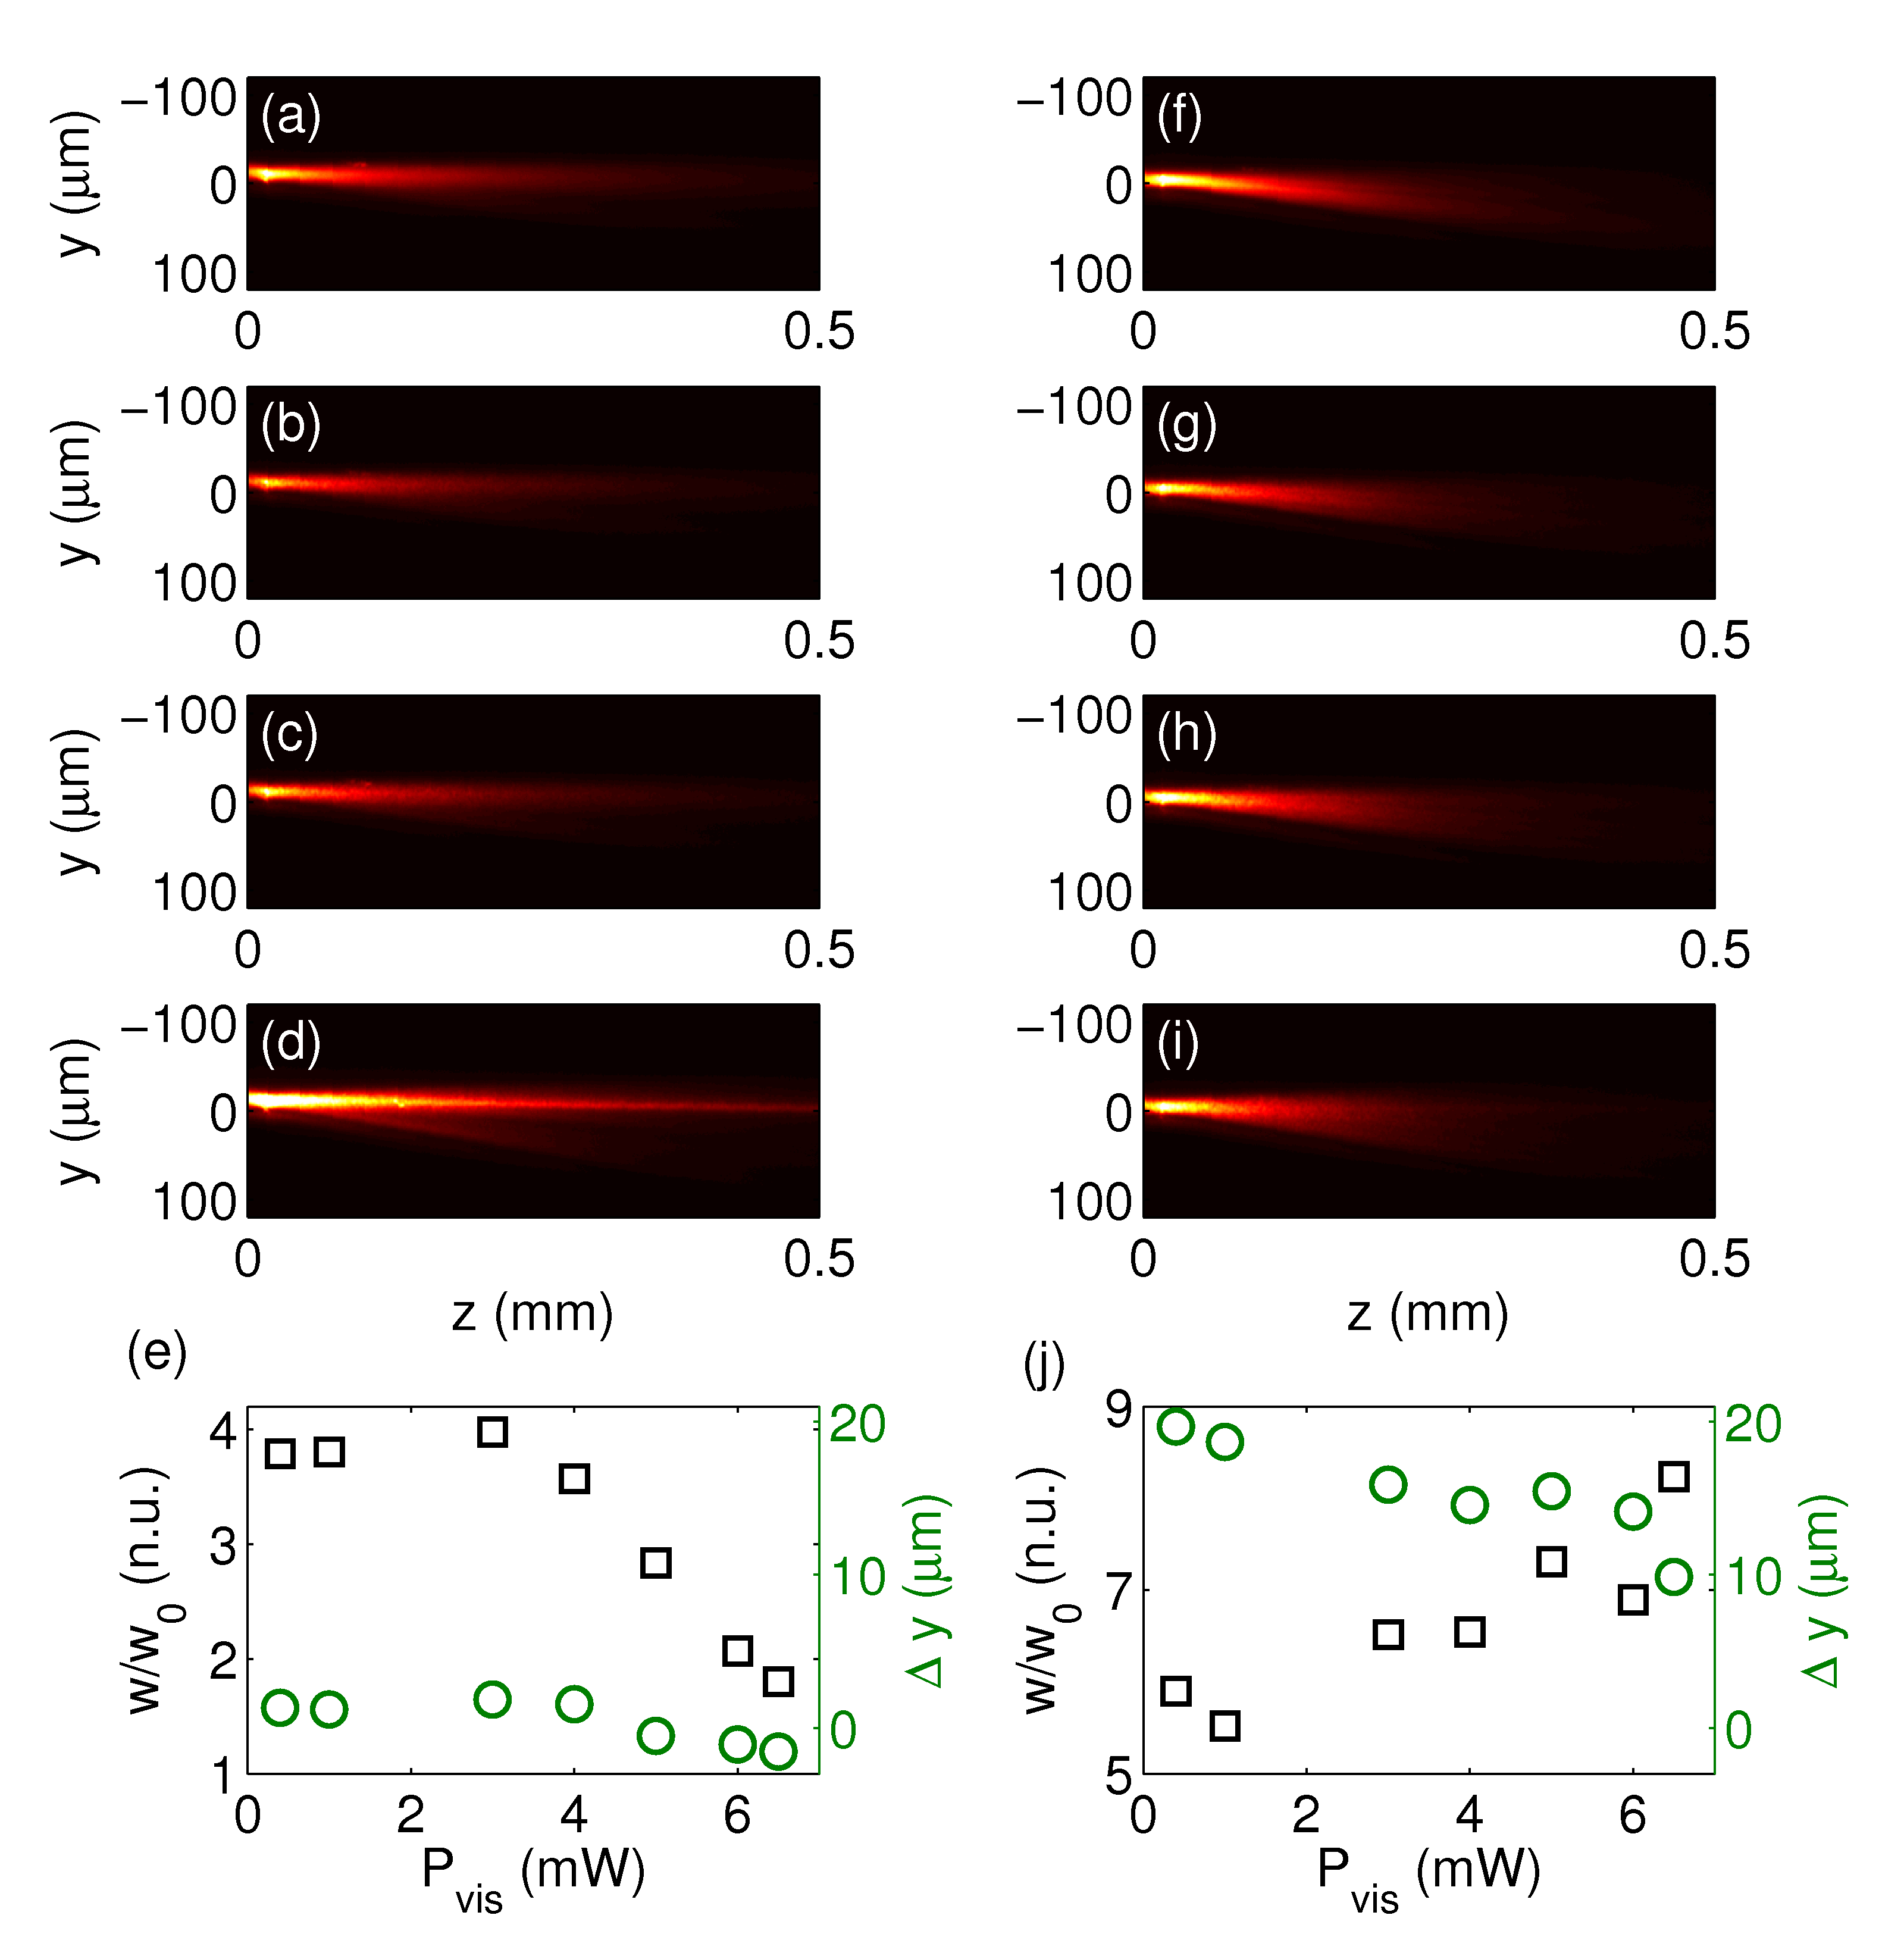
Let us start with the ordinary polarization. The beam evolution for various IR beam powers is plotted in Fig. 8(a-d). Fig. 8(e) shows the normalized beam width and the beam shift with respect to the input section versus the input IR power, measured at a distance mm from the input interface. No appreciable variations are observed, neither in beam size nor in trajectory. Regarding the latter, no changes are expected as the walk-off is zero for this polarization. With reference to the beam size, Fig. 4 predicts a minimum soliton width of about m around mW; due to the fact that the input waist is about m, the ordinary wave is negligibly affected by thermal self-focusing. Such behavior is also confirmed by the calculated width in Fig. 5(c) in the presence of scattering losses (dashed lines), where even for mW the beam undergoes spreading at mm. Furthermore, the Fréedericksz transition, estimated at powers just below 20 mW (Fig. 4), is not observed up to mW, when detrimental effects from heating (like formation of isotropic bubbles related to the isotropic-nematic transition in NLC regions) take place. Such discrepancy between theory and experiments can be attributed to inhomogeneities in director distribution at the cell entrance, possibly through the formation of a meniscus at the interface air-NLC. Such imperfections can affect reorientation more than the thermal flow.
The evolution of the extraordinary wave is shown in Fig. 8(f-i) at four powers. For the sake of a quantitative discussion, Fig. 8(j) graphs the normalized beam width and lateral shift in . The extraordinary polarized beam at low powers has its Poynting vector at a walk-off angle (the theory predicts at K). Small variations can be observed in the beam trajectories with increasing powers, as lower walk-off is associated to a slightly reduced anisotropy in regions with higher temperatures (see Fig. 10). The width of the probe versus shows appreciable changes for mW due to the waveguide induced by molecular reorientation.
The beam width at mm is about the same as at the input section when mW. This is in good agreement with Fig. 5(a), where the beam width reacquires the same value inside the NLC cell for powers between 3 and 5 mW. For higher powers, consistently with Fig. 5(a) the width measured in oscillates around the size of a shape-preserving soliton, between 1.5 m and 4 m for 5 mWmW according to the leftmost panel in Fig. 4.
VII Light propagation at wavelength within the absorption band of the dye
When the green probe propagates by itself in the cell, the observed behavior drastically changes, as predicted. Let us first analyze the evolution of the ordinary component, shown in Fig. 9(a-d) with quantitative features in Fig. 9(e). When the green power is above 3 mW, the beam experiences thermal self-focusing; for mW, the beam shrinks down to a size close to the initial value; further increases in power eventually lead to the nematic-isotropic transition. This agrees well with the theoretical results plotted in Fig. 6(a). Finally, the transverse position of the ordinary beam slightly depends on the input power, due to slight variations in wave vector near the NLC-air interface and probably to a meniscus (as speculated in the previous case above), with slightly asymmetric boundary conditions near the beam entrance.
Considering the extraordinary polarization, graphed in Fig. 9(f-j), a quasi-linear increase of beam width versus input power is observed [see Fig. 9(j)], associated with defocusing for mW. The lateral displacement at mW is twice smaller than in the linear regime (low powers). Such a deflection cannot be ascribed solely to thermally-induced changes in walk-off: as visible in Fig. 7, in fact, such gradual changes should be limited to about 0.5∘. These experimental results prove that the wave vector undergoes a nonlinear deflection as well, in analogy with what we previously described for green ordinary waves.
VIII Conclusions
We investigated the interplay between two competing optical nonlinearities in NLCs, the reorientational and the thermal one.
In the highly nonlocal limit and for small light-induced rotations of the director, the two effects share the same profile for the nonlinear perturbation. As a direct consequence, in the highly nonlocal regime the relative weight of the two responses does not depend on the the spatial profile of the input beam and it is spatially uniform across the NLC layer. We discussed the interplay between the two nonlinearities and its dependence on initial temperature and material absorption. In dye-doped NLCs, the latter can modulate the strength of the opto-thermal effects, usually negligible in undoped NLCs. We showed that there are two different regime for the interplay between the two nonlinearities: i) a direct competition on forming the overall nonlinear index well; ii) a modulation of the parameters determining the NLC response to light. With reference to the latter, we showed that light-induced changes in temperature significantly affect the formation of reorientational solitons even in the undoped case, including the existence of solitons in a limited power range and a non-monotonic soliton width versus power.
Our findings widen the perspective on the unique optical properties of NLCs, the latter being an ideal workbench for the study of nonlinear optics and the interaction between nonlinearities Maucher et al. (2016); Jung et al. (2017). Future developments include the simultaneous propagation of two beams at different wavelengths and with different profiles Laudyn et al. (2015). Generalizations to nonlinearities acting on distinct time scales can be envisaged as well when using pulsed sources Burgess et al. (2009). Our results, together with semi-analytic models accounting for self-lensing and its dynamics in propagation, show how nonlinear optics in extended samples is an important tool for the complete characterization of NLC mixtures.
Appendix
VIII.1 Linear optical parameters of the mixture 6CHBT
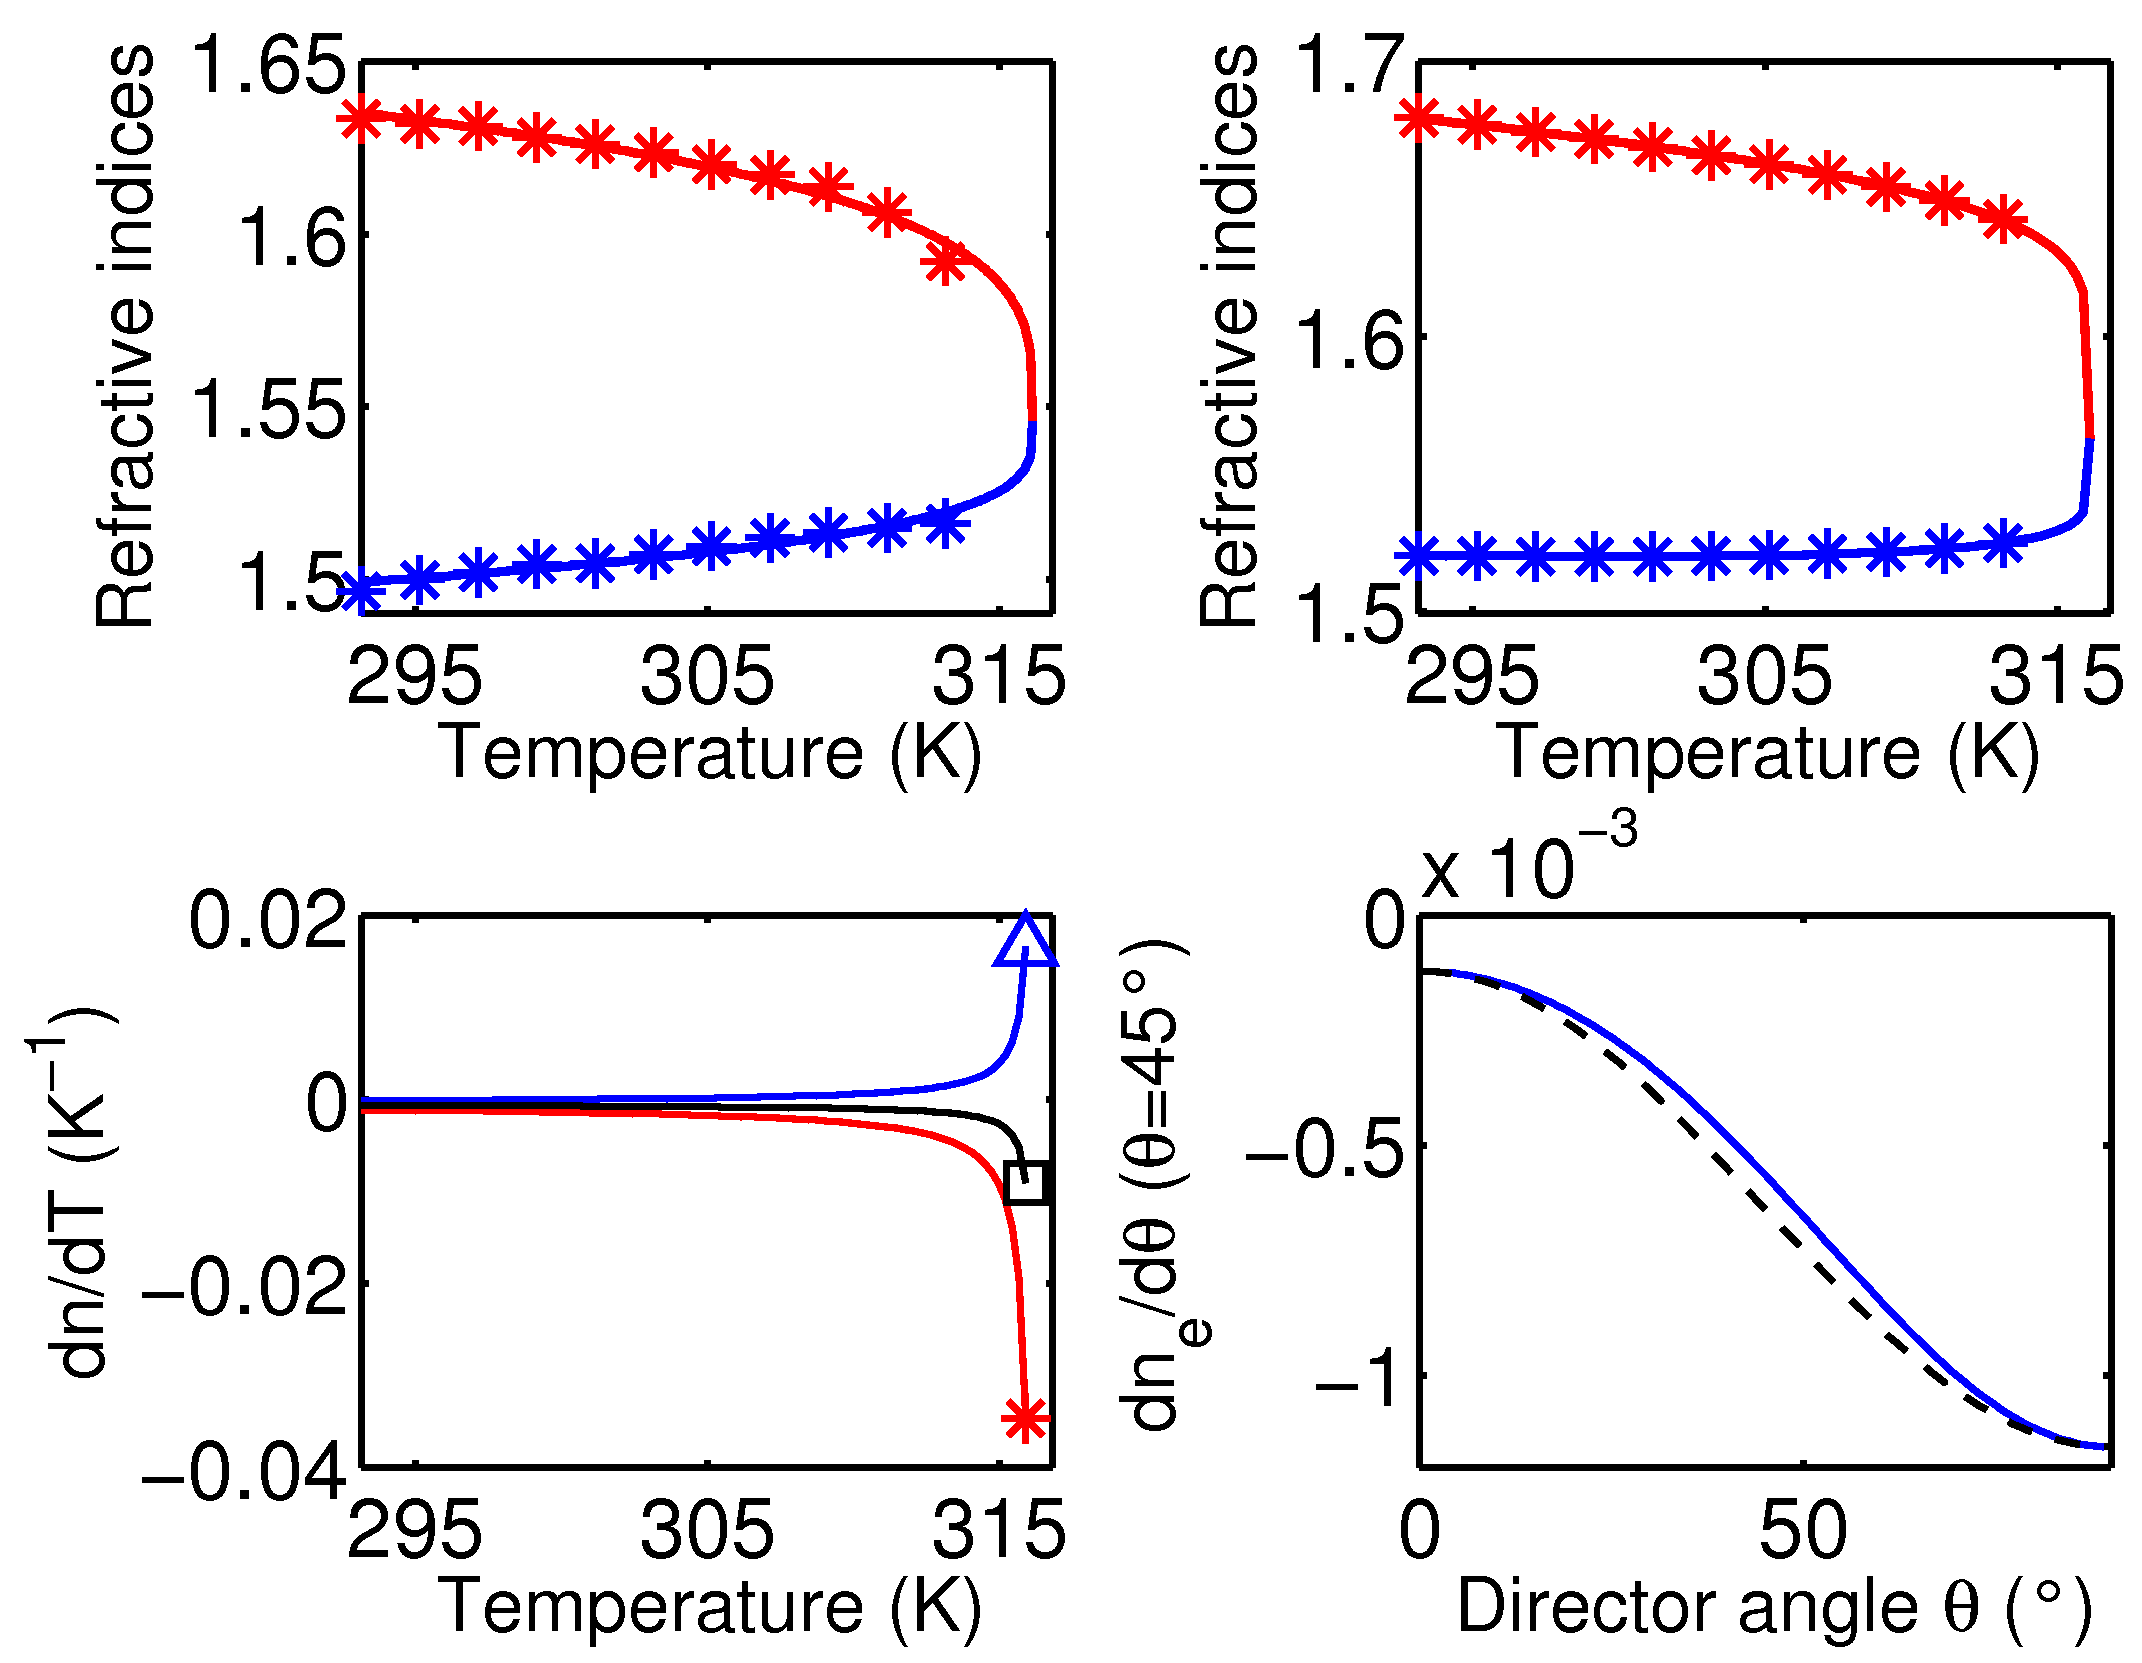
Figure 10 (a-b) shows the comparison between actual measurements and fitting curves given by Eqs. (1-2) for the two wavelengths we used in this work. A best-fit procedure provides , , and for nm, whereas we find , , and for nm. Having ascertained the quality of the fitting curves, the latter can be used to compute the derivative of and with respect to temperature, as shown in Fig. 10(c). Finally, Fig. 10 provides a direct comparison between the approximated formula (14) and the exact expression
| (19) |
VIII.2 Elastic properties of the mixture 6CHBT
When anisotropy of the elastic properties of the NLC is accounted for, the reorientation induced by an optical wavepacket invariant along is given by
| (20) |
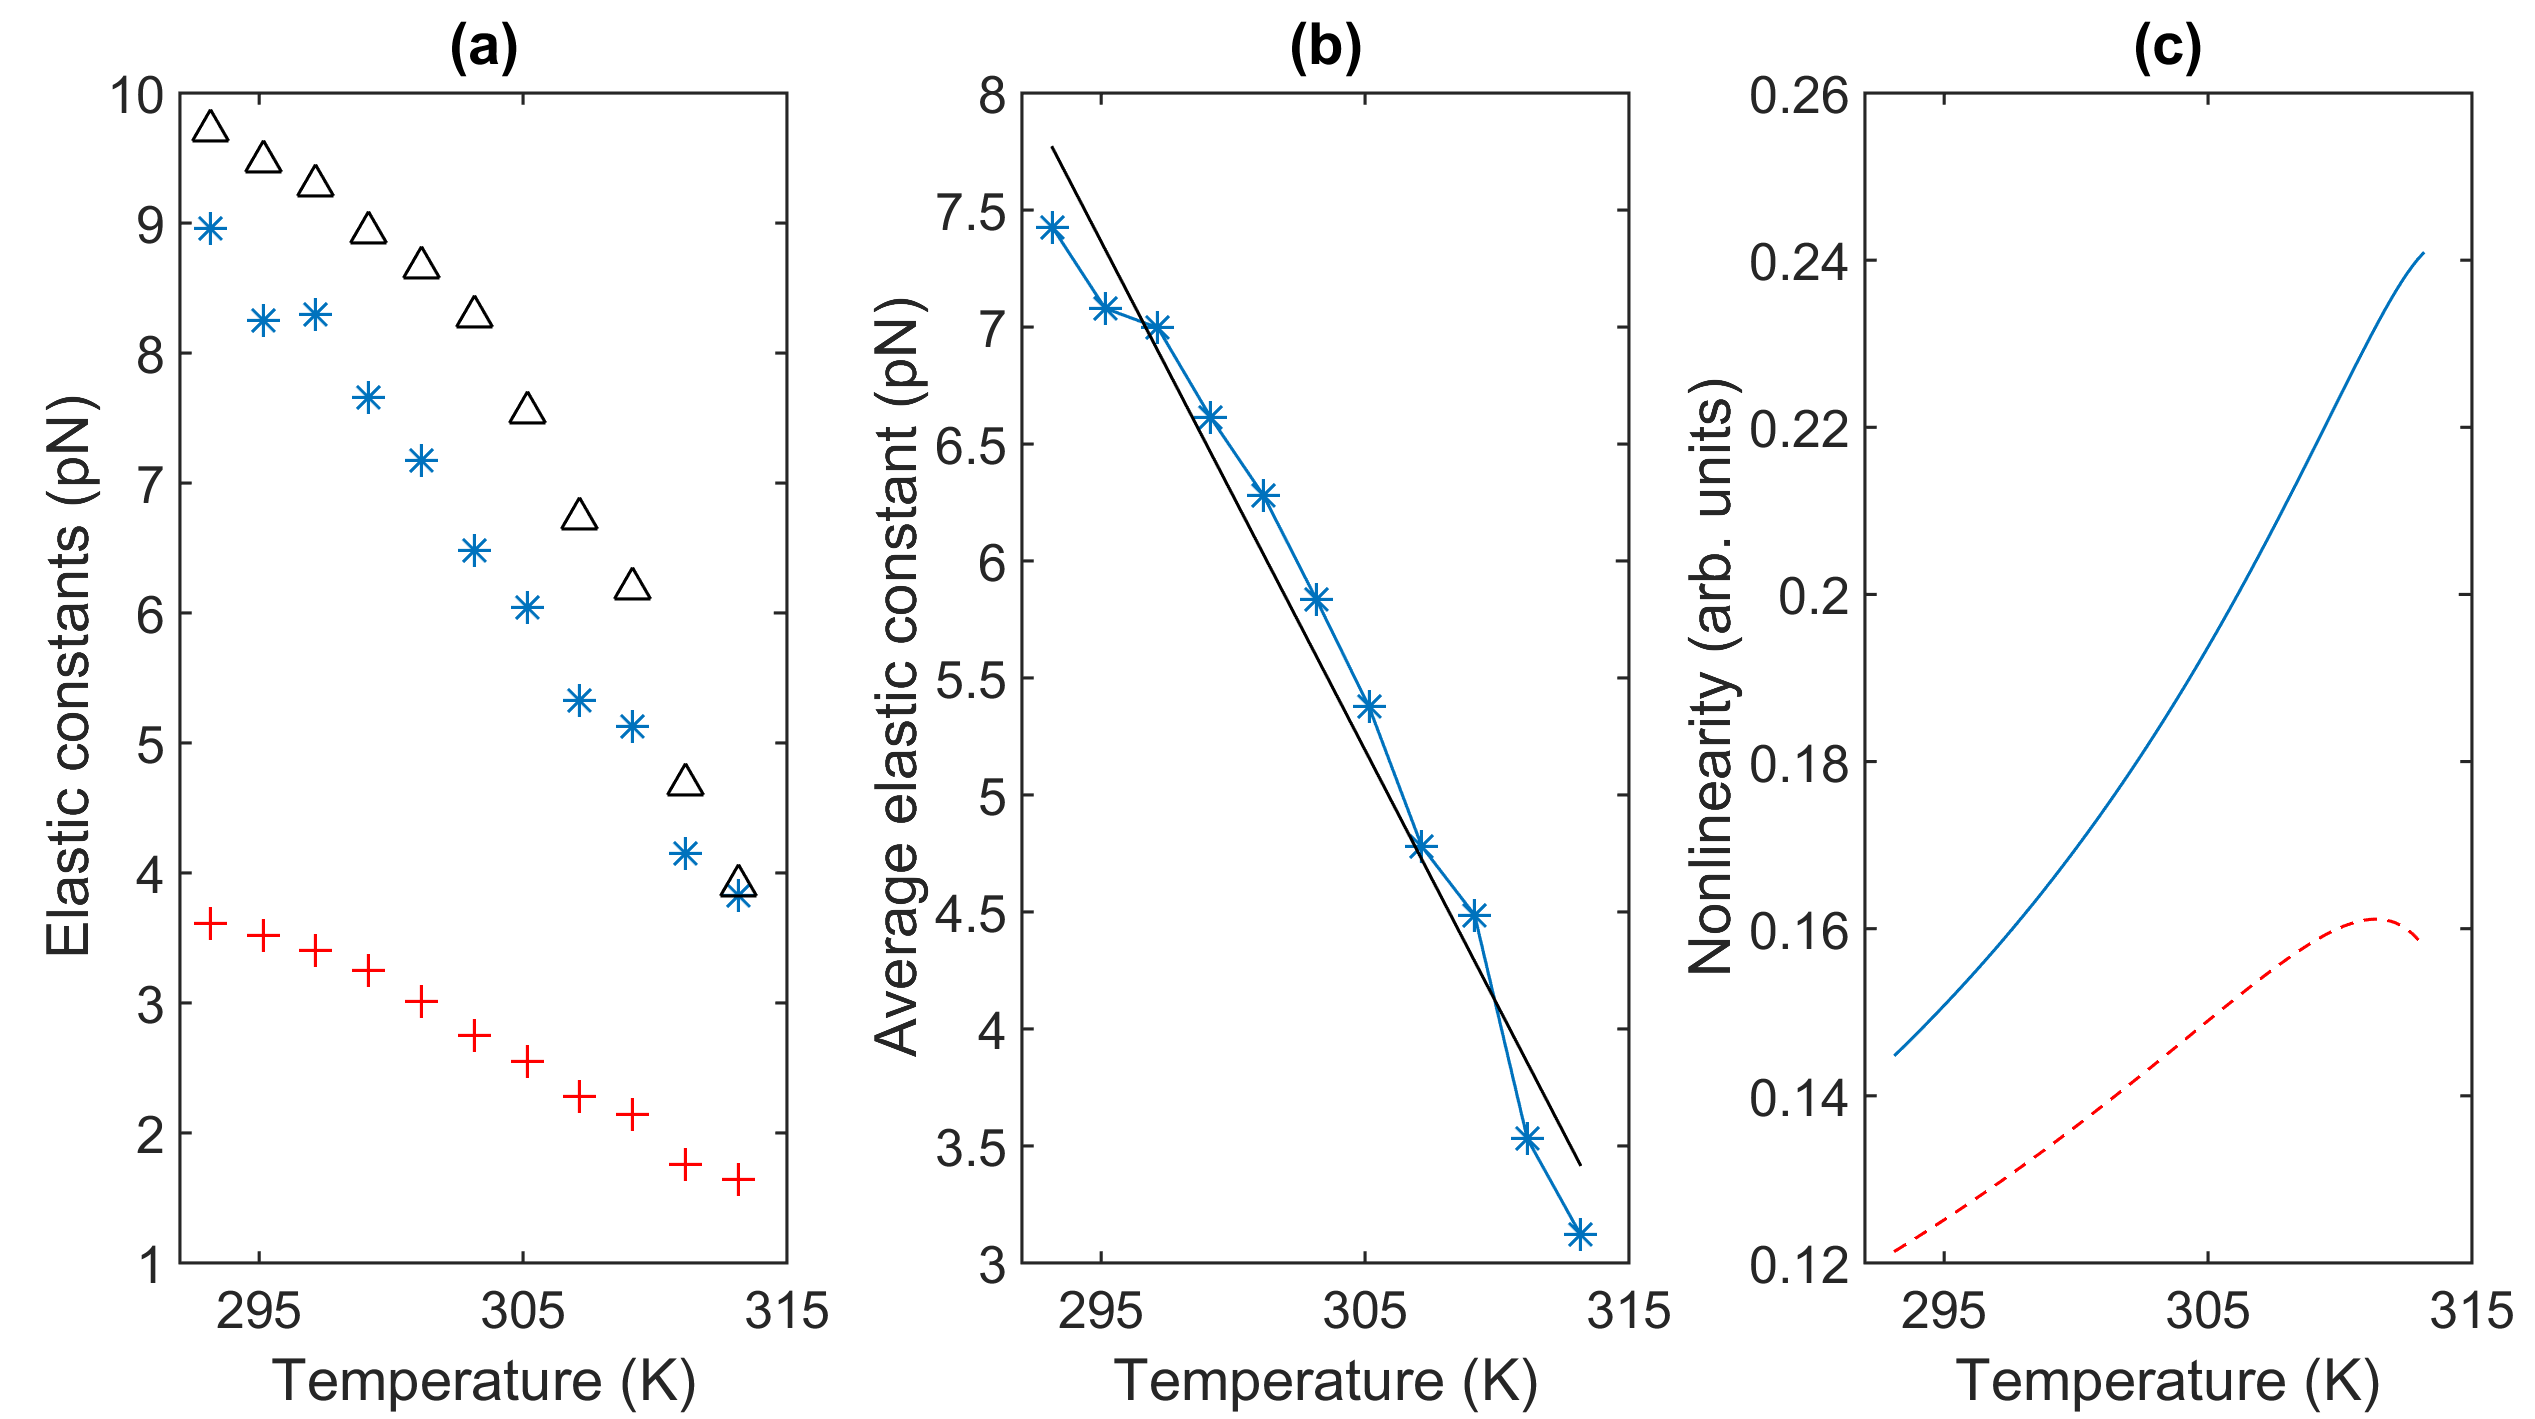
For small optical reorientations the term proportional to can be neglected. Thus, for an initial angle an effective elastic constant equal to the average of the three elastic constants can be assumed. The elastic constants for 6CHBT are plotted in Fig. 11(a), as measured by all-optical methods Klus et al. (2014). All three elastic constants decrease monotonically versus temperature. Fig. 11(b) shows the average Frank’s constant : for temperatures not too close to the transition , can be satisfactorily approximated by a linear polynomial with coefficients . Finally, Fig. 11(c) graphs the ratio of the optical anisotropy and the average elastic constant. All-optical reorientation is stronger at shorter wavelengths and increases with temperature up to C.
VIII.3 Width of solitons supported by a single nonlinearity
In the highly nonlocal approximation, fundamental solitons feature a Gaussian profile with waist determined by , where is the unperturbed refractive index and the vacuum wave number. From Eq. (10), the existence curve of a soliton in the perturbative regime and due to a reorientational nonlinearity alone is
| (21) |
whereas the thermal self-focusing provides an ordinary-wave soliton with
| (22) |
The soliton width versus power as predicted by Eqs. (21-22) is plotted in Fig. 12 for a fixed sample temperature. The interaction between the two nonlinearities is neglected, considering only the reorientational effect for the extraordinary wave, and the thermal effect for the ordinary wave. For the infrared beam, corresponding to m-1, the reorientational soliton is much narrower than the thermal one; the extraordinary self-trapped wave widens as the temperature approaches the transition value . The size of the ordinary-wave thermal soliton is comparable with the extraordinary-wave soliton (i.e., a few microns) when the sample is close to the nematic-isotropic transition. For the green component, owing to the large absorption, the roles are inverted. Green ordinary solitons can theoretically reach sub-wavelength size owing to the large absorption, and this effect becomes more marked as the temperature approaches the nematic-to-isotropic transition . In actual samples these waves are ruled out by the large losses associated with and by the fact that strong absorption destroys the nematic phase.
Acknowledgements
A.A. and G.A. thank the Academy of Finland for support through the Finland Distinguished Professor grant No. 282858. Funding from the National Science Centre of Poland under grant agreement DEC-2012/06/M/ST2/00479 is gratefully acknowledged.
References
- Kim et al. (2012) Young-Ki Kim, Bohdan Senyuk, and Oleg D. Lavrentovich, “Molecular reorientation of a nematic liquid crystal by thermal expansion,” Nat. Commun. 3, 1133 (2012).
- DeGennes and Prost (1993) P. G. DeGennes and J. Prost, The Physics of Liquid Crystals (Oxford Science, New York, 1993).
- Tsai et al. (2003) Ming-Shan Tsai, I-Min Jiang, Chi-Yen Huang, and Chia-Chi Shih, “Reorientational optical nonlinearity of nematic liquid-crystal cells near the nematic isotropic phase transition temperature,” Opt. Lett. 28, 2357–2359 (2003).
- Wu and Yang (2006) Shin-Tson Wu and Deng-Ke Yang, Fundamentals of liquid crystal devices (Wiley, New York, 2006).
- Maune et al. (2003) Brett Maune, Rhys Lawson, Cary Gunn, Axel Scherer, and Larry Dalton, “Electrically tunable ring resonators incorporating nematic liquid crystals as cladding layers,” Appl. Phys. Lett. 83, 4689–4691 (2003).
- Moreira et al. (2004) M. F. Moreira, I. C. S. Carvalho, W. Cao, C. Bailey, B. Taheri, and P. Palffy-Muhoray, “Cholesteric liquid-crystals laser as an optic fiber-based temperature sensor,” App. Phys. Lett. 85, 2691 (2004).
- Coles and Morris (2010) Harry Coles and Stephen Morris, “Liquid-crystal lasers,” Nat. Photon. 4, 676–685 (2010).
- Zhang et al. (2014) Zichen Zhang, Zheng You, and Daping Chu, “Fundamentals of phase-only liquid crystal on Silicon (lcos) devices,” Light: Science Applications 3, e213 (2014).
- Marrucci et al. (2006) L. Marrucci, C. Manzo, and D. Paparo, “Pancharatnam-Berry phase optical elements for wave front shaping in the visible domain: Switchable helical mode generation,” Appl. Phys. Lett. 88, 221102 (2006), http://dx.doi.org/10.1063/1.2207993.
- Tabiryan and Zeldovich (1980) N.V. Tabiryan and B.Y. Zeldovich, “The orientational optical nonlinearity of liquid-crystals,” Mol. Cryst. Liq. Cryst. 62, 237–250 (1980).
- Khoo (1995) I. C. Khoo, Liquid Crystals: Physical Properties and Nonlinear Optical Phenomena (Wiley, New York, 1995).
- Wong and Shen (1973) George K. L. Wong and Y. R. Shen, “Optical-field-induced ordering in the isotropic phase of a nematic liquid crystal,” Phys. Rev. Lett. 30, 895 (1973).
- Durbin et al. (1981) S. D. Durbin, S. M. Arakelian, and Y. R. Shen, “Optical-field-induced birefringence and Freedericksz transition in a nematic liquid crystal,” Phys. Rev. Lett. 47, 1411–1414 (1981).
- Peccianti et al. (2010) M. Peccianti, A. Pasquazi, G. Assanto, and R. Morandotti, “Enhancement of third-harmonic generation in nonlocal spatial solitons,” Opt. Lett. 35, 3342–3344 (2010).
- Piccardi et al. (2011) A. Piccardi, A. Alberucci, N. Tabiryan, and G. Assanto, “Dark nematicons,” Opt. Lett. 36, 1356–1358 (2011).
- Warenghem et al. (2008) M. Warenghem, J.F. Blach, and J. F. Henninot, “Thermo-nematicon: an unnatural coexistence of solitons in liquid crystals?” J. Opt. Soc. Am. B 25, 1882–1887 (2008).
- Burgess et al. (2009) Ian B. Burgess, Marco Peccianti, Gaetano Assanto, and Roberto Morandotti, “Accessible light bullets via synergetic nonlinearities,” Phys. Rev. Lett. 102, 203903 (2009).
- Laudyn et al. (2015) Urszula A. Laudyn, Michał Kwasny, Armando Piccardi, Mirosław A. Karpierz, Roman Dabrowski, Olga Chojnowska, Alessandro Alberucci, and Gaetano Assanto, “Nonlinear competition in nematicon propagation,” Opt. Lett. 40, 5235–5238 (2015).
- Jánossy and Kósa (1992) I. Jánossy and T. Kósa, “Influence of Anthraquinone dyes on optical reorientation of nematic liquid crystals,” Opt. Lett. 17, 1183–1185 (1992).
- Muenster et al. (1997) R. Muenster, M. Jarasch, X. Zhuang, and Y. R. Shen, “Dye-induced enhancement of optical nonlinearity in liquids and liquid crystals,” Phys. Rev. Lett. 78, 42–45 (1997).
- Ferjani et al. (2006) S. Ferjani, V. Barna, A. De Luca, C. Versace, N. Scaramuzza, R. Bartolino, and G. Strangi, “Thermal behavior of random lasing in dye-doped nematic liquid crystals,” Appl. Phys. Lett. 89, 121109 (2006).
- Marte (1994) Monika A. M. Marte, “Competing nonlinearities,” Phys. Rev. A 49, R3166–R3169 (1994).
- Maucher et al. (2016) F. Maucher, T. Pohl, S. Skupin, and W. Krolikowski, “Self-organization of light in optical media with competing nonlinearities,” Phys. Rev. Lett. 116, 163902 (2016).
- Lawrence et al. (1994) B.L. Lawrence, M. Cha, J.U. Kang, G. Stegeman, G. Baker, J. Meth, and S. Etemad, “Large purely refractive nonlinear index of single crystal p-toluene sulphonate (pts) at 1600 nm,” Electronics Letters 30, 447–448 (1994).
- Wright et al. (1995) Ewan M. Wright, Brian L. Lawrence, William Torruellas, and George Stegeman, “Stable self-trapping and ring formation in polydiacetylene para-toluene sulfonate,” Opt. Lett. 20, 2481–2483 (1995).
- Shim et al. (2012) Bonggu Shim, Samuel E. Schrauth, Alexander L. Gaeta, Moran Klein, and Gadi Fibich, “Loss of phase of collapsing beams,” Phys. Rev. Lett. 108, 043902 (2012).
- Buryak et al. (1995) Alexander V. Buryak, Stefano Trillo, and Yuri S. Kivshar, “Optical solitons supported by competing nonlinearities,” Opt. Lett. 20, 1961–1963 (1995).
- Quiroga-Teixeiro and Michinel (1997) M. Quiroga-Teixeiro and H. Michinel, “Stable azimuthal stationary state in quintic nonlinear optical media,” J. Opt. Soc. Am. B 14, 2004–2009 (1997).
- Mihalache et al. (2006a) D. Mihalache, D. Mazilu, F. Lederer, L.-C. Crasovan, Y. V. Kartashov, L. Torner, and B. A. Malomed, “Stable solitons of even and odd parities supported by competing nonlocal nonlinearities,” Phys. Rev. E 74, 066614 (2006a).
- Falcão Filho et al. (2013) Edilson L. Falcão Filho, Cid B. de Araújo, Georges Boudebs, Hervé Leblond, and Vladimir Skarka, “Robust two-dimensional spatial solitons in liquid Carbon Disulfide,” Phys. Rev. Lett. 110, 013901 (2013).
- Silberberg (1990) Yaron Silberberg, “Collapse of optical pulses,” Opt. Lett. 15, 1282–1284 (1990).
- Mihalache et al. (2006b) D. Mihalache, D. Mazilu, B. A. Malomed, F. Lederer, L.-C. Crasovan, Y. V. Kartashov, and L. Torner, “Stable three-dimensional optical solitons supported by competing quadratic and self-focusing cubic nonlinearities,” Phys. Rev. E 74, 047601 (2006b).
- Snyder and Mitchell (1997) A. W. Snyder and D. J. Mitchell, “Accessible solitons,” Science 276, 1538 (1997).
- Conti et al. (2003) C. Conti, M. Peccianti, and G. Assanto, “Route to nonlocality and observation of accessible solitons,” Phys. Rev. Lett. 91, 073901 (2003).
- Rotschild et al. (2005) C. Rotschild, O. Cohen, O. Manela, M. Segev, and T. Carmon, “Solitons in nonlinear media with an infinite range of nonlocality: first observation of coherent elliptic solitons and of vortex-ring solitons,” Phys. Rev. Lett. 95, 213904 (2005).
- Simoni (1997) F. Simoni, Nonlinear Optical Properties of Liquid Crystals (World Scientific, Singapore, 1997).
- Li and Wu (2004) Jun Li and Shin-Tson Wu, “Extended Cauchy equations for the refractive indices of liquid crystals,” J. Appl. Phys. 95, 896–901 (2004).
- Derrien et al. (2000) F. Derrien, J. F. Henninot, M. Warenghem, and G. Abbate, “A thermal (2d+1) spatial optical soliton in a dye doped liquid crystal,” J. Opt. A: Pure Appl. Opt. 2, 332 (2000).
- Hutsebaut et al. (2004) X. Hutsebaut, C. Cambournac, M. Haelterman, A. Adamski, and K. Neyts, “Single-component higher-order mode solitons in liquid crystals,” Optics Communications 233, 211–217 (2004).
- Alberucci et al. (2010) A. Alberucci, A. Piccardi, M. Peccianti, M. Kaczmarek, and G. Assanto, “Propagation of spatial optical solitons in a dielectric with adjustable nonlinearity,” Phys. Rev. A 82, 023806 (2010).
- Braun et al. (1993) Erez Braun, Luc P. Faucheux, and Albert Libchaber, “Strong self-focusing in nematic liquid crystals,” Phys. Rev. A 48, 611–622 (1993).
- Warenghem et al. (1998) M. Warenghem, J. F. Henninot, and G. Abbate, “Non linearly induced self waveguiding structure in dye doped nematic liquid crystals confined in capillaries,” Opt. Express 2, 483–490 (1998).
- Durbin et al. (1983) S. D. Durbin, S. M. Arakelian, M. M. Cheung, and Y. R. Shen, “Highly nonlinear optical effects in liquid crystals,” Journal de Physique 44, 161–169 (1983).
- Zeldovich et al. (1980) B.Y. Zeldovich, N.F. Pilipetskii, A.V. Sukhov, and N.V. Tabiryan, “Giant optical nonlinearity in the mesophase of a nematic liquid crystals (ncl),” JETP Letters 31, 263–269 (1980).
- Peccianti and Assanto (2012) Marco Peccianti and Gaetano Assanto, “Nematicons,” Phys. Rep. 516, 147 – 208 (2012).
- Peccianti et al. (2004) M. Peccianti, C. Conti, G. Assanto, A. De Luca, and C. Umeton, “Routing of anisotropic spatial solitons and modulational instability in nematic liquid crystals,” Nature 432, 733 (2004).
- Beeckman et al. (2006) J Beeckman, K Neyts, and M Haelterman, “Patterned electrode steering of nematicons,” Journal of Optics A: Pure and Applied Optics 8, 214 (2006).
- Piccardi et al. (2008) A. Piccardi, G. Assanto, L. Lucchetti, and F. Simoni, “All-optical steering of soliton waveguides in dye-doped liquid crystals,” Appl. Phys. Lett. 93, 171104 (2008).
- Izdebskaya et al. (2010) Yana V. Izdebskaya, Vladlen G. Shvedov, Anton S. Desyatnikov, Wieslaw Krolikowski, and Yuri S. Kivshar, “Soliton bending and routing induced by interaction with curved surfaces in nematic liquid crystals,” Opt. Lett. 35, 1692–1694 (2010).
- Assanto (2012) G. Assanto, Nematicons: Spatial Optical Solitons in Nematic Liquid Crystals (Wiley, 2012).
- Laudyn and Karpierz (2013) Urszula A. Laudyn and Miroslaw A. Karpierz, “Nematicons deflection through interaction with disclination lines in chiral nematic liquid crystals,” Appl. Phys. Lett. 103, 221104 (2013), http://dx.doi.org/10.1063/1.4832478.
- Piccardi et al. (2014) Armando Piccardi, Alessandro Alberucci, Nina Kravets, Oleksandr Buchnev, and Gaetano Assanto, “Power-controlled transition from standard to negative refraction in reorientational soft matter,” Nat. Commun. 5, 5533 (2014).
- Izdebskaya (2014) Yana V. Izdebskaya, “Routing of spatial solitons by interaction with rod microelectrodes,” Opt. Lett. 39, 1681–1684 (2014).
- Izdebskaya et al. (2017) Y. Izdebskaya, V. Shvedov, G. Assanto, and W. Krolikowski, “Magnetic routing of light-induced waveguides,” Nat. Comm. 8, 14452 (2017).
- Bang et al. (2002) O. Bang, W. Krolikowski, J. Wyller, and J. J. Rasmussen, “Collapse arrest and soliton stabilization in nonlocal nonlinear media,” Phys. Rev. E 66, 046619 (2002).
- Conti et al. (2004) C. Conti, M. Peccianti, and G. Assanto, “Observation of optical spatial solitons in a highly nonlocal medium,” Phys. Rev. Lett. 92, 113902 (2004).
- Alberucci et al. (2015) Alessandro Alberucci, Chandroth P. Jisha, Noel F. Smyth, and Gaetano Assanto, “Spatial optical solitons in highly nonlocal media,” Phys. Rev. A 91, 013841 (2015).
- Alberucci et al. (2016) Alessandro Alberucci, Chandroth Pannian Jisha, and Gaetano Assanto, “Breather solitons in highly nonlocal media,” J. Opt. 18, 125501 (2016).
- Milanchian et al. (2012) K. Milanchian, E. Abdi, H. Tajalli, S. Ahmadi K., and M.S. Zakerhamidi, “Nonlinear refractive index of some Anthraquinone dyes in 1294-1b liquid crystal,” Opt. Commun. 285, 761 – 765 (2012).
- Beeckman et al. (2005) Jeroen Beeckman, Kristiaan Neyts, Xavier Hutsebaut, Cyril Cambournac, and Marc Haelterman, “Time dependence of soliton formation in planar cells of nematic liquid crystals,” IEEE J. Quantum Electron. 41, 735–740 (2005).
- Alberucci and Assanto (2007) Alessandro Alberucci and Gaetano Assanto, “Propagation of optical spatial solitons in finite-size media: interplay between nonlocality and boundary conditions,” J. Opt. Soc. Am. B 24, 2314–2320 (2007).
- Note (1) In actual cases this is valid, at least to first approximation: the temperature is assumed equal to at the edges of the sample, whereas the optical reorientation vanishes at the interfaces under strong anchoring conditions.
- Ouyang et al. (2006) Shigen Ouyang, Qi Guo, and Wei Hu, “Perturbative analysis of generally nonlocal spatial optical solitons,” Phys. Rev. E 74, 036622 (2006).
- Alberucci et al. (2014a) Alessandro Alberucci, Chandroth P. Jisha, and Gaetano Assanto, “Accessible solitons in diffusive media,” Opt. Lett. 39, 4317–4320 (2014a).
- Alberucci et al. (2014b) Alessandro Alberucci, Armando Piccardi, Nina Kravets, and Gaetano Assanto, “Beam hysteresis via reorientational self-focusing,” Opt. Lett. 39, 5830–5833 (2014b).
- Note (2) In general, optical reorientation also modulates the thermal properties. We neglect this correction consistently with the background orientation , as remains small with respect to .
- Karimi et al. (2016) Nazanin Karimi, Alessandro Alberucci, Oleksandr Buchnev, Matti Virkki, Martti Kauranen, and Gaetano Assanto, “Phase-front curvature effects on nematicon generation,” J. Opt. Soc. Am. B 33, 903–909 (2016).
- Jung et al. (2017) Pawel S. Jung, Wieslaw Krolikowski, Urszula A. Laudyn, Marek Trippenbach, and Miroslaw A. Karpierz, “Supermode spatial optical solitons in liquid crystals with competing nonlinearities,” Phys. Rev. A 95, 023820 (2017).
- Klus et al. (2014) Bartlomiej Klus, Urszula A. Laudyn, Miroslaw A. Karpierz, and Bouchta Sahraoui, “All-optical measurement of elastic constants in nematic liquid crystals,” Opt. Express 22, 30257–30266 (2014).