On-chip phononic time lens
Abstract
The ability to manipulate phonon waveforms in continuous media has attracted significant research interest and is crucial for practical applications ranging from biological imaging to material characterization. Although several spatial focusing techniques have been developed, these systems require sophisticated artificial structures, which limit their practical applications. This is because the spatial control of acoustic phonon waves is not as straightforward as photonics so there is a strong demand for an alternative approach. Here we demonstrate a phononic time lens in a dispersive one-dimensional phononic crystal waveguide, which enables the temporal control of phonon wave propagation. Pulse focusing is realized at a desired time and position with chirped input pulses that agree perfectly with the theoretical prediction. This technique can be applied to arbitrary systems and will offer both an improvement in time and spatial sensing resolution and allow the creation of a highly intense strain field, enabling the investigation of novel nonlinear phononic phenomena such as phononic solitons and rogue waves.
Acoustic phonons have been widely utilized in various applications and are especially important as a tool for nonintrusive sensing in such areas as biological imaging and defence systemsBuckingham_Imaging_1992 ; Monstafa_Ultrasound_1998 ; Kushibiki_Material_1985 ; 796320 . The capabilities of these phonon systems, for example imaging resolution and accuracy, are determined by the spatial size and energy density of generated waves. To improve these capabilities, several spatial phonon focusing techniques have been proposed where engineered structures such as the phased arrays, negative-index materials and acoustic metamaterials enable acoustic phonons to be focused in tiny spatial regionsPhysRevLett.93.024301 ; Spadoni_Generation_2010 ; Chen_Enhanced_2014 . However, these conventional focusing techniques, which use a spatial lens, rely on sophisticated spatially designed structures, and this limits their practical use.
A time lens, which is a temporal analogue to a spatial lens, has been introduced in the field of optics Akhmanov_1968 ; Treacy_1969 ; foster2008silicon-chip-based ; Salem_2013 . According to space-time duality, which describes the mathematical equivalence between paraxial-beam diffraction and dispersive pulse broadening, the effect of dispersion in a medium is the key to realizing a time lens. Importantly, this temporal focusing method can be applied in an arbitrary dispersive material in which it imparts quadratic time-varying phase shift. On the basis of this concept, various useful ideas have been developed including temporal imaging, temporal magnification and real-time spectroscopy in optics Salem_Optical_2008 ; Bennett_Temporal_1994 ; Kolner_1989 ; Solli_2007 . By introducing the approach in the field of phononics, we have realized a phononic time lens in a one-dimensional (1D) phononic crystal waveguide (PnC WG)Hatanaka_Phonon_2015 ; Hatanaka_Phonon_2014 which is constructed by nanoelectromechanical systems (NEMS) technology. Ultrasound phonon waves travelling through the WG experience pulse broadening due to the group velocity dispersion (GVD) effect. This GVD effect can be used to compensate for the frequency modulation of the initial pulse that leads to temporal focusing. By further incorporating excellent mechanical properties of NEMS such as high-quality factors, integrability and nonlinearity into this devicesingh2014optomechanical ; Weber_Coupling_2014 ; okamoto2013coherent ; faust2013coherent , the ability to temporally focus the travelling phonons will open up the possibility of developing an ultrashort and highly intense phonon pulse generator, which will be useful for practical applications as in the case of optical laser systemsRevModPhys.78.309 ; Perry917 ; gauthier2016chirped , and investigaing nonlinear phononic phenomena.
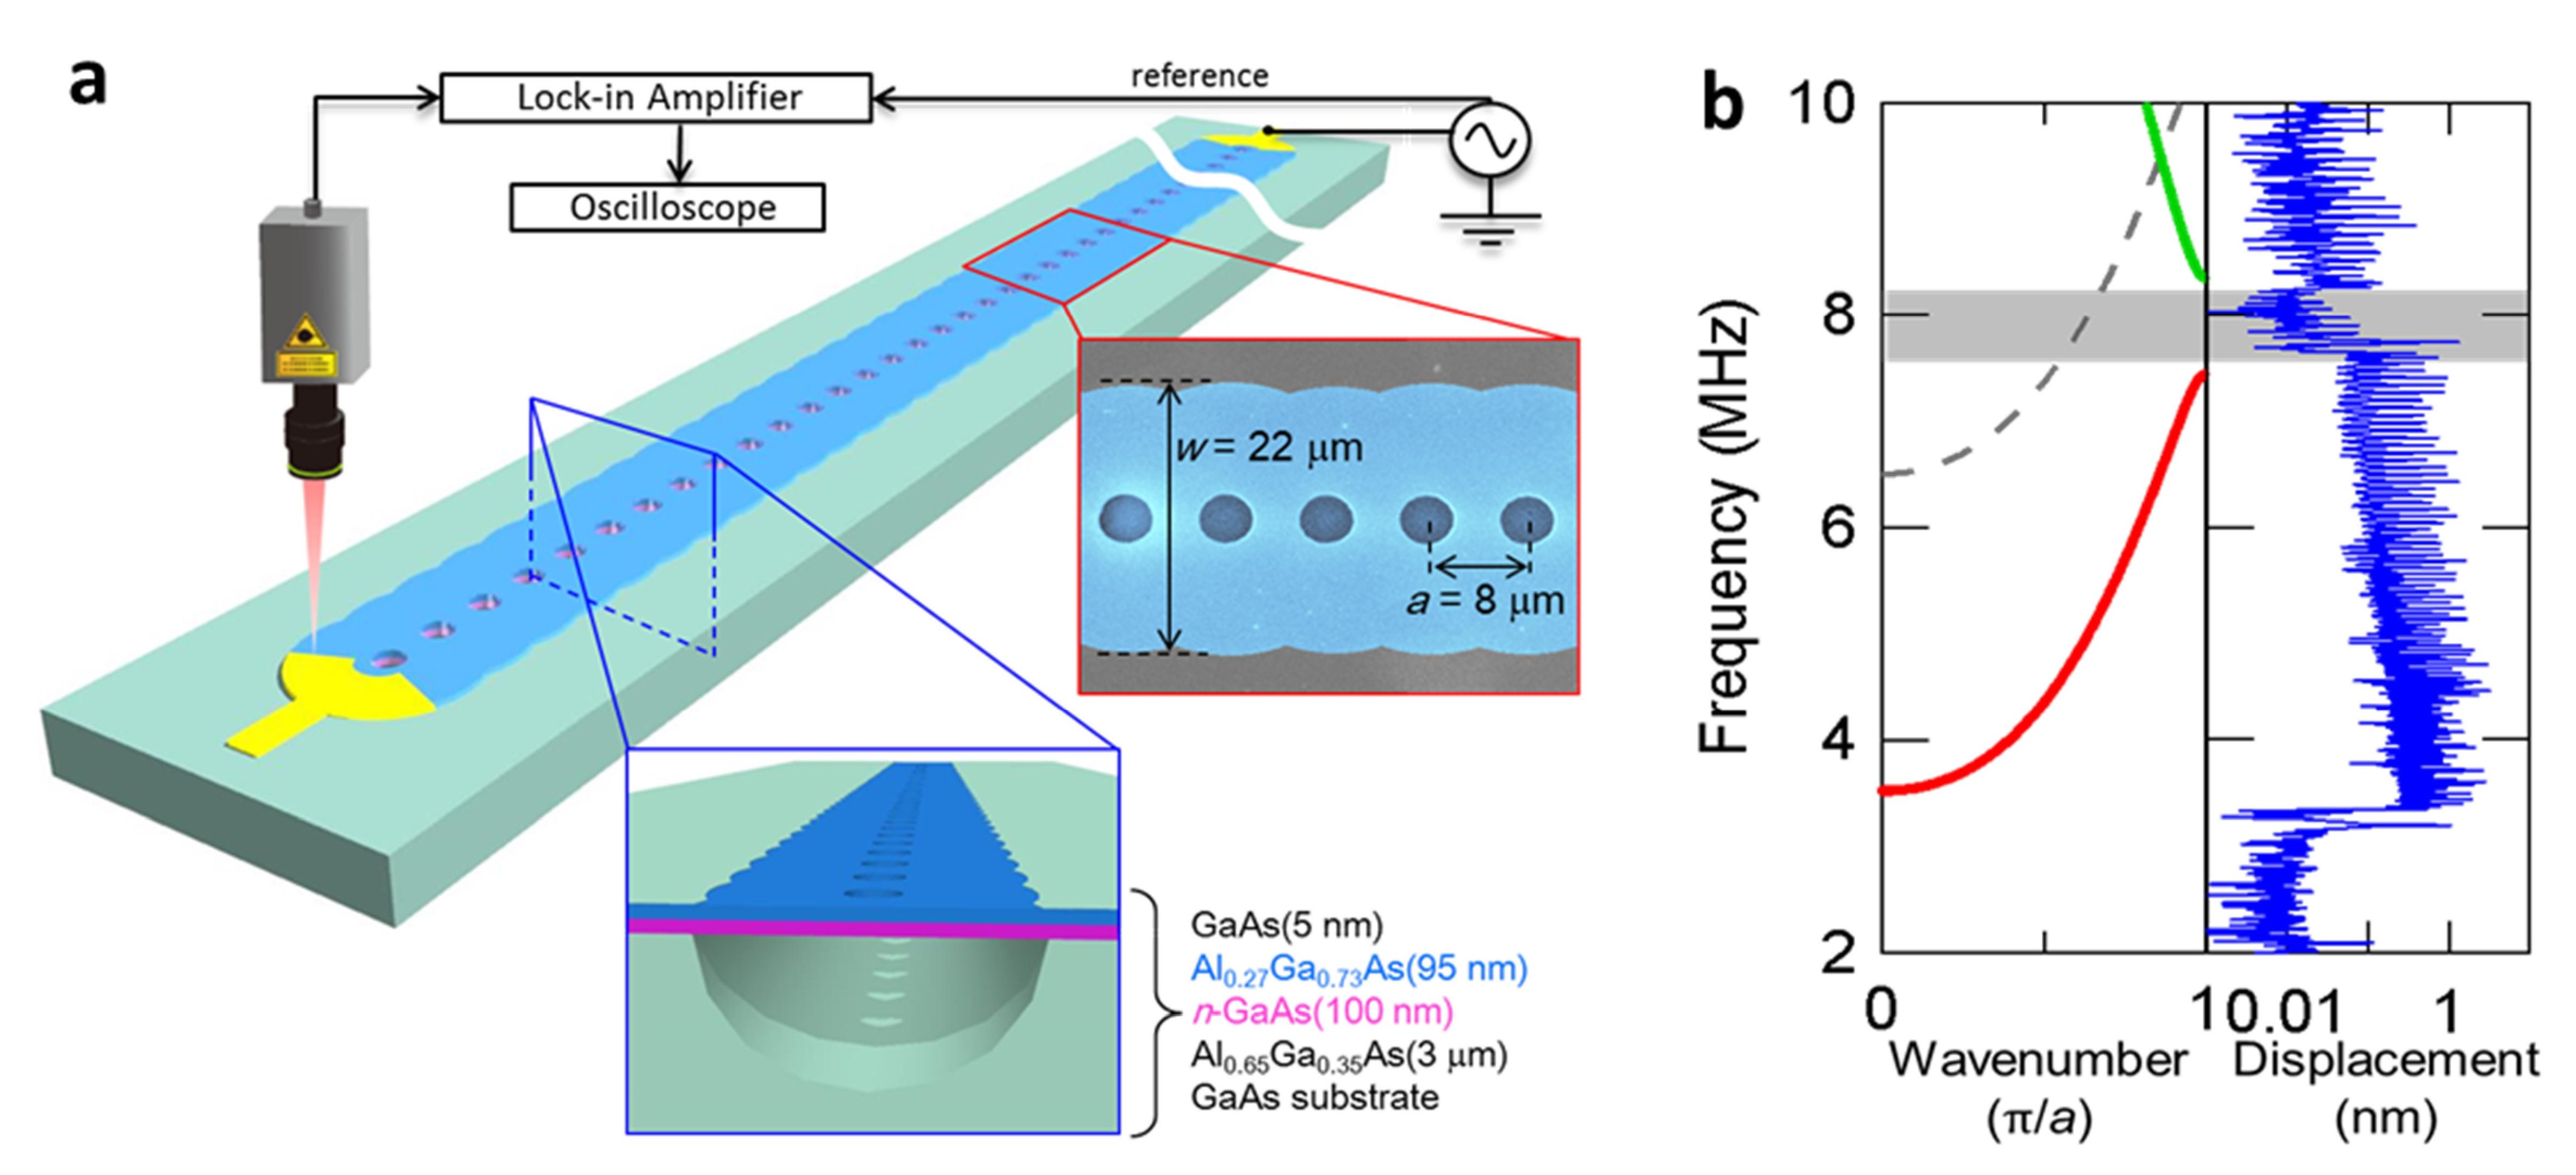
The PnC WG consists of a 1 mm long membrane made from a GaAs/AlGaAs heterostructure as shown in Fig. 1(a), where periodically-arrayed air holes with a pitch of 8 m are formed along the WG that can be used to suspend the membrane with a width of 22 m by selectively etching the Al0.65Ga0.35As layer. The application of an alternating voltage to an electrode located at both edges of the WG induces phonon vibrations due to the piezoelectric effect. The resultant vibrations travel down the WG and are detected in an optical interferometer.
Figure 1(b) shows the experimental transmission spectrum of the device and the corresponding band structure calculated by using a finite element method (FEM) simulation (COMSOL Multiphysics). The phonon vibrations are observed in 3.5-7.5 MHz owing to the presence of 1st phonon band, where the phonon vibrations propagate in the WG and are reflected at both clamping edges thus resulting in the generation of equidistant Fabry-Perot peaks in the spectral response. On the other hand, phonon waves around 8 MHz experience Bragg reflection from the periodic air holes, giving rise to a phonon bandgap, and this prevents them from propagating in the WGHatanaka_Phonon_2015 ; Hatanaka_Phonon_2014 . Above the bandgap, there is a new phonon branch that again allows the phonon vibrations to be guided. In the experiments described below, we focus on the 1st phonon branch to investigate the temporal dynamics of the phonon vibrations in the device.
A transverse deflection travelling in a 1D PnC WG can be described by Euler-Bernoulli equations asNayfeh_book ,
| (1) |
where is the Young’s modulus, and are the area and moment of inertia of the cross section, is the density of the WG per unit length and and are the elastic coefficients of the WG. To solve equation (1), the slowly varying amplitude of travelling wave is assumed that the envelope of a travelling vibration pulse centred around wavenumber and angular frequency varies slowly in temporal and spatial domain on the moving-frame with group velocity,
| (2) |
We introduce the linear loss term , then satisfies the following equationNayfeh_book ,
| (3) |
where is the inverse of the group velocity, is the GVD coefficient and is a nonlinear parameter. These terms are determined by the material and geometric parameters of the WG in equation (1). Thus, the dynamics of phonon propagation based on the Euler-Bernoulli equation corresponds to a nonlinear Schrdinger equation (NLSE), which is used to describe the dynamics of an optical wave propagating in a dispersive mediumAgrawal_5th ; Mollenauer_83 ; Blanco_soliton_2014 . By neglecting the nonlinear term in equation (3) and using the new time coordinate moving with the group velocity ,
| (4) |
At the same time we introduce a normalized amplitude ,
| (5) |
where is the peak amplitude of the input pulse, and the equation can be simplified as
| (6) |
Interestingly, equation (6) is mathematically equal to the paraxial wave equation that governs the diffraction of CW light. If we assume a Gaussian pulse as an input, the normalized amplitude at distance is given byAgrawal_5th ,
| (7) |
where is the half-width at the 1/-intensity point, and its output width is written as
| (8) |
Thus a phonon temporal waveform travelling down a dispersive medium depends on the absolute value of the GVD coefficient that enables the temporal pulse width to be broadened further due to the larger dispersion.
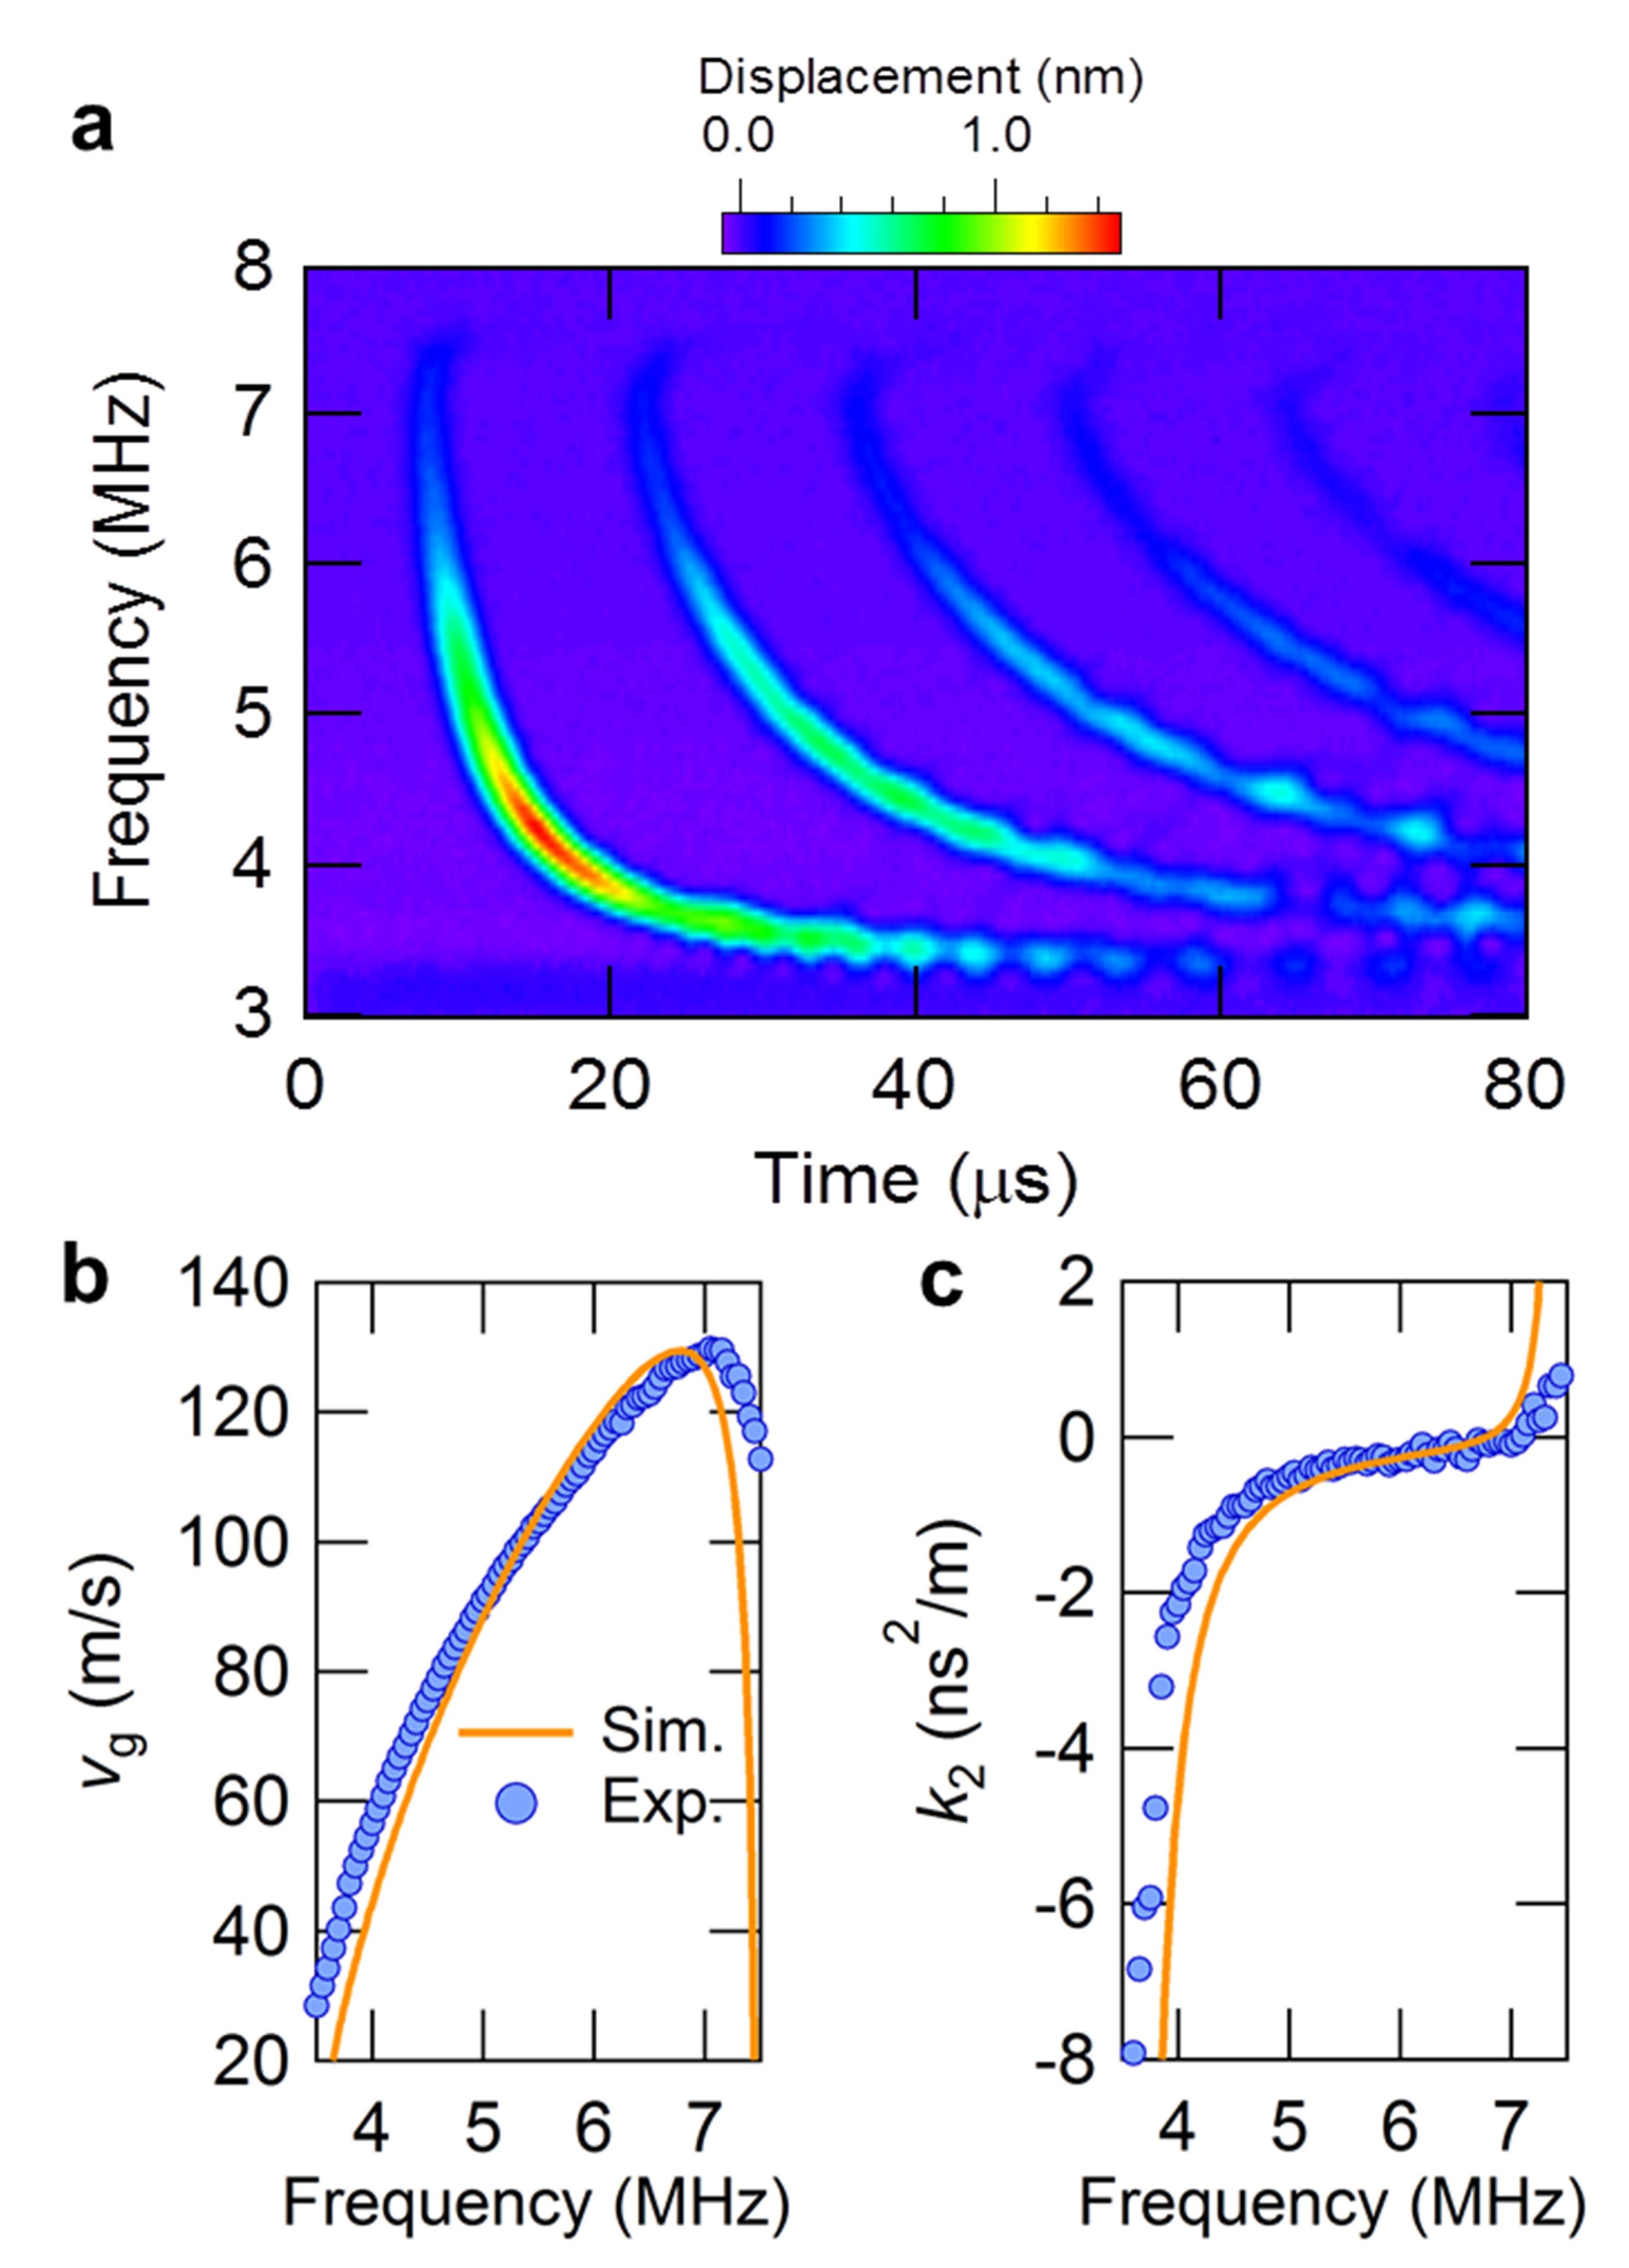
To elucidate the temporal characteristics of this device experimentally, phonon vibrations are measured at the left edge by exciting them with a Gaussian pulse with s from the right edge as shown in Fig. 2(a). This time-of-flight measurement also enables the group velocity and the GVD coefficient to be estimated as function of excitation frequency as shown in Figs. 2(b) and 2(c) respectively. The experimental value increases with increasing frequency i.e. anomalous dispersion () in the band except near the bandgap where there is a large reduction in , i.e. normal dispersion (), because of the decreased slope of the band. In addition, the temporal waveform of the pulse around the band edges is distorted and becomes asymmetric with an oscillation near the trailing edge caused by a contribution from the 3rd order dispersion effect (see Supplementary Information for more detail). These experimental results can be well reproduced by the calculation results obtained with FEM-simulated band structures.
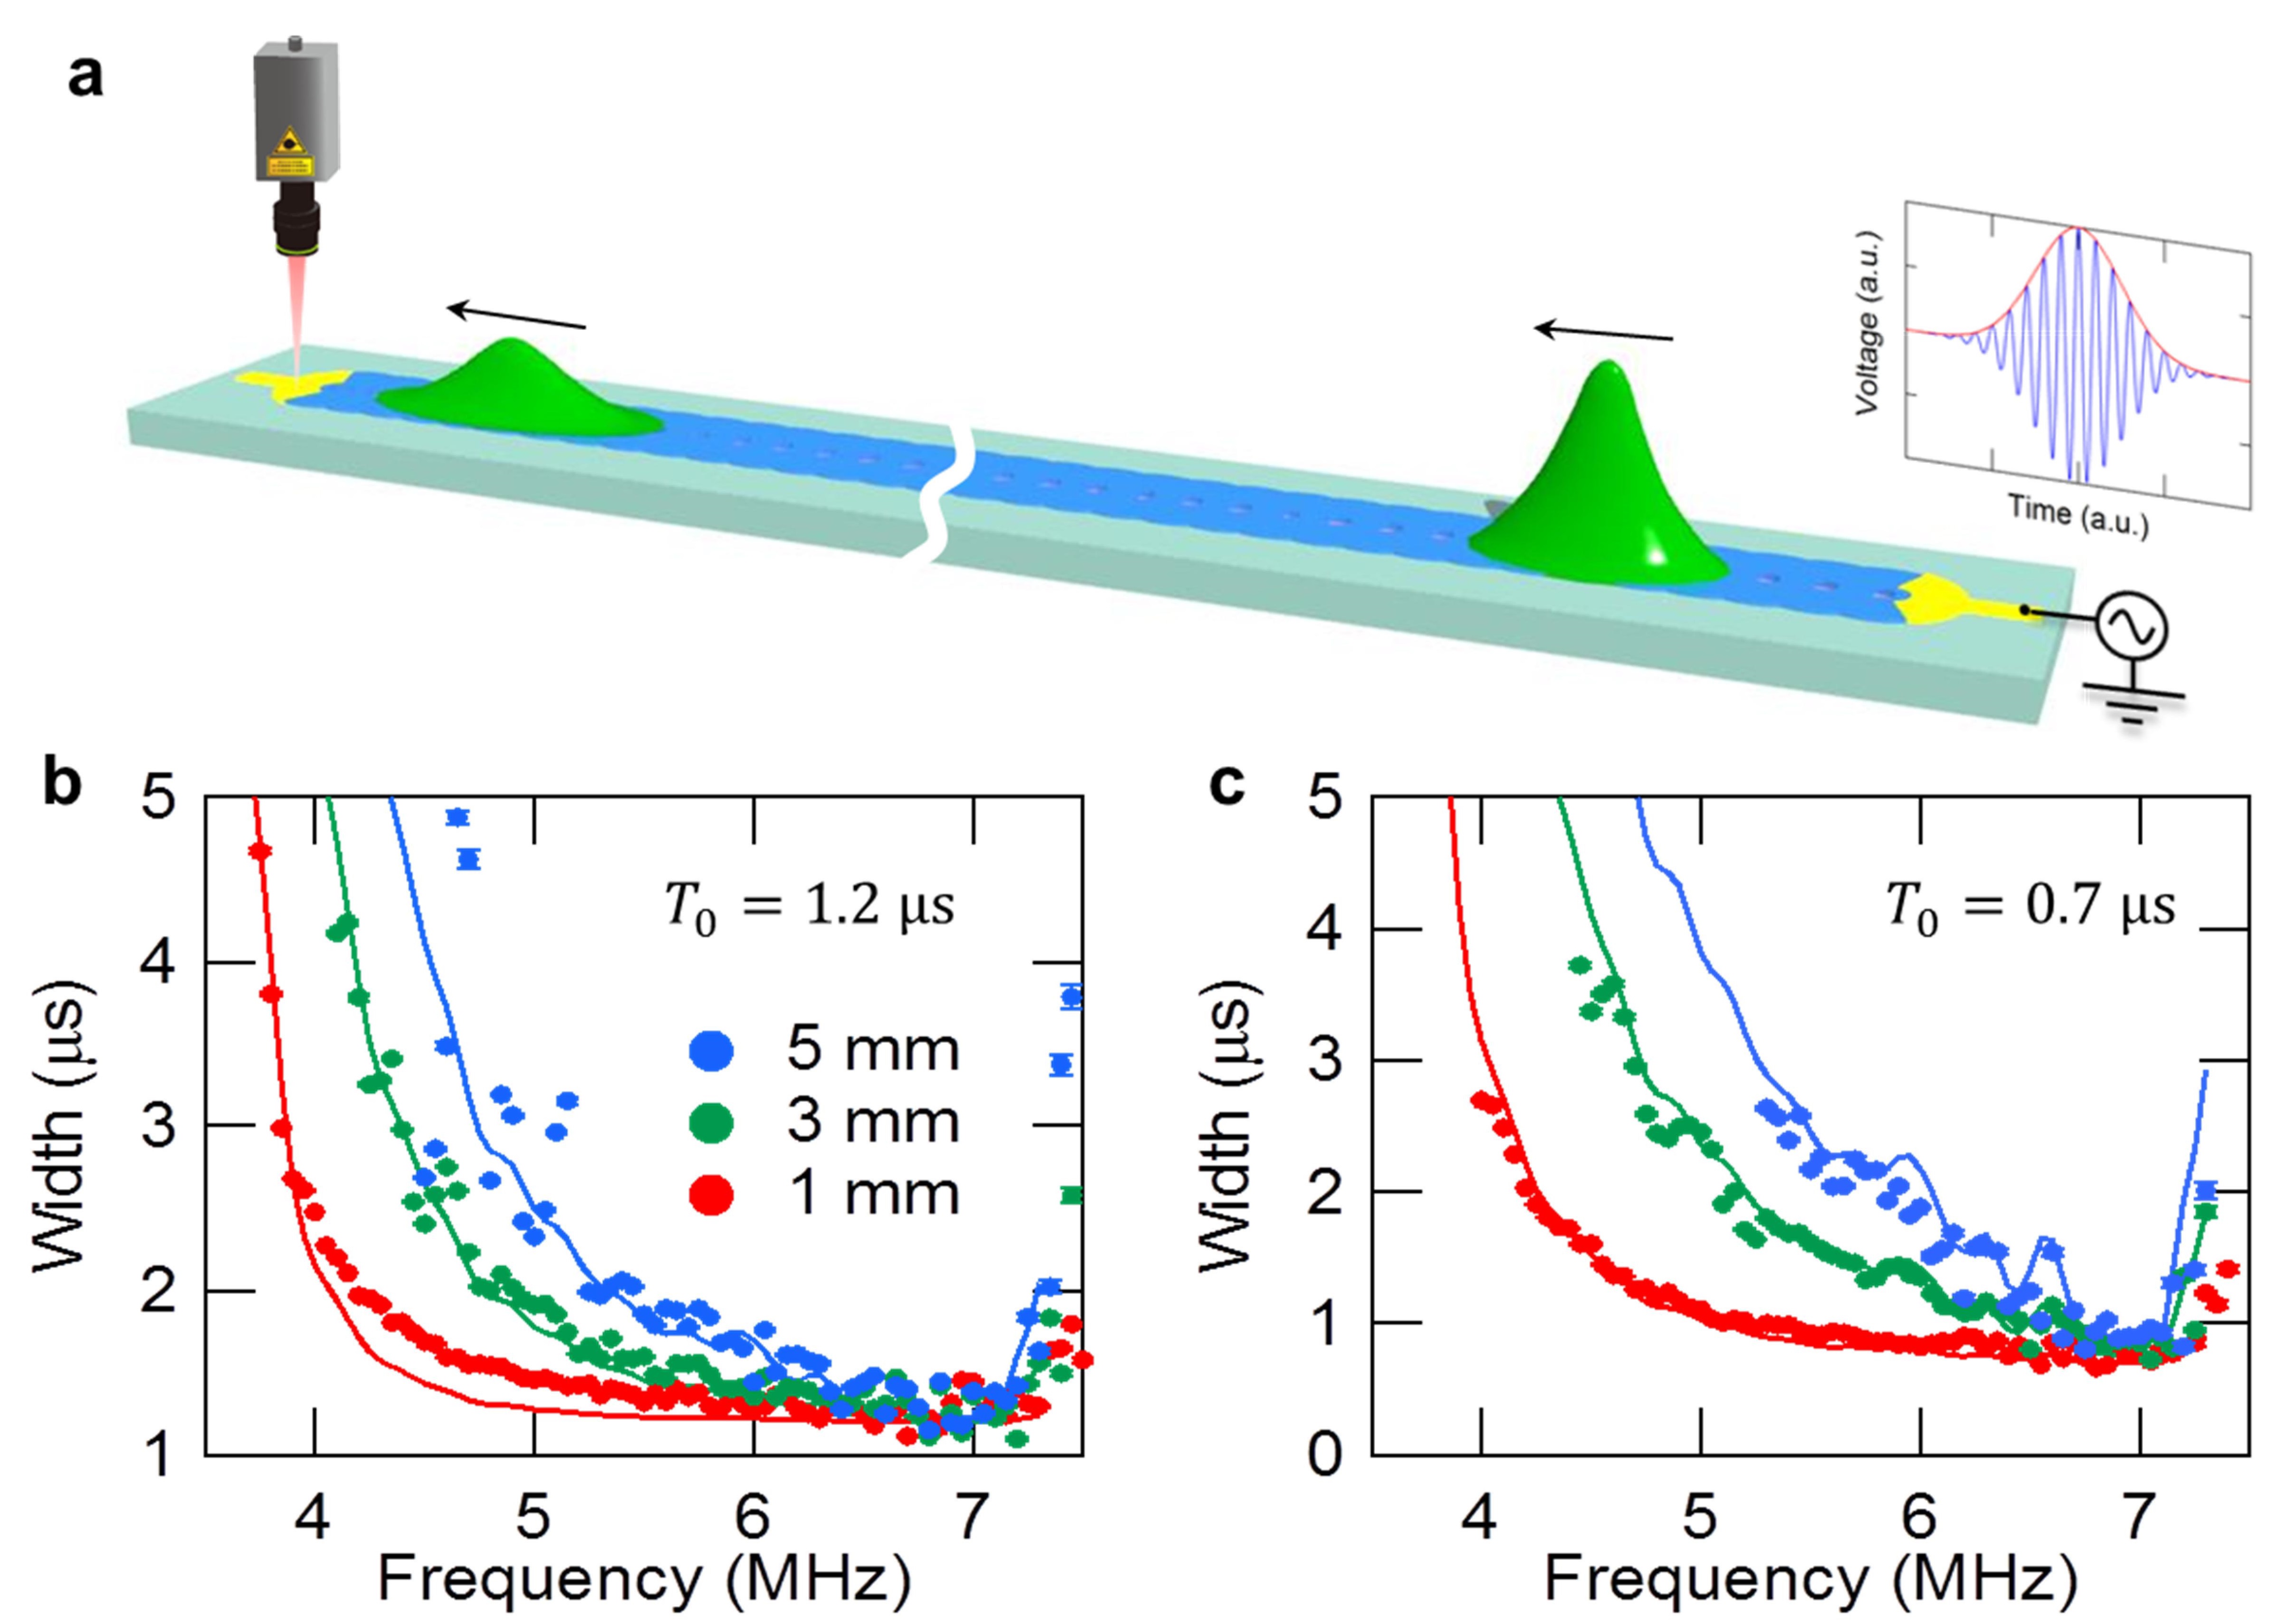
The temporal pulse widths can also be estimated from the time-of-flight measurement in Fig. 2(a) by fitting a Gaussian envelope to the output waveforms. Figures 3(b) and 3(c) reveal the output pulse widths at various excitation frequencies when exciting Gaussian pulses with and 0.7 s respectively and measuring them at distances 1, 3 and 5 mm (see Fig. 3(a)). As theoretically predicted, the pulse widths are greatly increased as the frequency approaches the band edges where is large and the GVD-induced pulse broadening becomes distinct with increasing propagation distance as shown in Figs. 3(b)and 3(c)Marcuse_Pulse_1980 . In particular, shortening the input pulse from s to 0.7 s, namely spectrally broadening, leads to the significant influence of the propagation distance on the output width as shown in Fig. 3(c).
In the previous experiment we confirmed that the pulse is broadened during propagation thanks to the GVD effect. In an anomalous (normal) dispersion regime, the high-frequency components of the pulse travel faster (slower) than its low-frequency components, thus allowing the injected un-chirped pulse to be frequency chirped and broadened, where the product of the temporal and spectral widths is not transform limited. In general, this effect is unfavorable for efficient phonon guiding. However, we utilize the disadvantage to demonstrate temporal focusing, namely the compression and amplification, of the travelling phonon pulse. Here, a frequency-chirped pulse is excited as the input, and frequency modulation within the pulse is compensated for by the GVD via propagation, thus resulting in the pulse being compressed to the lower limit for the pulse width determined by a given spectrum, namely transform limited, and the peak amplitude being amplified. Thus this temporal analogue of a spatial lens, called a time lens, enables the temporal focusing of a phonon waveSalem_2013 . The dynamics of the chirped pulse evolution in the WG can also be described by NLSE, and the output pulse width is given by
| (9) |
is a chirp parameter that is positive (negative) when the frequency increases (decreases) linearly from the leading to the trailing edge, and is defined by where is the spectral half-width at the 1/-intensity point. Equation (9) indicates that pulse focusing occurs only when , where an up-chirped (down-chirped ) pulse is used as an input in an anomalous (normal) dispersion regime ().
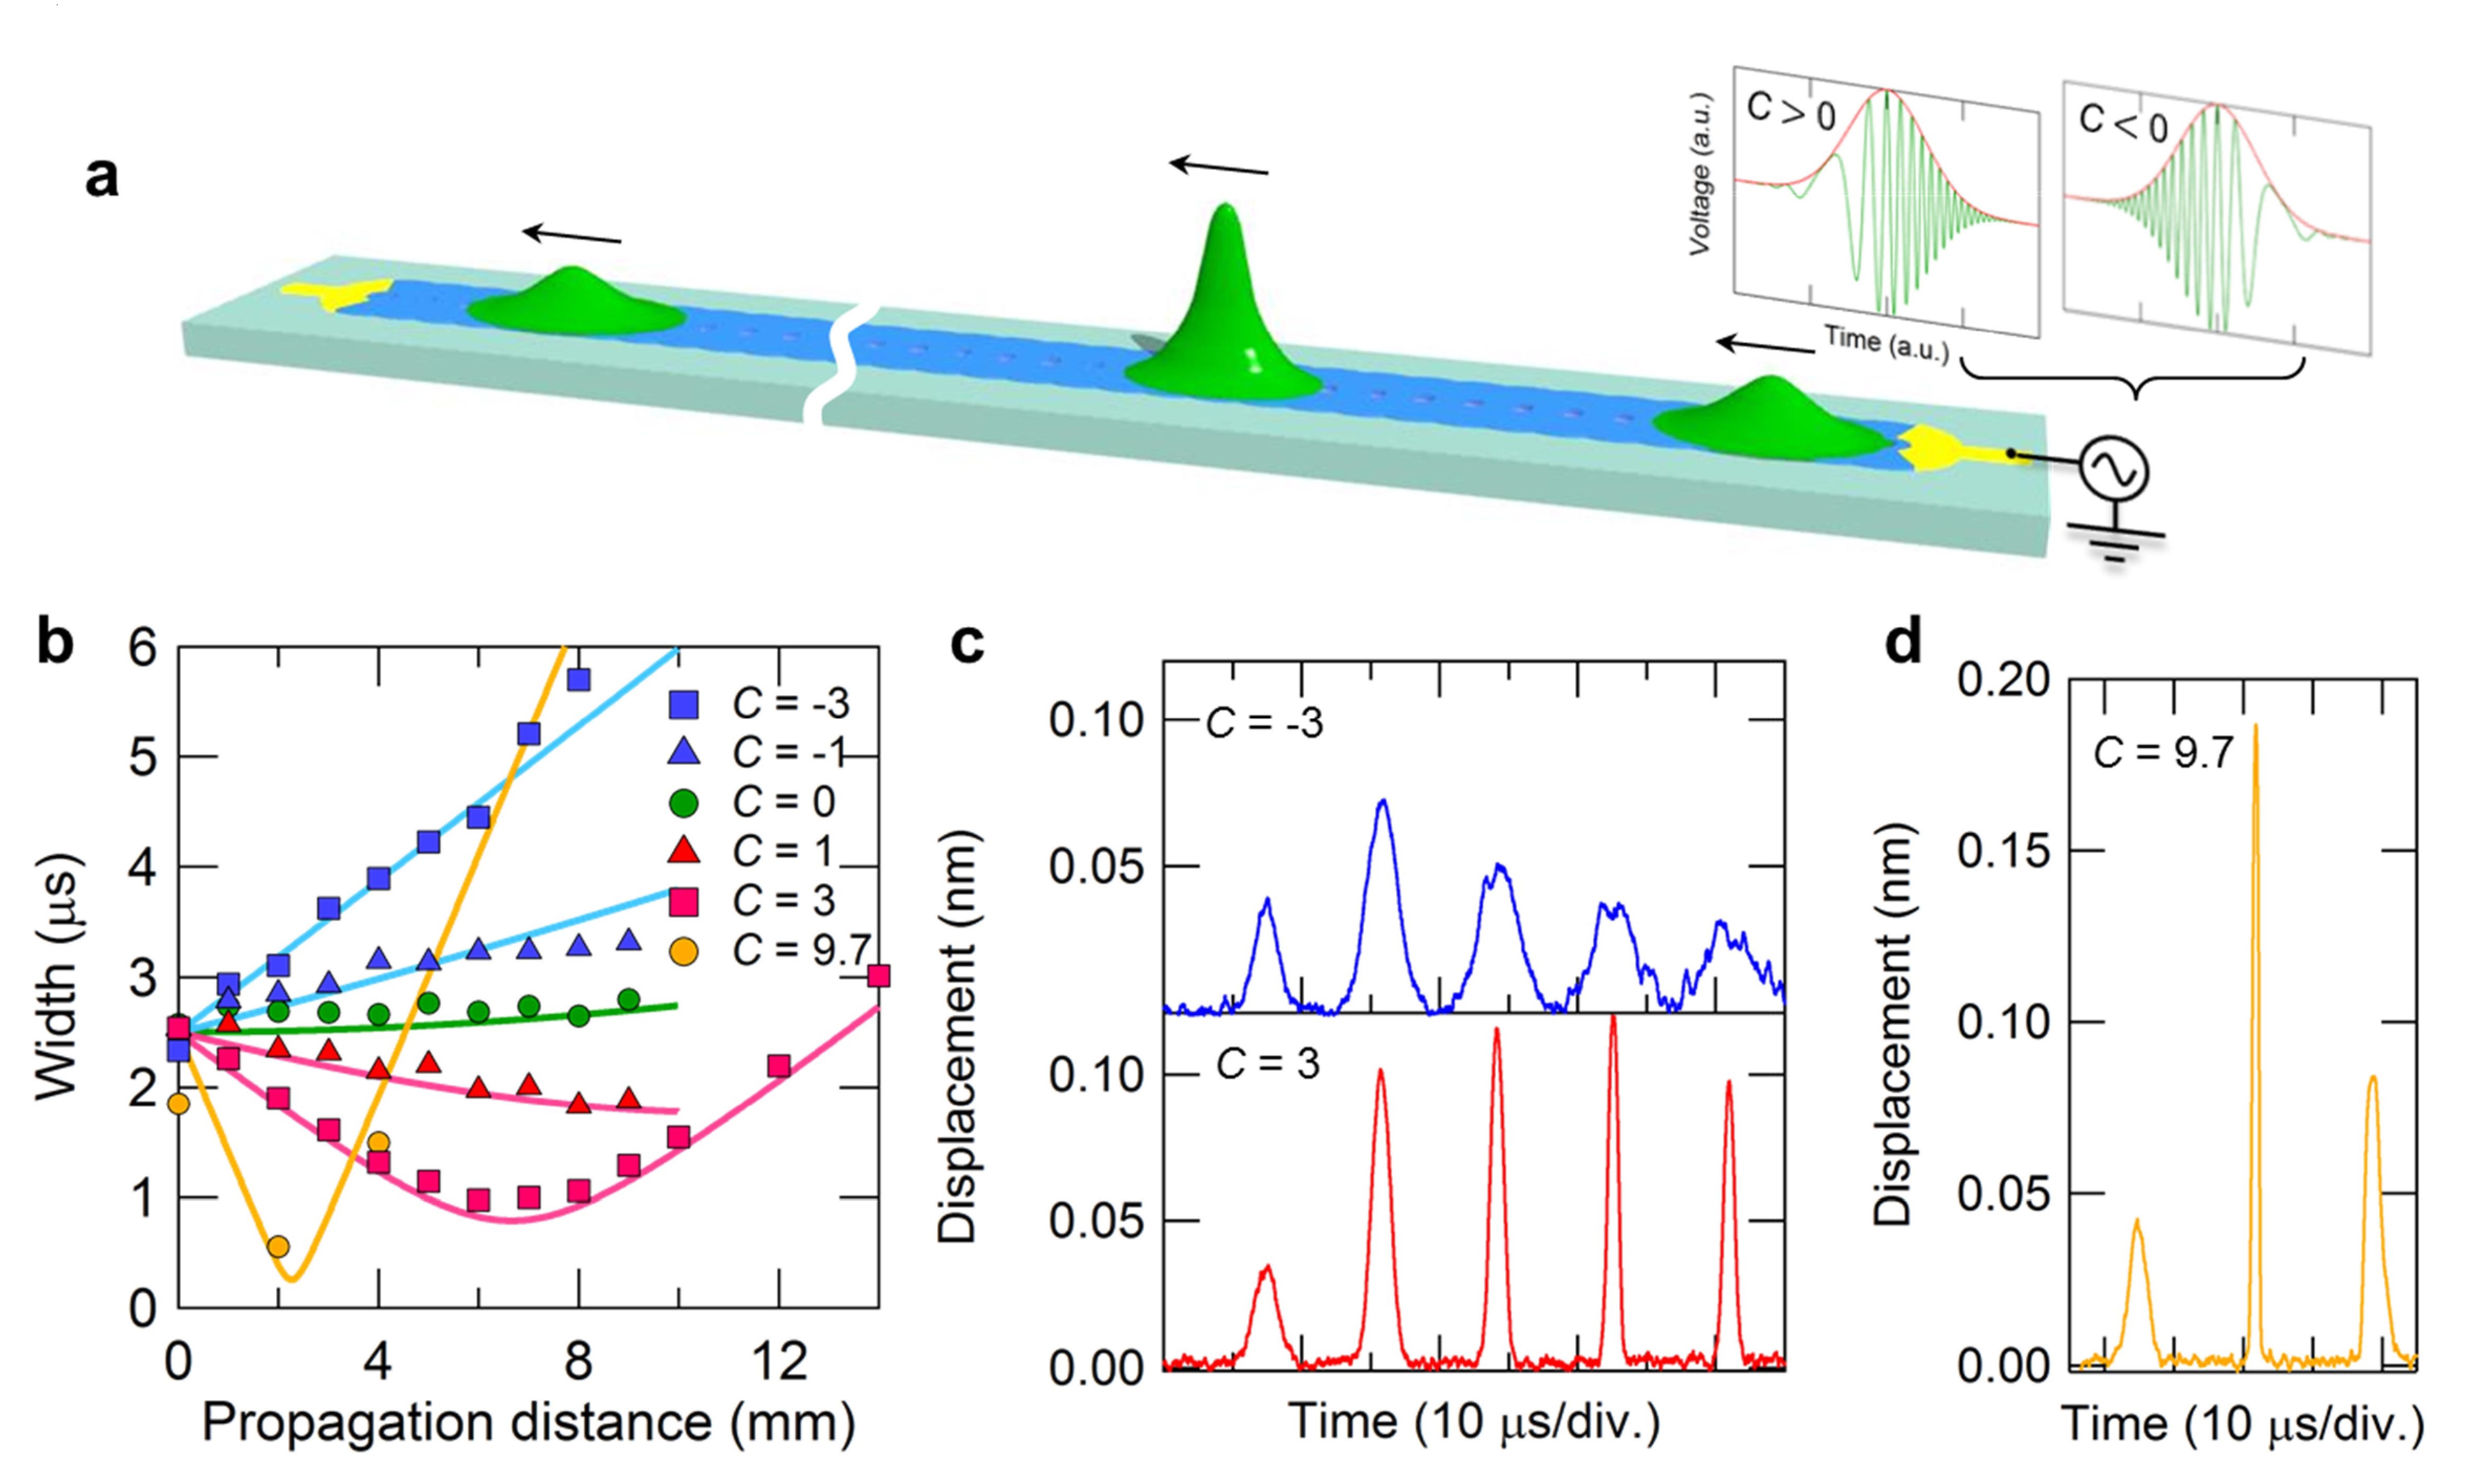
As an experimental demonstration in this device, an up-chirped pulse is injected in the anomalous dispersion regime between 3.5-7 MHz as shown in Fig. 4(a). The output pulse width is measured at various distances by exciting different chirped pulses with a centre frequency of 5.8 MHz as shown in Figs. 4(b)-(d). The pulse widths with negative monotonically increase with increasing distance (see Fig. 4(b) and the upper panel of Fig. 4(c)), whereas the widths with a positive first decrease to the transform limited value, and in turn, increase with distance (see Fig. 4(b) and the lower panel of Fig. 4(c)). It should be also noted that a smaller pulse width is observed when we employ a larger absolute value of positive and indeed, strong focusing is realized when where the pulse width is compressed from 2 s to 0.5 s and the strain energy is enhanced more than one order of magnitude. Making use of the GVD effect enables a travelling pulse waveform to be engineered that leads to the temporal focusing of phonons.
In a conventional spatial lens, the figures of merit such as the compression and amplification factors, and the ability to spatially adjust the focusing position, are mainly determined by the geometric parameters of the system. Therefore, these techniques require sophisticated artificial structures if they are to control waves. In contrast this time lens enables them to be dynamically designed by simply changing the excitation frequency, input pulse width and chirp parameters. Although, in this study, these focusing properties are limited by the device structure causing the reflection at both WG edges, and the finite bandwidth of the lock-in amplifier, it is possible to further enhance this focusing effect by modifying the device structure and optimizing the measurement set-up.
In conclusion, we have demonstrated a phononic time lens in a 1D PnC WG.
The dispersion effect determined by the periodic geometry of the device induces frequency chirp in the Gaussian input pulse during propagation. This phenomenon also allows the travelling wave to be temporally focused, and this can be controlled by changing the input chirp parameters. This novel temporal focusing can enhance the availability of mobile phonons, and this ability will open up potential applications to investigate nonlinear phononic phenomena.
Methods
Nanomechanical vibrations in the PnC WG were excited by applying an amplitude modulated alternating voltage from a signal generator (NF Wavefactory 1974 and 1968), and were measured with a He-Ne laser Doppler interferometer (NEOARK MLD-230V-200-NN). In the spectral measurements in Fig. 1(b), the electrical output from the interferometer was measured with a vector signal analyzer (HP89410A). In the temporal measurements in Figs. 2(a), 3(b)-(c) and 4(b)-(c), the electrical output was first filtered by a lock-in amplifier (Zurich Instruments HF2LI), and then measured with an oscilloscope (Agilent DSO6014A).
The spectral bandwidth of the low-pass filter in the lock-in amplifier was set at 470 kHz, which is equivalent a time constant of 102.6 ns.
Acknowlegements
We are grateful to Y. Ishikawa for growing the heterostructure. This work is partly supported by a MEXT Grant-in-Aid for Scientific Research on Innovative Areas ”Science of hybrid quantum systems” (Grant No. JP15H05869).
Author Contributions
M.K. and D.H. performed the measurements and data analysis. D.H. fabricated the sample and K.O. co-fabricated the GaAs/AlGaAs heterostructure. M.K. and D.H. wrote the paper and H.Y. planned the project.
References
- (1) Buckingham, M. J., Berknout, B. V., and Glegg, S. A. Imaging the ocean with ambient noise. Nature 356, 327–329 (1992).
- (2) Fatemi, M. and Greenleaf, J. F. Ultrasound-stimulated vibro-acoustic spectrography. Science 280, 82–85 (1998).
- (3) Kushibiki, J. and Chubachi, N. Material characterization by line-focus-beam acoustic microscope. IEEE Trans Son Ultrason 32, 189–212 (1985).
- (4) Esenaliev, R. O., Karabutov, A. A., and Oraevsky, A. A. Sensitivity of laser opto-acoustic imaging in detection of small deeply embedded tumors. IEEE Journal of Selected Topics in Quantum Electronics 5, 981–988 (1999).
- (5) Yang, S., Page, J. H., Liu, Z., et al. Focusing of sound in a 3D phononic crystal. Phys. Rev. Lett. 93, 024301 (2004).
- (6) Spadoni, A. and Daraio, C. Generation and control of sound bullets with a nonlinear acoustic lens. Proc Natl Acad Sci 107, 7230–7234 (2010).
- (7) Chen, Y., Liu, H., Reilly, M., et al. Enhanced acoustic sensing through wave compression and pressure amplification in anisotropic metamaterials. Nat Commun 5, 5247 (2014).
- (8) Hatanaka, D., Dodel, A., Mahboob, I., et al. Phonon propagation dynamics in band-engineered one-dimensional phononic crystal waveguides. New J Phys 17, 113032 (2015).
- (9) Hatanaka, D., Mahboob, I., Onomitsu, K., et al. Phonon waveguides for electromechanical circuits. Nat Nanotechnol 9, 520–524 (2014).
- (10) Akhmanov, S., Chirkin, A., Drabovich, K., et al. Nonstationary nonlinear optical effects and ultrashort light pulse formation. IEEE Journal of Quantum Electronics 4, 598–605 (1968).
- (11) Treacy, E. Optical pulse compression with diffraction gratings. IEEE Journal of Quantum Electronics 5, 454–458 (1969).
- (12) Foster, M. A., Salem, R., Geraghty, D. F., et al. Silicon-chip-based ultrafast optical oscilloscope. Nature 456, 81–84 (2008).
- (13) Salem, R., Foster, M. A., and Gaeta, A. L. Application of space-time duality to ultrahigh-speed optical signal processing. Adv. Opt. Photon. 5, 274–317 (2013).
- (14) Salem, R., Foster, M., Turner, A., et al. Optical time lens based on four-wave mixing on a silicon chip. Opt Lett 33, 1047 (2008).
- (15) Bennett, C., Scott, R., and Kolner, B. Temporal magnification and reversal of 100 Gb/s optical data with an up-conversion time microscope. Appl Phys Lett 65, 2513 (1994).
- (16) Kolner, B. H. and Nazarathy, M. Temporal imaging with a time lens. Opt. Lett. 14, 630–632 (1989).
- (17) Solli, D., Chou, J., and Jalali, B. Amplified wavelength-time transformation for real-time spectroscopy. Nat Photonics 2, 48–51 (2007).
- (18) Singh, V., Bosman, S. J., Schneider, B. H., et al. Optomechanical coupling between a multilayer graphene mechanical resonator and a superconducting microwave cavity. Nature Nanotechnology 9, 820–824 (2014).
- (19) Weber, P., Güttinger, J., Tsioutsios, I., et al. Coupling graphene mechanical resonators to superconducting microwave cavities. Nano Lett 14, 2854–2860 (2014).
- (20) Okamoto, H., Gourgout, A., Chang, C. Y., et al. Coherent phonon manipulation in coupled mechanical resonators. Nature Physics 9, 480–484 (2013).
- (21) Faust, T., Rieger, J., Seitner, M. J., et al. Coherent control of a classical nanomechanical two-level system. Nature Physics 9, 485–488 (2013).
- (22) Mourou, G. A., Tajima, T., and Bulanov, S. V. Optics in the relativistic regime. Rev. Mod. Phys. 78, 309–371 (2006).
- (23) Perry, M. D. and Mourou, G. Terawatt to petawatt subpicosecond lasers. Science 264, 917–924 (1994).
- (24) Gauthier, D., Allaria, E., Coreno, M., et al. Chirped pulse amplification in an extreme-ultraviolet free-electron laser. Nature Communications 7, 13688 (2016).
- (25) Nayfeh, A. H. and Mook, D. T. Nonlinear Oscillations. Wiley Classics Library. Wiley, (2008).
- (26) Agrawal, G. Nonlinear Fiber Optics. Boston, fifth edition, (2013).
- (27) Mollenauer, L. F., Tomlinson, W. J., Stolen, R. H., et al. Extreme picosecond pulse narrowing by means of soliton effect in single-mode optical fibers. Opt. Lett. 8, 289–291 (1983).
- (28) Blanco-Redondo, A., Husko, C., Eades, D., et al. Observation of soliton compression in silicon photonic crystals. Nat Commun 5, 3160 (2014).
- (29) Marcuse, D. Pulse distortion in single-mode fibers. Appl Optics 19, 1653 (1980).
- (30) Liu, J., Usami, K., Naesby, A., et al. High-Q optomechanical GaAs nanomembranes. Applied Physics Letters 99, 243102 (2011).
Supplementary Information
On-chip phononic time lens
M. Kurosu1,2 D. Hatanaka1, K. Onomitsu1 and H. Yamaguchi1,2
1NTT Basic Research Laboratories, NTT Corporation, Atsugi-shi, Kanagawa 243-0198, Japan
2Department of Physics, Tohoku University, Sendai 980-8578, Japan
S1 Effect of third order dispersion
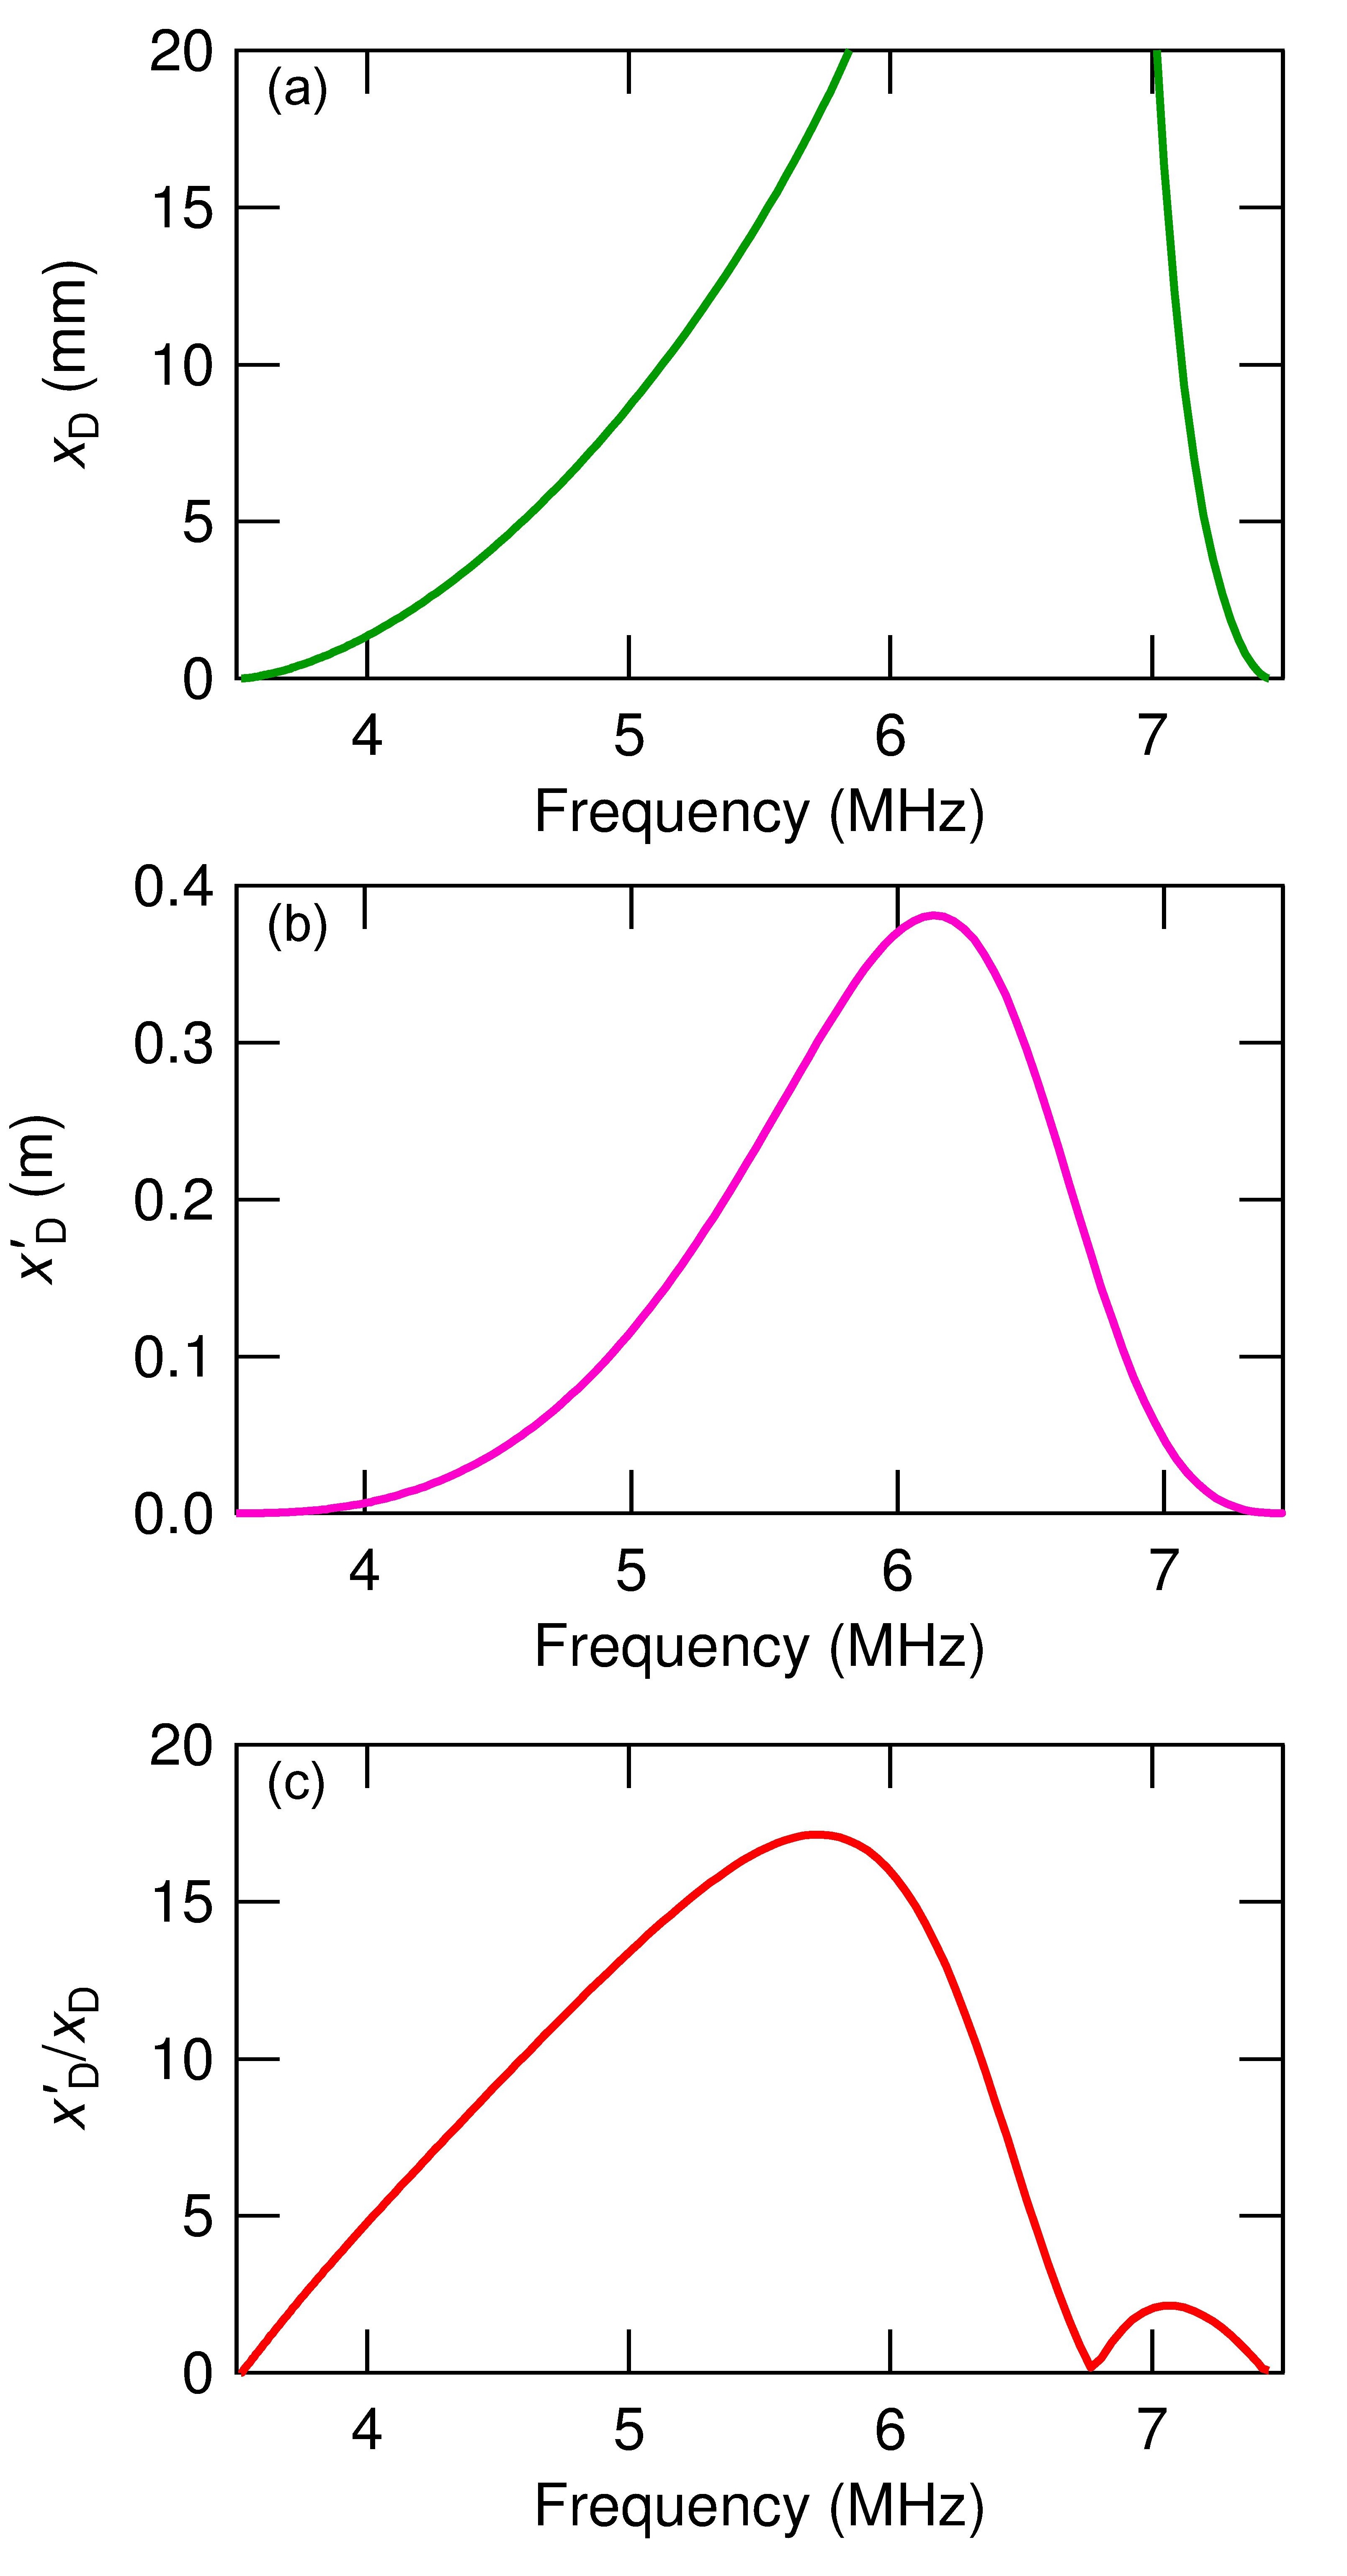
The GVD effect, which is proportional to , determines the phonon pulse waveform. However, we also need to take account of the third-order dispersion (TOD) effect when the centre frequency of the pulse approaches the band edges (ref. S1). To evaluate the contribution of these effects, it is useful to introduce dispersion length scales for GVD and TOD (ref. S2),
| (S1) |
Using equation (S1), equation (6) in the main text can be modified to,
| (S2) |
where depending on the signs of and . Equation (S2) indicates that the GVD effect is dominant in pulse evolution when is smaller than , but the TOD effect also becomes dominant when approaches .
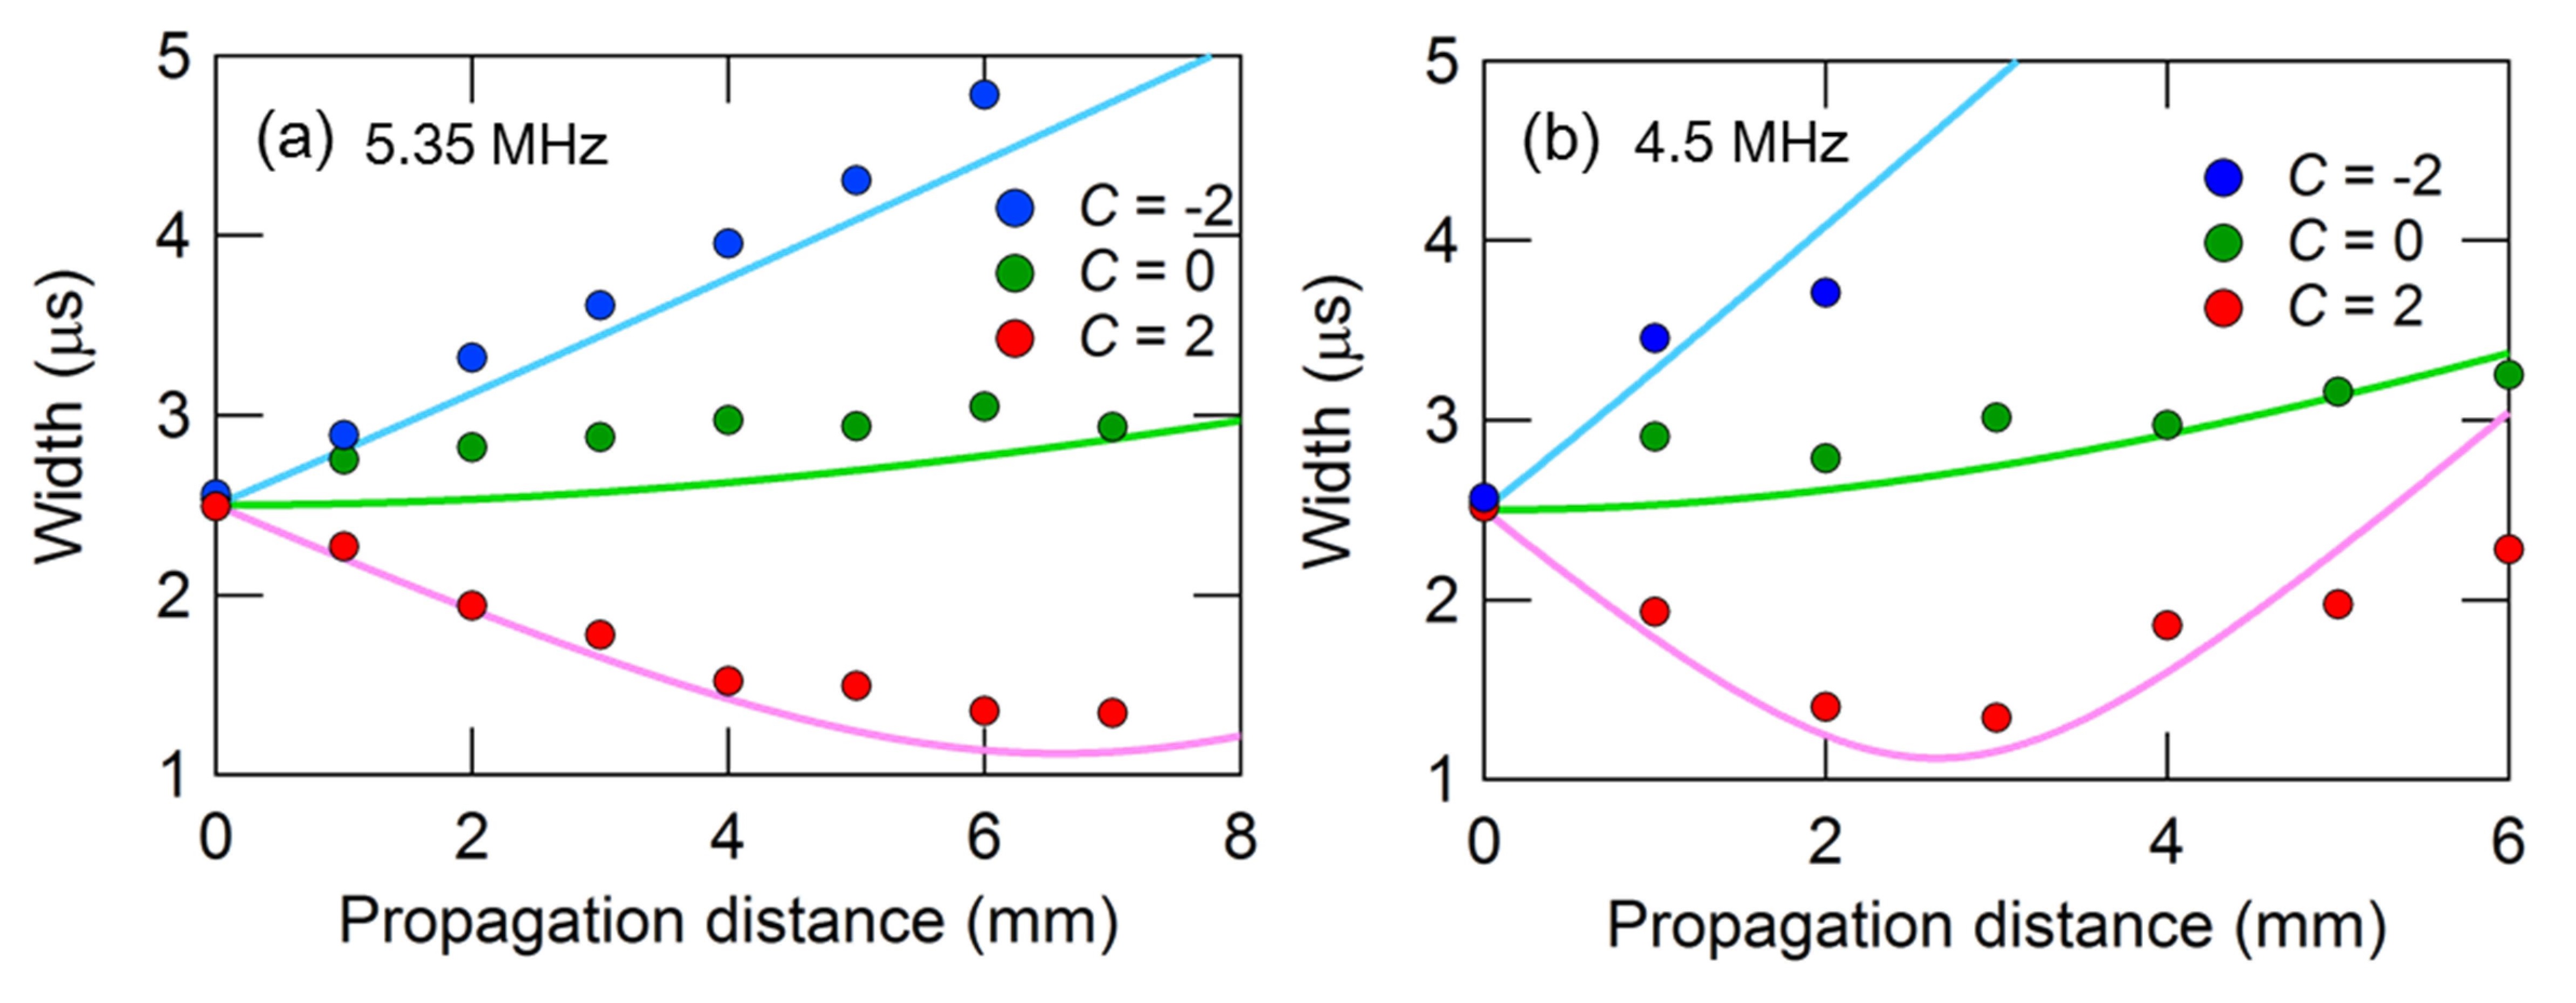
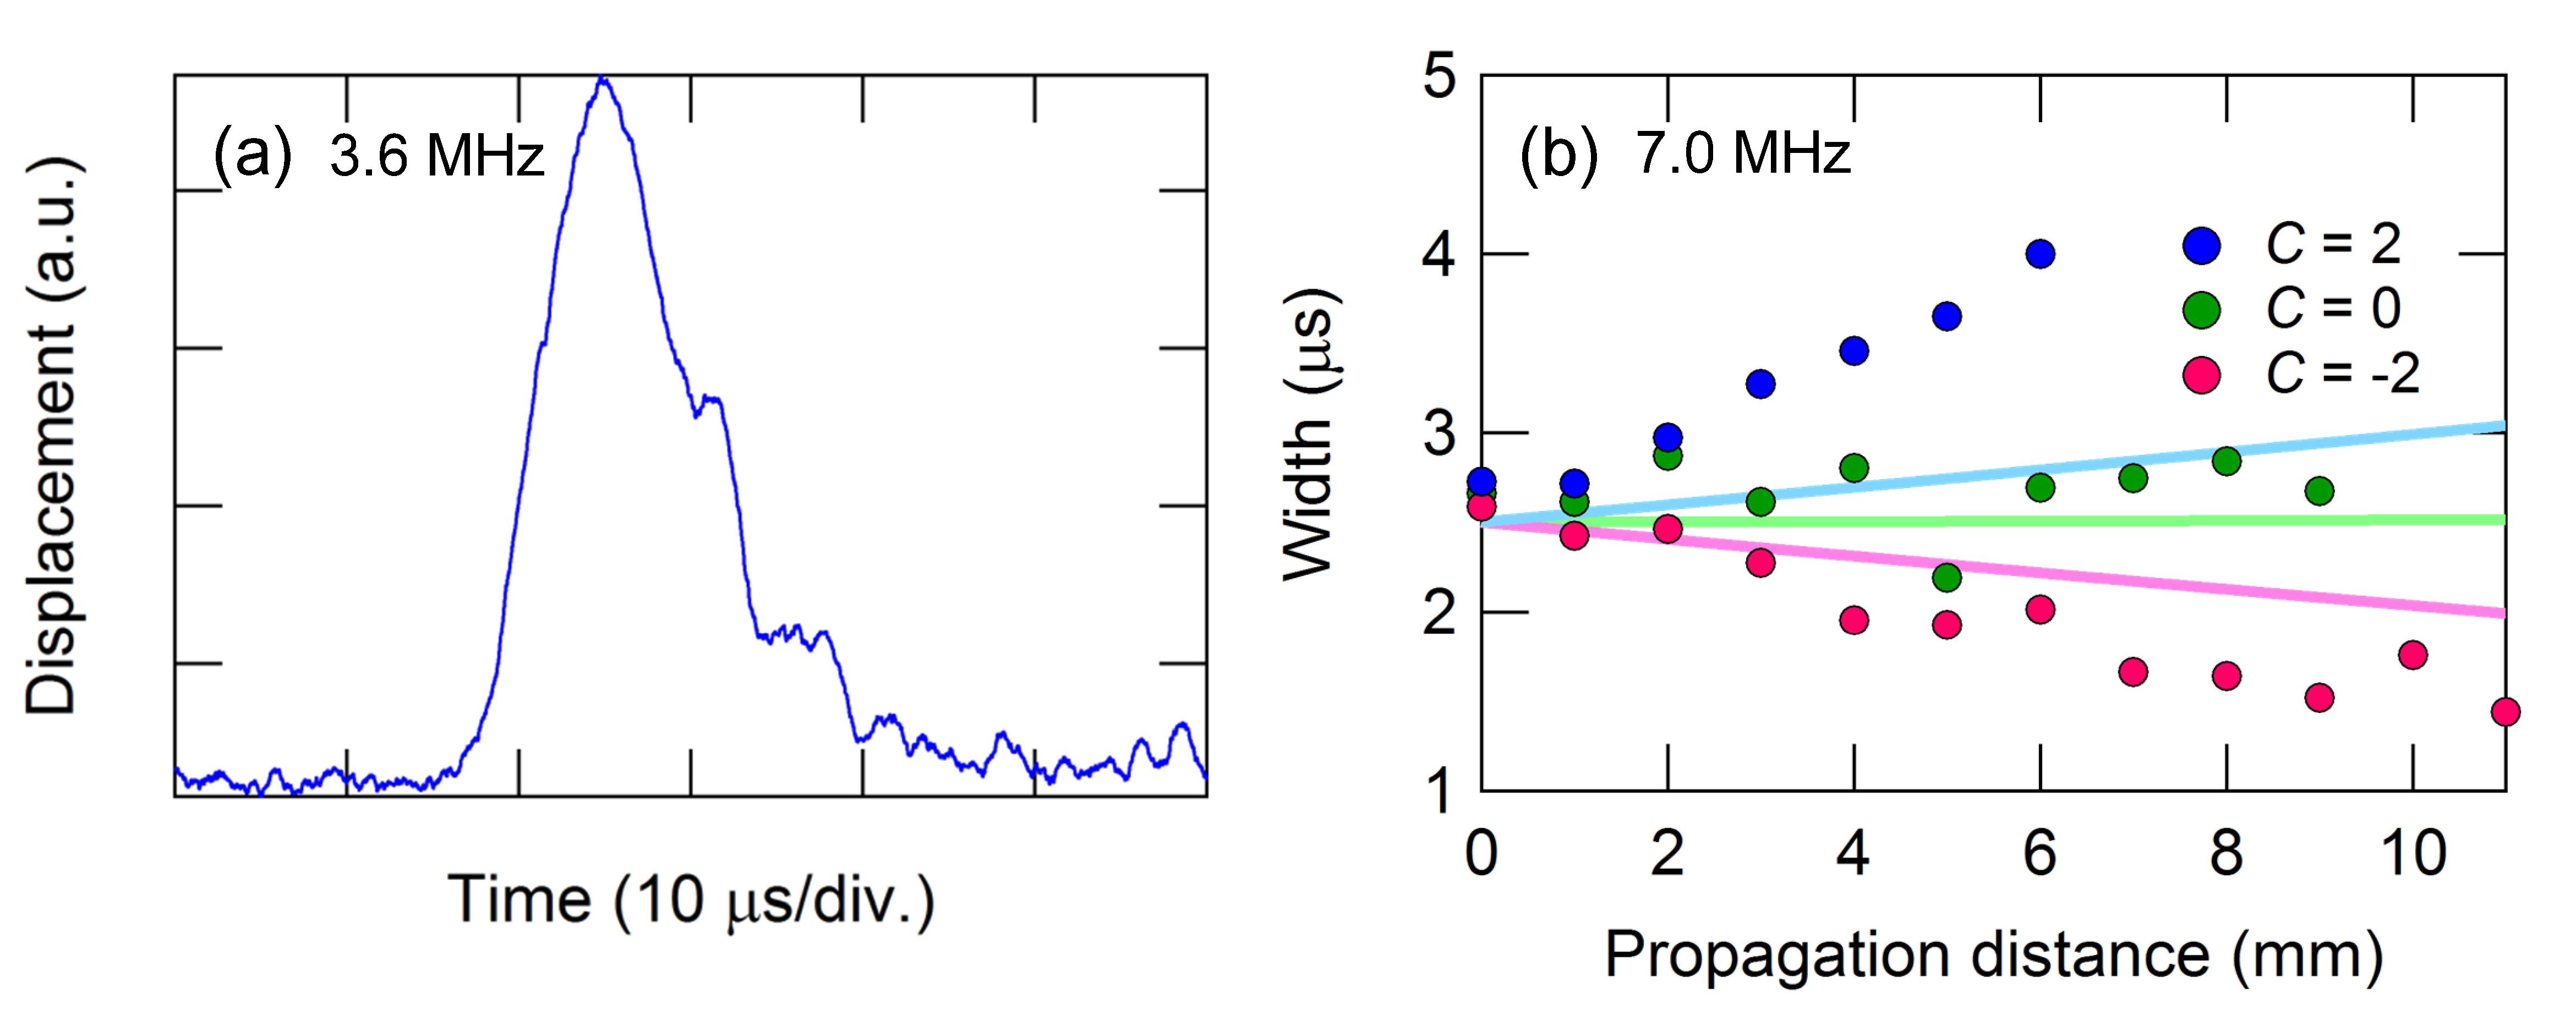
Supplementary Figure 1(a)-(c) shows the frequency dependence of and the ratio of 1D PnC WG, respectively, which are calculated from an FEM simulation. These results indicate that the pulse evolution is mainly dominated by the GVD effect around the centre of the band, where is sufficiently large, and thus, the temporal focusing of the phonon wave at 5.8, 5.35 and 4.5 MHz can be described solely by the GVD effect as shown in Fig. 4(b), Supplementary Fig. 2(a) and 2(b), respectively. On the other hand, is small at the band edges, which allows the TOD effect to distort the pulse waveform, where it becomes asymmetric and an oscillatory structure appears near the tailing edge as shown in Supplementary Fig. 3(a), and thus the dynamics of the temporal focusing deviates from the GVD theory as shown in Supplementary Fig. 3(b).
References
S1. Marcuse, D. Pulse distortion in single-mode fibers. 3: Chirped pulses. 20,
3573 (1981).
S2. Agrawal, G. . Boston, fifth edition, (2013).