Magnifying the early episodes of star formation: super star clusters at cosmological distances
Abstract
We study the spectrophotometric properties of a highly magnified () pair of stellar systems identified at z=3.2222 behind the Hubble Frontier Field galaxy cluster MACS J0416. Five multiple images (out of six) have been spectroscopically confirmed by means of VLT/MUSE and VLT/X-Shooter observations. Each image includes two faint (), young ( Myr), low-mass (M⊙), low-metallicity (12+Log(O/H)7.7, or 1/10 solar) and compact (30 pc effective radius) stellar systems separated by pc, after correcting for lensing amplification. We measured several rest-frame ultraviolet and optical narrow ( km s-1) high-ionization lines. These features may be the signature of very hot ( K) stars within dense stellar clusters, whose dynamical mass is likely dominated by the stellar component. Remarkably, the ultraviolet metal lines are not accompanied by Ly emission (e.g., Civ / Ly ), despite the fact that the Ly line flux is expected to be 150 times brighter (inferred from the H flux). A spatially-offset, strongly-magnified () Ly emission with a spatial extent kpc2 is instead identified 2 kpc away from the system. The origin of such a faint emission can be the result of fluorescent Ly induced by a transverse leakage of ionizing radiation emerging from the stellar systems and/or can be associated to an underlying and barely detected object (with de-lensed). This is the first confirmed metal-line emitter at such low-luminosity and redshift without Ly emission, suggesting that, at least in some cases, a non-uniform covering factor of the neutral gas might hamper the Ly detection.
Subject headings:
cosmology: observations — galaxies: formation1. Introduction
The investigation of the ionizing properties of young, low mass star-forming systems
caught at , i.e., nearly 1 Gyr after reionization ended and the possible analogy with similar systems identified during
reionization () represents today a strategic line of research, especially at poorly explored, low-luminosity regimes (e.g., amorin17).
The detection of nebular high ionization emission lines
has underscored the considerable contribution of hot and massive stars to the transparency of the medium in low-luminosity () systems
(vanz16a), as expected in scenarios in which stellar winds and supernova explosions blow cavities in the interstellar
medium (e.g., jaskot13; micheva17).
In fact, the rest-frame ultraviolet and optical line ratios observed in , and galaxies
suggest a possible evolution of the ionizing radiation field, such that at high redshift the presence of hot stars seems more common,
with blackbody mean effective temperatures of the order of 50.000–60.000 K at (fosbury03; steidel14; holden16),
or even hotter at (stark15; mainali17).
Moreover, in very recent times, strong gravitational lensing has often been used to investigate the
physical properties of such intrinsically faint, low-mass systems.
Its use is now reaching its maturity thanks to dedicated deep imaging studies
in lensed fields (e.g., the Hubble Frontier Fields program, HFF hereafter, lotz14; lotz16; koekemoer14),
as performed on dropout galaxies (e.g., bouwens17)
and spectroscopic surveys (e.g., vanz14; stark14; karman17; cam16c; stark17; mainali17; vanz16a; vanz17b).
In this regard, the exceptional line flux sensitivity of the integral field spectrograph MUSE
mounted on the VLT
(bacon10)111www.eso.org/sci/facilities/develop/instruments/muse.html has driven considerable progress.
In fact, MUSE allows the identification and characterization
of extremely faint (and small) line emitters at , without the need of specific pre-selection of
the targets in a relatively large field of view (), aptly matching strongly magnified regions
of the sky. In these investigations,
strong lensing turned out to be essential for two reasons: (1) before the completion of the
Extremely Large Telescope (ELT), it is not possible to spatially resolve sources
with effective radii lower than 150 pc (mas) at in non-lensed fields.
Conversely, galaxy cluster lensing has already enabled us to perform light profile
fitting of dwarf and super star-clusters with radii pc at
(e.g., vanz16a; vanz17b; bouwens17);
(2) the increased S/N of the SEDs and emission lines
allows us to access the physical properties down to (intrinsic) magnitudes and
line fluxes of cgs.
MUSE observations on HFFs are leading us to the construction of a reference sample at of faint, star-forming compact analogues
of the systems active during cosmic reionization. Such a task is particularly important,
given the imminent launch of the James Webb Space Telescope (JWST), whose primary aim is to capture the first episodes of star formation at .
At the optical rest-frame is accessible from ground-based spectrographs and a large number
of strongly lensed systems have been identified (e.g., alavi16; cam16a; cam16c; cam16b; karman17),
allowing us to probe spectroscopically extremely low-luminosity and small mass regimes with unprecedented
detail (e.g., christ12; stark14; vanz16a).
Some of these systems have already provided a valuable insight of the physical conditions characterising newborn,
highly-ionized, dwarf galaxies (e.g., vanz16a; vanz16b) and extremely compact star clusters, presenting features very similar
to those expected during the formation of globular clusters (vanz17b).
A new intriguing system of this kind is that discussed here, i.e.,
a strongly lensed system at which shows high ionization lines detected behind the
HFF galaxy cluster MACS J0416 (cam16c).
Beside its compactness and its extreme faintness, the distinguishing feature of this system is the presence of strong ionization lines which
contrasts with the absence of Ly emission. These features are very rare among known local and distant star-forming systems
(e.g., stark14; stark15; henry15; mainali17; shibuya17; smit17).
The intriguing nature of our system and of its ionization structure
provides us with an insightful example of the geometrical complexity of high-redshift young, ionized systems.
The energy and the momentum continuously deposited by massive, young stellar associations can lead to puzzling structures
such as our object, which also represents a valuable benchmark for interstellar photo-ionization models.
In this work, we use the Hubble Frontier Fields HST-dataset222www.stsci.edu/hst/campaigns/frontier-fields/HST-Survey,
in particular three optical and four near-infrared bands: F435W, F606W, F814W (HST/ACS) and
F105W, F125W, F140W and F160W (HST/WFC3),
with typical limiting AB magnitudes 28.5 - 29.0 calculated at depth. In addition to the
seven HST bands, the publicly available Hawk-I@VLT s band and the Spitzer/IRAC 3.6 and
4.6 m data have also been included (the description of the
data-set, the extraction of the PSF-matched photometry and the construction of the photometric
catalog are provided in castellano16b and merlin16).
This paper is organized as follows. In Sect. 2, a brief description of the multiple-image magnification pattern of our system is presented. Our main results are presented in Sect. 3, and discussed in Sect. 4. Finally, in Sect. 5 some conclusions are drawn.
Throughout the paper, we assume a flat cosmology with = 0.3, = 0.7 and km s-1 Mpc-1.
2. ID14, a double lensed system
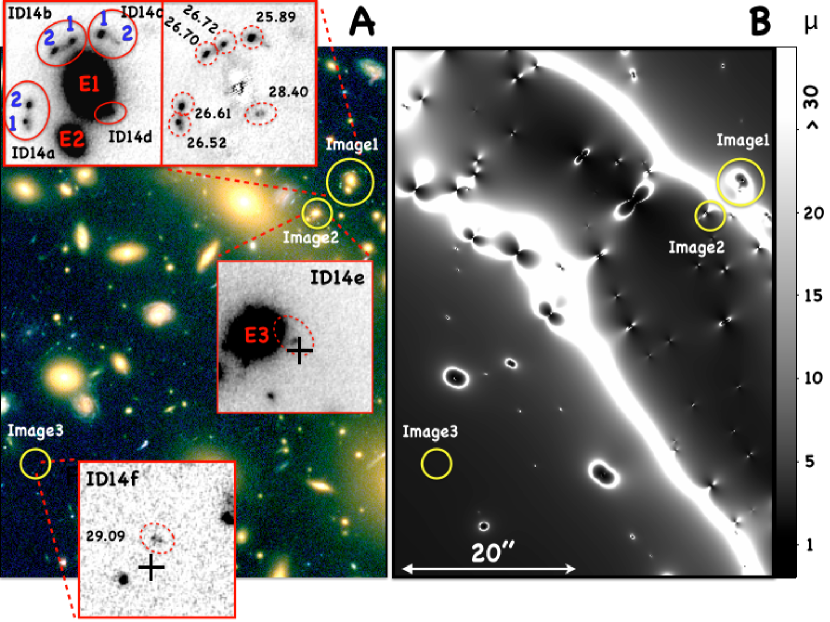
The source ID14 is multiply imaged by the cluster MACS J0416 into three images separated by up to . The location of these three images is given in the right panel of Figure 1 by the three yellow circles labelled Image1, Image2, and Image3. Image1 happens to be close to a pair of elliptical cluster members, indicated as E1 and E2 in the left panel of Figure 1. These galaxies act as strong lenses, further splitting Image1 into the four images ID14a, ID14b, ID14c, and ID14d. For consistency, in the following we will refer to Image2 and Image3 as ID14e and ID14f, respectively.
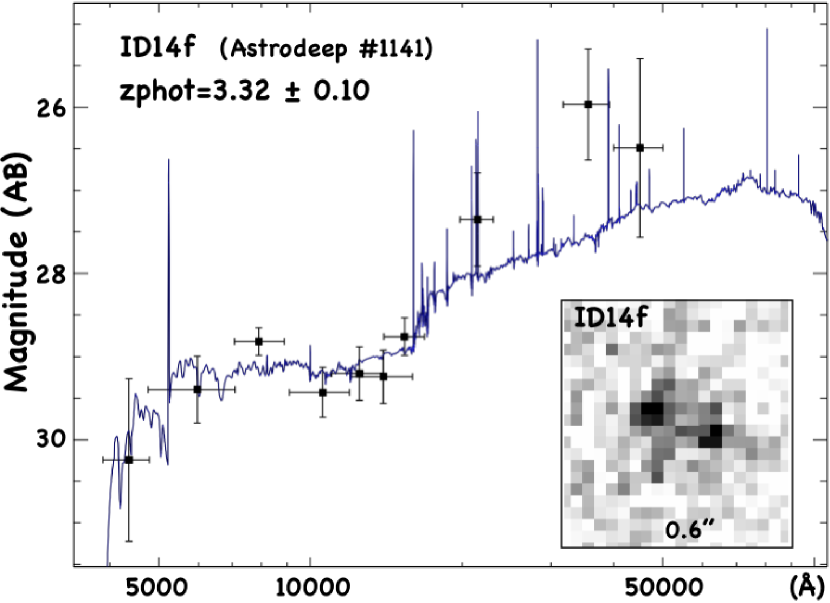
This system was first discovered by zitrin13. In each of the images, the source appears to consist of two bright knots. This morphological marker, together with the image geometry, allowed the first association of the images to the same source. The two knots are labelled “1” and “2” in Figure 1. As discussed in the next section, the images ID14a,b,c,d are spectroscopically confirmed. The association of Image3 with the sixth multiple image of ID14 (namely ID14f) is corroborated by the lens model recently presented by cam16c, which predicts the presence of an image at this location within uncertainty, i.e., . In addition, the photometric redshift of ID14f is (see Figure 2), which is fully consistent with the spectroscopic redshift of ID14.333The photometric redshift is also reported in castellano16b. In particular, an example of the best-fit SED for ID14f is shown at following address http://astrodeep.u-strasbg.fr/ff/?ffid=FFM0416CLid=1141.
For the analysis discussed in this paper, it is crucial to estimate the magnification of the brightest images of ID14, namely images and . For this goal, the lens model by cam16c could in principle be used. There are, however, two complications. The first is that these images are located in a region of high magnification. In a collaborative work which involved several groups employing different lens modeling algorithms, and among them the one used by cam16c, meneghetti17 recently showed that the model magnifications in this regime are affected by large uncertainties. For example, at the error on the local magnification estimates is . This is due to the strong magnification gradient near the critical lines. The second complication is that images ID14a,b,c are the result of a galaxy-galaxy strong lensing event. meneghetti17 also showed that the model uncertainties increase near cluster members.
For these reasons, instead of reading the magnifications off the map derived from the cam16c model, we opted to derive the magnifications of ID14a,b,c using the same method employed in vanz16a; vanz17b. meneghetti17 showed that magnification estimates are significantly more robust if . Using the lens model by cam16c, we estimate that the magnification of ID14f is . This estimate is consistent with others based on different models of MACS J0416, which we obtained from the Hubble Frontier Field Magnification calculator. If we assume that the model magnification of this image is secure, we can then derive the magnifications of the other images by means of the measured flux ratios.
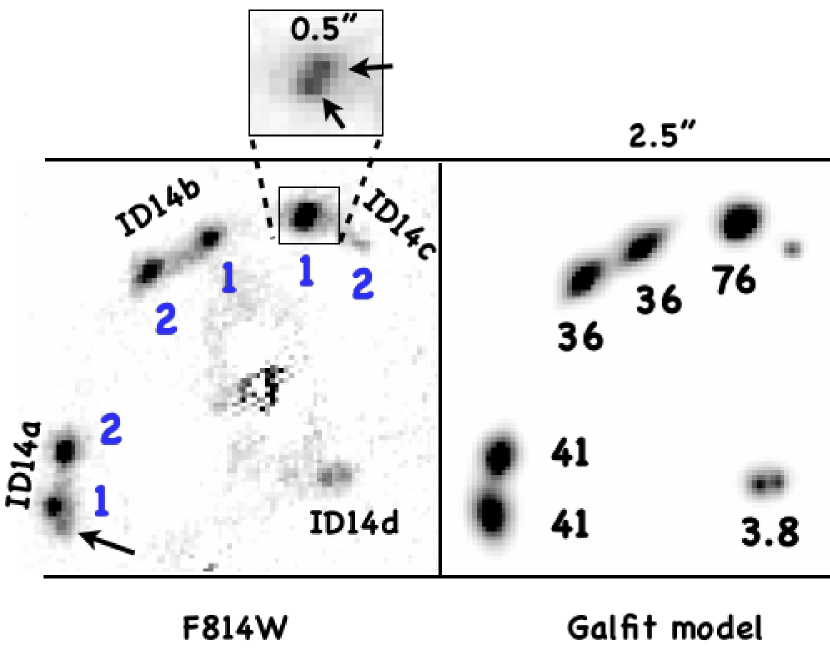
ID14f is identified with the Astrodeep object #1411 (ID1411) (castellano16b; merlin16). It is detected in the F814W, F105W, F125W, F140W and F160W bands, with an average magnitude of resulting from the sum of both components “1,2”. We computed multi-band, PSF-matched photometry of images ID14a,b,c as described in merlin16, but using the F814W band as detection image instead of F160W. HST photometry has been measured from 30mas pixel-scale images after subtracting the elliptical galaxies E1+E2 with Galfit (peng10). T-PHOT v2.0 (merlin16) has been used to measure K and IRAC photometry. An example of subtracted ellipticals in the F814W-band is shown in Figure 1 (top-left inset), where also the average magnitudes (over the five HST bands) are quoted for each component. For example, image ID14a is composed of two components “1,2” with magnitudes 26.52 and 26.61, respectively. The total magnitude, combining the two components, is 25.81. The total magnification for ID14a is therefore (ID14a)(ID14f) (flux[ID14a]/flux[ID14f]) . Similarly, (ID14b) and ID14c.1 (the component “1” only) is magnified by a factor . The errors estimated with this method are %, despite the large magnification regime. The de-lensed magnitude of ID14f(1+2) is 29.84. Assuming a flux ratio of between “1” and “2” (as observed in images ID14a and b), the intrinsic magnitude of each component is .
It is worth comparing the above values with those inferred directly from the Caminha et al. model and other independent models. The best estimates and the statistical errors from Caminha et al. for images ID14a(1) and ID14a(2) are and , respectively ( and for ID14b1 and 2). They change significantly if different and independent lens models are applied.444We used the Hubble Frontier Field Magnification calculator, https://archive.stsci.edu/prepds/frontier/lensmodels/ In particular, the magnifications of images ID14a(1) and ID14a(2) inferred from eleven lens models span the interval with medians . Also the reported uncertainties in each model are larger than 50%. The same happens also for the other strongly magnified images, ID14b and ID14c. The scatter among the various model predictions is of the order of the predicted magnifications, suggesting that the systematic errors dominate the uncertainties, especially in this complex double-lensed object (see meneghetti17 for a detailed discussion). Therefore, the method used in this work significantly decreases the uncertainties of the amplification factors and consequently limits the error budget on the intrinsic physical properties discussed in the next section.
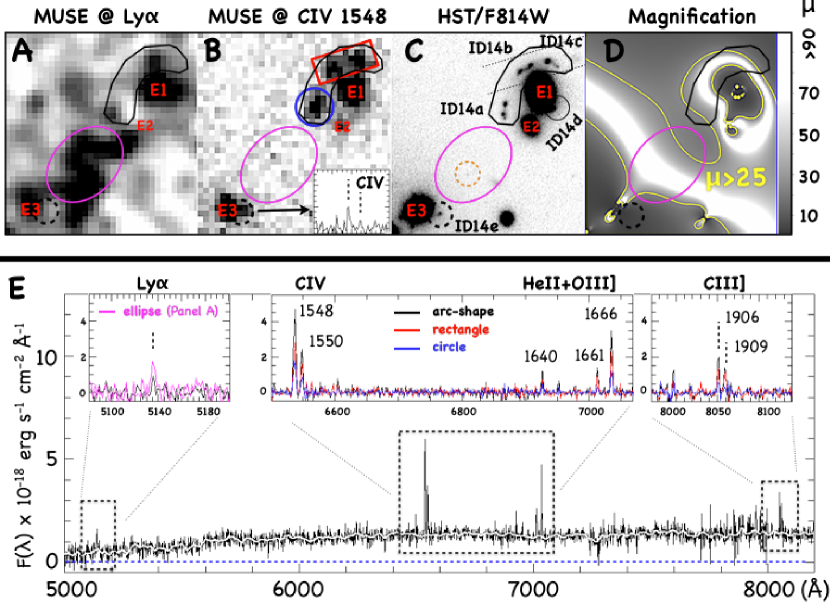
| line/ | []()() | [](EW) | Redshift |
|---|---|---|---|
| Ly 1215.69 | [0.24](2.5)(–) | [0.09]() | [M] (3.226) |
| [Civ] | [2.18](20.0)() | [0.87](16.9) | [M] 3.222 |
| [Civ] | [1.20](11.0)() | [0.48](9.3) | [M] 3.223 |
| Heii | [0.33](4.8)() | [0.13](2.8) | [M] 3.223 |
| Oiii] | [0.48](5.4)() | [0.19](4.3) | [M] 3.222 |
| Oiii] | [1.02](11.7)() | [0.41](9.2) | [M] 3.222 |
| [Ciii] | [0.55](6.2)() | [0.22](6.5) | [M] 3.223 |
| Ciii] | [0.45](5.1)() | [0.18](5.3) | [M] 3.222 |
| [Oii] | [](1) | – | [X] – |
| [Oii] | [](1) | – | [X] – |
| [Oii] | [](1) | – | [X] – |
| [1.06](3.7)(–) | [0.71](136) | [X] (3.2222) | |
| [Oiii] | [2.76](9.6)() | [1.84](367) | [X] 3.2222 |
| [Oiii] | [8.92](31.5)() | [5.95](1209) | [X] 3.2222 |
| Ly 1215.69 | [0.85](7.4)() | – | [M] 3.223 |