Spectroscopy of Ultra-diffuse Galaxies in the Coma Cluster
Abstract
We present spectra of 5 ultra-diffuse galaxies (UDGs) in the vicinity of the Coma Cluster obtained with the Multi-Object Double Spectrograph on the Large Binocular Telescope. We confirm 4 of these as members of the cluster, quintupling the number of spectroscopically confirmed systems. Like the previously confirmed large (projected half light radius 4.6 kpc) UDG, DF44, the systems we targeted all have projected half light radii kpc. As such, we spectroscopically confirm a population of physically large UDGs in the Coma cluster. The remaining UDG is located in the field, about Mpc behind the cluster. We observe Balmer and Ca II H & K absorption lines in all of our UDG spectra. By comparing the stacked UDG spectrum against stellar population synthesis models, we conclude that, on average, these UDGs are composed of metal-poor stars ([Fe/H] ). We also discover the first UDG with [OII] and [OIII] emission lines within a clustered environment, demonstrating that not all cluster UDGs are devoid of gas and sources of ionizing radiation.
Subject headings:
galaxies: distances and redshifts — galaxies: general — galaxies: stellar content1. Introduction
Ultra-diffuse galaxies (UDGs) are a class of spatially-extended, low surface brightness galaxy. To understand their physical nature and study them in the context of their environment, we require accurate distance measurements.
Spectroscopic redshifts have been measured for 4 galaxies categorized as UDGs since the renewed interest in extreme low surface brightness galaxies in 2015. Of the population discovered in proximity to the Coma Cluster, DF44 ( ; ) is the only UDG spectroscopically confirmed as a Coma member (van Dokkum et al., 2015b). Likewise, a spectroscopic redshift measurement places VCC 1287 ( ; ) in the Virgo Cluster (Beasley et al., 2016) and DGSAT I ( ; ) in a low density filament of the Pisces-Perseus Supercluster (Martínez-Delgado et al., 2016), identifies UGC 2162 as the nearest UDG (Trujillo et al., 2017). While DF44 and VCC 1287 are projected near their associated galaxy clusters, other apparent close associations can be misleading, as demonstrated by Merritt et al. (2016). All coordinates listed in this paper are given in J2000.
In addition to providing the critical distance measurement, spectra provide information on the current stellar populations and star formation history of these galaxies. For example, van Dokkum et al. (2015b) noted that the spectrum of DF44 is similar to that of early-type galaxies, with Balmer and G-band absorption lines, concluding that DF44 is a quiescent galaxy with no significant on-going or recent star formation. Such findings inform the development of models for the origin and evolution of these systems. We aim to determine if there does exist a class of physically extended UDGs, like DF44, in significant numbers in the cluster environment and if these galaxies are exclusively quiescent, old galaxies. In §2 we describe the observations and data analysis. In §3 we present the redshift measurements and interpret the spectra. Throughout we adopt a standard CDM cosmology with , , and .
2. Data
We selected UDGs to observe from the van Dokkum et al. (2015a) sample of 47 candidates projected near the Coma Cluster. In particular, we selected luminous ( mag) and large UDGs (with projected half light radii, , larger than 2.9 kpc assuming the UDG is in Coma) to focus on those analogous to DF44. Only 18 UDGs from the parent sample satisfy both the size and luminosity criteria. Finally, we had to require that potential targets have a nearby guide star brighter than that is suitably located for the guide probe. Our final sample contained 10 candidate targets, of which we observed six. We list the observed UDGs and relevant parameters in Table 1.
On 2016 March 9 and 10 we observed in mostly clear conditions using the Multi-Object Double Spectrograph (MODS; Pogge et al., 2010) on the Large Binocular Telescope (LBT) prior to the binocular mode being operational. Because UDGs have relatively flat surface brightness profiles, we opted to use a wide slit to increase the amount of light collected, at the expense of spectral resolution. We used a custom 2.4″-wide slit, twice as wide as the largest previously available long slit. We observed each target for 60 to 90 minutes, combining multiple 30 minute dithered exposures, simultaneously using the G400L grating (400 lines mm-1 blazed at centered on 4000Å with a resolution of 1850) in the blue channel (3200-5800 Å) and the G670L grating (250 lines mm-1 blazed at centered on 7600Å with a resolution of 2300) in the red channel (5800-10000 Å). We do not use the red channel data due to higher sky brightness.
We reduced the spectra using the MODS data reduction pipeline (Pogge et al., 2010). Reduction includes the standard steps of overscan correction, 2D bias subtraction, dark current subtraction, flat fielding, wavelength calibration, sky subtraction, flux calibration, and extraction. Because we use the MODS long-slit, over 80% of the slit is clear sky, allowing for high S/N sky subtraction using the two-dimensional fitting available in the standard pipeline. Our final spectra have a S/N in the continuum ranging from 3 to 8 per pixel. These are therefore fairly low S/N spectra. We obtained these redshift-quality spectra for six targets, but exclude DF17 from further discussion because ultimately we were unable to measure a redshift.
| UDG | RA | Dec | bbfootnotemark: | |||||
|---|---|---|---|---|---|---|---|---|
| (J2000) | (J2000) | (arcmin) | (mag arcsec-2) | (kpc) | (mag) | (min) | (km s-1) | |
| DF03ccfootnotemark: | 66.9 | 90 | ||||||
| DF07 | 44.3 | 90 | ||||||
| DF08 | 32.6 | 60 | ||||||
| DF17 | 29.9 | 90 | … | |||||
| DF30 | 88.8 | 60 | ||||||
| DF40 | 53.1 | 60 |
3. Results
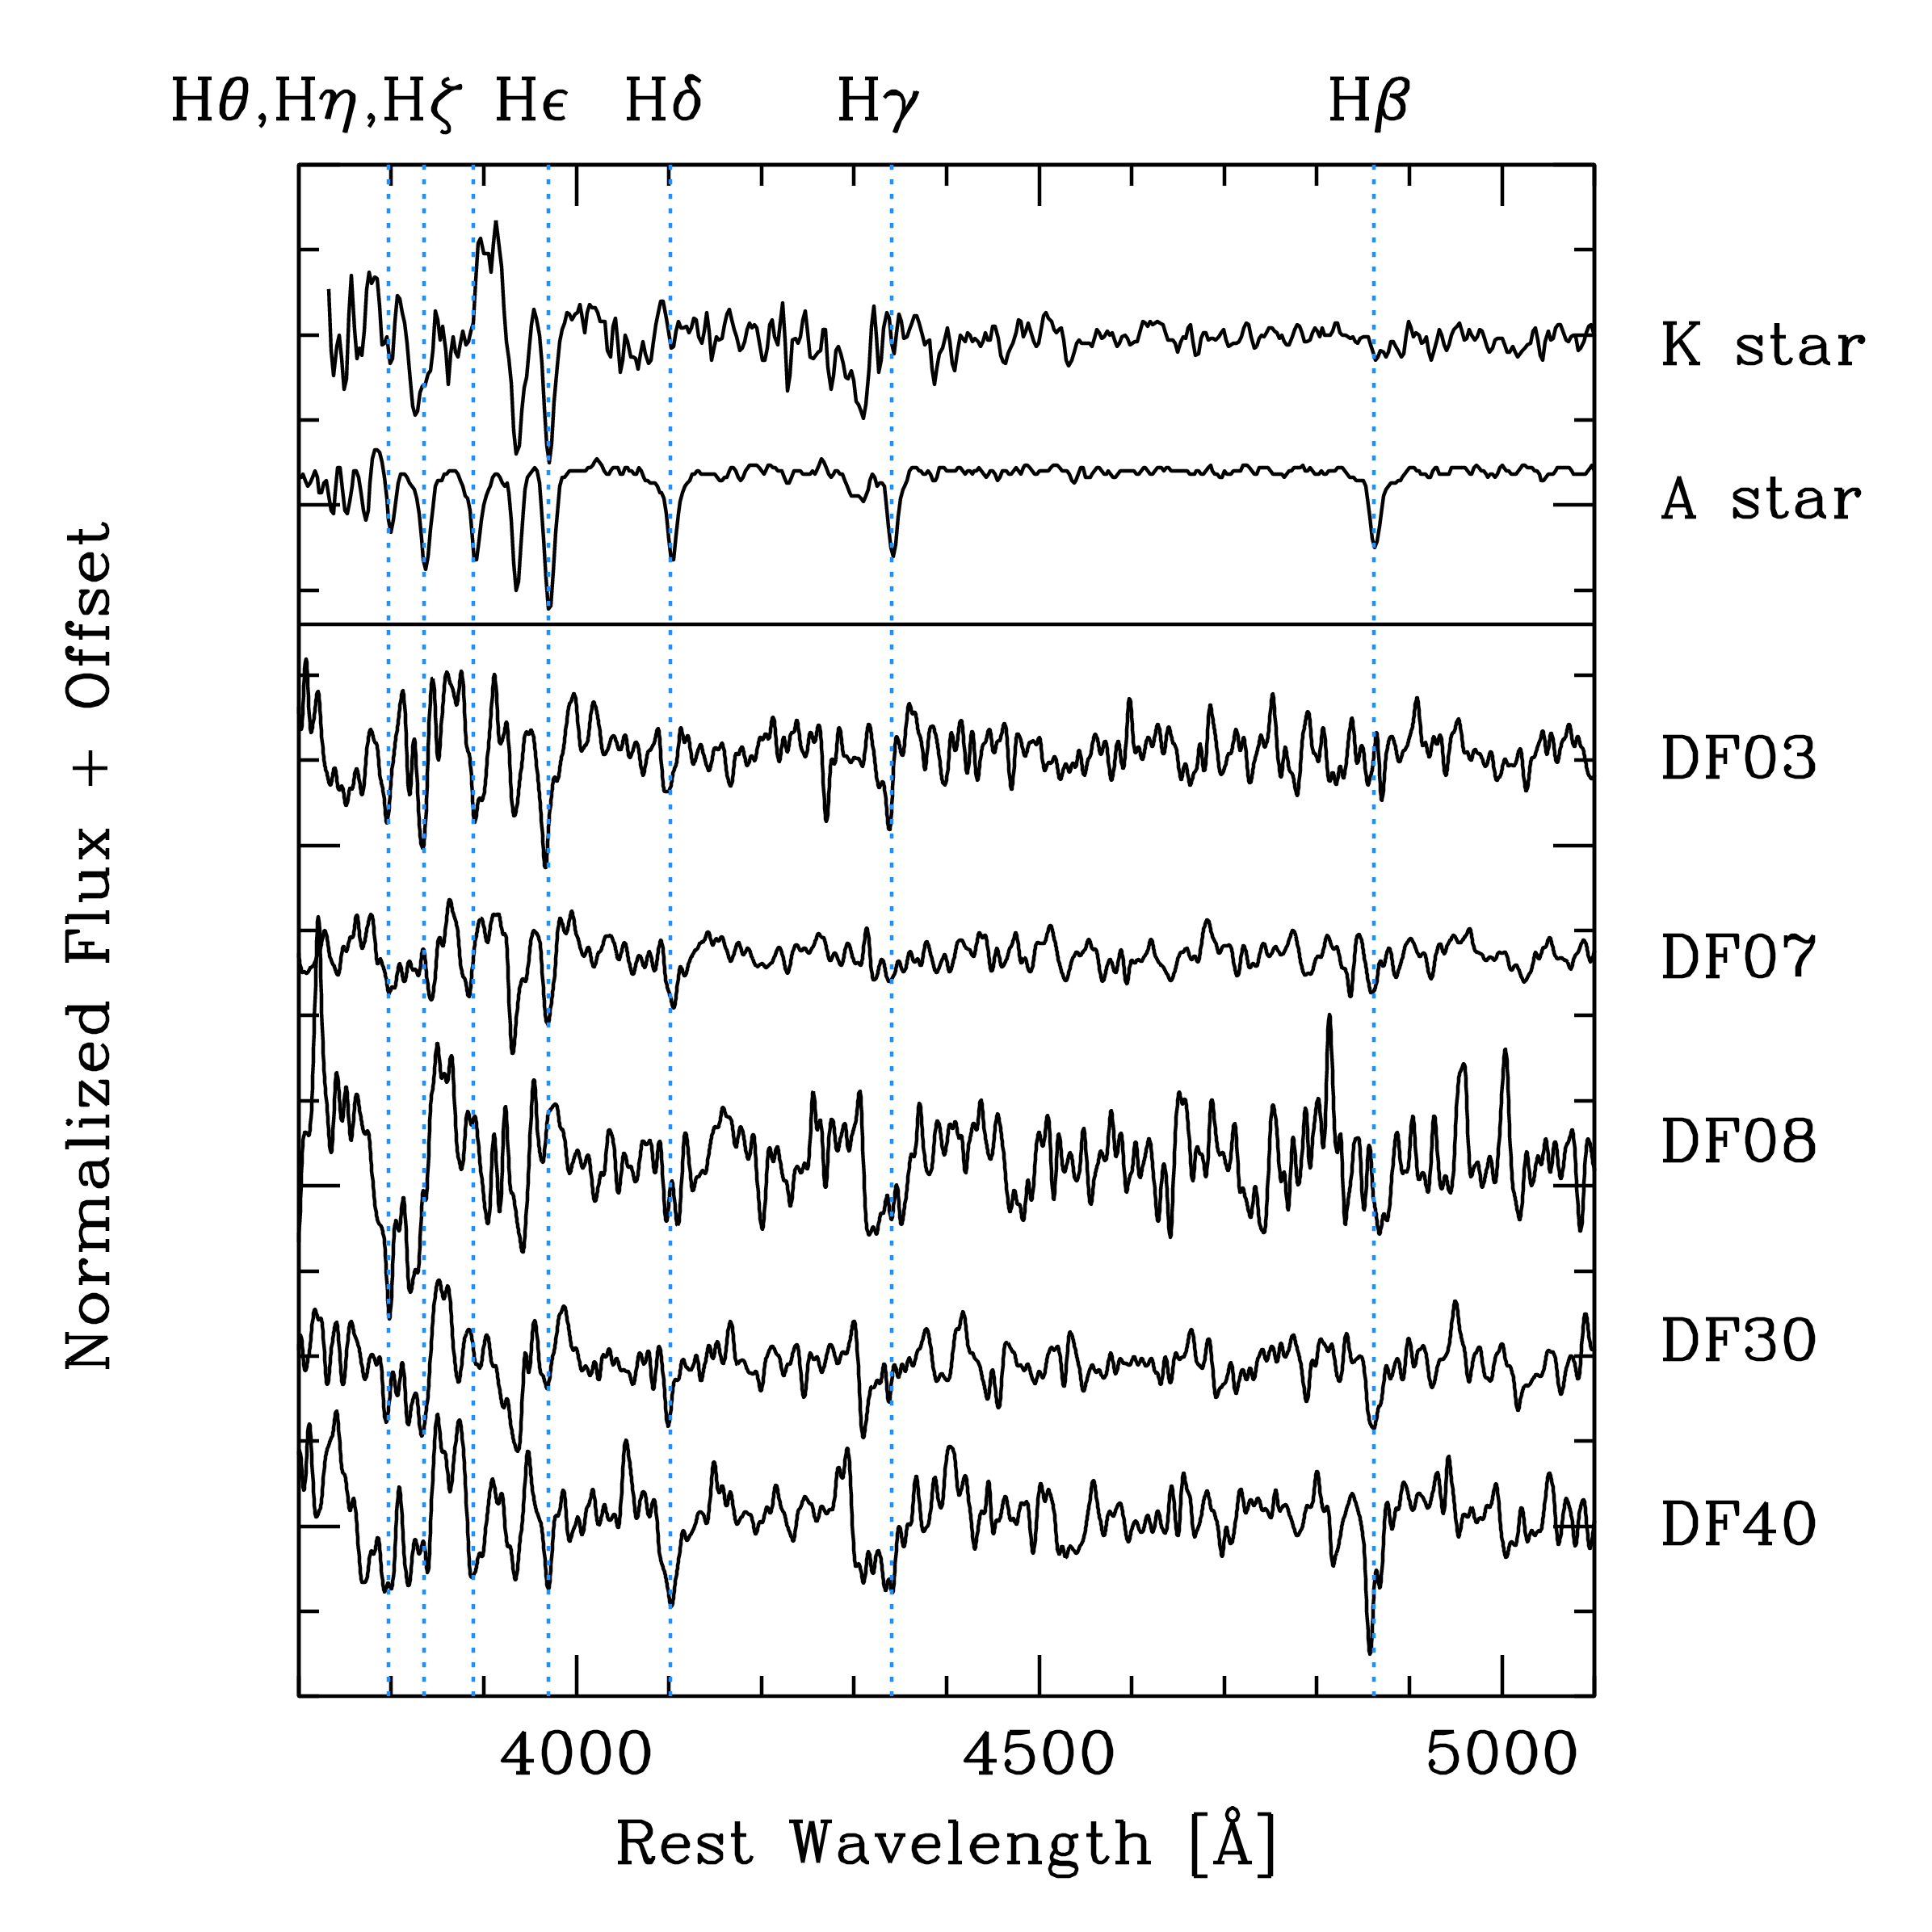
We now describe our measurement of the individual recessional velocities of the UDGs and examine the nature of the spectra, both in terms of the individual spectra and a combined stack. We confine our discussion to the blue channel spectra (Figure 1). The most prominent absorption features in the UDG spectra are the Balmer absorption lines, the Ca II H & K lines just blueward of restframe 4000 Å and the G-band at about 4300 Å. These features are also prominent in the published spectrum of DF44 (van Dokkum et al., 2015b).
3.1. Redshifts and Coma Cluster Membership
We measure redshifts and uncertainties by cross-correlating the UDG spectra against spectral templates. The ubiquity of Balmer lines suggests that an A-type stellar spectrum would be an ideal template, although the Ca lines and G-band suggest that later type stars might also be suitable. As such, we use both, but generally find more significant results using the A-type template, with velocities differing by no more than 60 km s-1 between templates in most cases, with one exception at 120 km s-1.
We use the IRAF111IRAF is distributed by the National Optical Astronomy Observatory, which is operated by the Association of Universities for Research in Astronomy (AURA) under a cooperative agreement with the National Science Foundation. task XCSAO for the cross-correlation analysis. We vary parameters, including the high and low frequency cutoffs, while searching velocities between and ) for the correlation function maximum. We only accept velocities that are robust to changes in the input parameters and then visually confirm that multiple absorption lines correspond to the principal absorption features that we mention above. We extract high confidence redshifts from the spectra of 5 out of the 6 observed UDGs. For the sixth, we do not even extract a low confidence redshift estimate.
Because of heliocentric velocity corrections, differences in slit illumination, and wavelength calibration errors, it is possible for template stars to have effective reference velocities that differ by several tens of km s-1 from the published values. Such uncertainties are irrelevant when determining whether galaxies lie within the Coma cluster, but the surprising availability of emission lines in one of our spectra allows us to correct the velocity zero point and also provides a test of the absorption line cross-correlation procedure. We will discuss this interesting object further below.
We compare emission and absorption redshifts for DF08 to estimate the external uncertainties of the stellar cross correlation analysis. We find an offset of 220 km s-1 between the recessional velocities measured from cross-correlation with spectral templates and from the shift in [OII] and [OIII] lines with restframe wavelengths in air of 3726.05, 3728.80, 4958.92, 5006.85 Å (about 2 discrepant given the internal error estimate). Differences among the cross-correlation results using different templates for all of our UDGs are 120 km s-1. We conclude that even if our uncertainties are truly as large as 200 km s-1, our conclusions regarding membership in Coma for these UDG candidates is unchanged.
We convert the spectra of the five UDGs from observed to rest frame, subtract the continua, and display them in Figure 1. The best-fit UDG recessional velocities and uncertainties are listed in Table 1.
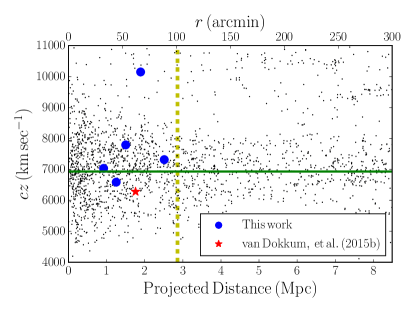
To determine Coma cluster membership, we place the UDGs on the cluster phase-space diagram, which we construct using measurements of galaxies retrieved from the NASA Extragalactic Database (Figure 2). There are enough known Coma members that they clearly delineate the classic wedge distribution defined by the caustic curves. Four of our UDGs (DF07, DF08, DF30, and DF40), plus the previously measured DF44, fall within the caustics and we conclude these are bona fide members. Another of our UDGs (DF03) lies well outside the caustic curves and we conclude that this system is 45 Mpc behind the cluster. From the statistics that 5 out of the 6 UDGs with measured redshifts lie within Coma and restricting ourselves to systems that satisfy our selection criteria, we conclude that of the 18 van Dokkum et al. (2015a) systems that satisfy our size and magnitude criteria, are likely to be Coma cluster members. We conclude that there is a significant population of physically large cluster UDGs. We do not interpret the phase-space diagram further because the radial selection effects in the original catalog are likely to be significant.
3.2. Stellar Populations and Metallicity
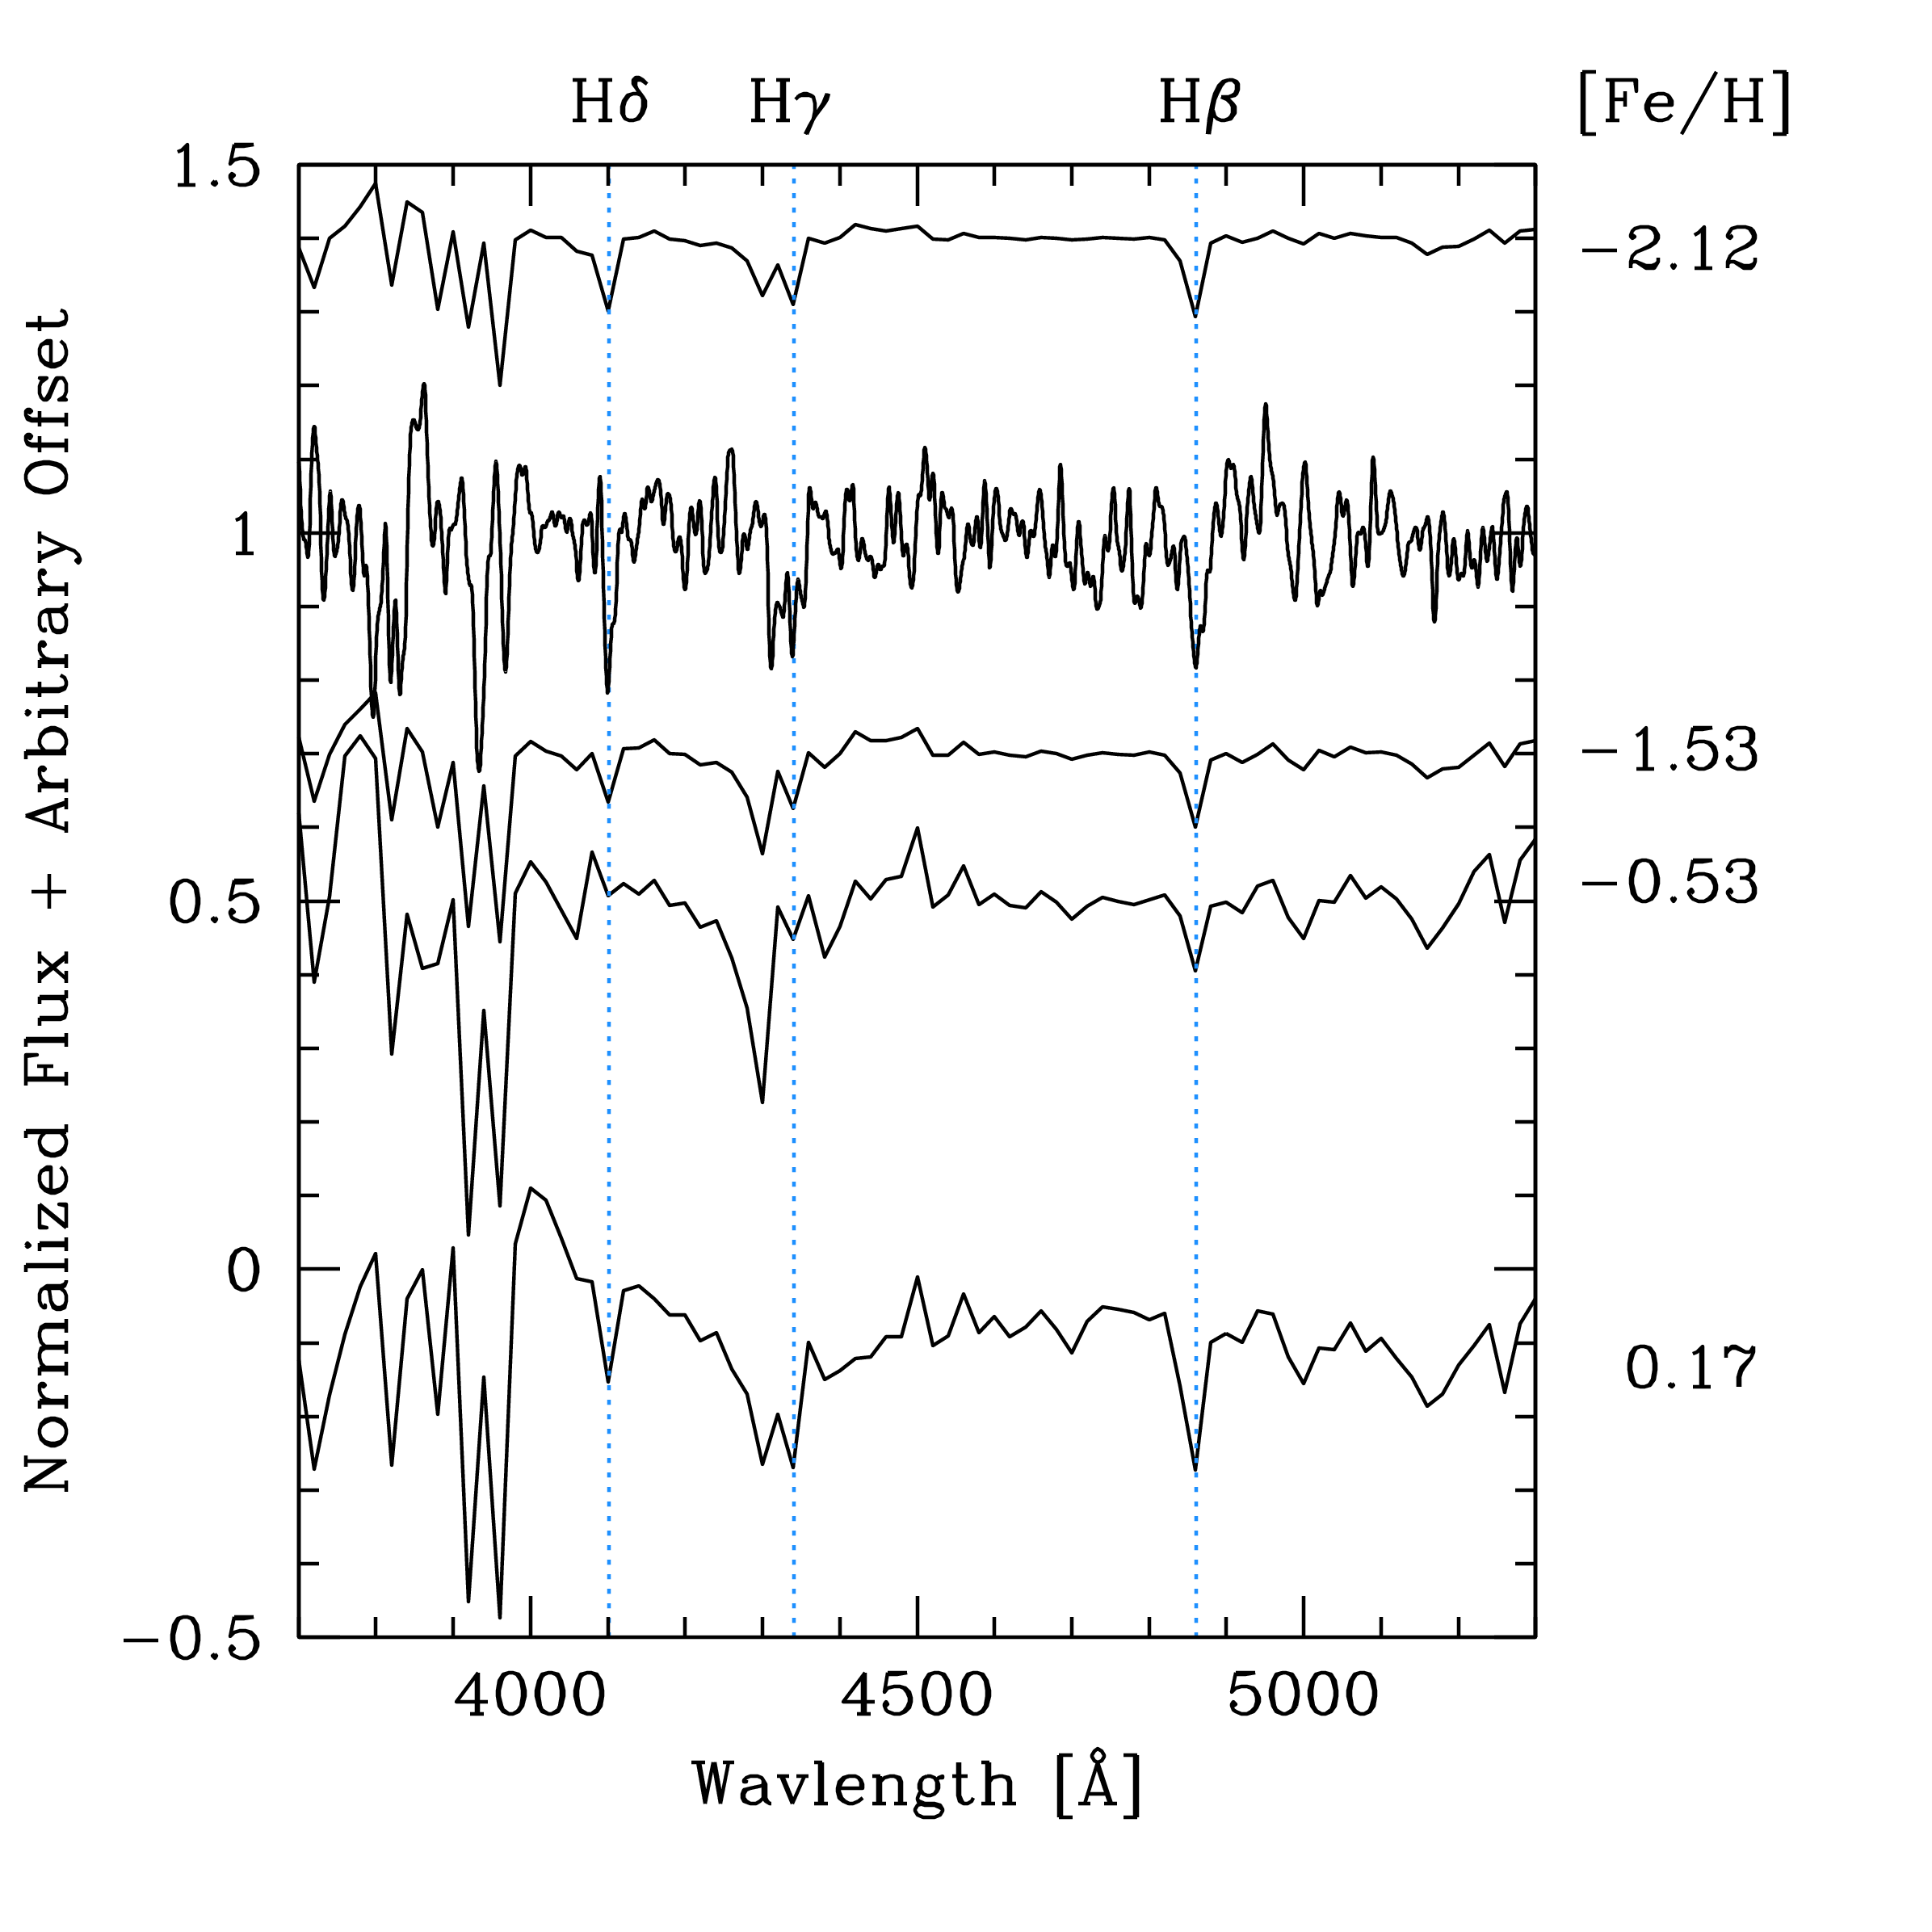
The presence of Balmer lines in galaxy spectra is often interpreted as evidence for intermediate age (1 Gyr) populations, but can also be the result of low metallicity. We suspect the latter is the case in these galaxies given their red colors as a population (Koda et al., 2015). To explore this issue further, we combine the spectra to produce a higher signal-to-noise spectrum (Figure 3), but caution that this approach caries a risk that we are combining systems with different properties.
We use the PÉGASE stellar population modeling software (Fioc & Rocca-Volmerange, 1997) to create comparison spectra for single age (13 Gyr) populations with three different metallicities (Figure 3). We visually place the stacked spectrum in the abundance sequence. In particular, we focus on the strength of the H line and the ratio of the H line to the G-band, which lies just to the blue of H. This analysis is clearly a preliminary determination of the typical metallicity of such UDGs, and a composite one at that, but the indications are that these are quite metal poor ([Fe/H] ).
For comparison, we also identify the optimal match for a young, 1 Gyr, population in Figure 3. We prefer the models with old, metal poor populations for several reasons. First, the spectrum of the young population matches H and HG-band, but results in an H & K break that is too strong, as seen by the peak at around 4000Å, and a Mg and Fe complex at about 5200Å that is not in the observed spectra. Second, the low metallicity estimate for these galaxies agrees with a simple expectation from the metallicity-luminosity relation (Zaritsky et al., 1994, (ZKH)). For early type galaxies, is roughly (Fukugita et al., 1995), which places our typical UDG with at and at about an [Fe/H] of in the relationships plotted in Figure 13 of ZKH. Finally, independent measurements of the metallicity in similar galaxies has also concluded that these systems are of low metalliity (Makarov et al., 2015). We conclude, based on the low metallicites, that these UDGs are not the tidal remnants of much larger galaxies.
3.3. Emission Lines
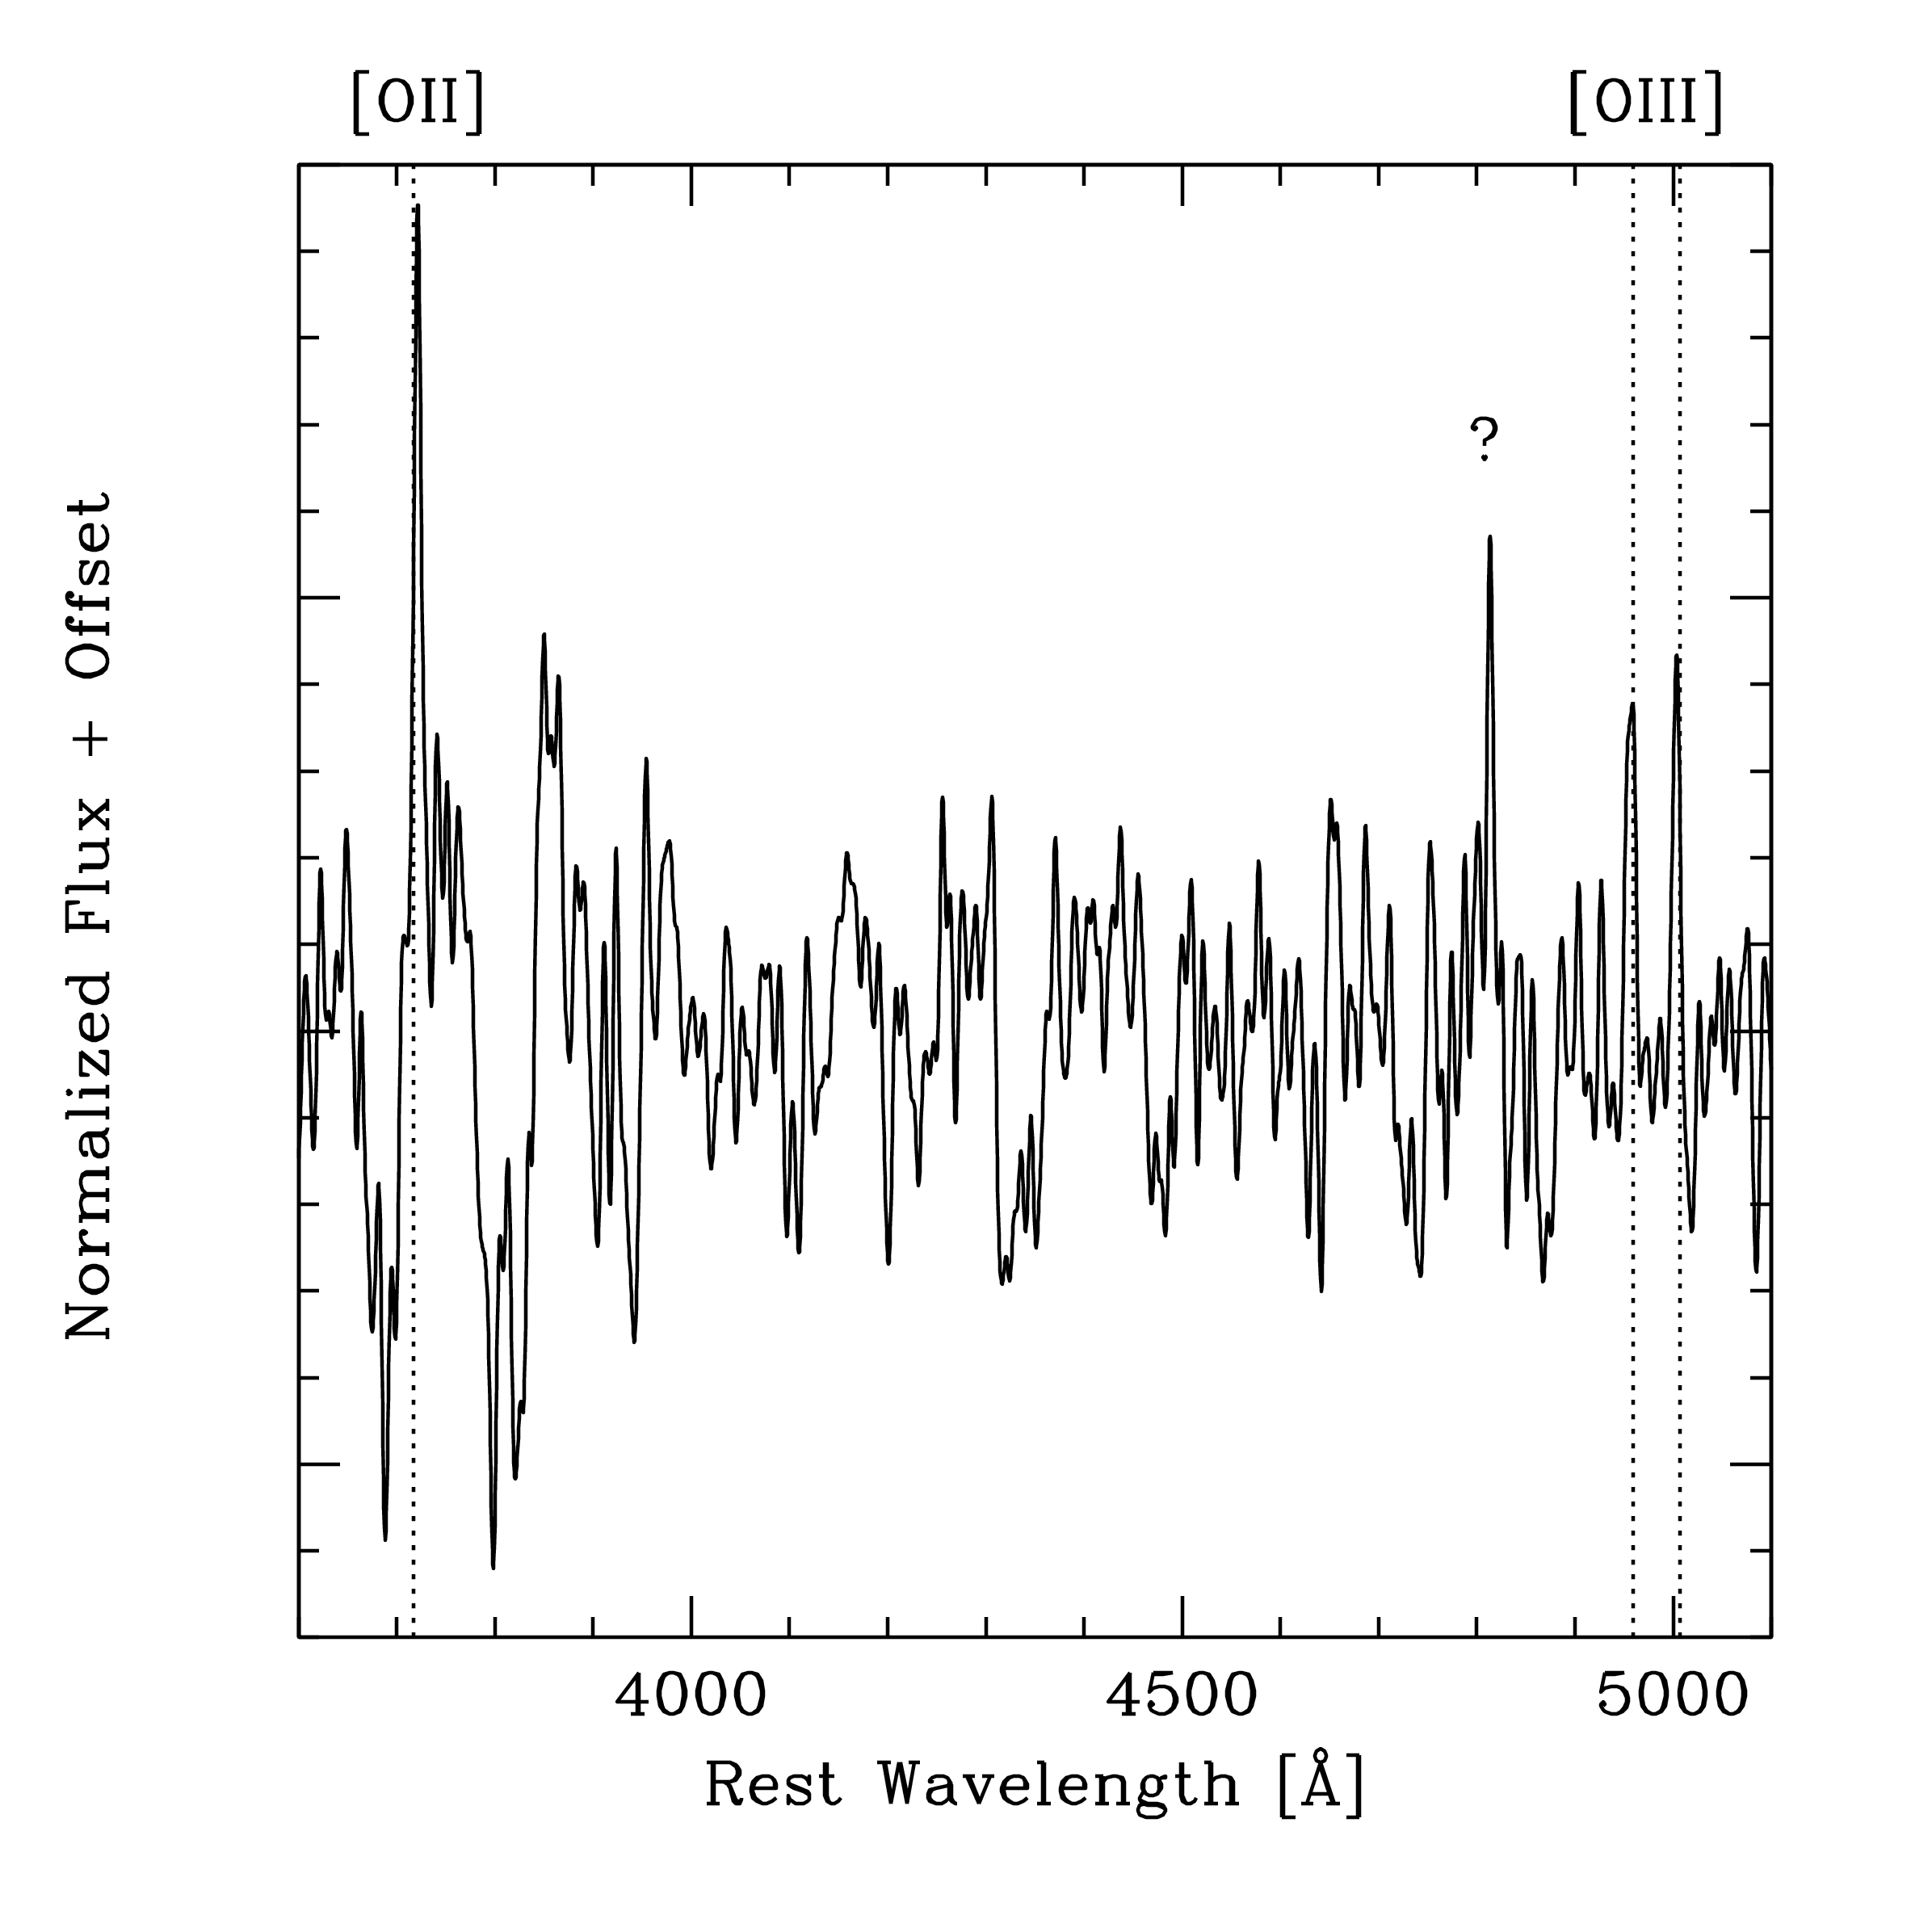
While absorption features are common in previously observed UDG spectra (van Dokkum et al., 2016; Martínez-Delgado et al., 2016), emission lines have been found only in one gas rich UDG (Trujillo et al., 2017). Surprisingly, we have a weak detection of oxygen in one of the Coma UDGs in our sample. In Figure 4 we show a spectrum of DF08, which features weak [OII] and [OIII] emission lines at a redshift consistent with the absorption line redshift. The existence of these lines indicates that DF08 is not entirely gas-depleted nor devoid of ionizing sources. We are unable to localize a specific source in the 2D spectrum, so we conclude that the emission is somewhat physically extended. Emission lines may become a more common signature of UDGs as field samples are explored (Di Cintio et al., 2017; Trujillo et al., 2017) and establishing the differences between field and cluster UDG samples is a clear next step.
4. Conclusions
We present spectroscopy of five UDGs seen in projection on the Coma Cluster with the MODS spectrograph on the LBT and reach the following conclusions.
-
•
On the basis of their recessional velocities, we confirm 4 of our UDGs to be Coma cluster members, thereby quintupling the population of spectroscopically confirmed Coma UDGs.
-
•
On the basis of its recessional velocity, we place another of our UDGs about 45 Mpc behind the Coma cluster. Along with DGSAT I, DF03 is one of the few field UDGs with a spectroscopic redshift.
-
•
Coupled with the spectroscopic confirmation of DF44 (van Dokkum et al., 2015b), the result that 5 of 6 spectroscopically observed, physically large (projected half light radius 2.9 kpc) UDGs from the van Dokkum et al. (2015a) catalog are bona fide cluster members suggests that of the 18 similarly large Dragonfly UDGs are Coma members.
-
•
On the basis of a comparison between PÉGASE stellar population synthesis models and our composite UDG spectra, we conclude that, on average, these systems are metal-poor ([Fe/H] ). These systems are consistent with the metallicity-luminosity relation and the result excludes the possibility that these systems are the relics of much more luminous galaxies.
-
•
We present the first cluster UDG (DF08) spectrum with emission lines. This finding demonstrates that not all cluster UDGs lack gas and sources of ionizing radiation.
References
- Beasley et al. (2016) Beasley, M. A., Romanowsky, A. J., Pota, V., Navarro, I. M.,, Martinez Delgado, D. Neyer, F. & Deich, A. L., 2016a, ApJ, 819, 20
- Di Cintio et al. (2017) Di Cintio, A., Brook, C. B., Dutton, A. A., Macciò, A. V., Obreja, A., & Dekel, A., 2017, MNRAS, 466, 1L
- Fioc & Rocca-Volmerange (1997) Fioc, M. and Rocca-Volmerange, B., 1997, A&A, 326, 950
- Fukugita et al. (1995) Fukugita, M., Shimasaku, K., & Ichikawa, T. 1995, PASP, 107, 945
- Koda et al. (2015) Koda, J., Yagi, M., Yamanoi, H. & Komiyama, Y., 2015, ApJ, 807, 2
- Kubo et al. (2007) Kubo, J., Stebbins, A., Annis, J., Antonio, I. P. D., Lin, H., Khiabanian, H. & Frieman, J. A., 2007, ApJ, 671, 1466
- Makarov et al. (2015) Makarov, D. I., Sharina, M. E., Karachentseva, V. E., Karachentsev, I. D., A&A, 581, A82
- Martínez-Delgado et al. (2016) Martínez-Delgado, D., Läsker, R., Sharina, M., Toloba, E., Fliri, J., Beaton, R., Valls-Gabaud, D., Karachentsev, I. D., Chonis, T. S., Grebel, E. K., Forbes, D. A., Romanowsky, A. J., Gallego-Laborda, J., Teuwen, K., Gómez-Flechoso, M. A., Wang, J., Guhathakurta, P., Kaisin, S., Ho, N., 2016, \ap, 151, 96
- Merritt et al. (2016) Merritt, A., van Dokkum, P., Danieli, S., Abraham, R., Zhang, J., Karachentsev, I. D., & Makarova, L. N., 2016, ApJ, 833, 168M
- Pogge et al. (2010) Pogge, R. W. et al., 2010, Proc. SPIE, 7335, 9
- Trujillo et al. (2017) Trujillo, I., Román, J., Filho, M. & Sánchez Almeida, J., 2017, arXiv:1701.03804
- van Dokkum et al. (2015a) van Dokkum, P. G., Abraham, R., Merritt, A., Zhang, J., Geha, M., & Conroy, C., 2015, ApJ, 798, 45
- van Dokkum et al. (2015b) van Dokkum, P. G., Romanowsky, A. J., Abraham, R., Brodie, J. P., Conroy, C., Geha, M., Merritt, A., Villaume, A., & Zhang, J., 2015, ApJ, 804, L26
- van Dokkum et al. (2016) van Dokkum, P., Abraham, R., Brodie, J., et al., 2016, ApJ, 828, L6
- Wright (2006) Wright, E. L., 2006, PASP, 118, 1711
- Zaritsky (2017) Zaritsky, D., 2017, MNRAS, 464, 110L
- Zaritsky et al. (1994) Zaritsky, D., Kennicutt, R.C., Jr., & Huchra, J.P, 1994, ApJ, 420, 87