Characterization of the VVV Survey RR Lyrae Population across the Southern Galactic Plane
Abstract
Deep near-IR images from the VISTA Variables in the Vía Láctea (VVV) Survey were used to search for RR Lyrae stars in the Southern Galactic plane. A sizable sample of 404 RR Lyrae of type ab stars were identified across a thin slice of the 4th Galactic quadrant (, ). The sample’s distance distribution exhibits a maximum density that occurs at the bulge tangent point, which implies that this primarily Oosterhoff type I population of RRab stars does not trace the bar delineated by their red clump counterparts. The bulge RR Lyrae population does not extend beyond , and the sample’s spatial distribution presents evidence of density enhancements and substructure that warrants further investigation. Indeed, the sample may be employed to evaluate Galactic evolution models, and is particularly lucrative since half of the discovered RR Lyrae are within reach of Gaia astrometric observations.
=1 \fullcollaborationNameThe Friends of AASTeX Collaboration
1 Introduction
Optical surveys (e.g. OGLE, La Silla Quest, LINEAR, Catalina, and other Surveys) have identified thousands of RR Lyrae stars, which are key tracers of old and metal-poor regions of the Galaxy. In particular, RR Lyrae (1) are excellent reddening indicators, as the stars span a narrow range of intrinsic colors; (2) are primary standard candles that adhere to well-defined period-luminosity relations; and (3) the pulsators are proxies for age and metallicity, as they constitute an old (age Gyr) and metal-poor demographic linked to the primordial stellar population of the Milky Way. This class of variable stars was used to characterize various components of the Milky Way, including the halo (Miceli et al., 2008; Drake et al., 2014; Vivas & Zinn, 2006; Helmi, 2008; Helm et al., 2011, etc.), the bulge (Alcock et al., 2010; Kunder et al., 2008; Dékány et al., 2013; Pietrukowicz et al., 2015; Gran el al., 2016, etc.), the Solar neighbourhood (Layden, 1994, 1998), and the outer thick disk towards the anticenter (Sesar et al., 2013). RR Lyrae could be used as tracers of accreted galaxies which might have contributed to the formation of the inner stellar halo-bulge transition region as suggested by hydrodynamical simulations of MW mass-like galaxies (Tissera et al. 2017).
In a pioneering work Layden (1994) presented a catalog of RR Lyrae within 5.5 kpc of the Sun, and the sample subsequently became a suite of well-studied local calibrators. Yet, it is challenging to identify RR Lyrae throughout the complex Galactic plane region beyond the Solar neighborhood and toward the inner disk, where sizeable extinction can render the apparent magnitude beyond the faint limit of most optical surveys.
VISTA Variables in Via Láctea (VVV), a deep near-infrared (NIR) survey, was consequently carried out to identify and characterize RR Lyrae stars in some of the most crowded and reddened regions of the Galaxy. The survey sampled 562 sq. deg. of the bulge and the southern disk (Minniti et al., 2010; Saito et al., 2012; Hempel et al., 2016) enabling discovery of numerous classes of variable stars concurrently with the RR Lyrae variables, such as bright LPVs/Miras, eclipsing binaries, Cepheids, and microlensing events (Catelan et al., 2013; Minniti et al., 2015). RR Lyrae stars are the focus of the present study, which are concentrated on the lower latitude of the southern disk and its substructures.
The present search for new RR Lyrae candidates expands in part upon our previous work. Dékány et al. (2013) studied bulge RR Lyrae by combining optical with NIR photometry, and discovered that the inner bulge RR Lyrae do not display the barred structure traced by red clump giants, but rather trace an inner spheroidal component. Gran el al. (2016) searched for new RR Lyrae in the bulge-halo transition region, and identified 1019 new RR Lyrae type ab variables (RRab) measuring their parameters that included reddening and distance. Those outer bulge RR Lyrae likewise did not adhere to a barred structure. The present work describes the results based on an extended search for RRab stars at low latitudes, whose broader objective is to map the outer bar region and the inner disk. We present the discovery of 404 new RRab stars, which occupy a low latitude slice across the Galactic plane.
This paper is organized as follows. Section 2 describes the selection of the RR Lyrae stars, while Section 3 presents color-magnitude diagrams (CMDs) for our sample. Section 4 discusses the reddening and extinction estimates established, whereas the computed distances are provided in Section 5, which likewise includes a discussion concerning the sample’s spatial distribution. In Section 6 we discuss the inferred metallicity estimates, and Section 7 presents a comparison with other RR Lyrae populations. Finally, the conclusions are summarized in Section 8.
2 The VVV Survey RR Lyrae Selection
The NIR VVV Survey observations (Minniti et al., 2010; Saito et al., 2012; Hempel et al., 2016) were acquired with the VIRCAM camera at the VISTA 4.1 m telescope at ESO Paranal Observatory (Emerson & Sutherland 2010). In the disk fields typically 70 epochs of observations were acquired in the -band between years 2010 and 2015, plus complementary single epoch observations in the bands. The 16 NIR detectors of VIRCAM produce an image of 11.6’11.6’ and a pixel scale of 0.34”/pixel. The deep multi-epoch band photometry allows us to unveil faint variable sources deep in the disk regions of our Galaxy (Figure 1). A search for RRab stars was made throughout tiles d001 to d038 of the VVV survey’s disk field, which is a thin slice through the Galactic plane spanning , and . The total area covered is nearly 57 sq.deg, and the limiting magnitude in the specified tiles spans 17.5 to 18.5 mag in the Ks-band (see the tile positions and maps of Saito et al., 2012).
The search concentrated on RRab stars, because these objects are readily identifiable via their asymmetric light curves, which feature a saw-tooth morphology (Layden, 1997). Contrarily, RRc variables feature more sinusoidal light curves, and increased contamination can occur from numerous short period eclipsing binaries that have similar light curve morphology. As a matter of fact, RRc type are about as numerous as RRab type stars in an Oosterhoff I population, and future searches must consider additional properties to select bona fide samples of the former. Amplitudes of NIR RR Lyrae light curves are one third of those in the optical (e.g Navarrete et al., 2015).
The procedures outlined by Gran el al. (2015) and Alonso-García et al. (2015) were adopted to identify RRab variables. Approximately 130,000 variable star light curves were inspected, and the final selection required for periodic objects to fulfill the following criteria: periods spanning days, displaying amplitudes of mag, and featuring mean magnitudes of . A limit on the maximum amplitude was not imposed since the analysis of the observed amplitudes have shown that sometimes they tend to be larger than the real amplitude values due to observational scatter. Moreover, RRab variables possessing periods in excess of one day are known to exist, yet such objects display smaller amplitudes in general and are therefore challenging to identify. The final suite of phased light curves (following Dékány et al., 2013) were subsequently visually inspected (e.g., to ensure that they were asymmetric).
The final sample presented here includes 404 objects in total, spread over in 57 sq.deg. Nearly 700 RRab stars were originally identified, and low quality candidates were subsequently culled based on their light curves. Representative light curves of the sample are shown in Figure 1. Table 1 (available in electronic form) provides for all 404 RRab variables IDs, coordinates, observed mean IR magnitudes and colors, periods, and amplitudes, as inferred from the -band light curves. The sample completeness is affected by numerous factors, such as: due to a magnitude-limited survey, faint and low amplitude variables are affected more severely by incompleteness; variables with symmetric light curve shapes may have been discarded to mitigate contamination from eclipsing binaries; Galactic location (varying field density and reddening); RR Lyrae located near the tile edges may possess larger uncertainties as the images are NIR mosaics; the total number of points per light curve varies between 50 and 130 epochs, therefore affecting the quality of the light curves; and the random temporal sampling of the light curves may introduce period aliases. Note that there are typically 50 independent observations since the data are often acquired in pairs a few minutes apart.
| VVV-RRL- | RA [hms] | DEC [dms] | L [deg] | B [deg] | P [days] | Ampl | |||
|---|---|---|---|---|---|---|---|---|---|
| 002 | 11:51:57.41 | -64:01:00.0 | 296.473 | -1.893 | 14.928 | 0.843 | 0.258 | 0.4567776 | 0.309 |
| 003 | 12:04:09.48 | -63:31:15.2 | 297.691 | -1.131 | 12.965 | 0.509 | 0.239 | 0.4509296 | 0.349 |
| 004 | 12:05:21.20 | -63:37:34.9 | 297.841 | -1.211 | 15.633 | 0.880 | 0.266 | 0.4128700 | 0.444 |
| 005 | 12:05:25.90 | -64:36:30.0 | 298.024 | -2.176 | 14.301 | 0.989 | 0.328 | 0.6404369 | 0.341 |
| 006 | 12:10:50.56 | -64:39:13.5 | 298.603 | -2.124 | 15.556 | 0.764 | 0.252 | 0.5541016 | 0.213 |
| 007 | 12:13:11.06 | -64:14:55.6 | 298.791 | -1.685 | 13.675 | 0.968 | 0.302 | 0.6429702 | 0.286 |
| 008 | 12:16:10.06 | -64:03:33.4 | 299.086 | -1.451 | 14.925 | 0.862 | 0.291 | 0.3751550 | 0.315 |
| 009 | 12:17:10.96 | -64:04:13.5 | 299.197 | -1.447 | 14.710 | 0.867 | 0.303 | 0.6037623 | 0.338 |
| 011 | 12:17:27.52 | -64:46:56.1 | 299.321 | -2.149 | 14.406 | 0.647 | 0.203 | 0.6163412 | 0.298 |
| 012 | 12:18:42.26 | -64:05:53.7 | 299.366 | -1.453 | 13.787 | 0.853 | 0.305 | 0.4762576 | 0.237 |
Note. — Table 1 is published in its entirety in the machine readable format. A portion is shown here for guidance regarding its form and content.
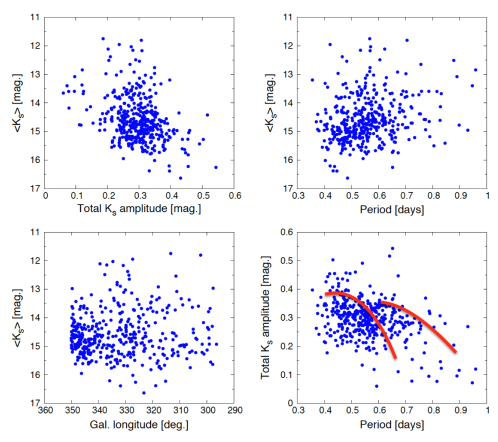
The distribution of observed parameters for the RRab sample are shown in Figure 2 (i.e., locations, magnitudes, periods, and amplitudes). Specifically, the figure conveys the sample’s -band magnitude as a function of the amplitude, Galactic longitude, and period, and a Bailey diagram (i.e., amplitude compared to the period). Our new sample of RR Lyrae in the disk occupies the same regions in these diagrams as the bulge RR Lyrae discovered by Gran el al. (2016). The increased scatter observed arises principally from extreme reddening across the disk fields (), while the fields of the outer bulge exhibit (Gran el al., 2016).
The discrete and smoothed distributions of the new sample of RRab stars as a function of Galactic longitude are shown in Figure 3. The sample spans from RA to . The distribution expectedly increases towards the Galactic Center, given the higher stellar density in the bulge and Galactic Center (Valenti et al., 2016). In addition, the observed distribution across the sky is inhomogeneous, displaying maxima and minima.
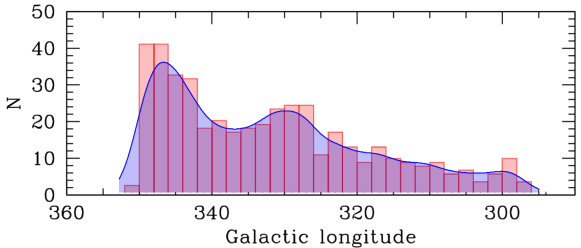
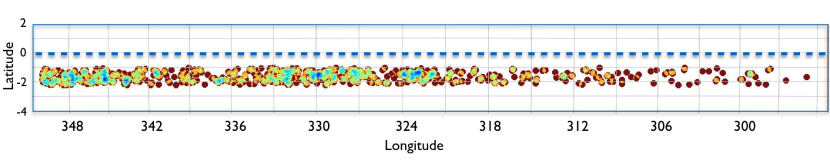
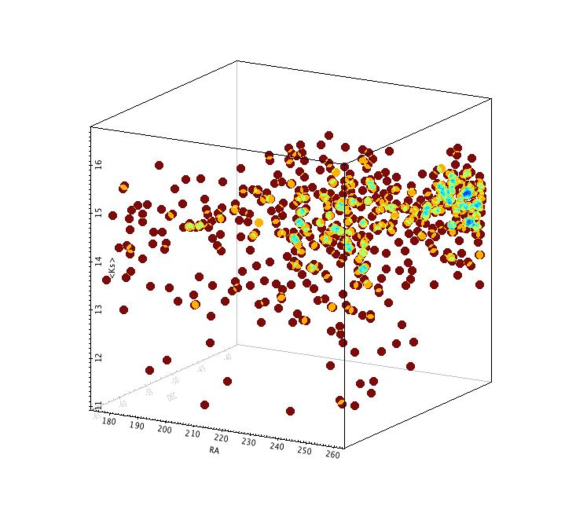
Figure 4 is a surface density map detailing the positions of the RR Lyrae candidates in Galactic coordinates across 57 sq.deg. within 38 tiles. The stars sample a narrow range of Galactic latitude below the plane, from to , while Figure 5 conveys the 3-D density map of the candidates in equatorial coordinates relative to the -band magnitudes. The figures highlight the presence of groups of stars that may be associated, and voids are likewise apparent where few stars are located. The spatial distribution is discussed further after the distance estimates are determined (Section 5).
3 The Color-Magnitude Diagrams
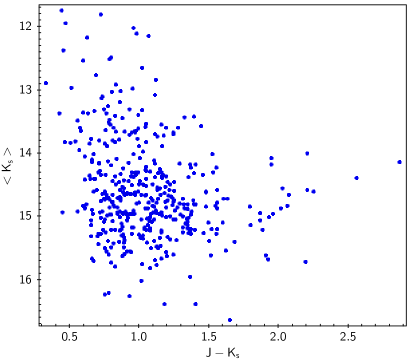
The NIR color-magnitude diagram (CMD) was constructed for the RR Lyrae candidates (Figure 6). The objects are significantly brighter than the limiting magnitudes associated with tiles d001 to d038, which range from 17.5 to 18.5 mag in the -band (Saito et al., 2012). The RR Lyrae are typically fainter than bulge red clump giants, and are bluer than field clump giants. Mean -band magnitudes were utilized along with single-epoch -band magnitudes to produce , and consequently extra scatter is present due to random phase of J-band observations and periodic color variations. However, the amplitude changes are comparatively small in , and are estimated to be mag (Pietrzynski et al., 2003; Borissova et al., 2009), and the VVV photometric zero points are accurate to mag. Thus the principal scatter in color shown in the CMD arises from the extinction spread along the sight-lines to these low latitude RRab stars.
A comparison of Figure 6 with the CMDs of RR Lyrae in other regions of the Galaxy, such as the bulge, strengthens the case that the targets are RR Lyrae located at varying distances along the sight-line through the Galactic disk, with potentially large differences in extinction (see Section 7).
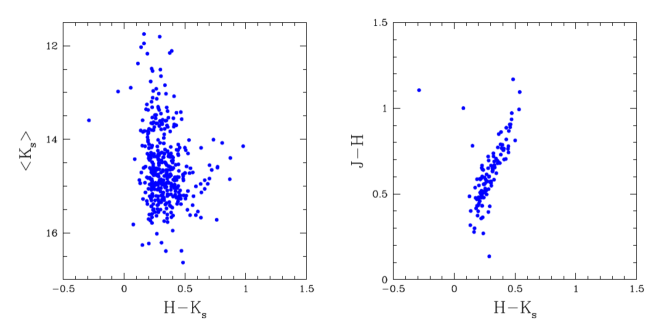
NIR color-magnitude ( vs ) and color-color ( vs ) diagrams were likewise constructed for the RRab candidate sample (Figure 7). The diagrams illustrate the variation in extinction as demonstrated by the extent of the data along the reddening vector.
4 Reddenings and Extinctions
Reddening and extinction values throughout the Galactic plane fields are extreme, and the uncertainties are exacerbated by possible variations in the extinction law (for recent discussions see Nishiyama et al., 2009; Gonzalez et al., 2012; Chen et al., 2013; Nataf et al., 2016; Majaess et al., 2016). An important advantage of the photometry is that the impact of extinction is significantly reduced in the NIR with respect to the optical (by factors of 3 in reddening and 10 in extinction).
RR Lyrae stars are excellent reddening indicators because their intrinsic colors are known. They are located in the instability strip, which is defined by a narrow range of temperature and consequently intrinsic NIR colors within mag (see Navarrete et al., 2015). Therefore, in principle, their observed colors can be used to estimate individual reddenings along the line of sight. That property has been exploited to characterize the reddening throughout the bulge (e.g. Alcock et al., 2010; Popowski et al., 2003) based on optical data. A mean intrinsic (i.e. unreddened) color of is adopted for all RR Lyrae stars in our sample (see Gran el al. (2016))111There is no concensus about this mean value (e.g. Navarrete et al., 2015; Gran el al., 2015; Klein & Bloom, 2014; Muraveva et al., 2015), but the scatter in this color is so small that in no case changes significantly the conclusions of this work.. Furthermore, as mentioned earlier, the color range throughout the phase cycle is small, mag. Exceptions to the adopted mean parameters may be present for RR Lyrae that are blended with field stars. The impact of blending would be bluer observed colors if the blend is with a foreground disk main-sequence star, or redder observed colors if the blend is with a background red giant. The effect of blending is mitigated since the VVV images exhibit high resolution ( 0.9 arcsec), and consequently blends should be rare because the stellar densities at the relevant magnitudes are not very high even in the low latitude fields observed here. Moreover, the impact of the Blazko effect is reduced in the NIR, and in particular the mean colors are unaffected222The Blazko effect produces varying amplitudes for RRab stars (Blazko, 1907), and in the optical the colors are often measured at minimum light where they are more stable (Kunder et al., 2010)..
Figure 7 illustrates the significant variation in reddening, as RR Lyrae possessing intrinsic colors display observed colors spanning from to , and beyond. Certain outliers may be blended stars. The choice of the reddening law is important, and can impact the computed distances. That uncertainty is apparent when comparing the extinction based on reddening laws of Nishiyama et al. (2009) with Cardelli et al. (1989). The extinction is for Nishiyama, and for Cardelli law, respectively.
There is a systematic effect on the distances depending on the PL relation and the reddening law adopted. It is straightforward to consider the effect of the reddening curve on the distances. The steeper the adopted extinction curve, the smaller the absolute-to-selective extinction ratio, thus smaller the absolute extinction for the same measured color excess. Therefore, if one computes distances adopting a steeper extinction curve, one will get larger distances for the objects for the same color excess values (E(J-Ks) in our case). If the assumption about the validity of the Nishiyama extinction curve is incorrect for the present sample, and our objects follow a shallower, more standard extinction curve, then the distances would get systematically shorter.
In sum, the reddening was determined via the following relation: , where 0.21 mag is the intrinsic color for RRab stars. The following expression was adopted to convert the reddening to the total extinction: , because the reddening vector defined by the RRab distribution in the color-color diagram (Figure 7) matches the Nishiyama (2009) result, namely . The sample exhibits a reddening baseline ranging from approximately to . The equivalent extinction values in the -band span mag, and in the -band that implies mag. The typical reddening value for the sample is mag, which is equivalent to mag and mag.
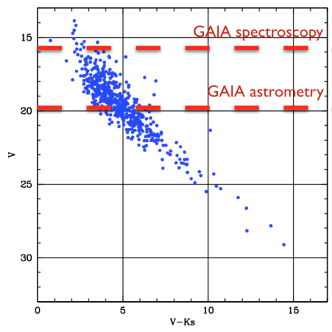
Knowledge of the extinction values and the slope of the reddening law may be utilized to estimate the expected visual magnitudes for the RR Lyrae variables discovered. The objective is to evaluate the possibility of undertaking follow-up observations for the RR Lyrae sample in the optical, and specifically, if the objects will be surveyed by Gaia. The Gaia mission will revolutionize the study of Galactic structure in general, and of RR Lyrae as distance indicators in particular (e.g. Wilkinson et al., 2005; Bailer-Jones, 2009; Eyer et al., 2013; Clementini, 2016).
A mock optical-infrared vs CMD (Figure 8) was constructed as follows. Mean colors for unreddened Galactic RR Lyrae () were adopted from Muraveva et al. (2015). The intrinsic color for RRab is , and therefore the -band magnitude corrected for extinction is (for the Nishiyama et al. (2009) reddening law). The visual magnitudes were subsequently estimated via: , where is assumed to be the color of an unreddened RR Lyrae star.
The visual magnitude follows from the intrinsic color, extinction, and distance. We indicate the estimated limits for Gaia astrometric and spectroscopic observations (Wilkinson et al., 2005; Clementini, 2016) on the CMD in Figure 8. Numerous RR Lyrae stars ( half of our sample) have mag, and are therefore accessible to Gaia astrometric observations. Moreover, about 10 have visual magnitude within reach of the spectroscopic observations with Gaia. Even though Gaia will provide useful proper-motions, no useful () parallaxes are expected for mag sources that are more than 8 kpc away.
5 Distances
In this section we derive individual distances for our RR Lyrae sample. There are several factors to consider when estimating such distances, beyond the already mentioned issues of high extinction and an uncertain extinction law. Chief among them are the period-luminosity (PL) relations and absolute magnitudes, and their potential dependence on metallicity.
Muraveva et al. (2015) presented recently new near-IR PL and period-luminosity-metallicity (PLZ) relations for RR Lyrae stars, and compared them with the theoretical and empirical relations from the literature (Bono et al., 2003; Catelan et al., 2004; Dall’Ora et al., 2004; Del Principe, 2006; Sollima et al., 2006, 2008; Borissova et al., 2009). Based on this we assume mag as an upper limit to the uncertainty for the PL relation when computing the distances. The Muraveva et al. (2015) PL relation is tied to five RR Lyrae with HST-based parallaxes (Benedict et al., 2011). Distances for our new RRab sample were derived using the PL relation given by Eq. 14 of Muraveva et al. (2015), that is: . A period-luminosity-metallicity relation is likewise presented in that work, but the present RR Lyrae sample lacks accurate individual metallicities. While later we use the periods to determine the metallicity distribution, individual metallicities determined in this fashion do not provide improved distance estimates.
A NIR CMD for the RRab sample overlaid with lines of constant reddening and distance is presented in Figure 9. The diagram illustrates the range of distances and extinctions, indicating that our sample becomes incomplete for kpc, and reddenings and extinctions of and mag, respectively. The lines of constant distance were inferred from day RRab stars, and targets with different periods will scatter around those representative lines. The CMD excludes 14 stars that lack -band observations,
and the reddening vector from Nishiyama et al. (2009) is shown.
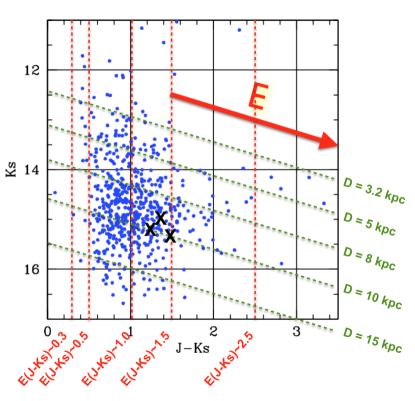
There are numerous groups (pairs, triplets) of RRab variables within the discovered sample that lie in close spatial proximity. It is worth following up on these groups as, for example, they may potentially be associated with tidal streams or globular clusters. Three RRab stars appear to belong to the globular cluster 2MASS-GC03 (FSR 1735), located in the VVV tile d031 at RA=16:52:11.1, DEC=–47:03:23, or , . The globular cluster provides a valuable anchor to check the computed distances. The positions of the three RRab members of this cluster (V1, V2 and V3 in the notation of Carballo-Bello et al., 2016) are highlighted in Figure 9. Carballo-Bello et al. (2016) measured a mean cluster metallicity and radial velocity of and km/s, respectively. Our estimated mean distance to the RR Lyrae is kpc. That distance is in agreement with their position in the cluster CMD (Carballo-Bello et al., 2016). The mean reddening and extinction inferred from the RR Lyrae stars are , mag, and mag, accordingly. This demonstrates that our distances are reasonable, and justifies the selection of the reddening law, absolute RR Lyrae , and PL relation. In addition, another group of disk RR Lyrae points to the discovery of a new globular cluster in the Milky Way, which we name VVV-GC-05 (FSR1716), and study in detail in a follow-up paper (Minniti et al. 2017).
Our RR Lyrae sample is located in the direction of the thin disk ( deg), and complements previous surveys associated with the thick disk, halo, and the well-studied local sample of Layden (1994). The new RR Lyrae are concentrated toward the Galactic plane, with pc, and exhibit a mean height below the Galactic plane of pc.
The distance distribution for the RRab sample along the line of sight is shown in Figure 10. The density distribution peaks at a distance of kpc, which is where the RR Lyrae are closest to the Galactic center and it is the tangent point with the Galactic bulge. Importantly, the RR Lyrae distribution does not peak at the end of the bulge bar, which is located at a distance of kpc. The result supports claims that the RR Lyrae distribution is not barred (Dékány et al., 2013) Gran el al. (2016). An excess number of RR Lyrae lies between and kpc, which is the contribution of the bulge demographic.
The distance distribution in Figure 10 appears inhomogeneous, and is potentially revealing true substructure. The distribution is portrayed using a small bin size (0.25 kpc) to illustrate possible groupings along the sight-line. For example, excess RR Lyrae are observed toward tile d026 (centered at , ), and the density enhancement warrants further study. If the observed substructure(s) are not spurious artefacts of small statistics, two separate conclusions may be considered: (1) the distribution may be intrinsically inhomogeneous (e.g. due to halo streams, previously unseen globular clusters or dwarf galaxies, massive disk spiral arms, bulge orbital traps, etc.), (2) the observed distribution is biased by high extinction, as illustrated when comparing the observed spatial distribution with extinction maps (see Figure 4).
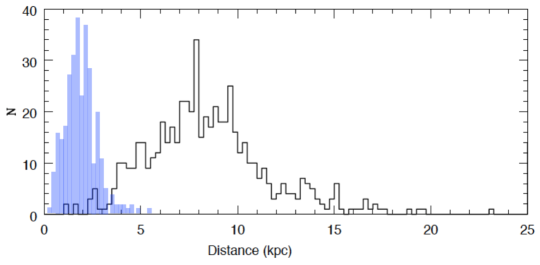
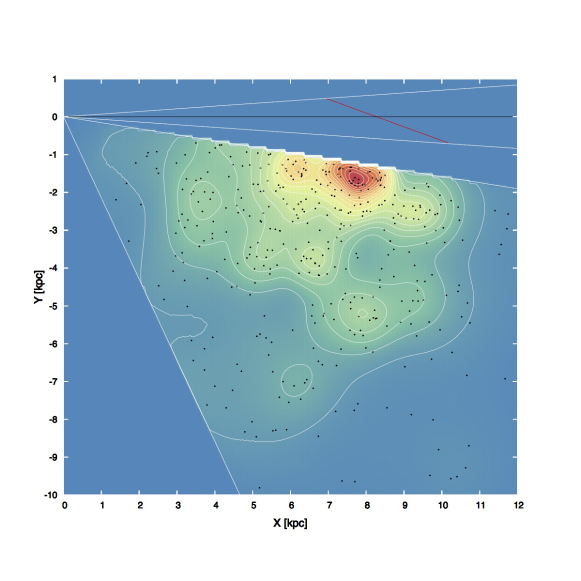
Figure 11 conveys a map of the Milky Way together with the distribution of the RRab stars.
The figure demonstrates that the peak density is located at the bulge tangent point, as expected if the RRab distribution is not barred, but rather axisymmetric Dékány et al. (2013) Gran el al. (2016). Furthermore, the bulge RR Lyrae population appears to extend from , beyond which the excess defined by the bulge RR Lyrae disappears (as seen in Figure 4). Expectedly, Figure 11 likewise shows that the substructures do not trace the spiral arms, and are instead described by a smoother distribution across the Galaxy. Interestingly, certain distinct substructures warrant further investigation. For example, there is a dearth of RR Lyrae in a region of the Galactic plane beyond 10 kpc for longitudes . The absence of remote RRab stars in that region may stem from the presence of a distant thick interstellar cloud producing extreme extinction. In sum, Figure 11 conveys density enhancements beyond the bulge, which may belong to specific Galactic components (i.e. the disk or the halo).
6 Metallicities
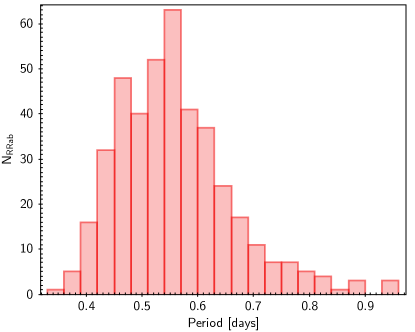
A plethora of RR Lyrae exists in the halo fields of the Milky Way, and the stars are likewise often present in sizable numbers in Galactic globular clusters. However, not all globular clusters contain RR Lyrae, and the variables are more common in metal-poor clusters. The observed period distribution for the newly discovered sample of RRab stars exhibits a mean period of days (Figure 12), which indicates that the majority of the RRab resemble an Oosterhoff type I population. RR Lyrae are often divided into two main populations designated Oosterhoff type I or type II (Oosterhoff, 1939; Kinman, 1959; Catelan, 2009). The Oosterhoff populations have different period distributions in globular clusters relative to the halo fields, with the Oosterhoff type I populations displaying shorter mean periods ( days) and higher metallicities ( dex) than their type II counterparts (Catelan, 2009).
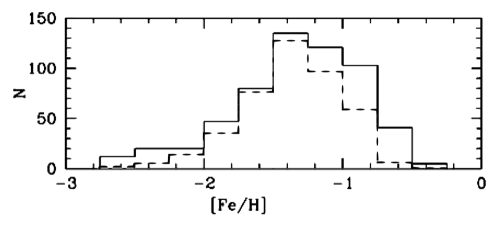
Individual metallicities for RRab stars may be estimated from their periods, with reference to the RR Lyrae calibrators of Layden (1994). Feast et al. (2010), and Yang et al. (2010) cite the following relations: , , and , , respectively. The derived metallicity distribution for the RR Lyrae sample using the Feast et al. (2010) relation yields a mean metallicity of dex (Figure 13). The individual metallicities were estimated using the periods, and are merely estimates (see discussions by Yang et al. (2010), and Feast et al. (2010)) in the absence of spectroscopic determinations. The individual metallicities may have a scatter of several dex, yet the shape of the metallicity distribution confirms that the RRab sample constitutes metal-poor objects which belong predominantly to an Oosterhoff type I population.
Figure 13 shows the metallicity distribution of the present RR Lyrae sample compared with the RR Lyrae population in the outer bulge from Gran et al. (2016). While the peak locations are similar, the present metallicity distribution is broader than that of the outer bulge sample. This figure shows also that there is a lack of very metal-rich RRab (having up to Solar metallicity), that are seen in the local populations (Layden (1994)), suggesting that our sample is dominated by halo RRabs, containing few disk RRab. We predict that the present relatively metal-poor sample should exhibit high velocity dispersion. This needs to be explored spectroscopically, by measuring accurate radial velocities and metallicities.
7 Comparison with other RR Lyrae populations
The properties for all targets are listed in Table 2 (available in electronic form), which include the reddenings, distances, and metallicities. The RR Lyrae sample discovered is now compared to several results, namely the inner and outer bulge RRab, globular cluster Cen RRab members, the Layden (1994) local sample, and the halo population.
(1) the inner bulge RRab:
Dékány et al. (2013) studied the inner bulge RR Lyrae stars and established accurate distances. They concluded that the RR Lyrae distribution is axisymmetric, and not barred. Pietrukowicz et al. (2015) utilized optical photometry from OGLE and contested that result, since they discovered the population adhered to a barred distribution. However, the spatial density distribution of our sample does not peak near the bar’s end ( kpc), but the maximum is instead observed at the bulge tangent point near kpc, as expected from an axisymmetric distribution.
(2) the outer bulge RRab:
Gran el al. (2016) showed that the outer bulge RR Lyrae do not trace a bar component, whereas a well-defined bar signature is delineated by red clump giants. They argued that the RR Lyrae in the bulge-halo transition have an axisymmetric distribution, which supporting the results of Dékány et al. (2013).
(3) the globular cluster Cen:
Navarrete et al. (2015) recently completed a NIR analysis of the RR Lyrae population associated with Cen, the most massive Galactic globular cluster, which is considered to be the remnant nucleus of a disrupted dwarf galaxy. Cen is the prototypical example of an Oosterhoff type II population, while the new RR Lyrae sample appears to be a composite population with a large metallicity spread, but dominated by an Oosterhoff type I population, which features a more metal-rich mean (). Only of the sample are of the Oosterhoff type II class like the globular cluster Cen, assuming an arbitrary division of for the separation between the Oosterhoff classes.
(4) the local sample:
The local sample is likewise a composite Oosterhoff population, but dominated by the Oosterhoff class I RR Lyrae (Layden, 1994). These RR Lyrae are located within 5 kpc from the Sun, and appear to be representative of the population found across the plane, since there are no marked differences with remote RR Lyrae discovered in the present study. The new RR Lyrae exhibit Galactocentric distances spanning kpc, which extends and complements the Layden (1994) sample, which ranges kpc. The present sample features RR Lyrae at smaller Galactocentric distances, and includes RR Lyrae belonging to the outer bulge population, but ultimately the properties are similar to those of local RR Lyrae.
(5) the halo population:
There is considerable research concerning the halo RR Lyrae population, because it is a useful tracer of the halo’s substructure (e.g. Vivas & Zinn, 2006; Keller et al., 2008; Miceli et al., 2008; Catelan, 2009; Sesar et al., 2013; Baker & Willman, 2015). Certain RRab stars in our sample may belong to a halo field population traversing the Galactic plane during their orbits, and under that scenario they should possess high proper motions. Alternatively, if the RR Lyrae are endemic to the Galactic disk, an implication is that the disk is extremely old ( Gyr), and must have been in situ since very early in the Milky Way’s formation. Follow-up by Gaia is important in order to establish the kinematics of the RR Lyrae sample, and potential membership within the halo population.
In addition, complementary NIR spectroscopy may provide more accurate individual metallicities, and also radial velocities, in order to infer mean orbital properties (, and line of sight velocity dispersion, Frenk & White 1980), that would help to clarify disk vs halo vs bulge membership.
| VVV-RRL- | D [kpc] | |||
|---|---|---|---|---|
| 002 | 0.693 | 0.366 | 8.516 | -0.9 |
| 003 | 0.359 | 0.190 | 3.716 | -0.9 |
| 004 | 0.730 | 0.730 | 11.095 | -0.6 |
| 005 | 0.839 | 0.443 | 7.306 | -1.7 |
| 006 | 0.614 | 0.324 | 12.783 | -1.4 |
| 007 | 0.818 | 0.432 | 5.515 | -1.7 |
| 008 | 0.712 | 0.376 | 7.662 | -0.4 |
| 009 | 0.717 | 0.378 | 8.819 | -1.6 |
| 011 | 0.497 | 0.262 | 8.173 | -1.6 |
| 012 | 0.703 | 0.371 | 5.130 | -1.0 |
Note. — Table 2 is published in its entirety in the machine readable format. A portion is shown here for guidance regarding its form and content.
8 Conclusions
We have discovered 404 RRab candidate variable stars across a 57 sq.deg. region along the southern plane of the Milky Way. NIR photometry from the survey was employed to establish accurate positions, near-IR magnitudes, colors, periods, and amplitudes as well as to estimate metallicities for the whole sample.
The RRab stars are located at distances spanning from kpc, with the maximum density being at the distance of the Galactic bulge. This indicates that the RRab distribution does not trace the bar delineated by red clump giants, while it is compatible with an axisymmetric distribution (Dékány et al., 2013). Most of the stars have properties indicative of an Oosterhoff type I population. The spatial substructure exhibited in the present sample may be real and warrants further study. For example, three RR Lyrae appear to belong to the Galactic globular cluster 2MASS-GC03 (FSR1735), other five RRab trace a new globular cluster (VVV-GC05, FSR1716; Minniti et al. 2017), and additional groupings may trace other substructures. While a sizable fraction, close to the Galactic Center belongs to the bulge RR Lyrae population, those further away may belong to a high proper motion halo field population traversing the Galactic plane. These findings may support results from hydrodynamical cosmological simulations where stars formed in satellite galaxies are later on accreted to form part of the inner stellar halo and bulge (Tissera et al. 2017) in Milky Way mass-like galaxies. Alternatively, the RR Lyrae may belong to the Galactic disk, which would imply the disk is old ( Gyr) and must have been in place since very early in the Galaxy’s formation. Additional observations are necessary to select a scenario, and specifically, proper motions are particularly desirable. The RR Lyrae discovered here are also prime targets for near-IR spectroscopic observations, namely to measure chemical compositions and radial velocities. Lastly, our brightest cataloged RR Lyrae constitute a prime target list for the Gaia mission.
References
- Alcock et al. (2010) Alcock, C., Allsman, R., Alves, D. R., et al. 2000, ApJ, 542, 257
- Alonso-García et al. (2015) Alonso-García, J., Dékány, I., Catelan, M., et al. 2015, AJ, 149, 99
- Bailer-Jones (2009) Bailer-Jones, C. A. L. 2009, The Galaxy Disk in Cosmological Context, IAU Symposium, Volume 254. Edited by J. Andersen, J. Bland-Hawthorn, and B. Nordstr m, p. 475-482
- Baker & Willman (2015) Baker, M. & Willman, B., 2015, AJ, 150, 160
- Benedict et al. (2011) Benedict G. F., McArthur, B. E., Feast, M. W., et al. 2011, AJ, 142, 187
- Blazko (1907) Blazko, S. 1907, AN, 175, 325
- Bono et al. (2003) Bono, G., Caputo, F., Castellani, V., et al. 2003, MNRAS, 344, 1097
- Borissova et al. (2009) Borissova, J., Rejkuba, M., Minniti, D., et al. 2009, A&A, 502, 505
- Carballo-Bello et al. (2016) Carballo-Bello, J., Ramirez Alegría, S., Borissova, J., et al. 2016, MNRAS, 462, 501
- Cardelli et al. (1989) Cardelli, J. A., Clayton, G. C., Mathis, J. S. 1989, ApJ, 345, 245
- Catelan (2009) Catelan, M. 2009, Ap&SS, 320, 261
- Catelan et al. (2004) Catelan, M., Pritzl, B. J. & Smith, H. A., 2004, ApJS, 154, 633
- Catelan et al. (2013) Catelan, M., Minniti, D., Lucas, P. W., et al., 2013, arXiv1310.1996
- Chen et al. (2013) Chen, B., Schultheis, M., Jiang, B., et al., 2013, A&A, 550, A42
- Clementini (2016) Clementini, G., et a. 2016, in press
- Dall’Ora et al. (2004) Dall’Ora, M., Strom, J., Bono, G., et al. 2004, ApJ, 610, 269
- Dékány et al. (2013) Dékány, I., Minniti, D., Catelan, M. 2013, ApJ, 776, 19
- Del Principe (2006) Del Principe, M., 2006, AJ, 652, 362
- Drake et al. (2014) Drake, A. J., Graham, J., Djorgovski, S. G., et al. 2014, ApJS, 213, 9
- Emerson et al. (2010) Emerson, J. P., & Sutherland, W. J., 2010, in Proc. SPIE, Vol. 7733, Ground-based and Airborne Telescopes III, 773306
- Eyer et al. (2013) Eyer, L., Holl, B., Pourbaix, D., et al. 2013, CEAB, 37, 115
- Feast et al. (2010) Feast, M. W., Abedigamba, O. P., Whitelock, P. A. 2010, MNRAS, 408, 76
- Frenk et al. (1980) Frenk, C., & White, S. D. M. 1980, MNRAS, 193, 295
- Gonzalez et al. (2012) Gonzalez, O. A., Rejkuba, M., Zoccali, M., et al. 2012, A&A, 543, A13
- Gran el al. (2015) Gran, F., Minniti, D., Saito, R. K., et al. 2015, A&A, 575, A114
- Gran el al. (2016) Gran, F., Minniti, D., Saito, R. K., et al. 2016, A&A, 591, A145
- Helmi (2008) Helmi A. 2008, A&ARv, 15, 145
- Helm et al. (2011) Helmi, A., Cooper, A. P., White, S. D. M., et al. 2011, ApJ, 733, 7
- Hempel et al. (2016) Hempel, M., et al. 2016, in preparation
- Keller et al. (2008) Keller, S. C., Murphy, S., Prior, S., et al., 2008, ApJ, 678, 851
- Kinman (1959) Kinman, T. D. 1959, MNRAS, 119, 134
- Klein & Bloom (2014) Klein, C. R., & Bloom, J. S., 2014, arXiv:1404.4870
- Kunder et al. (2008) Kunder, A., Popowski, P., Cook, K. H., et al. 2008, AJ, 135, 631
- Kunder et al. (2010) Kunder, A., Chaboyer, B., Layden, A. 2010, AJ, 139, 415
- Layden (1994) Layden, A. C. 1994, AJ, 108, 1016
- Layden (1995a) Layden, A. C. 1995a, AJ, 110, 2288
- Layden (1995b) Layden, A. C. 1995b, AJ, 110, 2312
- Layden (1997) Layden, A. C. 1997, PASP, 109, 524
- Layden (1998) Layden, A. C. 1998, AJ, 115, 194
- Majaess et al. (2016) Majaess, D., et al. 2016, A&A, in press, arXiv:1607.08623
- Mateu et al. (2012) Mateu, C., Vivas, A. K., Downes, J. J., et al. 2012, MNRAS, 427, 3374
- Miceli et al. (2008) Miceli, A., Rest, A., Stubbs, C. W., et al. 2008, ApJ, 678, 865
- Minniti et al. (2015) Minniti, D., Contreras Ramos, R., Alonso-García, J., et al. 2015, ApJ, 810, 20
- Minniti et al. (2010) Minniti, D., Lucas, P. W., Emerson, J. P., et al. 2010, NewA, 15, 433
- Muraveva et al. (2015) Muraveva, T., Palmer, M., Clementini, G., et al. 2015, ApJ, 807, 127
- Minniti et al. (2017) Minniti, D., Palma, T., Dékány, I., et al. 2017, ApJ, in press
- Nataf et al. (2016) Nataf, D. M. Gonzalez, O. A., Casagrande, L., et al. 2016, MNRAS, 456, 2692
- Navarrete et al. (2015) Navarrete, C., Contreras Ramos, R., Catelan, M., et al. 2015, A&A, 577, 99
- Nishiyama et al. (2009) Nishiyama, S., Tamura, M., Hatano, H., et al. 2009, ApJ, 696, 1407
- Oosterhoff (1939) Oosterhoff, P. T. 1939, Obs, 62, 104
- Pietrukowicz et al. (2015) Pietrukowicz, P., Koz?owski, S., Skowron, J., et al. 2015, ApJ, 811, 113
- Pietrzynski et al. (2003) Pietrzynski, G., Gieren, W., & Udalski, A. 2003, AJ, 125, 2494
- Popowski et al. (2003) Popowski, P., Cook, K., & Becker, A. C. 2003, AJ, i26, 2910
- Saito et al. (2012) Saito, R. K.; Hempel, M.; Minniti, D., et al. 2012, A&A, 537, 107
- Schultheis et al. (2014) Schultheis, M., et al. 2014, A&A, 566, 120
- Sesar et al. (2013) Sesar, B., Ivezić, Z., Stuart, J. S., et al. 2013, AJ, 146, 21
- Sollima et al. (2006) Sollima, A., Cacciari, C. & Valenti, E., 2006, MNRAS, 372, 1675
- Sollima et al. (2008) Sollima, A., Cacciari, C., Arkharov, A. A. H., et al. 2008, MNRAS384, 1583
- Tissera et al. (2017) Tissera, P., et al., 2017, MNRAS, to be submitted
- Torrealba et al. (2015) Torrealba, G., Catelan, M., Drake, A. J., et al. 2015, MNRAS, 446, 2251
- Valenti et al. (2016) Valenti, E., Zoccali, M., Gonzalez, O. A., et al. 2016, A&A, 587, L6
- Vivas & Zinn (2006) Vivas, A. K. & Zinn, R., 2006, AJ, 132, 714
- Wilkinson et al. (2005) Wilkinson M. I., Vallenari, A., Turon, C., et al. 2005, MNRAS, 359, 1306
- Yang et al. (2010) Yang, S. C., Sarajedini, A., Holtzman, J. A., et al. 2010, ApJ, 724, 799