Shear banding, discontinuous shear thickening, and rheological phase transitions in athermally sheared frictionless disks
Abstract
We report on numerical simulations of simple models of athermal, bidisperse, soft-core, massive disks in two dimensions, as a function of packing fraction , inelasticity of collisions as measured by a parameter , and applied uniform shear strain rate . Our particles have contact interactions consisting of normally directed elastic repulsion and viscous dissipation, as well as tangentially directed viscous dissipation, but no inter-particle Coulombic friction. Mapping the phase diagram in the plane for small , we find a sharp first-order rheological phase transition from a region with Bagnoldian rheology to a region with Newtonian rheology, and show that the system is always Newtonian at jamming. We consider the rotational motion of particles and demonstrate the crucial importance that the coupling between rotational and translational degrees of freedom has on the phase structure at small (strongly inelastic collisions). At small we show that, upon increasing , the sharp Bagnoldian-to-Newtonian transition becomes a coexistence region of finite width in the plane, with coexisting Bagnoldian and Newtonian shear bands. Crossing this coexistence region by increasing at fixed , we find that discontinuous shear thickening can result if is varied too rapidly for the system to relax to the shear-banded steady state corresponding to the instantaneous value of .
pacs:
45.70.-n 64.60.-i 64.70.Q-I Introduction
Simple models of spherical particles, interacting via soft- or hard-core repulsive contact interactions, have been used to model a wide variety of granular and soft-matter materials, such as dry granular particles, foams, emulsions, non-Brownian suspensions, and colloids. The rheology of such systems under applied shear strain has been a topic of much active investigation. For athermal systems (), such models generally give a rheology with the following features: (i) At low density and low strain rate the system is in a flowing liquid-like state where the pressure and shear stress scale with the shear strain rate according to either a Newtonian () or Bagnoldian () rheology, depending on the form of energy dissipation in the system VOT_rheology . Newtonian rheology is often associated with overdamped motion due to the Stokes drag on particles that are embedded in a host fluid OT_2007 . Bagnoldian rheology is often associated with dry hard granular particles, assuming that the frequency of collisions and the momentum change per collision are both proportional to the strain rate LLC . However Newtonian rheology may still be observed in models which neglect interactions with a host fluid VOT_rheology ; VOT_RDCD , and Bagnoldian rheology may still be observed even in the presence of a host fluid, as the strain rate increases Bagnold ; Fall . (ii) As the particle packing fraction increases, a shear driven jamming transition occurs at a well defined , where the macroscopic transport coefficient of the liquid diverges OT_2007 ; VOT_RDCD ; Barrat ; OT_RD ; Lerner ; DeGiuli ; Ikeda ; VOT_CDn ; VOT_CDnQ . (iii) For soft-core particles, above the system develops a finite yield stress . For , the system is in a static jammed solid state, while for the system is in a state of plastic flow, generally described by a Herschel-Bulkley rheology, OT_HB . When particles are frictionless, the jamming transition is continuous, with vanishing continuously as from above. In this case, critical scaling is found to well describe behavior near the jamming transition OT_2007 ; Barrat ; OT_RD ; Lerner ; VOT_RDCD ; DeGiuli ; Ikeda ; VOT_CDn . When particles have inter-granular friction, the jamming transition may become discontinuous, with dropping discontinuously to zero at ; the rheology may now show hysteretic and re-entrant behavior near OH_friction ; Bi_Nature ; Heussinger ; Ciamarra ; Grob ; Grob2 ; Schwarz ; Jaeger_Nature .
However in many materials, the rheology is observed to be more complex. One such departure from the above scenario is the phenomenon of “shear banding,” in which the shear strain rate becomes spatially inhomogeneous, sometimes breaking into well-defined distinguishable bands with different values of . Shear banding has been found in a wide range of materials, including complex fluids CatesFielding , non-Brownian suspensions Coussot ; Ovarlez0 , pastes, gels, and emulsions Ovarlez , foams Kabla , granular matter Jaeger_RMP ; Mueth , soils and rocks Rudnicki , metallic glasses Spaepen ; Li , and colloidal glasses Besseling ; Chikkadi . In some cases, shear banding is believed to result from inhomogeneous stress fields that vary spatially from values above to values below the yield stress of the material Schall . In other cases, shear banding is believed to result from the coupling of the system to a boundary wall Latzel ; Wang . However, in yet other cases, shear banding appears to exist as a bulk phenomenon, and in situations of spatially uniform stress Goddard ; Moller . In such cases, shear banding is believed to result from some inherent instability in the shear flow that leads to a non-monotonic stress-strain rate curve; shear bands then result as coexisting phases at a discontinuous transition, as in analogy to the van der Waals picture for the liquid-gas transition. In some of these cases, one of the bands is seemingly stationary, while the flowing band exists only above some critical strain rate Coussot ; Ovarlez0 ; Moller ; Dennin . In other cases, however, bands form which have different finite values of CatesFielding ; Besseling ; Chikkadi . Various theoretical models have been proposed Fielding ; Dhont ; Olmsted for shear banding, and specific microscopic mechanisms have been suggested for specific materials CatesFielding ; Besseling ; Dogic ; Bonn1 ; Bonn2 ; Bonn3 . For more complete reviews see Refs. Ovarlez and Schall . It remains of interest to see how general the phenomenon of shear banding might be, and whether relatively simple mechanisms can produce shear banding in simple homogeneous systems of repulsive spheres.
Another phenomenon that has received considerable recent attention is discontinuous shear thickening (DST). In dense non-Brownian suspensions, the canonical example being cornstarch in water, increasing the shear strain rate can lead to a sudden and dramatic increase of shear stress Brown . There seems to be a growing consensus that inter-particle frictional interactions are key to understanding DST. Several recent works have sought to explain DST as a transition from a state where hydrodynamic lubrication forces prevent particles from prolonged contact, to a state where such lubrication forces are overcome, particle contacts increase, and elastic Coulomb frictional forces at those contacts become important Fernandez ; Seto ; Mari ; Cohen . Other works OH_friction ; Heussinger ; Grob ; Grob2 ; Mari ; WyartCates ; Zippelius ; Hayakawa1 have described DST as a precursor of the discontinuous jump in stress associated with the shear-driven jamming of frictional particles OH_friction ; Bi_Nature . While both DST and shear banding have been associated with discontinuous transitions, it remains unclear if there is a direct connection between these two phenomena.
In this work we report on numerical simulations of simple models of athermal, bidisperse, soft-core disks in two dimensions. We consider massive particles and energy dissipation occurs via particle collisions only. While we take our particles to have no inter-granular elastic frictional force, we do include a tangential viscous dissipative force. This tangential dissipation is key to the novel behaviors we find. In one model, denoted as model “CD”, this dissipative force is taken proportional to the center of mass velocity difference between two particles in contact. In a second model, denoted as “CDrot”, it is taken proportional to the local velocity difference between the two particles at their point of contact. Model CDrot thus introduces a non-trivial coupling between the translational and rotational motions of the particles. Exploring the behavior of these models at low shear strain rates , we map out the phase diagram as a function of packing fraction , and a parameter that measures the elasticity of collisions (see Figs. 3 and 17). We find for both models that the phase diagram includes a sharp first-order phase transition separating a region with Newtonian rheology from a region with Bagnoldian rheology. In both cases, the system transitions to Newtonian behavior as one gets sufficiently close to the jamming transition. The models differ in their behavior at small , corresponding to strongly inelastic collisions. At small , model CD is Newtonian at all , while CDrot has a first-order Bagnoldian to Newtonian transition as increases.
For CDrot we explore in greater depth the consequences of this rheological transition at small , as one varies the applied shear strain rate . We find that in the plane, the first-order rheological transition becomes a region of coexisting shear bands of Bagnoldian and Newtonian rheology. The width of this coexistence region appears to vanish as at a critical that lies below the jamming . Upon increasing the coexistence region appears to vanish at a critical end-point. Thus we find that model CDrot displays shear banding within a well defined region of the phase space, and that this shear banding is a consequence of an underlying Bagnoldian to Newtonian first-order phase transition.
We next consider the behavior of the shear stress as one crosses through the shear banded coexistence region by varying at fixed . We show that if is varied too rapidly for the system to relax to the shear-banded steady state corresponding to the instantaneous value of , then there can be large jumps in stress, as well as hysteresis upon cycling up and down through the coexistence region, as the system switches from Bagnoldian to Newtonian rheology or vice versa. Thus the first-order shear banding transition becomes a possible mechanism for DST.
Our object in this work is not to claim that our model is a realistic description of any particular physical system. Nor do we argue that friction is not an important element for the observed DST in real non-Brownian suspensions. Our goal is rather to study a model, built with interactions commonly considered in the literature, yet still sufficiently simple so that we may systematically investigate wide ranges of the rheological phase diagram. We show that this phase diagram depends sensitively on the nature of the dissipative interaction, and that, even for frictionless particles, behavior may be richer than previously believed.
The remainder of our paper is organized as follows. In Sec. II we define our numerical models, the quantities we measure, and our method of simulation. In Sec III we present our numerical results. In Sec. III.1 we give results and map out the phase diagram for low strain rates in model CD. We characterize the varying nature of particle collisions as one crosses the Bagnoldian to Newtonian transition line. In Sec. III.2 we give results and map out the phase diagram at low for model CDrot. We pay particular attention to how the rotational motion of the particles effects dissipation and leads to a different phase structure at small , as compared to model CD. In Sec. III.3 we focus on model CDrot in the limit of strongly inelastic collisions at , and show how the Bagnoldian to Newtonian rheological transition becomes a coexistence region of Bagnoldian and Newtonian shear bands. In Sec. III.4 we show how crossing the coexistence region by ramping the strain rate up and down at fixed volume can lead to stress jumps and hysteresis. Finally in Sec. IV we summarize our conclusions and discuss directions for future investigation. Appendixes A and B provide some technical details concerning the location of phase boundaries in model CDrot.
II Model and Simulation Method
We use a well studied model OHern of frictionless, bidisperse, soft-core circular disks in two dimensions, with equal numbers of big and small particles with diameter ratio . Particles interact only when they come into contact, in which case they repel with an elastic potential,
| (1) |
Here , where is the center to center displacement from particle at position to particle at , and is the average of their diameters. In this work we will use the value , corresponding to a harmonic repulsion. The resulting elastic force on particle from particle is,
| (2) |
where is the inward pointing normal direction at the surface of particle .
Because shearing injects energy into the system, we also need to have a mechanism of energy dissipation so as to attain a shear driven steady state. In the present work we will take dissipation to be due solely to particle collisions. We will consider two different models for this dissipation. Both models will include a tangential viscous dissipation, but no tangential elastic friction.
II.1 Model CD
The first, simpler, model is to take the dissipative force proportional to the difference in the center of mass velocities of the two colliding particles,
| (3) |
where is the center of mass velocity of particle . With this dissipation our model becomes a massive version of the Durian “bubble model” for foams Durian , and we have earlier denoted this model as “CD” for “contact dissipation” VOT_rheology . This model has also been used in simulations of convection in granular materials Taguchi ; Luding1 ; Luding2 . Note that the constant has different physical units from the constant .
Given the above forces, particle motion is governed by the deterministic Newton’s equation,
| (4) |
where is the mass of particle and the sum is over all particles in contact with particle . In this work we take all particles to have equal mass independent of their size, .
To apply a uniform shear strain rate in the direction, we use periodic Lees-Edwards boundary conditions LeesEdwards , so that a particle at position has images at positions , with , integer and the total shear strain at time . We then numerically integrate the equations of motion (4) to determine the particle trajectories, and from that the stress tensor of the system.
If we take the collisional forces to act on a particle at the point of contact, then , being normally directed, exerts no torque on the particle. However can have a non-zero component tangent to the particle’s surface at the point of contact, and so can exert a torque and cause the particles to rotate. However, since such rotational motion does not feed back into the force of Eq. (3), in model CD the translational motion remains completely decoupled from the rotational motion and so rotational motion may be ignored when computing stresses.
II.2 Model CDrot
This leads us to introduce our next model “CDrot” in which rotational and translational motion couple in a non-trivial fashion. In this model we take the dissipation to be proportional to the velocity difference of colliding particles at the point of contact,
| (5) |
where is the local velocity of particle at its point of contact with particle . thus includes a term arising from the rotation of the particle,
| (6) |
Here gives the angular orientation of the disk and is the moment arm pointing from the center of particle to the point of contact with particle .
We now need to supplement Eq. (4) for the translational motion with an equation for rotational motion,
| (7) |
where is the moment of inertia of particle , and the sum is over all particles in contact with . We note that such a coupling of rotational to translational motion is necessarily a feature of models that include inter-granular friction, although the tangential force in a frictional model is different from what we use here.
To generalize further, we might wish to split the dissipative force of Eq. (5) into components normal and tangential to the particle’s surface at the point of contact, with separate dissipative constants and respectively. If we took but , then again the translational motion decouples from rotational motion, there being no tangential force. We have previously denoted VOT_rheology this model as “CDn” (for normal contact dissipation) and it is well known to have Bagnoldian rheology, with stress , for all values of and VOT_CDn ; VOT_CDnQ . In the present work, however, we will keep for simplicity.
II.3 Times Scales and Dimensionless Quantities
The above microscopic dynamics possesses two important microscopic time scales VOT_rheology , the elastic and dissipative relaxation times,
| (8) |
We will measure time in units of . The parameter
| (9) |
measures the degree of elasticity of the collisions. For the harmonic interaction that we use, if we regarded the elastic potential of Eq. (1) as a spring which did not break when particles lose contact, then would give the undamped natural period of oscillation, would be the decay time, and would be the quality factor. We will denote small , where the head-on collision of two particles is strongly inelastic, as the “strongly inelastic” region; large will then be denoted as the “weakly inelastic” region.
It is also useful to define the time scale VOT_rheology ,
| (10) |
which has a well defined value in the limit that the particle mass . This time scale will be useful for describing overdamped systems where inertial effects are unimportant.
Our system consists of a fixed total number particles in a square box of fixed length . is chosen to set the particle packing fraction ,
| (11) |
The behavior of our system is thus controlled by the three dimensionless parameters, , , and the dimensionless strain rate .
To determine the global rheology of the system we measure the pressure tensor of each configuration, which consists of three pieces LeesEdwards : the elastic part , arising from the repulsive elastic forces of Eq. (2),
| (12) |
the dissipative part , arising from the dissipative forces of Eqs. (3) or (5),
| (13) |
and the kinetic part (sometimes called the streaming part),
| (14) |
where is the fluctuation away from the average velocity profile that characterizes the shear flow. The total pressure tensor is then,
| (15) |
The average pressure and shear stress in the system are then,
| (16) |
where represents an ensemble average over configurations in the sheared steady state.
It will be convenient to work in terms of dimensionless quantities. We take the diameter of the small particles , the mass , and the time as our units of length, mass, and time respectively. With these choices, stress in two dimensions is measured in units of , and so we can define a dimensionless pressure tensor,
| (17) |
with similarly,
| (18) |
as the dimensionless pressure and shear stress.
For a system with Bagnoldian rheology (i.e. , as ) we define the dimensionless Bagnold transport coefficients,
| (19) |
For a system with Newtonian rheology (i.e. , as ) we define the dimensionless transport coefficients in term of the components of ,
| (20) |
We define and in terms of and not because we have previously shown VOT_rheology that, for systems with Newtonian rheology, the first form becomes independent of in the hard-core limit of sufficiently small . is just the dimensionless shear viscosity of the system, while is the pressure analog of viscosity.
In much of this work we will focus specifically on the elastic part of the pressure tensor, . In general we find that, at the densities and strain rates we are considering, the elastic part gives the largest contribution to the total , and it is also the part that is easiest to compute accurately in simulations. Furthermore, any signature of a transition that we find in the elastic part must necessarily have a corresponding signature in the total stress. We will use the superscript “el” when referring to a quantity derived from only the elastic part of the pressure tensor, i.e., for the elastic part of the pressure and for the elastic part of the Bagnold coefficient.
II.4 Simulation Method
In our numerical simulations, we choose the diameter of the small particles to be , the mass , and take the unit of time (which implies the elastic coupling ). Since the net force on particle depends on particle velocities, we use a modified velocity Verlet algorithm: With the position and velocity of particle at times and denoted by and , respectively, and the net force by , our equations are
| (21) | |||||
| (22) | |||||
| (23) | |||||
| (24) |
The equivalent of Eqs. (21) and (23) are used for the rotational velocity . In general we use an integration time step . The exception is for (large ) where too large a time step may cause particles to unphysically reverse direction rather than just slow down; we then use time steps down to .
We simulate with two different system sizes. For the smaller size we have particles, and most of our presented results are for and . In these cases we simulate to a total shear strain of typically 100. For our larger system of particles we simulate for a range of strain rates from up to . The length of our runs, as measured by the total shear strain , varies substantially for different shear rates. However, even for our lowest shear strain rate the run length is always .
III Results
III.1 Model CD in the limit
We first discuss our results for model CD. In this section (as well as the next section for model CDrot) we are concerned with inferring the qualitative behavior of our system in the limit of small strain rate . Because we are simulating over a wide range of parameters , we use a relatively small system with particles. Most of our results will be for the strain rate , although at some we will also consider strain rates of and so as to infer the limit. But we caution that the phase diagram we find (see Fig. 3 for CD and Fig. 17 for CDrot) may be only approximate, with possible effects due to the finite values of and , especially as we get closer to critical points.
III.1.1 Rheological transitions
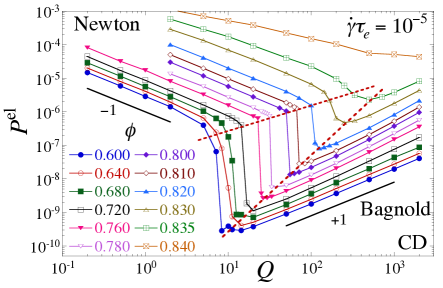
In Fig. 1 we plot results for the elastic part of the dimensionless pressure vs the collision elasticity parameter , for several different packing fractions . We show results for the strain rate . We have previously found for this model that the shear driven jamming transition takes place at VOT_RDCD . As increases we see that decreases roughly as , but then at a certain takes a sharp discontinuous drop. Above , then increases roughly linearly in . As increases, the magnitude of this drop decreases, and the width in over which the drop occurs broadens somewhat. As will be shown below, this broadening as increases is a consequence of the finite strain rate ; the drop will sharpen if one goes to lower values of . Very similar behavior is seen for the shear stress , with a discontinuous drop at the same as found for pressure.
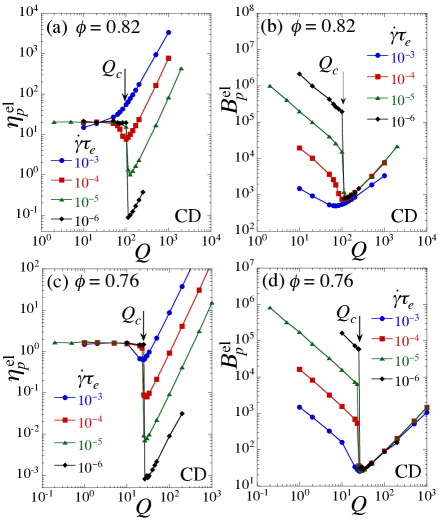
We now show that for the system has Newtonian rheology, while for the rheology is Bagnoldian. In Figs. 2(a) and (b) we show the pressure analog of viscosity, , and the Bagnold coefficient for pressure, , vs for several different strain rates at the packing fraction . For we see that becomes independent of for sufficiently small, thus confirming Newtonian rheology. Moreover, below we find to be independent of , as we have found previously VOT_rheology . This independence of on thus explains the dependence of seen in Fig. 1 for (since ). For we see that becomes independent of , thus confirming Bagnoldian rheology. The roughly linear rise in as increases above has been observed by us in other Bagnoldian systems at large VOT_CDnQ , and explains the roughly linear increase in seen in Fig. 1 for . In both cases we see that the drop at becomes sharper as decreases. Similar results are shown for the lower packing fraction in Figs. 2(c) and (d).
III.1.2 Phase diagram
We thus conclude that marks a sharp discontinuous transition from a region of Newtonian rheology () to a region of Bagnoldian rheology (), in the limit. Estimating from the midpoint of the sharp drop in of Fig. 1, in Fig. 3 we plot vs , showing results from two different strain rates, and . We find complete agreement between the two different strain rates, suggesting that our results reasonably give the limit. We see that appears to diverge as approaches the jamming from below. Thus in model CD, at any fixed , one eventually enters the Newtonian region sufficiently close to , and so the jamming criticality is always that of the Newtonian system. Moreover, since we have seen in Figs. 2(a) and (c) that is independent of in the Newtonian region, the divergence of as must be the same for all values of . Thus the value of and the exponent characterizing the divergence of should be independent of ; the only thing that depends on is how close one must get to in order to enter the -independent Newtonian region.
Making a power law fit, , we find good agreement with and . However our data is not sufficiently close to the jamming for us to know whether this exponent represents the true asymptotic behavior as , or is only an effective value for the range of we have considered.

We next ask if there is any obvious physical signature that distinguishes the Newtonian phase of our system from the Bagnoldian phase. We find that in the Newtonian phase the particles tend to cluster together, with force chains that percolate throughout the system, while in the Bagnoldian phase particles have few instantaneous contacts VOT_rheology . This is seen by computing the average instantaneous number of contacts per particle . In Fig. 4 we plot vs for several different packing fractions , for the shear strain rate . We see that takes a sharp drop from values of to values several orders of magnitude smaller, at the same where has it’s drop.
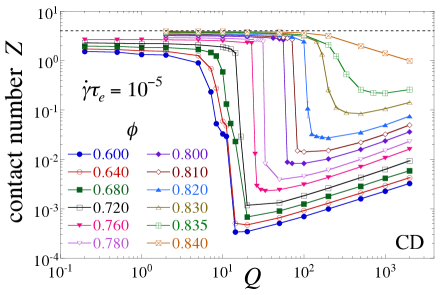
In Fig. 5 we plot vs for several different strain rates , at and 0.76. We see that in the Newtonian phase , as decreases becomes independent of and independent of . Thus the Newtonian phase is characterized by a finite particle connectivity even as . In the Bagnoldian phase , we see that steadily decreases as decreases. Below we will show that in the Bagnoldian phase the average contact number vanishes linearly, , as .

To understand better the behavior of , we consider two time scales associated with particle collisions. We define the collision duration time as the average time from the initiation of a particle contact until the breaking of that contact. We define the collision rate as the average number of collisions per unit time divided by the number of particles. As has been argued in Ref. OHL , and as we have shown previously for model CDn VOT_CDnQ , and are related to the average contact number by,
| (25) |
The product measures the fraction of the time between two collisions that a contact on average persists, while the factor 2 is because each contact is shared by two particles. In Fig. 5 we show vs on the same plot as . Although these two quantities are measured by completely different methods within the simulation, we find perfect agreement, thus providing a consistency check on our calculations.
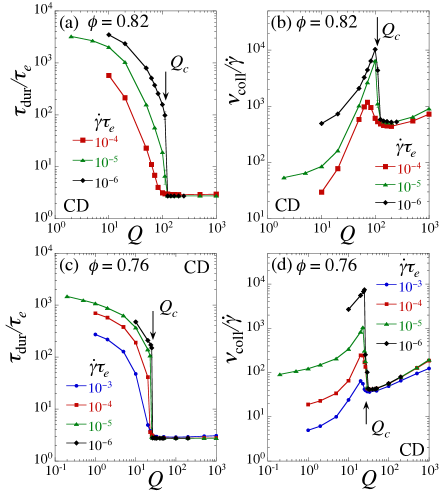
We now consider and separately. In Figs. 6(a) and (b) we plot and vs for several different strain rates at . We see that for in the Bagnoldian region, and become independent of at the smallest , thus implying that vanishes as . In the Bagnoldian region, , as would be the case for an isolated binary collision. In the Newtonian region , rapidly increases by several orders of magnitude as decreases, while decreases less rapidly than linearly in (so that increases as decreases), so as to keep constant. Similar results are shown in Figs. 6(c) and (d) for the lower .
III.1.3 Geometry of collisions
Next, we look more directly at the geometry of individual collisions in the phases above and below . To measure this, let us define,
| (26) |
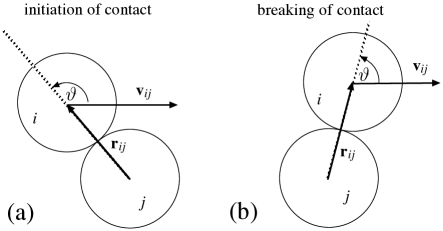
as the position and velocity of particle with respect to particle . We then define the angle as the angle by which one must rotate to align it parallel with ,
| (27) |
For two particles just initiating a contact, we must have , so that the particles are driven into each other, as illustrated in Fig. 7(a). In this case we must have . For two particles just breaking a contact, we must have , so that the particles are driven away from each other, as illustrated in Fig. 7(b). In this case we must have .
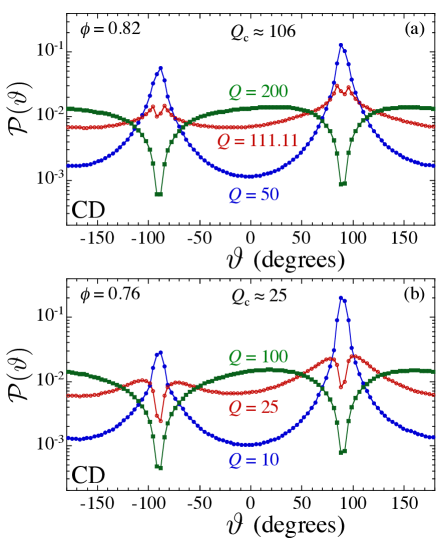
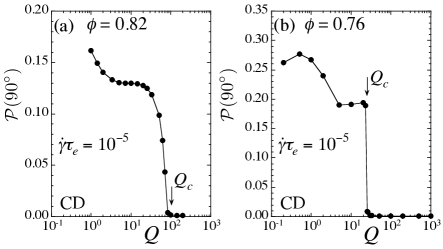
Measuring the value of each time a contact is initiated and each time a contact is broken, we construct a histogram which combines both contact initiation and contact breaking events. In Fig. 8 we plot vs for the two packing fractions and 0.76. We use a bin width of in constructing this histogram. In each case we show for three different values of : one well above , one well below , and one approximately at . We see that for , the histogram has minima at and is broadly distributed between; collisions take place with a broad range of impact parameter, , including many normally oriented (i.e. head-on) collisions. For , however, is strongly peaked at , indicating that collision are primarily glancing, with particles approaching each other close to tangentially. In Fig. 9 we plot the value of the histogram vs , as a measure of the propensity for tangential collisions. We show results at and at . We see that is essentially zero for in the Bagnoldian region, and then takes a sharp jump upwards at with the transition to the Newtonian region.
Looking at behavior more closely at the level of individual collisions, we find the following. For in the Bagnoldian region, collisions are mostly isolated binary collisions, where a pair of particles collide with a wide range of impact parameter, and then separate before coming into contact with another particle. If we define and as the root mean square average of the normal and tangential components of respectively, then for we find , with both decreasing as decreases. As decreases below , however, takes a sharp drop to small values, while plateaus to a constant independent of . The drop in results from the increasing inelasticity of the collisions as gets small, combined with the steric interactions of excluded volume at large particle densities; the decrease in free volume as increases, results in the increase of . The constant value of results from the driving shear strain rate , which forces particles to move relative to one another in shear flow, even for the smallest . Thus below the relative motion between particles is largely tangential. For such tangential motion, the tangential component of the dissipative forces resists relative particle motion, while the applied requires such motion. This results in the build up of extended force chains of elastic force, that drive the particles forward with the required . Such force chains result in a sharp increase in the average particle contact number and the elastic pressure . We leave further investigation of the detailed connection between particle collisions and the transition from Newtonian to Bagnoldian rheology to future work.
III.2 Model CDrot in the limit
We now consider behavior in model CDrot, in which the rotational and translational degrees of freedom are coupled. Our results in this section are again for a model with particles. Our main results are for a strain rate , although we also use and at several values of so as to better illustrate and locate the rheological phase transitions.
III.2.1 Rheological transitions
In Fig. 10 we plot results for the elastic part of the dimensionless pressure vs the collision elasticity parameter , for different packing fractions and strain rate . For the higher packing fractions, , our results for CDrot appear qualitatively the same as found in Fig. 1 for model CD; as increases, initially decreases roughly as , until a is reached at which takes a sharp drop, and then increases roughly linearly as increases further. We will see below that this drop at corresponds to a sharp transition from Newtonian to Bagnoldian rheology, as in model CD. For smaller , however, the drop becomes broadened over a wider range of , and appears to be approaching a constant as further decreases. For the smallest , the jump almost disappears, leaving only a kink between the small and large behaviors. We will see below that this drop/kink corresponds to a non-singular crossover between two different regions of Bagnoldian rheology.
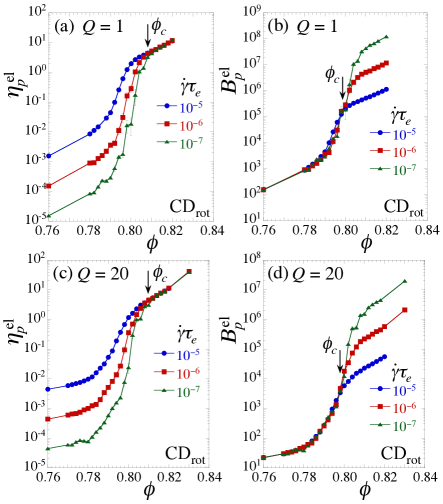
In Figs. 11(a) and (b) we plot and for strain rates to , at . We see that the behavior is qualitatively the same as in Figs. 2(a) and (b) for model CD; is independent of for , while is independent of for . We thus conclude that the rheology is Newtonian for , but Bagnoldian for . In Figs. 11(c) and (d) we similarly plot and for the lower packing fraction . Here we see rather different behavior; keeps decreasing as decreases, while is essentially independent of at all , indicating that the rheology is Bagnoldian both above and below .
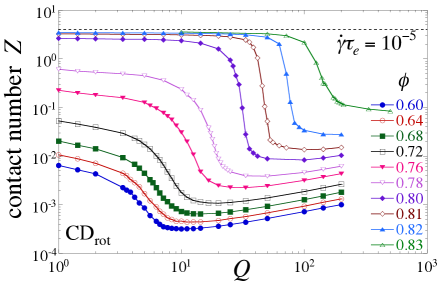
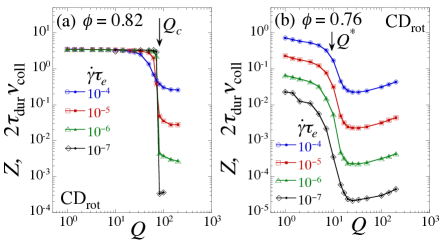
The same conclusion is obtained by looking at the average instantaneous contact number , which we plot vs in Fig. 12 for several different at . For we see at low , characteristic of the Newtonian phase; as increases, sharply drops roughly two orders of magnitude, characteristic of the Bagnoldian phase. For , we see at small for all , decreasing rapidly as decreases, consistent with a Bagnoldian phase at all . This becomes clearer in Fig. 13 where we show vs for strain rates to at and . For in panel (a) we see that, for , is a constant independent of , while for , decreases to zero as decreases. This is the same behavior seen in Fig. 5(a) for model CD. For in panel (b), however, we see that decreases with decreasing for all . We also show in Fig. 13 the quantity and find everywhere excellent agreement with , as expected according to Eq. (25).
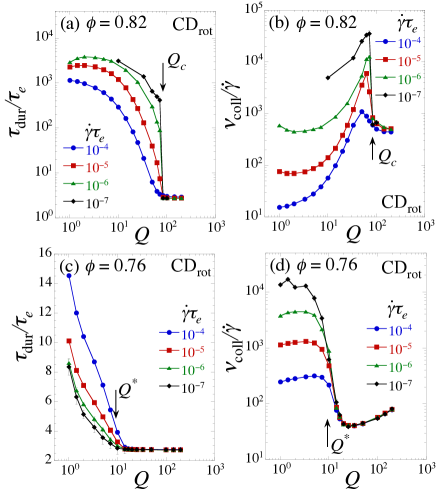
In Figs. 14(a) and (b) we plot and at for strain rates to . We see behavior similar to that of model CD in Figs. 6(a) and (b). For we see that both and are independent of , demonstrating that vanishes linearly in as . As decreases below , increases several orders of magnitude while decreases correspondingly, so that remains constant, as explicitly seen in Fig. 13(a) for .
In Figs. 14(c) and (d) we plot these same quantities, but at the lower packing fraction . Again and are independent of for , demonstrating that in this large region vanishes as . However, for , behavior is now different from what is seen in Figs. 14(a) and (b) at the higher . We still find that increases as decreases below , but now that increase is much less dramatic (note the linear vertical scale). We see that increases with decreasing for , but since from Fig. 13(b) we see that decreases with decreasing , and appears to be approaching a constant as decreases, we conclude from Eq. (25) that (and hence ) decreases with decreasing , but more slowly than linearly in . This behavior at is similar to what we have seen previously in model CDn VOT_CDnQ , where dissipation depends only on the normal component of the velocity difference of the colliding particles.
III.2.2 Phase diagram
From the results in the preceding section we thus conclude that, for , upon increasing there is a sharp transition at from a phase where the limiting rheology is Newtonian, to a phase where the rheology is Bagnoldian. For , as increases above , there is a non-singular crossover from a strongly inelastic Bagnoldian rheology to a weakly inelastic Bagnoldian rheology; these two different Bagnoldian regions differ primarily in how varies with and how varies with . We have previously found similar behavior in model CDn VOT_CDnQ ; Lois . Since we find that the small behavior is Newtonian at large , and Bagnoldian at small , it therefore follows that at small there must be a sharp transition from Bagnoldian to Newtonian rheology as increases.
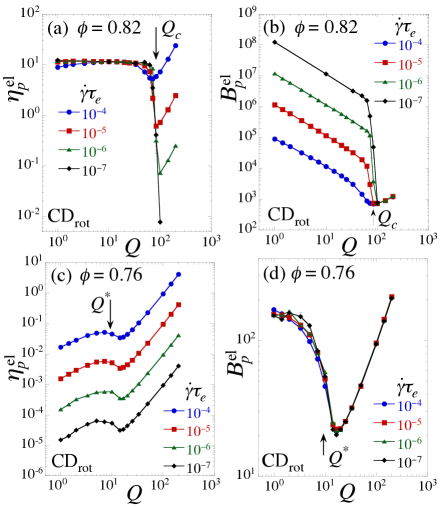
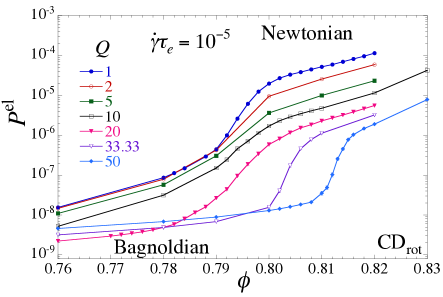
To search for this small transition from Bagnoldian to Newtonian rheology, in Fig. 15 we plot the elastic part of the dimensionless pressure vs for several different values of at fixed strain rate . We see a clear step upwards in the vicinity of – 0.81, depending on the value of . To confirm that these steps do indeed represent a sharp Bagnoldian-to-Newtonian rheological transition, in Figs. 16(a) and (b) we plot and vs at several different strain rates , for the value . We see that there is a such that for the curves of become independent of , thus demonstrating Newtonian rheology. For the curves of become independent of , thus demonstrating Bagnoldian rheology. In Figs. 16(c) and (d) we show similar results, with similar conclusions, for . We find that this tends to lie near the upper shoulder of the steps in Fig. 15. From Fig. 16 we note that there appears to be a small interval in between the point where the system ceases to be Bagnoldian and the point where it starts to be Newtonian. We will address this in greater detail in the next section.
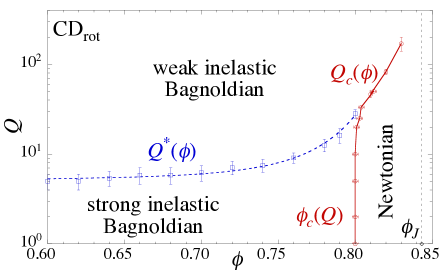
Using the specific methods detailed in Appendix A, we proceed to determine the location of the crossover line between the regions of weak inelastic and strong inelastic Bagnoldian rheology at smaller (as indicated by Fig. 11(c) and (d)), the transition line between the regions of Bagnoldian and Newtonian rheology at larger (as indicated by Fig. 11(a) and (b)), and the transition line between regions of Bagnoldian and Newtonian rheology at small (as indicated by Fig. 16). The resulting phase diagram is shown in Fig. 17. We see that the transition lines and form one continuous curve that separates the Newtonian phase from the Bagnoldian phase. As in our earlier model CD, our results suggest that the system is always Newtonian at the jamming transition ; the independence of on in this region, as seen in Fig. 11(a), suggests that the critical parameters of the jamming transition must also be independent of . Unlike model CD, however, we see that the Newtonian region is confined to relatively large packing fractions, . For , even at small where the collisions are strongly inelastic, the rheology remains Bagnoldian; upon increasing at fixed there is a non-singular crossover between two different regions of Bagnoldian rheology, as we have previously found in model CDn VOT_CDnQ .
III.2.3 Geometry of collisions
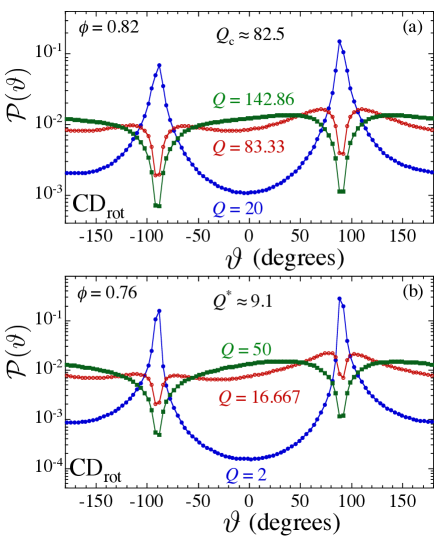
We next look at the geometry of collisions, computing the histogram of the collision angle at the time of initiation of a contact and the time of breaking of a contact (see Fig. 7 for the definition of ). In Fig. 18(a) we plot vs at , for three values of : well above, well below, and near . In Fig. 18(b) we plot similarly at , for well above, well below, and near . In Fig. 19 we plot vs for and . Both above and below we see the same behavior as was found previously in model CD (compare with Figs. 8 and 9). For (at ) or (at ), we see that collisions take place over a broad range of ; tangentially directed collisions at occur a negligible fraction of the time. For or , normally directed collisions are greatly suppressed, and the relative motion of particles is primarily tangential.
III.2.4 Effect of particle rotations
It therefore remains to explain, at low where relative particle motion is primarily tangential at any of the values we have considered here, what is the cause of the different rheology for (Bagnoldian) compared to (Newtonian). Since CDrot couples rotational and translational motion while CD does not, it is natural to look to the rotational motion of the particles for the answer. We therefore consider the rotational velocity of the particles, .
In Fig. 20(a) we plot the average vs for several of the smaller values of , at . We see that is roughly independent of , as would be expected for circular disks in a uniform shear flow (the minus sign indicates a clockwise rotation). There is no visible feature as passes through . Next we consider the variance of the single particle rotational velocity,
| (28) |
where denotes the time average over the steady state, and
| (29) |
In Fig. 20(b) we plot vs for different , at . We now see a clear signature of the transition at . As increases within the Bagnoldian phase, steadily increases, reaches a peak at , and then drops abruptly as the Newtonian phase is entered, suggesting that fluctuations of rotation are more constrained in the Newtonian phase. Note, although drops in the Newtonian phase, fluctuations remain large compared to the average, .

For a clearer understanding of the effects of the rotational motion on the rheology, we now consider behavior at the level of individual collisions. Defining the dimensionless velocity , we can write the difference in velocities at the point of contact of particle colliding with particle as,
| (30) |
where is the difference in center of mass velocities, and from Eq. (6),
| (31) |
is the contribution from the rotational motion of the particles (we have used ). With as the outward unit normal vector at the point of contact on particle , and as the unit tangent vector at the point of contact, we see that is purely tangential. We define,
| (32) |
as the rotational part of the contact velocity difference,
| (33) |
as the tangential and normal components of the contact velocity difference, and
| (34) |
as the tangential and normal components of the center of mass velocity difference. Since is purely tangential, .
In Fig. 21 we show correlation scatter plots of different components of the contact velocity difference at (left column) and (right column) for and . The data points represent independent collisions sampled at random times during the duration of each collision. In each panel the white dot in the center of the data locates the average of the distribution, while the black dotted lines give the directions of the principal axes of the covariance matrix.
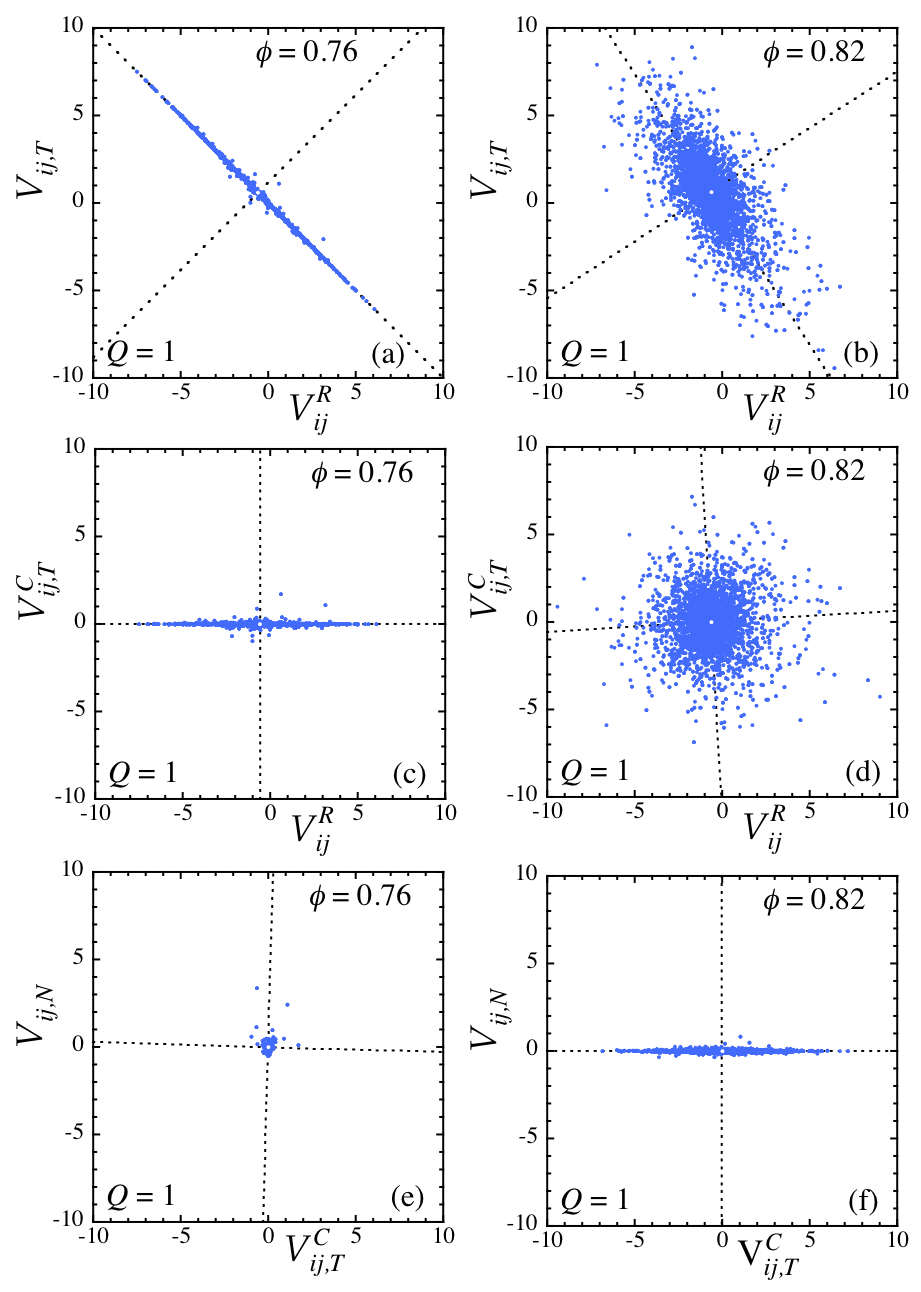
We consider first behavior at . In panel (a) we show the correlation of with . We see almost a perfect anticorrellation, with the result from Eq. (30) that the tangential component of the contact velocity difference . This is confirmed in panel (c), where we show the correlation of with . Despite a wide spread in values for , we find is always close to zero. In panel (e) we show the correlation of the normal component of the contact velocity difference, , with the tangential component . We see that both components are comparably small. Thus at small in the Bagnoldian phase below , the normally directed relative motion between particles is suppressed, relative motion is primarily tangential, but the particles are able to adjust their rotation to approximately cancel out the difference in center of mass motion, so that the tangential component of the contact velocity difference is comparably as small as the normal component. Thus both normal and tangential components of the dissipative force remain small. Behavior here is thus similar to what we have previously found at low in model CDn VOT_CDnQ , where the tangential component of the dissipative force is explicitly set to zero.
We next consider the behavior at . In panel (b) we show vs . Compared to panel (a) we see that there is still correlation, however the scatter of the data is broader and the slope of the major axis of the covariance matrix axis is no longer , showing that the sum of these two, i.e. , remains finite. This is confirmed in panel (d) where we show vs . We see that the spread in both quantities remains comparable, and the nearly vertical and horizontal orientations of the covariance matrix axes show that these quantities are at best very weakly correlated. Thus the tangential component of the contact velocity difference is now largely independent of the rotational motion. This observation is sufficient to explain the correlations seen in panel (b). In panel (f) we show vs . We see that the spread in the normal component of the contact velocity difference remains small, comparable to that of panel (e), but that the tangential component is comparatively broadly distributed. Thus at small in the Newtonian phase above , the normally directed relative motion between particles is suppressed, relative motion is primarily tangential, the particles fluctuate in their rotational motion, but these fluctuations are largely uncorrelated with the tangential component of the contact velocity difference. The normal component of the dissipative force is small, but the tangential component is comparatively large; both are largely unaffected by the rotational motion of the particles. Behavior here is thus similar to what we find in model CD.
We thus see that the transition from Bagnoldian to Newtonian rheology, upon increasing at small , is due to the changing nature of correlations between rotational and translational motion as the system gets denser. Below the rotations are almost perfectly anticorrelated with the differences in center of mass motion, so that the tangential part of the contact velocity difference becomes essentially zero, and dissipative forces are small (see Figs 21(a) and (c)). Above , rotational motion becomes less correlated with the translational motion, so that has sizable fluctuations which are uncorrelated with the particle rotations; rotational motion thus has little effect on the dissipative forces, which become sizable (see Figs. 21(b) and (d)). We find that, as increases, the number of particles in mutual contact during any particular collision is increasing. We therefore speculate that this change in the correlation between rotational and translational motion is due to the increasing constraint on rotational motion that arises when the number of contacts per collision increases. We leave further exploration of this effect to future work.
III.3 Model CDrot: Shear banding at finite
In the previous sections we focused on sketching out the behavior in the plane as . In this section we focus more carefully on behavior as a function of . We consider here the specific case of crossing the Bagnoldian to Newtonian transition line at for small in model CDrot. We will find that upon increasing , the sharp discontinuous transition becomes a coexistence region of finite width, where a shear band of Bagnoldian rheology coexists with a shear band of Newtonian rheology. Preliminary results suggest that similar behavior exists when crossing the Bagnoldian to Newtonian transition elsewhere at in both the models CD and CDrot. To investigate the spatially inhomogeneous configurations associated with this shear banding, it is necessary to consider a much larger system than in the previous sections. Here we use a system with particles.
III.3.1 Indicators for a coexistence region
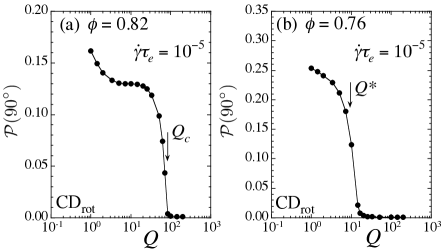
In Fig. 22 we plot results for the elastic part of the dimensionless pressure vs packing fraction for different fixed values of the strain rate at . At the smallest we see a sharp jump in that signals the transition at from Bagnoldian to Newtonian rheology. The jump here is indeed sharp, compared to the smoother behavior seen previously in Fig. 15, because the strain rate is much lower and our system is much larger; this limiting value is also slightly larger than shown in Fig. 17 for the same reason. However as increases, we see that this jump broadens and the vs curve develops two noticeable kinks rather than a single sharp jump. These kinks are denoted in the figure by the large open squares. At sufficiently large these kinks disappear, and the vs curve looks smooth. For a given , we denote the kink at the smaller by , and the kink at the larger by . The dashed lines in Fig. 22 connect these kinks so as to delimit a region in the plane. We will soon show that this region denotes a coexistence region where a band of Bagnoldian rheology coexists in mechanical equilibrium with a band of Newtonian rheology.

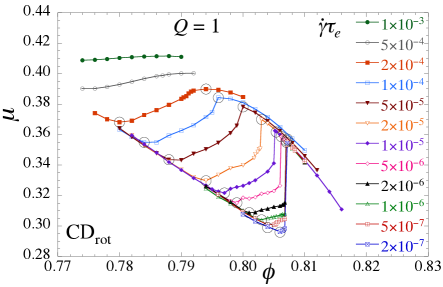
We next consider the macroscopic friction . Since coexistence between bands of Bagnoldian and Newtonian rheology must result from mechanical equilibrium between states of equal stress, we will consider here the total pressure and total shear stress , rather than just the elastic parts. We note however, that for the parameters considered here, the dissipative and kinetic parts of the pressure are negligible, as is the kinetic part of the shear stress; the dissipative contributes non-negligibly, roughly 10% – 20%, to the total . The quantity is of interest to consider since, unlike or , approaches a finite value as in both Bagnoldian and Newtonian systems. Thus for sufficiently small we might expect that, to a large extent, the curves of vs for different will overlap.
In Fig. 23 we plot vs for different values of at . We see that the data for different do indeed seem to collapse to a common curve, but that this curve has two distinct branches. For a given , the curve switches between the two branches at packing fractions and , with . These switching points, as judged by eyeball, are denoted in the figure by the large open circles. As decreases, and increase towards a common . The two branches we see in suggest a coexistence region, where locates the Bagnoldian side of the coexistence region while locates the Newtonian side.
We now consider a more direct global measure of shear banding, by looking how the velocity profile compares to the linear profile , , that is expected for a uniform homogeneous shear flow. We measure the fluctuation away from this presumed average by,
| (35) | ||||
| (36) |
For a homogeneously sheared state we expect to be roughly the same order of magnitude as . However in a shear banded state, where the local strain rate is nonuniform, we would expect , as defined above with respect to the fixed average , to become anomalously large; this follows since the velocity profile is no longer linear over the entire width of the system, but only piecewise linear, with different slopes, in each shear band (as we will soon see in Fig. 28).
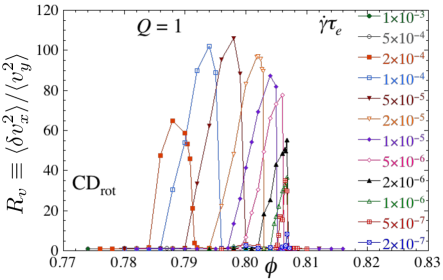
Defining the ratio of velocity fluctuations defined in Eqs. (35) and (36) as,
| (37) |
in Fig. 24 we plot vs for different fixed values of . We see that at low and high , is indeed of as in a homogeneously sheared state. But for intermediate near , we see a large jump in as expected for a shear banded state. For a given , we will denote as the value of at which takes the sharp jump upwards from , and the higher as the value of at which takes the sharp jump back down to .
III.3.2 Phase diagram and shear banding
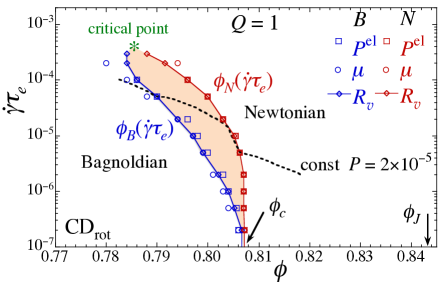
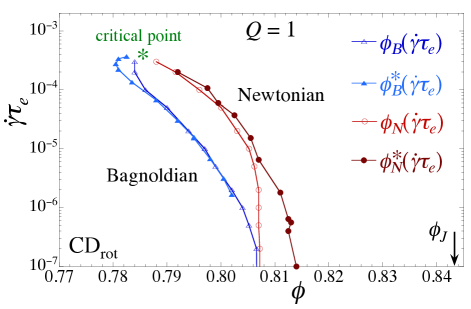
We now have from , and , three different determinations of the curves and , which we interpret as the Bagnoldian and Newtonian boundaries of a coexistence region in the plane. In Fig. 25 we plot these data and see that the results from , and reasonably agree with one another. Since we regard as the most objective of our measurements of these boundaries, we connect the data points from in the figure by solid lines, and denote the enclosed shaded region as the coexistence region of a first-order Bagnoldian-to-Newtonian phase transition. As decreases, we see that and appear to come together at a common . As increases, the boundary curves and merge together at a critical end-point (denoted schematically in the figure by the “”). While we have not determined the precise location of this critical end-point, we know that it must occur at a , since the curve of vs at gives no evidence of shear banding.
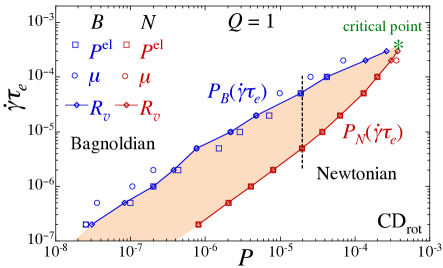

It is also interesting to construct the corresponding phase diagram in the plane, which we show in Fig. 26. It is interesting to note that, as one increases at fixed , one crosses from a region of Bagnoldian rheology to a region of Newtonian rheology. In contrast, as one increases at fixed , it is the reverse; i.e., one crosses from a region of Newtonian rheology to a region of Bagnoldian rheology. The vertical dashed line cutting through the coexistence region at constant in the plane of Fig. 26, maps onto the dashed line in the plane of Fig. 25.
For a direct demonstration that the shaded region in Figs. 25 and 26 is indeed a region of coexisting Bagnoldian and Newtonian shear bands, we can look explicitly at the spatial variation of packing fraction and strain rate within configurations, as we cross this region. If the interpretation of a coexistence region is correct, we expect that the system will phase separate into shear bands of Bagnoldian and Newtonian rheology in mechanical equilibrium with each other, i.e. the two bands will be at equal values of pressure and shear stress .
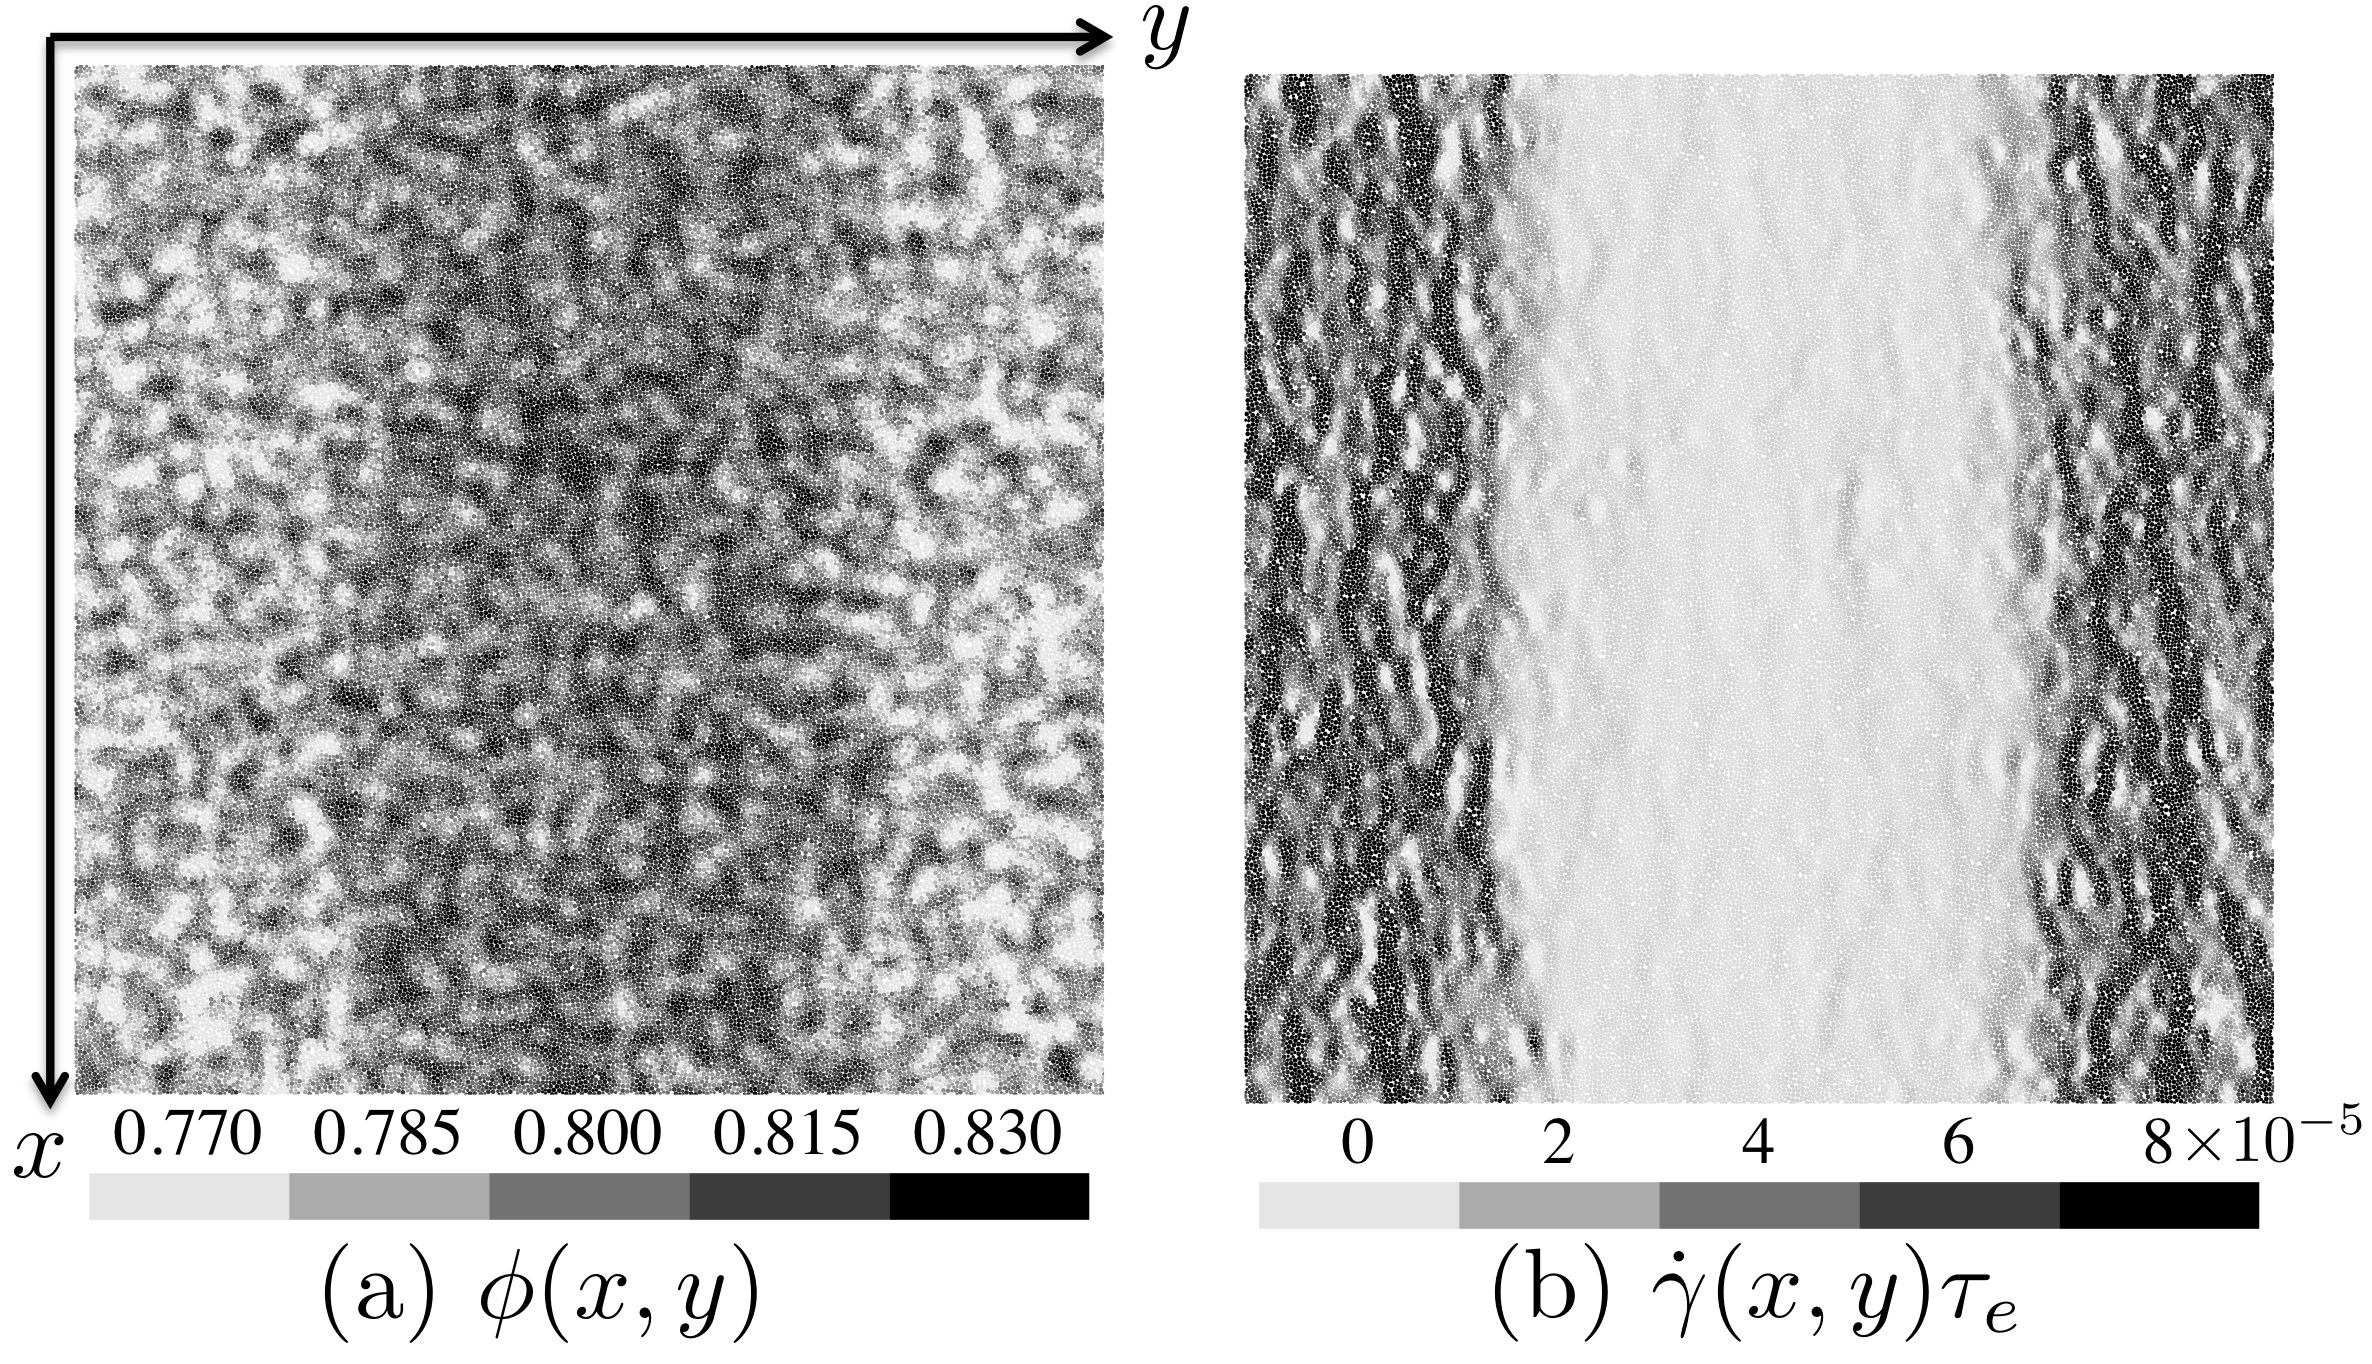
We consider crossing the coexistence region along a contour of constant pressure. Such a contour at fixed dimensionless pressure is shown as the dashed line in Figs. 25 and 26. In Fig. 27 we show a gray-scale encoded snapshot of a sample configuration roughly mid way through the coexistence region on this contour, at the global values . By “global values” we mean the values averaged over the entire system, or equivalently, the values of and that enter as the control parameters of our simulations. We compute the local value of packing fraction and strain rate of each particle by averaging over a circle of radius centered on each particle. Figure 27(a) shows the resulting local throughout the configuration, while Fig. 27(b) shows the local . Because our system is so large, with , it is difficult to distinguish individual particles in Fig. 27. However the variation in the gray-scale allows one to visualize both the local average and , as well as fluctuations about the local average, as one varies position within the configuration. We see clearly the Newtonian band in the center of the system, with a larger local and smaller local as compared to the Bagnoldian band at the edges of the system. For , the fluctuations about the local average appear to be roughly uniform throughout both bands. For , the fluctuations seem more pronounced in the Bagnoldian band. Presumbaly this is because in the Newtonian band particles stay in contact for long periods of time, thus reducing fluctuations in local velocity and hence the local strain rate.
To quantify the results illustrated in Fig. 27 we average the behavior of the system along the flow direction , and over many different configurations in our shearing ensemble, to plot quantities as a function of the position transverse to the flow direction. In Fig. 28 we show results at three different points along the contour of constant within the coexistence region, corresponding to the global values of (left column), (middle column), and (right column). The top row shows the average local velocity . We clearly see that the velocity profile is not linear across the entire width of the system, but is rather piecewise linear with regions of two different slopes (recall, the system obeys Lees-Edwards boundary conditions, in the direction). The middle row shows the average local strain rate . The bottom row shows the average local packing fraction . We see that in each case the system has clearly separated into two bands, one with larger local and smaller local , which we identify as the Bagnoldian band, and one with smaller local and larger local , which we identify as the Newtonian band. As the global increases, the Newtonian band increases in width while the Bagnoldian band shrinks. We have explicitly checked that these shear bands are not a transient effect, but rather represent the steady state; computing the profiles as in Fig. 28 gives essentially the same results whether we average over a finite strain interval near the beginning of our run, or over a non-overlapping strain interval near the end of our run.
Our results thus show the behavior commonly expected at a first order phase transition. Within the coexistence region the system separates into two phases in mutual equilibrium, with one phase growing and the other shrinking as one crosses from one side of the coexistence region to the other. However there is one feature of our results that is not quite the same as for a first order transition. If we denote as and the local values of the packing fraction and strain rate in the center of the Bagnoldian and Newtonian bands (i.e. away from the interface between the bands) then we see that these values are essentially constant everywhere along the contour of constant , with and . This is expected because the condition of mechanical stability of the coexisting bands requires that and must be constant along this contour. For a standard first order phase transition, we would expect that these two values and would correspond to the two points and where the contour of constant first enters the coexistence region from the Bagnoldian side and where it exits the coexistence region on the Newtonian side. However we find that this is not quite so; we find that and , noticeably different from and . In Appendix B we consider this difference further and argue that it is a finite-size-effect resulting from the finite length of our system as compared to the finite width of the interface between the Bagnoldian and Newtonian shear bands seen in Fig. 28.
Note, the fact that the shear bands in Fig. 28 have constant values of and , is only because we are crossing the coexistence region on a contour of constant pressure. If we crossed the coexistence region along any other trajectory, for example at constant or constant , the values of and within the two coexisting shear bands at any global value of would always be equal; but these values would be varying as we moved through the coexistence region along the trajectory, and hence the values of and in the bands would be varying.
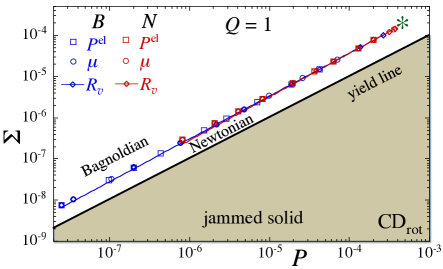
Finally, as is the case for an ordinary first order equilibrium phase transition, we expect that the coexistence region of finite width in the phase diagram of Fig. 25 will collapse to a sharp line when plotted in a phase diagram expressed in terms of the appropriate variables that define the stability condition between the coexisting phases. In the present case this is equality of stress. We therefore consider the phase diagram expressed in the plane, where we may regard the dimensionless shear stress as the conjugate variable to , and the dimensionless pressure as the conjugate variable to .
In Fig. 29 we plot the values of along the Bagnoldian and Newtonian boundaries of the coexistence region of Fig. 25, specifically the pairs of points and , and the pairs of points and . We plot such points for the three different determinations of and obtained from , , and . We see that all points indeed collapse to a single sharp line, separating a region of Newtonian rheology from a region of Bagnoldian rheology. Upon continuously crossing this line under conditions of controlled and , the system will show a discontinuous jump in shear strain rate and packing fraction . This first-order transition line terminates at a critical end-point, indicated schematically by the “” in the figure. For reference, we also indicate in the figure the yield stress line, defined by , with the macroscopic friction at the jamming transition VOT_RDCD . Below the yield stress line lies the region of mechanically stable, static, jammed solid states. As one approaches the yield stress line from above, the Newtonian rheology just below the first-order transition line will merge continuously with the Herschel-Bulkley rheology at finite just above the yield line.
III.4 Model CDrot: Discontinuous shear thickening
Discontinuous shear thickening (DST) is the observed phenomenon in which there is a discontinuous jump in the shear stress upon continuously increasing the shear strain rate. In this section we show how the first order rheological transition that gives rise to the shear banding also can provide a possible mechanism for DST.
Consider sitting at a fixed packing fraction (i.e. fixed volume) and crossing the coexistence region by continuously increasing the strain rate . If is varied sufficiently slowly, so that the system has time to reach the true shear banded steady state at each instantaneous value of , then the resulting will be continuous, with kinks where enters and leaves the coexistence region at and (these are the inverse functions of and . We show such a plot of the steady state dimensionless vs at fixed in Fig. 30.

However if is varied too rapidly for the system to achieve steady state, then we expect to find the phenomenon generally characteristic of first-order transitions. Upon increasing , the system will fall out of the true steady state, overshooting the coexistence region phase boundary to persist in the Bagnoldian phase for some range of . Increasing further, the system will at some point become too far out of the proper steady state and will switch to the Newtonian phase with a resulting jump in . Decreasing , one will see a similar phenomenon, but with hysteresis in the location of the stress jump.
To test this expectation we perform simulations at fixed in which the strain rate is ramped up and down at a fixed rate ,
| (38) |
where is for ramping up, and is for ramping down. We implement this in our simulations by changing at time intervals according to, . For convenience we define the dimensionless rate,
| (39) |
so that . Each time is updated we also rescale particle velocities,
| (40) |
and angular velocities,
| (41) |
so that the change in strain rate is imposed throughout the bulk of the system, rather than only at the boundary. We then average , and over a time interval , so as to reduce statistical fluctuations, and thus obtain our plotted results.
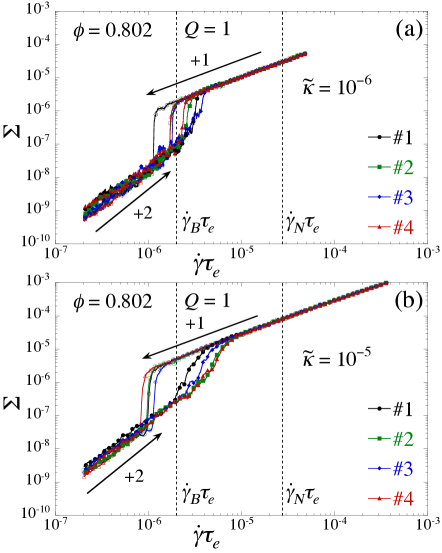
We start at an initial low strain rate well below , and increase to a largest strain rate well above . We then ramp back down to the initial strain rate. In Fig. 31 we show results for the dimensionless shear stress vs as obtained from this process at the fixed . In Fig. 31(a) we show results for the ramping rate , while in 31(b) we show results for . In each case we show results for four independent initial configurations.
We see behavior as described above. Upon increasing the system stays on the Bagnoldian branch, with , as increases above , before transitioning to the Newtonian branch, with , inside the coexistence region. Upon decreasing the system stays on the Newtonian branch throughout the coexistence region, transitioning to the Bagnoldian branch only below . The jump upwards in upon increasing is smaller and more gradual than the jump downwards upon decreasing . The location of the jumps are found to vary, without any obvious trend, as the initial configuration is varied, while the width of the hysteresis region shrinks as the ramping rate decreases. We note that we have observed similar stress jumps in model CD when ramping the strain rate near the Bagnoldian-to-Newtonian transition line . We thus find that the region of coexisting shear bands in the phase diagram provides a mechanism for the system to manifest DST, which is seen to result when the strain rate varies too rapidly for the system to relax to the shear-banded steady state corresponding to the instantaneous value of . Our results in Fig. 31 appear qualitatively similar to numerical results obtained previously for particles with intergranular elastic friction OH_friction ; Grob , except in those works the large branch displayed behavior characteristic of the jammed solid while in our case it is a Newtonian liquid.
IV Conclusions
We have demonstrated that in simple two dimensional models of athermal, soft-core, bidisperse, frictionless massive disks, we have a sharp first-order rheological transition from Bagnoldian rheology to Newtonian rheology as one varies the packing fraction and inelasticity of the collisions . Key to the existence of this transition is the presence of a viscous dissipation acting in the tangential direction at the point of contact of two particles in collision. Within this framework, we find that the system always becomes Newtonian sufficiently close to the jamming transition , however the behavior of the system at small (strongly inelastic) depends dramatically on the precise form of the tangential dissipation. When the dissipation couples only to the translational motion (our model CD) then the system at small is always Newtonian for any packing fraction . But when the rotational motion is coupled to the translational motion (our model CDrot), then rotational motion can compensate for relative translational motion, and act to effectively eliminate the tangential dissipation. In this case we find that our system has Bagnoldian rheology at small , and Newtonian rheology at large .
We find that the main distinguishing feature between systems with Newtonian vs Bagnoldian rheology is that in Newtonian rheology the average number of contacts per particle stays finite as the strain rate , while in Bagnoldian rheology as . Thus Newtonian rheology is associated with the formation of large connected clusters. The transition from Bagnoldian to Newtonian rheology upon decreasing below in either model CD or CDrot results from the increasing inelasticity of the collisions, which act to damp out relative motion; below the critical , the duration of a collision grows dramatically and particles remain in contact. The nature of the transition from Bagnoldian to Newtonian rheology upon increasing at small in model CDrot is somewhat more subtle. At low , the particles are able to adjust their rotational motion so that the tangential component of the relative contact velocity at a collision is very small or vanishing, greatly reducing or eliminating the tangential dissipation. As a consequence, the tangential relative motion of the particles’ centers of mass is not damped, particles may separate after a collision, so no large persistent clusters form and the rheology stays Bagnoldian. As increases however, we find that the average number of particles participating in any given collision increases, and so we speculate that above a critical , such multi-particle collisions serve to constrain the rotational motion of the particles in contact, tangential dissipation rises, relative motion is damped, and large persistent clusters form.
We have further studied this Bagnoldian-to-Newtonian rheological transition at small in model CDrot to explore the behavior of the system as a function of increasing shear strain rate . We find that as increases, the discontinuous first-order rheological transition opens up into a region of finite width in the plane consisting of coexisting shear bands of Bagnoldian and Newtonian rheology in mechanical equilibrium with each other. Thus the interplay of inertia and tangential dissipation gives rise to a mechanism for shear banding, even in our simple homogeneous system of frictionless, repulsive, spherical particles.
We have also considered the behavior of our model CDrot as one crosses the above coexistence region by ramping the shear strain rate up and down, holding the system at constant volume. When is ramped at a rate too fast for the system to settle into the true steady-state shear-banded configurations, then one can have hysteretic, discontinuous, jumps in stress as the system transitions between the Bagnoldian and Newtonian phases, similar to such phenomena in first-order equilibrium phase transitions. Thus the shear banding coexistence region can provide a possible mechanism for discontinuous shear thickening, even for particles with no microscopic inter-granular friction Hayakawa2 .
It will be interesting to investigate how robust is the shear-banding phase diagram we have found to the inclusion of other physical effects commonly found in experimental systems of interest. In our models the energy dissipation is taken to occur only via the collisions between particles. In non-Brownian suspensions, emulsions, and colloids, however, the particles are embedded within some fluid host matrix, and so one expects there to be a viscous damping, via Stokes drag, between the particles and the host fluid. There should thus be an additional viscous force , where is the velocity of particle , and is the local fluid velocity at particle ; a similar damping of rotational motion should also be included. Such a viscous drag will result in a rheology that is always Newtonian at sufficiently small . However, depending on the value of the viscous drag coefficient , upon increasing inertial effects can become important again and there can be a crossover where the system crosses smoothly from Newtonian to Bagnoldian-like behavior Bagnold . Indeed, it has been argued that in granular suspensions vanishes linearly as the packing fraction increases towards the jamming Fall . It thus may be that is sufficiently small near our Bagnoldian-to-Newtonian transition at , and so the coexistence region may survive for some finite range of .
Another interesting modification of our model would be to include random fluctuating forces to model finite temperature effects in colloids. Such thermal forces should also result in a Newtonian rheology at sufficiently small . However, if is the thermal relaxation time, one might expect such thermal effects to become unimportant when the shear strain rate is sufficiently large, OT-thermal ; Ikeda2 ; Kawasaki . Indeed, the shear bands observed in the colloids of Ref. Chikkadi were exactly in this region of . Thus, if near is sufficiently small, again our coexistence region may survive.
Finally it will be interesting to add inter-particle microscopic friction to our model, and study the interplay between the shear banding we observe in this work, and the DST of the frictional models studied in Refs. OH_friction ; Heussinger ; Grob ; Grob2 . Aside from the possible DST in our present model, as discussed in Sec. III.4, it is worth noting that our shear banding transition shares some of the physical phenomena believed to be at work in the DST of the frictional models. In particular, our shear banding transition marks the transition from a Bagnoldian phase, where there are few instantaneous particle contacts and such contacts are short lived, to a Newtonian phase, where there are contacts per particle and the contacts are persistent. The DST of frictional models is similarly believed to result from a transition between a region where there are few direct particle contacts, to a region where there are many. It thus may be that our shear banding transition will serve as a trigger for the onset of strong frictional contacts that leads to enhanced DST. We must leave these further investigations, outlined above, to future work.
Acknowledgements
This work was supported in part by the European Research Council under the European Union s Seventh Framework Programme (FP7/2007-2013), ERC Grant Agreement No. 306845. Early stages of this work were supported by National Science Foundation Grant No. DMR-1205800 and the Swedish Research Council Grant No. 2010-3725. Simulations were performed on resources provided by the Swedish National Infrastructure for Computing (SNIC) at PDC and HPC2N.
Appendix A
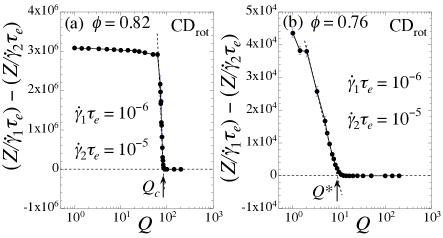
In this Appendix we describe the specific methods we use to map out the phase diagram of model CDrot, shown in Fig. 17. To determine the transition line at large , we use our result, as discussed in connection with Figs. 14(a) and (b), that for the Bagnoldian region we have as , while for the Newtonian region we have constant as . Thus, for sufficiently small at fixed and , we expect will be independent of for , while will increase with decreasing for . We thus consider two small strain rates and , and compute the difference as a function of at fixed . By the preceding observations, this quantity should vanish for and be non-zero for . In Fig. 32(a) we plot this quantity vs for the case with packing fraction . The point where increases from zero upon decreasing thus locates the transition .
To locate the crossover line at smaller , that separates the weakly inelastic Bagnoldian region from the strongly inelastic Bagnoldian region , we use the same approach. As discussed in connection with Figs. 14(c) and (d), for we again have . For we found that as , but that this dependence is slower than linear in . Thus will again vanish for and be non zero for . In Fig. 32(b) we plot this quantity vs for the case with . The point where increases from zero upon decreasing thus locates the crossover . Proceeding in this manner at other values of fixed we thus map out the curves and in the phase diagram of Fig. 17.
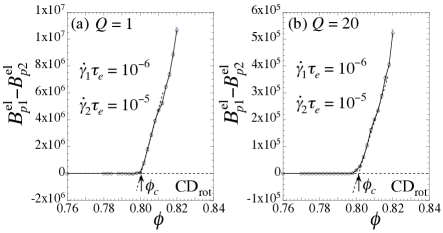
To determine the transition at small , that separates the Bagnoldian region from the Newtonian region at , we consider the Bagnold coefficient . In the Bagnoldian region at sufficiently small we have is independent of . In the Newtonian region, where is independent of , we have from Eqs. (19) and (20) that . Thus if we compute the difference , where the two Bagnold coefficients are computed at and respectively, then this quantity will vanish in the Bagnoldian region , and become non-zero in the Newtonian region . In Fig. 33 we show examples of this analysis for the cases and . The point where increases from zero upon increasing thus locates the transition . Proceeding in this manner at other values of fixed we thus map out the curve to complete the phase diagram of Fig. 17. We caution that the precise location of the transition lines in this phase diagram may be expected to shift slightly if one considers smaller strain rates and larger system sizes.
Appendix B
In this Appendix we consider the contour of constant pressure that passes through the coexistence region of model CDrot (the dashed line in Fig. 25), and address the issue of why the values of and , that describe the local packing fraction and strain rate of the two shear bands in Fig. 28, are found to be slightly different from the values and at which the contour enters and exits the coexistence region. We will argue that this difference is due to a finite-size-effect.
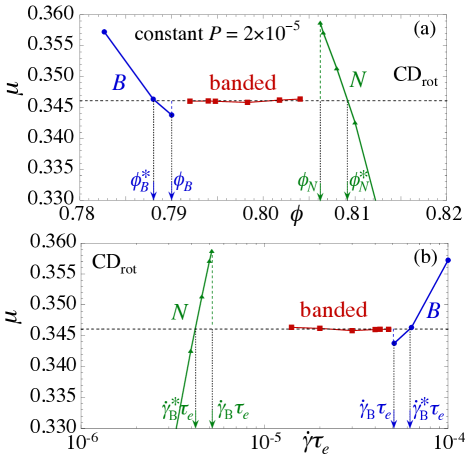
To highlight the difference between and , and between and , we consider the behavior of the macroscopic friction as we pass through the coexistence region on the contour of constant pressure. In Fig. 34(a) we plot vs the global along this contour of constant . In this figure circles represent points in the homogeneous Bagnoldian phase, triangles are points in the homogeneous Newtonian phase, while squares are points in the shear banded coexistence region. We define as the highest packing fraction in the homogeneous Bagnoldian phase, and as the lowest packing fraction in the homogeneous Newtonian phase, as indicated in the figure.
Since we are varying at constant , and since in the coexistence region the shear bands must be in mechanical equilibrium with equal and , we thus expect that must also remain constant as we pass through the coexistence region at constant . We indeed see in Fig. 34(a) that this is so. However this constant is not the value of at either or , but rather we have to enter deeper into the homogeneous phase regions to and , as indicated in the figure, to find homogeneous states with this value of . In Fig. 34(b) we make a similar plot of vs the global , along this same contour of constant . Fig. 34 thus allows us to read off the above defined values of and , and we find to these to agree well with the values found in Fig. 28 for the local packing fractions and strain rates within the two coexisting bands. We can also read off from Fig. 34 the values of and which give the coexistence region boundaries. We thus see that , and there appears to be small but sharp jumps in (and hence ) as we cross from the homogeneous regions into the coexistence region.
By sampling other points throughout the shear banded coexistence region, and measuring the packing fraction and strain rate in the two coexisting phases, we can determine the values of and corresponding to other fixed pressures. We find that these values all lie on common curves and within the plane, as we show in Fig. 35. We see that the difference between and is greatest at low , while the difference between and is greatest near the critical end point.
Returning to Fig. 34, we note that the constant within the shear banding coexistence region is analogous to the Maxwell construction of a mean-field first-order equilibrium phase transition Max . However for a first-order equilibrium transition, we would expect this curve to be continuous and monotonic. Defining as the fraction of the system in the Bagnoldian phase, we would have expected that varies smoothly from to as the system crosses from the Bagnoldian side to the Newtonian side. However the difference between and , and between and shows that this does not happen. Since we must have for the global average , and since , it must be the case that as the system enters the coexistence region at , and similarly since , we must have when the system exists the coexistence region at .
To interpret this unexpected result, we speculate that and may be the true boundaries of the coexistence region, and that the stability of the homogeneous phase within the region between and and between and is a finite size effect, explained as follows. In the coexistence region, the width of the interface over which the system transitions from the Bagnoldian band to the Newtonian band should have some characteristic size set by a correlation length that remains finite as long as one is not at the critical end point. The widths of the bands themselves are set by the system width . As , the width of the interface always becomes negligible compared to the widths of the bands. However, for finite , as one approaches close to the coexistence line from within the shear banded region, the width of one of the bands is decreasing and will ultimately become of order . At that point the decrease in free energy (assuming our athermal, non-equilibrium, system has something analogous to a free energy) obtained by phase separating may be smaller than the increase in free energy needed to create the interface between the bands. The homogeneous phase may thus become stabilized. Looking at the profiles of and in Fig. 28, we see that the width of the interface is generally non-negligible compared to the width of our system, and so such a finite size effect in our system may be large and noticeable.
We now test this notion by checking whether the boundaries and show any noticeable dependence on the system size. In Fig. 36 we plot the shear banding parameter of Eq. (37) vs , comparing results for our system with particles against a system of half the length, with particles. We show results for two different strain rates, and . For , for which Fig. 35 shows essentially no difference between and but a noticeable difference between and , we see that there is little finite size effect for , but a strong finite size effect for . For , for which Fig. 35 shows a noticeable difference between both and and between and , we see a noticeable finite size effect in the location of both and . For both strain rates, we find that the width of the coexistence region shrinks as the system size gets smaller. We thus find, in support of our above speculation, that finite size effects appear in the locations of and wherever and . We thus suppose that we would find , and , if we could look at systems with much larger .
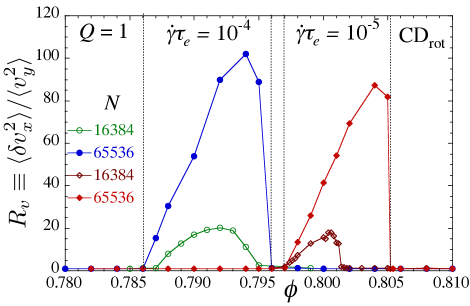
We note that another manifestation of such a finite size effect may be directly seen in Fig. 28. We can determine the width of the Bagnoldian band by the intersection of the packing fraction profile with the global average , so that the fraction of the system in the Bagnoldian band is . Such a definition gives the correct relation . We can then proceed similarly using the strain rate profile , to define an so that . We then find that, although and are close, they are not equal. This can be verified by comparing the location of the vertical dashed lines in Figs. 28 (d) – (f) with those in (g) – (i). The difference between and is a consequence of the fact that the width of the interface is a non-negligible fraction of the system width .
References
- (1) D. Vågberg, P. Olsson, and S. Teitel, “Dissipation and rheology of sheared soft-core frictionless disks,” Phys. Rev. Lett. 112, 208303 (2014).
- (2) P. Olsson and S. Teitel, “Critical scaling of shear viscosity at the jamming transition,” Phys. Rev. Lett. 99, 178001 (2007).
- (3) G. Lois, A. Lemaître, and J. M. Carlson, “Numerical tests of constitutive laws for dense granular flows,” Phys. Rev. E 72, 051303 (2005).
- (4) D. Vågberg, P. Olsson, and S. Teitel, “Universality of jamming criticality in overdamped shear-driven frictionless disks,” Phys. Rev. Lett. 113, 148002 (2014).
- (5) R. A. Bagnold, “Experiments on a gravity-free dispersion of large solid spheres in a Newtonian fluid under shear,” Proc. R. Soc. A 225, 49 (1954).
- (6) A. Fall, A. Lemaître, F. Bertrand, D. Bonn, and G. Ovarlez, “Shear thickening and migration in granular suspensions,” Phys. Rev. Lett. 105, 268303 (2010).
- (7) C. Heussinger and J.-L. Barrat, “Jamming transition as probed by quasistatic shear flow,” PRL 102, 218303 (2009).
- (8) P. Olsson and S. Teitel, “Critical scaling of shearing rheology at the jamming transition of soft-core frictionless disks,” Phys. Rev. E 83, 030302R (2011).
- (9) E. Lerner, G. Düring, and M. Wyart, “A unified framework for non-Brownian suspension flows and soft amorphous solids,” PNAS 109, 4798 (2012).
- (10) E. DeGiuli, G. Düring, E. Lerner, and M. Wyart, “Unified theory of inertial granular flows and non-Brownian suspensions,” Phys. Rev. E 91, 062206 (2015).
- (11) T. Kawasaki, D. Coslovich, A. Ikeda, and L. Berthier, “Diverging viscosity and soft granular rheology in non-Brownian suspensions,” Phys. Rev. E 91, 012203 (2015).
- (12) D. Vågberg, P. Olsson, and S. Teitel, “Critical scaling of Bagnold rheology at the jamming transition of frictionless two dimensional disks,” Phys. Rev. E 93, 052902 (2016).
- (13) D. Vågberg, P. Olsson, and S. Teitel, “Effect of collisional elasticity on the Bagnold rheology of sheared frictionless two dimensional disks,” Phys. Rev. E 95, 0121902 (2017).
- (14) P. Olsson and S. Teitel, “Herschel-Bulkley shearing rheology near the athermal jamming transition,” Phys. Rev. Lett 109, 108001 (2012).
- (15) M. Otsuki and H. Hayakawa, “Critical scaling near jamming transition for frictional granular particles,” Phys. Rev. E 83, 051301 (2011).
- (16) D. Bi, J. Zhang, B. Chakraborty, and R. P. Behringer, “Jamming by shear,” Nature 480, 355 (2011).
- (17) C. Heussinger, “Shear thickening in granular suspensions: Interparticle friction and dynamically correlated clusters,” Phys. Rev. E 88, 050201R (2013).
- (18) M. P. Ciamarra, R. Pastore, M. Nicodemi, and A. Coniglio, “Jamming phase diagram for frictional particles,” Phys. Rev. E 84, 041308 (2011).
- (19) M. Grob, C. Heussinger, and A. Zippelius, “Jamming of frictional particles: A nonequilibrium first-order phase transition,” Phys. Rev. E 89, 050201R (2014).
- (20) M. Grob, A. Zippelius, and C. Heussinger, “Rheological chaos of frictional grains,” Phys. Rev. E 93, 030901R (2016).
- (21) S. Henkes, D. A. Quint, Y. Fily, and J. M. Schwarz, “Rigid cluster decomposition reveals criticality in frictional jamming,” Phys. Rev. Lett. 116, 028301 (2016).
- (22) I. R. Peters, S. Majumdar, and H. M. Jaeger, “Direct observation of dynamic shear jamming in dense suspensions,” Nature 532, 214 (2016).
- (23) M. E. Cates and S. M. Fielding, “Rheology of giant micelles,” Adv. Phys. 55, 799 (2006).
- (24) P. Coussot, J. S. Raynaud, F. Bertrand, P. Moucheront, J. P. Guilbaud, H. T. Huynh, S. Jarny, and D. Lesueur, “Coexistence of liquid and solid phases in flowing soft-glassy materials,” Phys. Rev. Lett. 88, 218301 (2002).
- (25) G. Ovarlez, F. Bertrand, and S. Rodts, “Local determination of the constitutive law of a dense suspension of noncolloidal particles through magnetic resonance imaging,” J. Rheol. 50, 259 (2006).
- (26) G. Ovarlez, S. Rodts, X. Chateau, and P. Coussot, “Phenomenology and physical origin of shear-localization and shear-banding in complex fluids,” Rheol. Acta 48, 831 (2009).
- (27) A. Kabla and G. Debrégeas, “Local stress relaxation and shear banding in a dry foam under shear,” Phys. Rev. Lett. 90, 258303 (2003).
- (28) H. M. Jaeger, S. R. Nagel, and R. P. Behringer, “Granular solids, liquids, and gases,” Rev. Mod. Phys. 68, 1259 (1996).
- (29) D. M. Mueth, G. F. Debregeas, G. S. Karczmar, P. J. Eng, S. R. Nagel, and H. M.Jaeger, “Signatures of granular microstructure in dense shear flows,” Nature 406, 385 (2000).
- (30) J. W. Rudnicki and J. R. Rice, “Conditions for the localization of deformation in pressure-sensitive dilatant materials,” J. Mech. Phys. Solids 23, 371 (1975).
- (31) F. Spaepen, “A microscopic mechanism for steady state inhomogeneous flow in metallic glasses,” Acta Metall. 25, 407 (1977).
- (32) J. Li, F. Spaepen, and T. C. Hufnagel, “Nanometre-scale defects in shear bands in a metallic glass,” Philos. Mag. A 82, 2623 (2002).
- (33) R. Besseling, L. Isa, P. Ballesta, G. Petekidis, M. E. Cates, and W. C. K. Poon, “Shear banding and flow-concentration coupling in colloidal glassses,” Phys. Rev. Lett. 105, 268301 (2010).
- (34) V. Chikkadi, D. M. Miedema, M. T. Dang, B. Nienhuis, and P. Schall, “Shear banding of colloidal glasses: Observation of a dynamic first-order transition,” Phys. Rev. Lett. 113, 208301 (2014).
- (35) P. Schall and M. van Hecke, “Shear bands in matter with granularity,” Annu. Rev. Fluid Mech. 42, 67 (2010).
- (36) M. Lätzel, S. Luding, H. J. Herrmann, D. W. Howell, and R. P. Behringer, “Comparing simulation and experiment of a 2D granular couette shear device,” Eur. Phys. J. E 11, 325 (2003).
- (37) Y. H. Wang, K. Krishan, and M. Dennin, “Impact of boundaries on velocity profiles in bubble rafts,” Phys. Rev. E 73, 031401 (2006).
- (38) J. D. Goddard, “Material instability in complex fluids,” Annu. Rev. Fluid Mech. 35, 113 (2003).
- (39) P. C. F. Møller, S. Rodts, M. A. J. Michels, and D. Bonn, “Shear banding and yield stress in soft glassy materials,” Phys. Rev. E 77, 041507 (2008).
- (40) M. Dennin, “Discontinuous jamming transitions in soft materials: coexistence of flowing and jammed states,” J. Phys.: Condes. Matter 20, 283103 (2008).
- (41) S. M. Fielding, “Complex dynamics of shear banded flows,” Soft Matter 3, 1262 (2007).
- (42) J. K. G. Dhont and W. J. Briels, “Gradient and vorticity banding,” Rheol Acta 47, 257 (2008).
- (43) P. .D. Olmsted, “Perspectives on shear banding in complex fluids,” Rheol. Acta 47, 283 (2008).
- (44) K. Kang, M. P. Lettinga, Z. Dogic, and J. K. G. Dhont, “Vorticity banding in rodlike virus suspensions,” Phys. Rev. E 74, 026307 (2006).
- (45) A. Fall, F. Bertrand, G. Ovarlez, and D. Bonn, “Yield stress and shear banding in granular suspensions,” Phys. Rev. Lett. 103, 178301 (2009).
- (46) D. Bonn and M. M. Denn, “Yield stress fluids slowly yield to analysis,” Science 324, 1401 (2009).
- (47) A. Fall, J. Paredes, and D. Bonn, “Yielding and shear banding in soft glassy materials,” Phys. Rev. Lett. 105, 225502 (2010).
- (48) E. Brown and H. M. Jaeger, “Shear thickening in concentrated suspensions: phenomenology, mechanisms, and relations to jamming,” Rep. Prog. Phys. 77, 046602 (2014).
- (49) N. Fernandez, R. Mani, D. Rinaldi, D. Kadau, M. Mosquet, H. Lombois-Burger, J. Cayer-Barrioz, H. J. Herrmann, N. D. Spencer, and L. Isa, “Microscopic mechanism for shear thickening of non-Brownian suspensions,” Phys. Rev. Lett. 111, 108301 (2013).
- (50) R. Seto, R. Mari, J. F Morris, and M. M. Denn, “Discontinuous shear thickening of frictional hard-sphere suspensions,” Phys. Rev. Lett. 111, 218301 (2013).
- (51) R. Mari, R. Seto, J. F. Morris, and M. M. Denn, “Shear thickening, frictionless and frictional rheologies,” J. Rheol. 58, 1693 (2014).
- (52) N. Y. C. Lin, B. M. Guy, M. Hermes, C. Ness, J. Sun, W. C. K. Poon, and I. Cohen, “Hydrodynamic and contact contributions to continuous shear thickening in colloidal suspensions,” Phys. Rev. Lett. 115, 228304 (2015).
- (53) M. Wyart and M. E. Cates, “Discontinuous shear thickening without inertia in dense non-Brownian suspensions,” Phys. Rev. Lett. 112, 098302 (2014).
- (54) M. Maiti, A. Zippelius, and C. Heussinger, “Friction-induced shear thickening: A microscopic perspective,” Europhys. Lett. 115, 54006 (2016).
- (55) K. Saitoh and H. Hayakawa, “A microscopic theory for discontinuous shear thickening of frictional granular materials,” preprint arxiv:1611.06030.
- (56) C. S. O’Hern, L. E. Silbert, A. J. Liu and S. R. Nagel, “Jamming at zero temperature and zero applied stress: The Epitome of disorder,” Phys. Rev. E 68, 011306 (2003).
- (57) D. J. Durian, “Foam mechanics at the bubble scale,” Phys. Rev. Lett. 75, 4780 (1995); “Bubble-scale model of foam mechanics: Melting, nonlinear behavior, and avalanches,” Phys. Rev. E 55, 1739 (1997).
- (58) Y-h. Taguchi, “New origin of a convective motion: Elastically induced convection in granular materials,” Phys. Rev. Lett. 69, 1367 (1992).
- (59) S. Luding, E. Clément, A. Blumen, J. Rajchenbach, and J. Duran, “Anomalous energy dissipation in molecular-dynamics simulations of grains: The ‘detachment’ effect,” Phys. Rev. E 50, 4113 (1994).
- (60) S. Luding, E. Clément, A. Blumen, J. Rajchenbach, and J. Duran, “Onset of convection in molecular dynamics simulations of grains,” Phys. Rev. E 50, R1762 (1994).
- (61) D. J. Evans and G. P. Morriss, Statistical Mechanics of Non-equilibrium Liquids (Academic, London, 1990).
- (62) M. Otsuki, H. Hayakawa, and S. Luding, “Behavior of pressure and viscosity at high densities for two-dimensional hard and soft granular materials,” Prog. Theor. Phys. 184, 110 (2010).
- (63) A similar crossover was observed in G. Lois, A. Lemaître, and J. M. Carlson, “Spatial force correlations in granular shear flow. I. Numerical evidence,” Phys. Rev. E 76, 021302 (2007); “Spatial force correlations in granular shear flow. II. Theoretical implications,” Phys Rev. E 76, 021303 (2007).
- (64) Recent kinetic theory calculations have argued for DST in systems with no inter-particle friction, however the DST found in such calculations exists only at very low packing fractions , and disappears as increases. See H. Hayakawa and S. Takada, “Kinetic theory of discontinuous shear thickening,” preprint arxiv:1610.06443; “Kinetic theory of discontinuous shear thickening for a dilute gas,” preprint arXiv:1611.07295.
- (65) P. Olsson and S. Teitel, “Athermal jamming versus thermalized glassiness in sheared frictionless particles,” Phys. Rev. E 88, 010301(R) (2013).
- (66) A. Ikeda,L. Berthier, and P. Sollichb, “Disentangling glass and jamming physics in the rheology of soft materials,” Soft Matter 9, 7669 (2013).
- (67) T. Kawasaki, A. Ikeda and L. Berthier, “Thinning or thickening? Multiple rheological regimes in dense suspensions of soft particles,” Europhys. Lett. 107, 28009 (2014).
- (68) J. C. Maxwell, “On the dynamical evidence of the molecular constitution of bodies,” Nature 11, 357 (1875).