A ferroelectric quantum phase transition inside the superconducting dome of Sr1-xCaxTiO3-δ
Abstract
SrTiO3, a quantum paraelectricMuller:1979 , becomes a metal with a superconducting instability after removal of an extremely small number of oxygen atomsSchooley:1964 . It turns into a ferroelectric upon substitution of a tiny fraction of strontium atoms with calciumBednorz:1984 . The two orders may be accidental neighbors or intimately connected, as in the picture of quantum critical ferroelectricityRowley:2014 . Here, we show that in Sr1-xCaxTiO3-δ (, ) the ferroelectric order coexists with dilute metallicity and its superconducting instability in a finite window of doping. At a critical carrier density, which scales with the Ca content, a quantum phase transition destroys the ferroelectric order. We detect an upturn in the normal-state scattering and a significant modification of the superconducting dome in the vicinity of this quantum phase transition. The enhancement of the superconducting transition temperature with calcium substitution documents the role played by ferroelectric vicinity in the precocious emergence of superconductivity in this system, restricting possible theoretical scenarios for pairing.
A perovskite of the family, SrTiO3 is a quantum paraelectric whose dielectric constant rises to at low temperatureMuller:1979 , but avoids long-range ferroelectric order. It becomes a metal by substituting Sr with La, Ti with Nb, or by removing O. It has been known for half a century that this metal is a superconductor at low temperaturesSchooley:1964 and the superconducting dome has a maximum K at cm-3Koonce:1967 . More recently, a sharp Fermi surface and a superconductiong ground state have been found to persist down to a carrier concentration of 1017cm-3 in SrTiO3-δLin:2013 ; Lin:2014 . In this range of carrier concentration, exceptionally low compared to any other known superconductor, the Fermi temperature is an order of magnitude lower than the Debye temperature and the ability of phonons to form Cooper pairs is questionableTakada ; Ruhman2016 . Recent theories invoke fluctuations of the ferroelectric modeEdge:2015 , longitudinal optical phononsGorkov2015 or plasmonsRuhman2016 as bosons responsible for generation of Cooper pairs.
In many unconventional superconductors, another electronic order competes with superconductivity. Here, the ferroelectric order is an obvious candidateRowley:2014 ; Edge:2015 . It emerges in SrTiO3 by isotopic substitution of 16O oxygen atoms with 18O Itoh:1999 , application of stress Uwe:1976 or substitution of a tiny fraction of Sr with CaBednorz:1984 . However, mobile electrons screen polarization and therefore only insulating solids are expected to host a ferroelectric order. Hitherto, as a paradigm, ferroelectric quantum criticality, in contrast to its magnetic counterpart, was deprived of an experimental phase diagram in which a superconducting phase and a ferroelectric order share a common boundary.
Here, we produce such a phase diagram in the case of Sr1-xCaxTiO3-δ. The main new observations are the following: i) Metallic Sr1-xCaxTiO3-δ hosts a phase transition structurally indistinguishable from the ferroelectric phase transition in insulating Sr1-xCaxTiO3; ii) The coexistence between this ferroelectric-like order and superconductivity ends beyond a threshold carrier concentration; iii) In the vicinity of this quantum phase transition, calcium substitution enhances the superconducting critical temperature and induces an upturn in the normal-state resistivity.
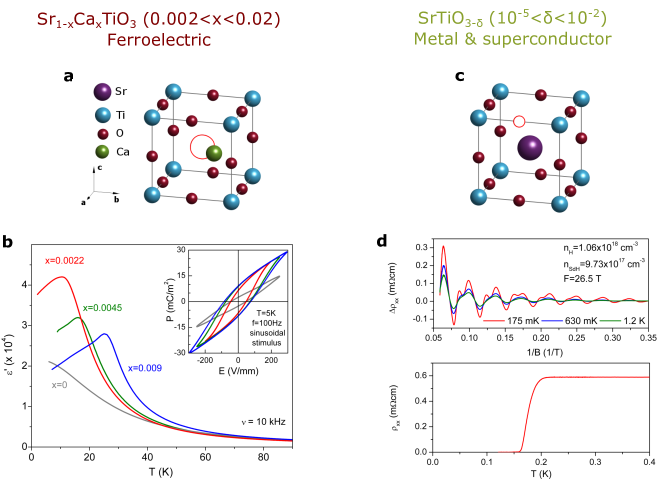
Figure 1 summarizes what we know about the emergence of ferroelectricity, metallicity and superconductivity in this system. When a small fraction of Sr atoms () is replaced with isovalent Ca, Sr1-xCaxTiO3 becomes ferroelectricBednorz:1984 with a Curie temperature steadily increasing with Ca content in the dilute limit Bednorz:1984 ; Kleemann:1988 ; Bianchi:1994 ; Kleemann:1997 ; Kleemann:2000 . Macroscopic polarization below the Curie temperature has been observed in dielectric and linear birefringence measurements and found to build up in the plane perpendicular to the tetragonal axis along the and directionsBednorz:1984 ; Kleemann:1997 . Fig.1b presents the temperature dependence of the real part of the dielectric permittivity in our Sr1-xCaxTiO3 single crystals at three different Ca contents (=0.0022;0.0045;0.009), obtained by measuring their complex conductivity. In the Ca-substituted system, there is a peak in the low temperature permittivity at the Curie temperature, and below , the polarization shows a hysteresis loop.
In SrTiO3, electric permittivity increases steadily with decreasing temperature and saturates at low temperatures due to quantum fluctuations attaining a magnitude as large as to 20000Muller:1979 ; Hemberger:1996 . The ionic radius of Ca (0.99 Å)is smaller than Sr (1.12 Å) and CaTiO3 loses its cubic symmetry at 1600 K and suffers multiple structural transitionsCarpenter:2006 without becoming ferroelectric. Its permittivity saturates to 350Ang:2001 . The stabilization of the ferroelectric order in dilute Sr1-xCaxTiO3 is restricted to a narrow window in the dilute limit of Ca content() within a highly polarizable matrix. There are two alternative ways to picture this orderKleemann:2000 . In the first one, it is driven by dipole-dipole interaction between off-center Calcium atoms, which form polarized clusters growing in size and percolating at the Curie temperature. In the second picture, the ferroelectric order is stabilized because the quantum fluctuations of the host matrix are pinned by Ca sites. A transverse Ising model with appropriate parametersWang:1998 can reproduce the critical doping for the emergence of ferroelectricity as well as the subsequent increase in the Curie temperature with Bednorz:1984 .
By heating SrTiO3 in vacuum, oxygen atoms are removed and mobile carriers are introducedSpinelli . A metal-insulator transitionMott1990 is expected above a threshold carrier concentrationEdwards , which is exceptionally low because of the long Bohr radiusLin:2013 . At a carrier density of 1017cm-3, several orders of magnitude above the expected threshold of metal-insulator transition, there is a single Fermi seaBehnia (and not a collection of metallic puddles). This picture is based on the observation of quantum oscillations (Fig.1d), with frequenciesLin:2013 ; Lin:2014 ; Allen2013 matching the carrier density expected from the magnitude of Hall coefficient. This dilute metal is subject to a superconducting instabilitySchooley:1964 ; Koonce:1967 ; Lin:2013 ; Lin:2014 . The aim of this study is to find what happens to metallicity and ferroelectricity when one removes oxygen and substitutes Sr with CaDeLima:2015 .
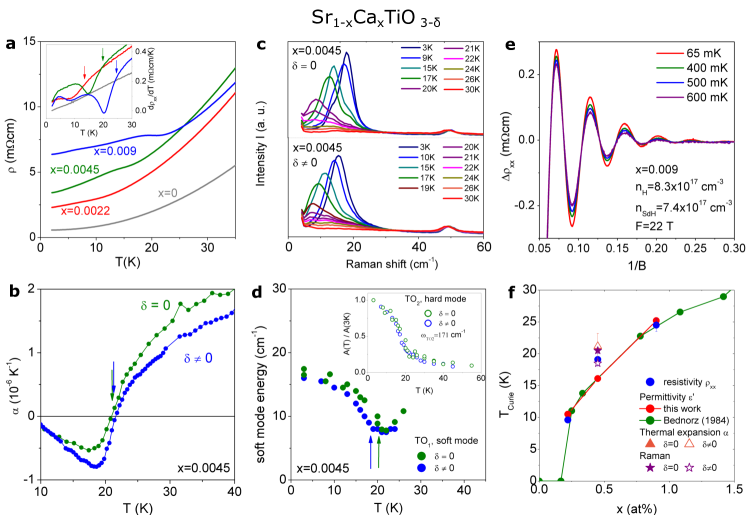
The first new result of this study is presented in Figure 2, which shows the persistence of a phase transition structurally identical to the ferroelectric phase transition in dilute metallic Sr1-xCaxTiO3-δ. As seen in Fig. 2a, the electric resistivity of these samples shows an anomaly at the Curie temperature of the parent insulating sample (see Fig.1b). This observation implies that even in presence of mobile electrons, the system goes through a ferroelectric-like phase transition at the same temperature. We checked the presence of this phase transition by two thermodynamic probes. Thermal expansion data is presented in Fig.2b. There is a clear anomaly at the Curie temperature. Its magnitude and the temperature at which it occurs are identical in an insulating and a dilute metallic sample with the same calcium content. Our data on sound velocitySupplement confirms this. We can therefore safely conclude that the phase transition giving rise to an anomaly in the resistivity of metallic samples (when the carrier concentration is in the range of 1017cm-3) is structurally identical to the one causing the peak in permittivity in the insulating sample. Further evidence is provided by Raman spectroscopy (Figs. 2c and d). The entrance to the ferroelectric state is concomitant with the activation of two transverse optical (TO) phonon modes in the Raman spectrum, because of the loss of inversion symmetry. In addition, while the TO2 mode stays hard at 171 cm-1, the low energy soft TO1 mode displays a distinctive hardening in the ferroelectric state. As seen in the figure, all these features are present, not only in the insulating sample as reported previouslyKleemann:1997 , but also in a dilute metallic sample. This implies that the low-temperature optical phonon spectrum of the metallic samples does not differ from their insulating ferroelectric counterparts. Note that the anomalies caused by the ferroelectric transition are identical in the metallic and the insulating samples. This means that the presence of mobile electrons in the solid has no incidence on the way the free energy is affected by percolation of electric dipoles. Fig.2e shows quantum oscillations of resistivity in dilute Sr1-xCaxTiO3-δ. The frequency of the oscillations does not differ from that measured on Ca-free samples at the same carrier concentration Supplement , implying that the presence of the ferroelectric-like order neither hinders the connectivity of the Fermi sea, nor modifies its depth.
Our result puts calcium-substituted-oxygen-reduced strontium titanate in the company of a handful of solids known as ’ferroelectric metals’Shi:2013 ; Benedek:2016 ; Kolodiazhnyi:2010 . The expression is used to designate a solid in which mobile electrons are present when a phase transition structurally indistinguishable from a ferroelectric transition occurs. These systems do not show bulk reversible polarization, the most strict requirement for ferroelectricity. The details of the coexistence between an interconnected Fermi sea and a ferroelectric-like transition (which would have produced a macroscopic polarisation in absence of mobile electrons) remain an open question. However, even at this stage, it is clear that metallicity and ferrolectricity interact with each other in a number of significant ways, as documented below.
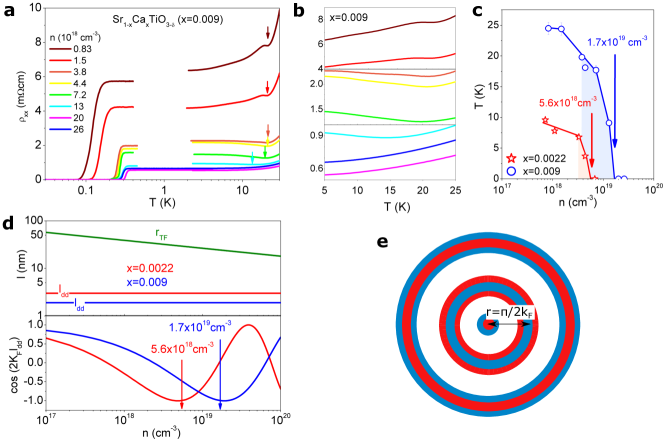
The second result of this study, a quantum phase transition destroying the ferroelectric-like transition is illustrated in Fig.3. Panel a shows the temperature dependence of resistivity in Sr0.991Ca0.009TiO3-δ. Resistivity shows both a hump at the ferroelectric transition and a drop at the superconducting transition. The samples become more conducting with increasing . Zooming on the data in Fig.3 b, one can see three distinct regimes. At low doping, the percolative ferroelectric phase transition introduces a small but clear anomaly in resistivity. Upon further doping, the resistivity displays an upturn (Fig.3 b). Finally, above a critical doping, no anomaly in resistivity is detectable and resistivity recovers a purely quadratic temperature dependence as seen in n-doped SrTiO3vandermarel:2011 ; Lin:2015 . Fig. 3 c shows the temperature of the resistive anomaly as a function of electron concentration for two different Ca contents. The ferroelectric instability is destroyed at and cm-3 for and , respectively.
The destruction of the ferroelectric-like order by doping may be ascribed to the screening of direct electric interaction between dipoles by mobile electrons. This is what has been suggestedWang:2012 in the case of BaTiO3Kolodiazhnyi:2010 , another ’ferroelectric metal’. In the latter case, the para- to ferroelectric (cubic-to-tetragonal) phase transition persists in metallic BaTiO3-δ up to a critical electron concentration of cm-3 Kolodiazhnyi:2010 . At this carrier density, the Thomas-Fermi screening length, , becomes comparable to the lattice constant (and the inter-dipole distance, ) in BaTiO3-δ (Table 1). As seen in Fig.3d, this is not the case of Sr1-xCaxTiO3-δ. For both Ca contents, the destruction of ferroelectricity happens when is more than one order of magnitude longer than . This motivates us to seek another scenario to explain how metallicity destroys ferroelectricity.
We note that, despite differing in their Curie temperature and dipole concentration by orders of magnitude, ferroelectricity in both Sr1-xCaxTiO3-δ is destroyed at a threshold of /dipole. This leads to an intriguing observation. When the destruction of ferroelectrictity occurs, the interdipole distance, and the Fermi wave-vector, kF yield (Fig.3d). An electric dipole in a Fermi sea would generate Friedel oscillations Fig.3e). The interference between oscillations of neighboring dipoles would be destructive in such a condition. We note that, even in the transverse Ising model of impurity-induced ferroelectricityWang:1998 , the polarization is not homogeneous and peaks at the Ca-sites, providing a basis for the dipole-based picture. Further theoretical studies are needed to examine this speculative scenario.
| Compound | k | k | ||||
|---|---|---|---|---|---|---|
| BaTiO3-δ Kolodiazhnyi:2010 ; Wang:2012 | 1.9 1021 | 0.4 | 0.4 | 3.82 | 1 | 1.53 |
| Sr0.991Ca0.009TiO3-δ | 1.7 1019 | 1.9 | 24 | 0.79 | 12.6 | 1.50 |
| Sr0.998Ca0.002TiO3-δ | 5.6 1018 | 3.0 | 29 | 0.55 | 9.7 | 1.65 |
Further signature of coupling between dipoles and mobile electrons is the upturn in resistivity at intermediate carrier concentrations (Fig.3 b). The Kondo effect, a many-body resonant scattering due to coupling between the Fermi sea and an alien spinHewson:1993 can give rise to such an upturn. Any quantum degeneracy of a localized state (and not only spin) may produce an Abrikosov-Suhl resonance and a variety of non-magnetic counterparts of the Kondo effect have been experimentally observed. In PbTe, another dilute metal close to a ferroelectric instability, the introduction of Tl dopants leads to (dilute superconductivity and) an upturn in resistivity, attributed to the charge Kondo effect Matsushita:2005 . A dipolar Kondo effect is a reasonable candidate for explaining the upturn in resistivity seen here. As seen, in Fig.3 c, it only occurs when percolation of the ferroelectric droplets is rapidly degrading with increasing carrier density, providing constraints for any scenario based on Kondo resonance occurring near the quantum phase transition.
Fig.4 shows how the superconducting phase diagram is affected by calcium doping in Sr0.991Ca0.009TiO3-δ. As seen in panel a, with increasing carrier concentration the superconducting transition steadily shifts to higher temperatures. At a given concentration, it occurs at a higher temperature in Ca-substituted samples compared to Ca-free ones (panel b). Note that the critical temperature according to bulk probes (specific heat, thermal conductivity and magnetic susceptibility) is significantly lower than the onset of the resistive transitionLin:2014b . As seen in Fig.4c, the onset of superconductivity seen by AC-susceptibility, which sets in below the resistive Tc, shifts to a higher temperature after Ca substitution. According to our data, at least in a finite window between the two local maxima close to two critical doping levels, and , of Ca-free SrTiO3-δLin:2014 , superconductivity is strengthened by Ca substitution. As sketched in panel d, there is a region in the phase diagram in which superconductivity and ferroelectricity coexist. Since one cannot separate the orbital and spin components of the order parameter in a non-centrosymmetric superconductorBauer:2012 , this region would be a very appealing playground for future research.
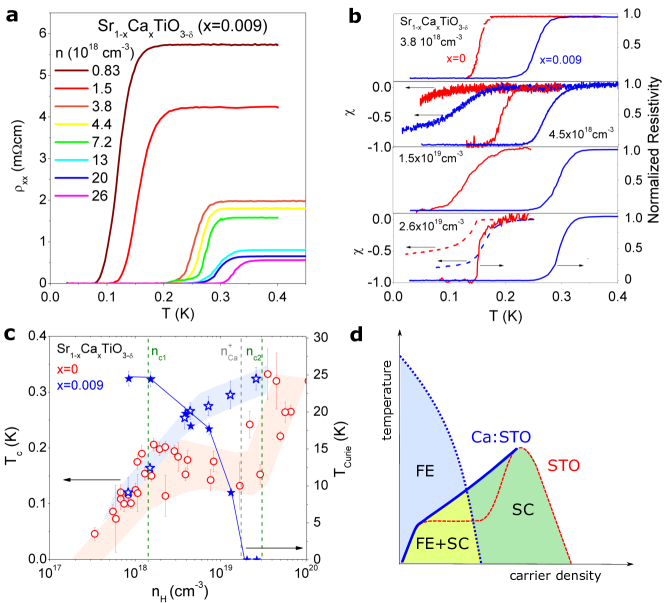
The enhancement of critical temperature by Ca substitution is observed in the vicinity of the quantum phase transition leading to the destruction of ferroelectricity. This provides a new input for the ongoing debate on the microscopic origin of superconductivityRowley:2014 ; Edge:2015 ; Gorkov2015 ; Ruhman2016 . Calcium substitution leads to a higher dielectric constant at low temperature (Fig.1 b), which would screen Coulomb repulsion between electrons. It hardens the soft ferroelectic mode(Fig.2 b). Both these features may be relevant to the observed enhancement in superconducting Tc. Edge et al.Edge:2015 have recently proposed that substituting O16 with O18 should drastically change the superconducting dome of n-doped SrTiO3. They predicted that such a substitution would enhance the highest critical temperature and shift it to lower doping. This is a quantum critical ferroelectricRowley:2014 scenario, in which the maximum Tc is pinned to the destruction of the ferroelectric order. Our observation is in qualitative agreement with this scenario. We find that Tc is enhanced in the vicinity of the critical doping at which the ferroelectric-like order is destroyed (ncm-3 in Sr0.991Ca0.009TiO3-δ). For this level of Ca content, n lies between the two critical doping levels, and , of Ca-free SrTiO3-δ where the Tc is almost flatLin:2014 . A definite confirmation of the quantum critical scenario requires an extensive study employing bulk probesLin:2014b and confirming that the enhancement in critical temperature occurs always near n, which shifts with Ca content, and is not pinned to and .
This work has been supported by ANR (through the SUPERFIELD and QUANTUM LIMIT projects), by an Ile de France regional grant, by Fonds ESPCI-Paris, by DFG research grant HE-3219/2-1 and by the Institutional Strategy of the University of Cologne within the German Excellence Initiative. XL is supported by the Alexander von Humboldt Foundation.
References
- (1) K. A. Müller and H. Burkhard. SrTiO3: An intrinsic quantum paraelectric below 4 K. Phys. Rev. B 19, 3593 (1979).
- (2) J. F. Schooley, W. R. Hosler, and M. L. Cohen. Superconductivity in Semiconducting SrTiO3. Phys. Rev. Lett. 12, 474 (1964).
- (3) J. G. Bednorz and K. A. Müller. Sr1-xCaxTiO3 : An XY Quantum Ferroelectric with Transition to Randomness. Phys. Rev. Lett. 52, 2289 (1984).
- (4) S. E. Rowley, L. J. Spalek, R. P. Smith, M. P. M. Dean, M. Itoh, J. F. Scott, G. G. Lonzarich and S. S. Saxena. Ferroelectric quantum criticality. Nature Phys. 10, 367 (2014).
- (5) C. S. Koonce, M. L. Cohen, J. F. Schooley, W. R. Hosler and E. R. Pfeiffer. Superconducting Transition Temperatures of Semiconducting SrTiO3. Phys. Rev. 163, 380 (1967)
- (6) X. Lin, Z. Zhu, B. Fauqué, and K. Behnia. Fermi Surface of the Most Dilute Superconductor. Phys. Rev. X 3, 021002 (2013).
- (7) X. Lin, G. Bridoux, A. Gourgout, G. Seyfarth, S. Krämer, M. Nardone, B. Fauqué and K. Behnia. Critical Doping for the Onset of a Two-Band Superconducting Ground State in SrTiO3-δ. Phys. Rev. Lett. 112, 207002 (2014).
- (8) Y. Takada. Theory of superconductivity in polar semiconductors and its application to n-type semiconducting SrTiO3, J. Phys. Soc. Jpn. 49 1267(1980).
- (9) J. Ruhman and P. A. Lee. Superconductivity at very low density: the case of strontium titanate. Phys. Rev. B 94, 224515 (2016).
- (10) J. M. Edge, Y. Kedem, U. Aschauer, N. A. Spaldin, and A. V. Balatsky. Quantum Critical Origin of the Superconducting Dome in SrTiO3, Phys. Rev. Lett. 115, 247002 (2015).
- (11) L. P. Gorkov. Phonon mechanism in the most dilute superconductor: n-type SrTiO3. PNAS 113, 4646 (2016).
- (12) M. Itoh, R. Wang, Y. Inaguma, T. Yamaguchi, Y-J. Shan, and T. Nakamura. Ferroelectricity Induced by Oxygen Isotope Exchange in Strontium Titanate Perovskite. Phys. Rev. Lett. 82, 3540 (1999).
- (13) H. Uwe and T. Sakudo. Stress-induced ferroelectricity and soft phonon modes in SrTiO3. Phys. Rev. B 13, 271 (1976).
- (14) W. Kleemann, F. J. Schäfer, K. A. Müller and J. G. Bednorz. Domain state properties of the random-field xy-model system Sr1-xCaxTiO3. Ferroelectrics 80, 297 (1988).
- (15) U. Bianchi, W. Kleemann and J. G. Bednorz. Raman scattering of ferroelectric Sr1-xCaxTiO3, x=0.007. J. Phys.: Condens. Matter 6, 1229 (1994).
- (16) W. Kleemann, A. Albertini, M. Kuss and R. Lindner. Optical detection of symmetry breaking on a nanoscale in SrTiO3:Ca. Ferroelectrics 203, 57 (1997).
- (17) W. Kleemann, J Dec, Y. G. Wang, P. Lehnen and S.A Prosandeev. Phase transitions and relaxor properties of doped quantum paraelectrics. J. Phys. Chem. Sol. 61, 167 (2000).
- (18) J. Hemberger, M. Nicklas, R. Viana, P. Lunkenheimer, A. Loidl and R. Böhmer. Quantum paraelectric and induced ferroelectric states in SrTiO3. J. Phys.: Condens. Matter 8, 4673 (1996).
- (19) M. A. Carpenter, C. J Howard, K. S. Knight and Z. Zhang. Structural relationships and a phase diagram for (Ca,Sr)TiO3 perovskites. J. Phys. Condens. Matter 18, 10725 (2006).
- (20) C. Ang, A. S. Bhalla, and L. E. Cross. Dielectric behavior of paraelectric KTaO3 , CaTiO3, and Ln1/2Na1/2 TiO3 under a dc electric field. Phys. Rev. B 64, 184104 (2001)
- (21) Y. G. Wang, W. Kleemann, W. L. Zhong, and L. Zhang. Impurity-induced phase transition in quantum paraelectrics Phys. Rev. B 57, 13343 (1998).
- (22) A. Spinelli, M. A. Torija , C. Liu, C. Jan and C. Leighton. Electronic transport in doped SrTiO3: Conduction mechanisms and potential applications. Phys. Rev. B 81, 155110 (2010)
- (23) N. F. Mott. Metal-insulator transitions, second edition. Taylor and Francis, London (1990).
- (24) P. P. Edwards and M. J. Sienko. Universality aspects of the metal–nonmetal transition in condensed media. Phys. Rev. B 17, 2575 (1978).
- (25) K. Behnia, On mobility of electrons in a shallow Fermi sea over a rough seafloor. J. Physics: Condens. Matt. 27, 375501 (2015).
- (26) S. J. Allen, B. Jalan, S. Lee, D. G. Ouellette, G. Khalsa, J. Jaroszynski, S. Stemmer, and A. H. MacDonald. Conduction-band edge and Shubnikov–de Haas effect in low-electron-density SrTiO3. Phys. Rev. B 88, 045114 (2013)
- (27) B. S. de Lima et al. Interplay between antiferrodistortive, ferroelectric, and superconducting instabilities in Sr1-xCaxTiO3−δ. Phys. Rev. B 91, 045108 (2015)
- (28) Information on sample details and experimental methods can be found in the supplement.
- (29) A. C. Hewson. The Kondo Problem to Heavy Fermions (Cambridge Univ. Press, Cambridge, 1993).
- (30) Y. Shi et al. A ferroelectric-like structural transition in a metal. Nature Materials 12, 1024 (2013).
- (31) N. A. Benedek and T. Birol. ‘Ferroelectric’ metals reexamined: fundamental mechanisms and design considerations for new materials. J. Mater. Chem. C 4, 4000 (2016).
- (32) T. Kolodiazhnyi, M. Tachibana, H. Kawaji, J. Hwang and E. Takayama-Muromachi. Persistence of Ferroelectricity in BaTiO3 through the Insulator-Metal Transition. Phys. Rev. Lett. 104, 147602 (2010).
- (33) Y. Wang, X. Liu, J. D. Burton, S. S. Jaswal and E. Y. Tsymbal. Ferroelectric Instability Under Screened Coulomb Interactions. Phys. Rev. Lett. 109, 247601 (2012).
- (34) D. van der Marel, J. L. M. van Mechelen and I. I. Mazin, Common Fermi-liquid origin of resistivity and superconductivity in n-type SrTiO3. Phys. Rev. B 84, 205111 (2011).
- (35) X. Lin, B. Fauqué and K. Behnia. resistivity in in a small single-component Fermi surface. Science 349, 945 (2015).
- (36) Y. Matsushita, H. Bluhm, T. H. Geballe, and I. R. Fisher. Evidence for Charge Kondo Effect in Superconducting Tl-Doped PbTe. Phys. Rev. Lett. 94, 157002 (2005).
- (37) X. Lin et al. Multiple nodeless superconducting gaps in optimally doped SrTi1−xNbxO3. Phys. Rev. B 90, 140508(R) (2014)
- (38) E. Bauer and M. Sigrist, Editors, Non-Centrosymmetric Superconductors, Introduction and Overview, Springer(2012).
Supplementary Information
I Samples and experimental techniques
For this work we used commercially obtained SrTiO3 and Sr1-xCaxTiO3 (, 0.0045 and 0.009) single crystals. The nominal calcium concentration of two samples was checked using the Secondary Ion Mass Spectrometry (SIMS) analysis technique as detailed previouslyDeLima:2015 . The oxygen content has been changed by heating the samples in vacuum (pressure mbar) to temperatures of ∘C. In order to attain carrier densities above cm-3, a piece of titanium has been placed next to the sample during heating. Ohmic contacts have been realized prior to oxygen removal by evaporation of gold contact pads.
The electrical measurements have been performed in a Quantum Design Physical Property Measurement System (PPMS) between 1.8 and 300 K as well as in a 17 T dilution refrigerator with a base temperature of 26 mK. Detailed electrical transport information on all samples presented in the main text is listed in Tab. S2 of this supplement.
The ac magnetic susceptibility was measured in a homemade set-up, comprising a primary coil and a compensating pick-up coil with two sub-coils with their turns in opposite direction. A Lock-in amplifier was utilized to supply the exciting ac current and pick up the induced voltage signal. The applied ac field was as low as 10 mG with a frequency of 16 kHz.
The dielectric permittivity measurements were performed employing a frequency-response analyzer (Novocontrol Alpha-Analyzer). Using silver paint, the plate-like samples were prepared as capacitors with typical electrode dimensions of mm2 and a typical thickness of 0.5-0.85 mm. For the evaluation of the as-measured data , passivated surface layers were assumed, as described in Aso:1976 . Such layers can be considered as additional capacitors in series to the remaining bulk specimen , which limits the total capacitance data. Therefore the data were corrected assuming a temperature independent surface contribution , which results in curves comparable to literature data on surface-etched samples Aso:1976 . Measurements of -hysteresis loops were performed using the same setup with an additional high-voltage module (Novocontrol HVB1000). The actual field dependent polarization was calculated from the non-linear dielectric permittivities up to the tenth order as described in Niermann:2014 . The thermo-remanent polarization data was gained from the integrated pyro-current as collected with an electrometer (Keithley 6517) after cooling in a poling field of approximately 120 V/mm.
A home-built capacitance dilatometer has been used to detect the uniaxial length changes while continuously heating the crystal from about 5 to 150 K with a rate of about K/min. Here, was measured along the [100] directions of Sr1-xCaxTiO3-δ single crystals with total lengths mm and the uniaxial thermal expansion coefficient has been derived numerically.
The Raman measurements were performed using the 532 nm line of Diode Pumped Solid State (DPSS) laser. An incident power of 5mW was focused on a spot of dimension 50 80 m approximately. Power dependance measurements at low temperature indicated negligible laser heating for this incident power. The inelastically scattered photons were analyzed using a triple grating spectrometer working in subtractive configuration and equipped with a nitrogen cooled Charge Coupled Device (CCD) camera. The spectral resolution was about 1.5 cm-1. All spectra were recorded with linearly polarized and parallel incoming and outgoing photons. The crystals were cooled using a close-cycle optical cryostat with a base temperature of 3 K.
| RRR | ||||||
| cm-3 | mcm | mcm | cm2/Vs | K | ||
| 0.0022 | 0.72 | 1840 | 2.30 | 800 | 3770 | |
| 0.0022 | 1.1 | 1380 | 2.31 | 600 | 2456 | |
| 0.0022 | 3.3 | 553 | 1.08 | 512 | 1751 | |
| 0.0022 | 4.4 | 344 | 0.847 | 406 | 1675 | |
| 0.0022 | 6.8 | 87 | 0.625 | 139 | 1469 | 0 |
| 0.0045 | 0.66 | 1830 | 3.43 | 535 | 2760 | |
| 0.009 | 0.83 | 1470 | 6.37 | 231 | 1183 | |
| 0.009 | 1.5 | 857 | 4.17 | 206 | 1005 | |
| 0.009 | 3.8 | 394 | 2.27 | 174 | 724 | |
| 0.009 | 4.4 | 346 | 2.17 | 159 | 654 | |
| 0.009 | 7.2 | 217 | 1.48 | 147 | 586 | |
| 0.009 | 13 | 132 | 0.941 | 140 | 510 | |
| 0.009 | 20 | 91.3 | 0.656 | 139 | 476 | 0 |
| 0.009 | 26 | 70.4 | 0.542 | 130 | 443 | 0 |
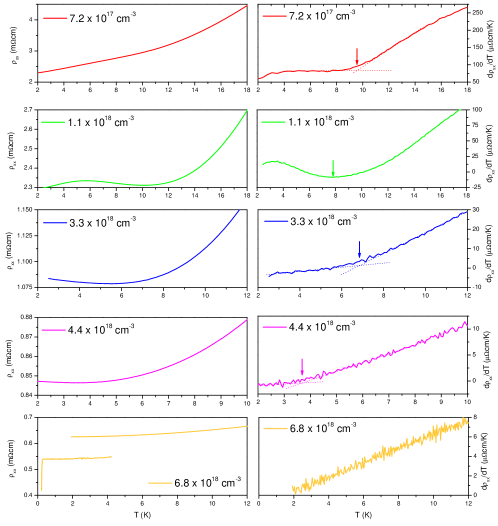
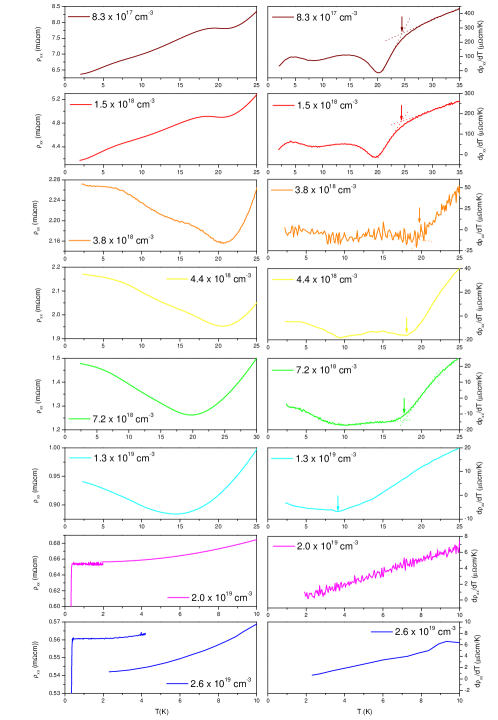
II Temperature dependence of resistivity
Figures S5 and S6 plot the resistivity as well as its derivative measured on Sr1-xCaxTiO3-δ samples with Ca contents of and 0.009, respectively, as a function of temperature . The arrows mark the temperatures associated with the resistivity anomaly and the Curie temperature seen in resistivity plotted in Fig. 2c of the main text (see also Tab. S2). The temperatures have been taken as the temperature at which shows a kink.
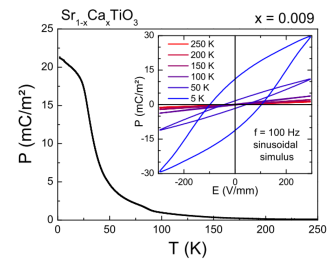
III Temperature dependence of thermo-remanent polarization
Fig. S7 displays the thermo-remanent polarization in the system Sr0.991Ca0.009TiO3. A theoretical description of the quantum ferroelectric regime according to the transverse Ising model yields values for the saturation polarization reaching up to 20 mC/m2 for a comparable Ca concentration Guo:2012 . However, as we are dealing only with the remanant polarization, the maximum value at low temperatures lies around 20 mC/m2, which is smaller due to domain formation but is still of the same order of magnitude. Upon heating above the ferroelectric ordering temperature near 25 K shows a steep fall, but does not vanish completely. Above , there is a finite frozen polarization, as seen by the opening of the hysteresis loops shown in the inset of Fig. S7. Obviously, polar entities like ferroelectric clusters or polar structural domain walls persist to temperatures well above the ferroelectric transition. The latter is in accord to results gained from ultrasound experiments even in pure STO Salje:2013 . A corresponding characterization of the oxygen-reduced samples obviously cannot be made as the macroscopic polarization features are shielded by the metallic background.
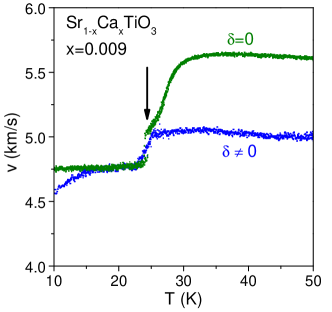
IV Detection of the phase transition with sound-velocity measurements
The sound velocity was measured in transmission geometry using longitudinal 10 MHz PZT-transducers as emitter and detector. A network analyzer (Rohde & Schwarz ZVB4) with time domain option was used to determine the transit time trough plate-like samples with a length of typically 5 mmBalashova:1996 . The FFT-representation of the response carries an absolute time resolution of the reciprocal resonance frequency, i.e., approximately 100 nS. However, relative changes of the transit time can be determined with much higher resolution.
The sound velocity as a function of temperature in an insulating () and metallic () Sr0.991Ca0.009TiO3-δ sample is shown in Fig. S8. In both cases the phase transition gives rise to an anomaly near the Curie temperature.
V Quantum oscillations
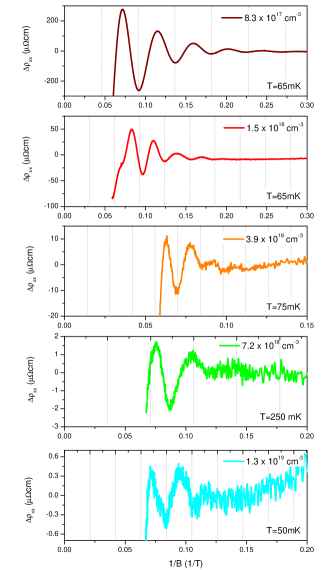
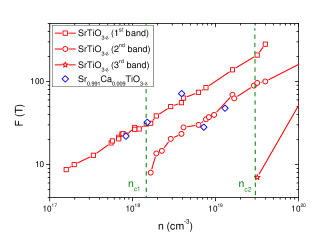
Quantum oscillations in SrTiO3-δ have been systematically studied for a large range of carrier densities ( cm-3) using electric and thermoelectric measurements Lin:2013 ; Lin:2014 . Fig. S9 plots the oscillating part of the magnetoresistance, obtained after subtracting a smooth background, as a function of inverse magnetic field for metallic Sr1-xCaxTiO3-δ () samples. The detected oscillation periods are plotted as a function of carrier density in Fig. S10 and compared with data obtained on SrTiO3-δ Lin:2014 . Lin et al. identified two critical doping levels and cm-3 that correspond to the threshold for the filling of a second and third band and which are associated with the appearance of a second or third oscillation period, respectively. As seen in Fig. S10, the detected periods obtained on Sr1-xCaxTiO3-δ agree well with those obtained on Ca-free STO. However, due to the times lower mobility in the Ca-doped samples compared to pure STO, only the lowest oscillation period could be resolved with certainty for .
Even for low carrier concentrations below the Fermi surface of n-doped SrTiO3-δ is not a perfect sphere but an ellipsoid squeezed along the c-axis due to the tetragonal distortion of the lattice. As done in Lin:2014 we estimated the carrier concentration from the oscillations using the magnitude of the tetragonal distortion reported by Allen et al. Allen:2013 . The values of given in the main text were calculated as with and with the oscillation period .
References
- (1) X. Lin, Z. Zhu, B. Fauqué and K. Behnia. Fermi Surface of the Most Dilute Superconductor. Phys. Rev. X 3, 021002 (2013).
- (2) X. Lin, G. Bridoux, A. Gourgout, G. Seyfarth, S. Krämer, M. Nardone, B. Fauqué and K. Behnia. Critical Doping for the Onset of a Two-Band Superconducting Ground State in SrTiO3−δ. Phys. Rev. Lett. 112, 207002 (2014).
- (3) D. Niermann, C. P. Grams, M. Schalenbach, P. Becker, L. Bohatý, J. Stein, M. Braden, and J. Hemberger. Domain dynamics in the multiferroic phase of MnWO4 Phys. Rev. B 89, 134412 (2014).
- (4) B. S. de Lima et al. Interplay between antiferrodistortive, ferroelectric, and superconducting instabilities in Sr1-xCaxTiO3-δ. Phys. Rev. B 91, 045108 (2015)
- (5) E. V. Balashova , V. V. Lemanov , R. Kunze , G. Martin, and M. Weihnacht. Ultrasonic study on the tetragonal and muller phase in SrTiO3. Ferroelectrics 183, 75 (1996).
- (6) J.G. Bednorz and K.A. Müller. Sr1-xCaxTiO3: An XY Quantum Ferroelectric with Transition to Randomness. Phys. Rev. Lett. 52, 2289 (1984).
- (7) Y.J. Guo, Y.Y. Guo, L. Lin, Y.J. Gao, B.B. Jin, L. Kang, and J.-M. Liu. Mean-field theory of ferroelectricity in Sr1-xCaxTiO3 (). Phys. Rev. B 86, 014202 (2012).
- (8) E.K.H. Salje, O. Aktas, and M.A. Carpenter, V.V. Laguta, and J.F. Scott. Domains within Domains and Walls within Walls: Evidence for Polar Domains in Cryogenic SrTiO3. Phys. Rev. Lett. 111, 247603 (2013).
- (9) S.J. Allen, B. Jalan, S. Lee, D.G. Ouellette, G. Khalsa, J. Jaroszynski, S. Stemmer and A.H. MacDonald. Conduction-band edge and Shubnikov-de Haas effect in low-electron density SrTiO3. Phys. Rev. B. 88, 045114 (2013).