The buckling instability of aggregating red blood cells
Abstract
Plasma proteins such as fibrinogen induce the aggregation of red blood cells (RBC) into rouleaux, which are responsible for the pronounced shear thinning behavior of blood, control the erythrocyte sedimentation rate (ESR) – a common hematological test – and are involved in many situations of physiological relevance such as structuration of blood in the microcirculation or clot formation in pathological situations. Confocal microscopy is used to characterize the shape of RBCs within rouleaux at equilibrium as a function of macromolecular concentration, revealing the diversity of contact zone morphology. Three different configurations that have only been partly predicted before are identified, namely parachute, male-female and sigmoid shapes, and quantitatively recovered by numerical simulations. A detailed experimental and theoretical analysis of clusters of two cells shows that the deformation increases nonlinearly with the interaction energy. Models indicate a forward bifurcation in which the contacting membrane undergoes a buckling instability from a flat to a deformed contact zone at a critical value of the interaction energy. These results are not only relevant for the understanding of the morphology and stability of RBC aggregates, but also for a whole class of interacting soft deformable objects such as vesicles, capsules or cells in tissues.
Introduction
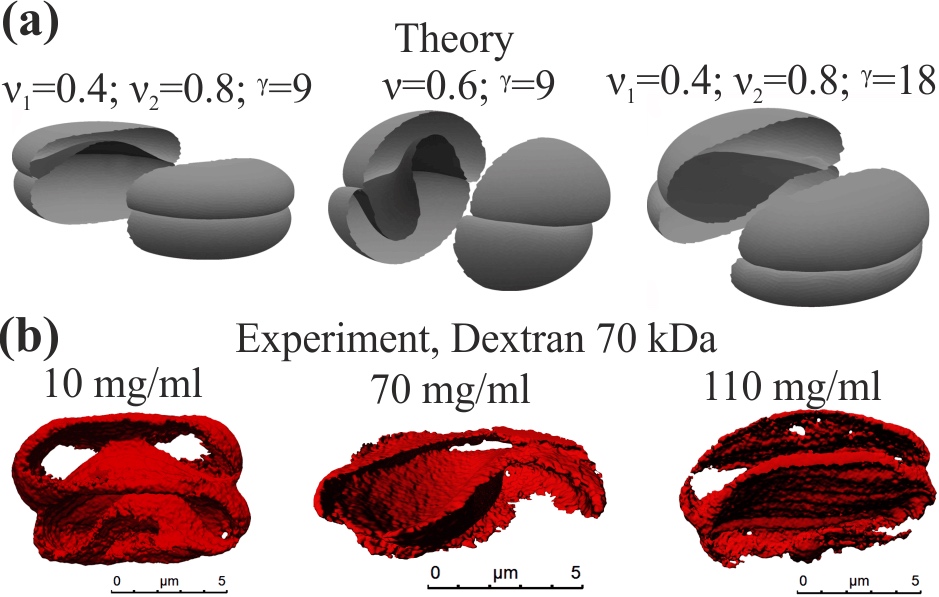
Red blood cells (RBCs) have been a model system and an inspiration for the biophysics of the membrane for decades[1]. Among the numerous works in the literature, many studies have been devoted to adhesion of cells or vesicles and capsules on flat and solid surfaces [2, 3], where, in the case of elastic capsules only, a buckling instability may occur due to the interplay between bending and stretching energy[4]. Buckling has also been observed in freestanding capsules due to osmotic pressure[5, 6] or shear forces by external flow [7], and in vesicles due to asymmetric lipid distributions [8] or shear forces by external flow [9]. The influence of intercellular adhesion [10] is less known despite its relevance in dense environments such as blood at physiological hematocrit or even tissues. Theoretical studies on aggregation between two RBCs based on minimizing the free energy of the membrane[11, 12] indicate a significant change of the geometry of contact zones between cells when varying the interaction energy. Some of these shapes have been observed experimentally [13] but not quantified as a function of the dextran or fibrinogen concentrations. A variety of membrane shapes has been predicted theoretically for RBC doublets[12], depending mainly on the nondimensionalized reduced adhesion strength and the reduced volume where and are the enclosed volume and surface area of the membrane, a parameter that is indeed physiologically related to the hydration state and age of RBCs and can vary over a significant range. Examples include male-female (convex-concave) shapes and more or less pronounced sigmoid shapes obtained by varying and as depicted in Fig. 1(a). The 3D reconstructions of our experimental confocal images show RBC doublets that look very similar to the theoretical predictions, too (Fig.1(b)). Experimental images also show that the amplitude of the deformation of contact zones depends non monotonically on macromolecular (dextran) concentration.
There are direct physiological implications of aggregation since RBCs in blood in stasis are known to form aggregates in the form of so called rouleaux. This clustering process is reversible and typical hydrodynamic shear forces in physiological flow are usually sufficient to break rouleaux, at least in larger vessels. In the 1960’s, fibrinogen could be identified as one of the main plasma proteins causing RBC aggregation or clustering [14, 15, 16]. It is known that the number and size of aggregates increase with fibrinogen concentration in the physiological range (from approximately for healthy adults up to in acute inflammatory phases). The level of RBC aggregation is used in one of the most fundamental standard hematological blood tests, the erythrocyte sedimentation rate (ESR) which is carried out worldwide many thousand times each day. The more and the larger the aggregates, the faster the sedimentation of the RBCs: by simply measuring visually the sedimentation front in a standardized glass capillary one gets a robust and quick, if unspecific, indication on the inflammatory state of the patient. Of course, the tendency of the RBCs to form aggregates may also increase the risk of thrombosis and cardiovascular diseases, especially in combination with stenosis.
The molecular mechanisms of macromolecular induced RBC aggregation have been the subject of controversial studies [17, 18, 19, 20, 21, 22]. Two models have been proposed: One is based on the physical effect of depletion [23, 24, 25, 26, 27] and the other on physisorption or bridging [28, 29, 14, 30, 31]. In addition to the specific adhesion mechanism, the strength of RBC aggregation also depends on their physical properties, such as deformability [32], surface charge [33] and reduced volume [11, 12, 34]. It can also be induced by other macromolecules such as dextran, a widely used molecule in laboratory experiments or as a plasma expander and in veterinary medicine. AFM based single cell force spectroscopy, rheology and sedimentation of RBCs [27, 35, 36] as well as theoretical models [22] depict that an increasing dextran concentration leads first to an increase of the interaction strength among RBCs up to a specified macromolecule concentration. Beyond that maximum the interaction strength decreases again, and cell–cell aggregation vanishes. This leads to a characteristic bell–shaped adhesion-energy versus concentration curve. For the case of fibrinogen, it was found the interaction energy increases with the concentration, but data from the literature are typically limited to lower concentrations than for the case of dextran [27, 35, 36, 37].
We present here a systematic experimental study in order to analyze quantitatively the evolution of the contact zone as a function of aggregating molecule concentration, in a large domain of parameter space by using either dextran or fibrinogen. We analyze the case of RBC doublets as well as that of larger rouleaux. A systematic numerical investigation supports the experimental results. The numerical results show that in the case of two adhering cells, the interface remains flat up to a critical value of interaction energy above which it bifurcates into a deformed, buckled state. Our analytical model reveals a forward bifurcation with critical parameters close to those of the full numerical problem.
Analysis of RBC doublet shapes
Experiment
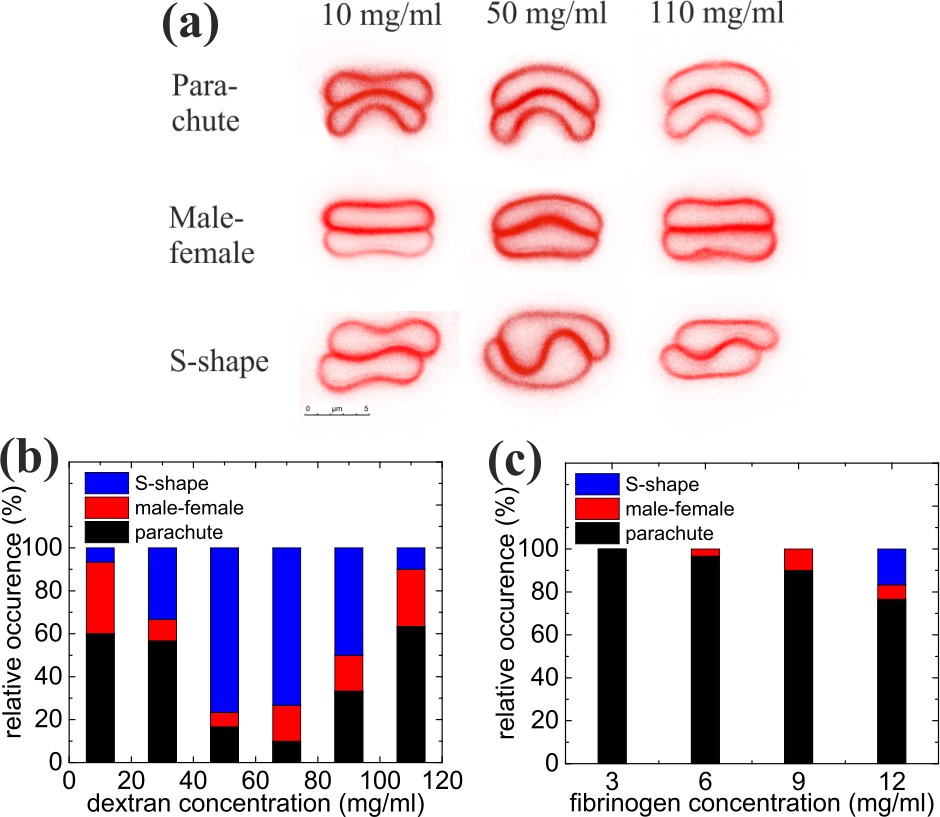
The analysis of the interfacial shape of two cells rouleaux, here called doublets, was performed by confocal imaging of doublets during free sedimentation, i.e. while not in contact with surfaces. Typical images are shown in Fig. 2 for doublets in dextran 70kDa solutions (see S. I. for the fibrinogen case). There is a significant evolution of the interfacial shape with polymer concentration: At low and high concentrations the interface is only weakly deformed while in the intermediate range where interaction energy is higher, the interface is strongly bent. Qualitatively, three different kinds of interfacial shapes were identified: parachute, male-female and sigmoid. In the sigmoid (S-shape interface), cells were mostly laterally displaced, with a non-monotonous curvature of the contact zone, while in other shapes the two cells had a common symmetry axis. The parachute shape was defined by at least one of the cells having a convex and a concave side. The male-female shape was defined when the interface had a bulge, with rather flat non-interacting large membrane parts. Cells with a flat interface were also classified under this category. Similar shapes were found for fibrinogen solutions. As can be seen in Fig. 2(a), all shapes can be found for all polymer concentrations, probably due to dispersity of cell properties in the sample, with a probability that depends on concentration.
A quantitative analysis of the distribution of the different interfacial shapes for the different concentrations of dextran is shown in Fig. 2(b), revealing an increase of the occurrence of sigmoid shapes in the intermediate range of polymer concentrations, i.e. at larger interaction energy favoring slightly larger contact areas. At low and high concentrations of dextran, doublets are mostly in the parachute (about 60 %) and male-female shapes. For fibrinogen (Fig. 2(c)), mostly parachute shapes were observed in the physiological range of the protein’s concentration. The case of echinocyte RBC doublets, obtained after sedimentation and contact with glass, was also studied (see S. I.).
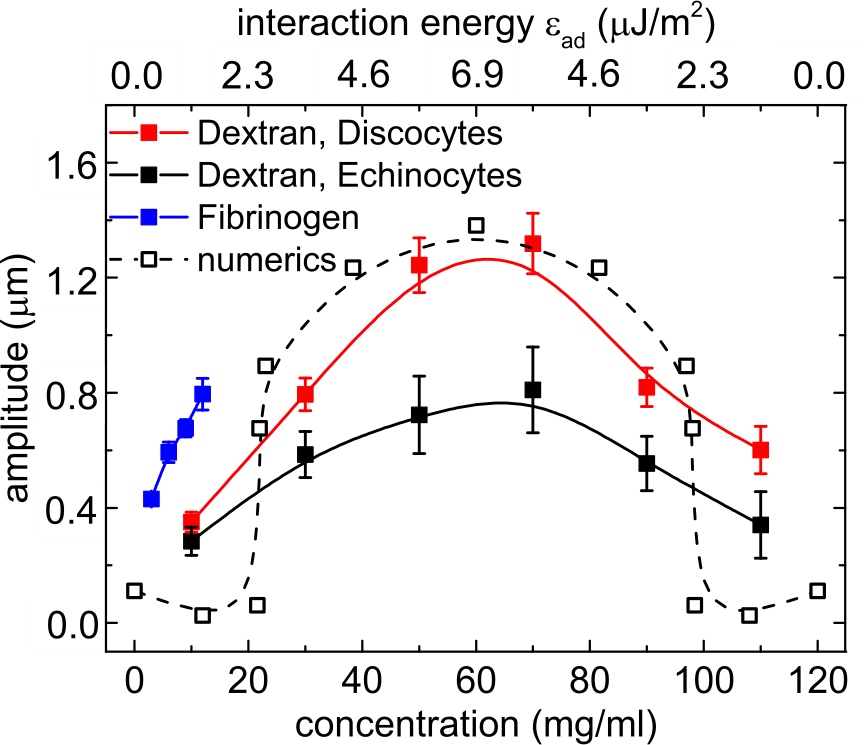
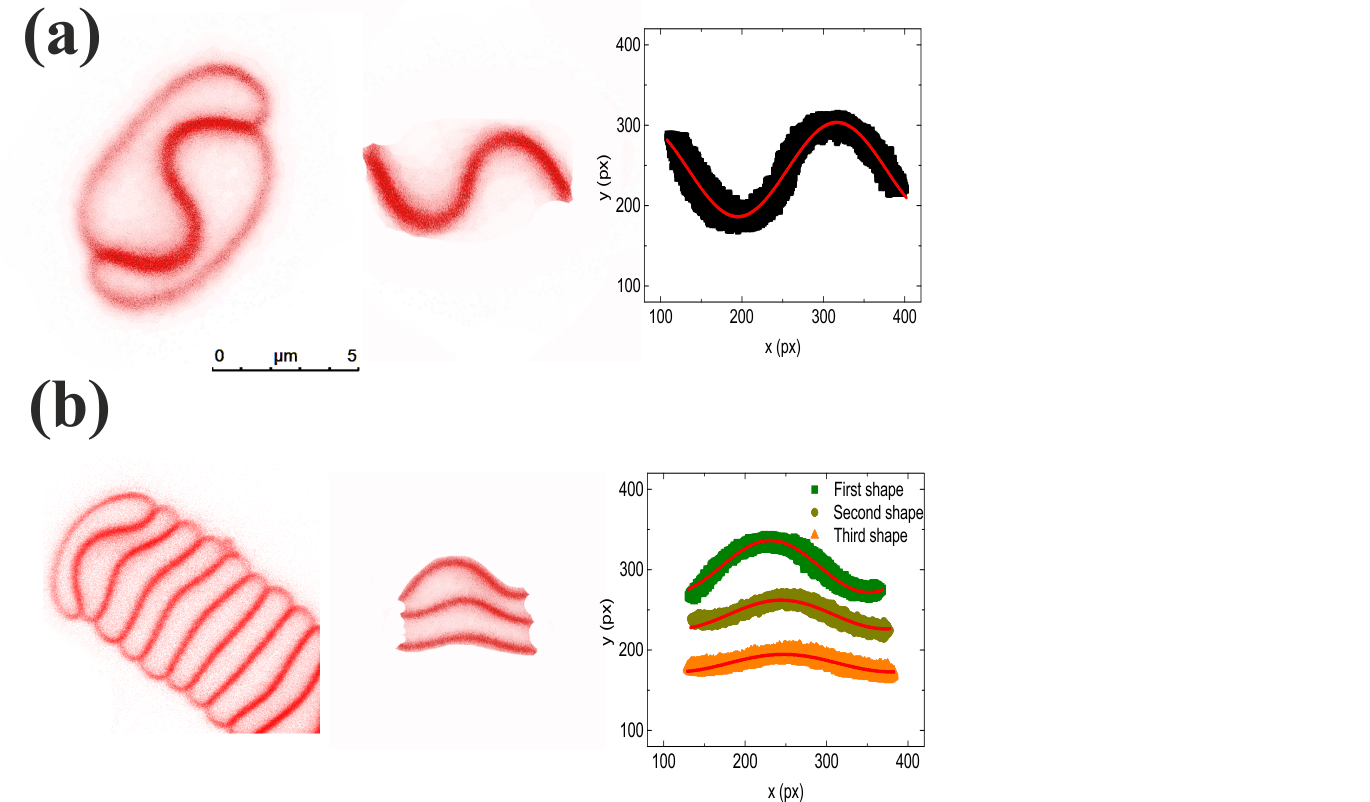
Quantification of the interfacial shape deformation was done by fitting it with a heuristically chosen sinus function (see S.I.), whose amplitude was taken as a measure of the interfacial curvature (Fig. S2). A bell shape dependency of the deformation amplitude on polymer concentration is seen (Fig. 3), similar to the dependency found in AFM single cell force spectroscopy [27] or aggregation index (see S.I.). For the case of dextran, both doublets with discocytic and with echinocytic cells were analysed. The amplitude for discocytic cells can reach much larger values than echinocytes that have a close-to-spherical shape and probably a higher membrane stiffness [34].
Simulation and theory
To compute the interaction energies corresponding to the experimental doublets and gain further insight on the variability of shapes we performed numerical simulations (see S.I. for details of the method). Based on several successful studies (especially equilibrium shapes and shape dynamics under external flow) which have shown that 2D and 3D models capture the same essential features [38, 39, 40], we restrict ourselves here to a 2D model. In 2D the notion of in-plane shear elasticity looses its meaning and the vesicles and inextensible capsule model (often evoked to model RBC) are equivalent.
For reduced areas (where is the area of the 2D vesicle and its perimeter) in the range () with different combinations (cells with same or different reduced areas) and a membrane stiffness of J, we varied the interaction energy in the range 0-8.23 J/m2. The resulting interfacial shapes for different combinations of reduced area , interaction energy and curvature energy (Fig. 4) were in qualitative agreement with the experimentally obtained shapes, namely male-female, S-shapes and parachute shapes.
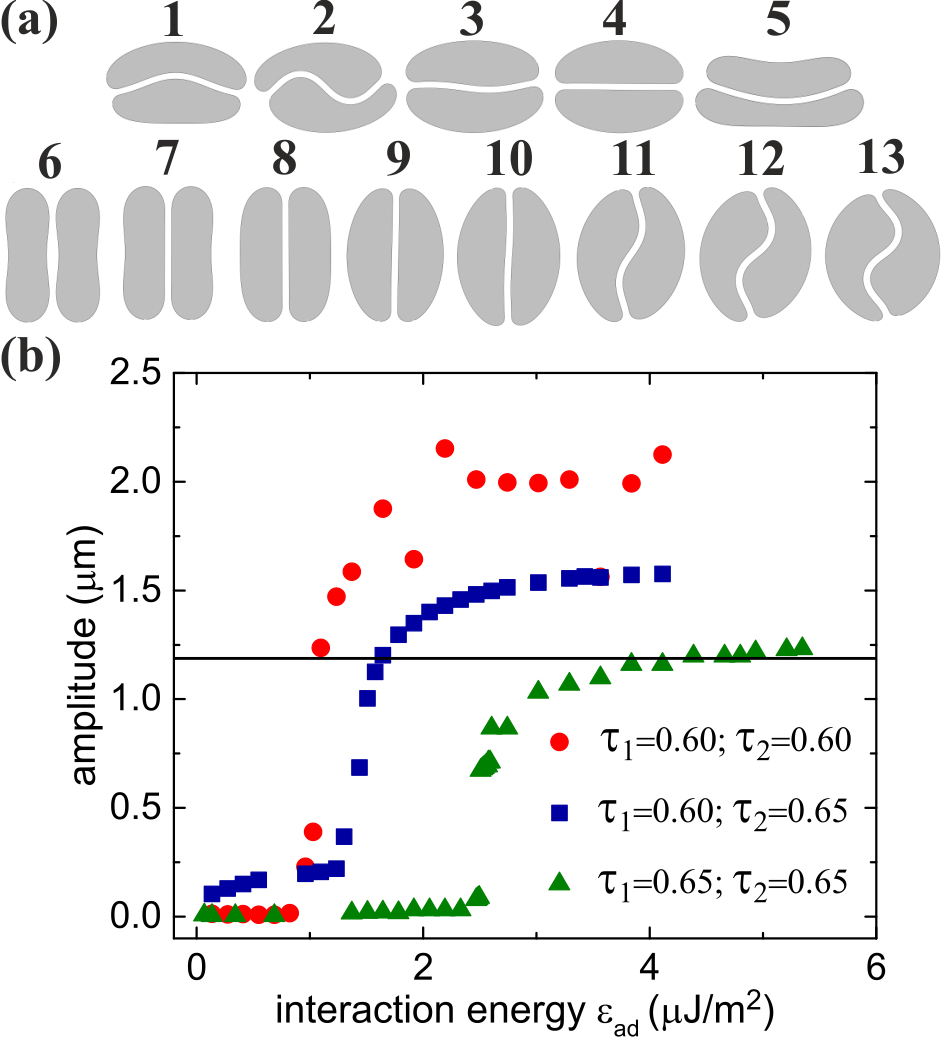
Figure 4(a) shows the evolution of the deformation as a function of the interaction energy. As for the analysis of experimental data we fit the interfacial shape with a sine function. The mean amplitude of the fitted curve was compared to experimental results (Fig. 3), by heuristically choosing a correspondence between concentration and interaction energy: We assume a linear increase of the interaction energy with concentration up to 6.9 J/m2 at 60 mg/ml, followed by a symmetric linear decrease, in order to get a good compromise between an agreement on the width and the maximum value of bell shaped curves. This piecewise linear variation of the interaction energy is a simplification which nevertheless yields a qualitative agreement for the overall behavior. Interestingly, the numerical results also show that the transition from a flat to a deformed interface only occurs at some finite interaction energy (Fig. 4(b)). In principle, this method could allow the determination of the experimental interaction energy for a given concentration. However, the numerical results depend quite sensitively on the reduced areas of the two cells (Fig. 4(b)), a parameter that varies slightly between cells in experiments, even in the same sample. This dispersity is probably also the reason why the bell shape in Fig. 3(a) of the experimental data does not show this sharp transition.
The evolution of the amplitude of contact zone’s deformation in Fig. 4(b) suggests that a bifurcation akin to buckling occurs at a critical value of the interaction energy, triggering a change of shape from flat to S-shape. To get some insight into the involved mechanism, this behavior can actually be recovered by an analytical model through a minimization of the energy of the system. Let us suppose that the shape of an RBC in a symmetric doublet (in 2D) is approximated as shown in Fig. 12(a), with two semi-circular caps of radius , a roughly straight portion where curvature is negligible (length ) and a contact zone with a sinusoidal shape of curvilinear length and amplitude described by the equation:
| (1) |
for . The corresponding interaction energy (per unit length in the third dimension) is, at order 4 in :
| (2) |
where is the interaction energy per unit area.
The curvature energy of the system is concentrated in the circular caps and the deformed contact zone given by:
| (3) | |||||
| (4) |
The total energy therefore depends on , and which are related through the constant area and constant perimeter constraints.
In the following we define a dimensionless energy , a rescaled interaction energy , and rescale all lengths by : and so on, and introduce the reduced area . The total energy can then be derived and expanded at order 4 in (see supplemental material). Figure 12(b) shows the energy due to deformation for and different interaction energies . Below a critical value , the minimum of energy corresponds to (flat interface), while for , the energy is minimal for a finite value of (see S. I.).
This defines the bifurcation threshold corresponding to , which is an increasing function of (Fig. 12(c)):
| (5) |
The bifurcation diagram of the deformation amplitude (Fig. 12(d)) reveals a classical supercritical bifurcation, owing to the competition between interaction energy and curvature energy through the constant perimeter and area constraints. Orders of magnitude of the bifurcation threshold and amplitude of the deformation are in good agreement with experiments and numerical simulations. We have . If we take m and J as in simulations, the critical interaction energy is J/m2 for and J/m2 for , which is in reasonable agreement with the simulations of Fig. 4(b), while the amplitude of the deformation saturates at m in this model, rather close to the value m found in the simulations given the simplicity of the model.
Interestingly, the energy of the equilibrium configuration decreases linearly with as shown in Fig. 12(d), with no sign of the shape bifurcation due to the smallness of the non linear terms arising from the deformation in the curvature and interaction energy terms. This result can be of interest in the modeling of clustering dynamics in flow for instance, where the dissociation rate due to hydrodynamic stresses can be assumed to simply scale like despite the possibly complex shapes of contact zones.
Analysis of membrane shapes in larger RBC clusters
A characterization of larger clusters was performed with rouleaux of at least 7 cells. The fast sedimentation and arbitrary orientation of the rouleaux only allowed us to image them when settled on the (BSA treated) cover slip. Since fibrinogen led to significant inter-connections between rouleaux which eventually led to a percolated gel like structure at 45% hematocrit, we only focused on rouleaux in linear configuration in dextran solutions (Fig. 6a). At 10mg/ml the cells in a rouleau were typically laterally shifted and we did not observe large clusters. At higher concentrations of dextran larger rouleaux were observed and as shown in Fig. 6, only the first three interfaces exhibited significant deformation (Fig. 6a) while the interfaces far from the tip were always in a male-female shape with very low deformation, mostly below the experimental resolution limit. Again, a large variety of shapes was observed for these first three interfaces (Fig. 6b).
As for doublets, these interfaces can be sorted into different categories and the distribution of shapes is shown separately for the first, second and third interface starting from the doublet tip in Fig. 7a. Unlike the case of doublets, we observed mostly male-female shapes and no parachute shapes at all, likely due to the constraints induced by the next attaching cell. For concentrations in the lower to medium-range, S-shape contact zones exist more frequently for the first contact zone than for the next ones, while male-female shapes are indeed prevalent everywhere except at very low dextran concentrations where RBCs tend to stay very close to their free discoid shape due to the low interaction energy, in agreement with the theoretical results on low-aggregation behavior mentioned in [11].
The amplitudes of the interfacial deformations (determined by the same method as for doublets) are shown in Fig. 7a. Again, a bell shape behavior for all three interfaces was observed. Interestingly, the amplitude of the first contact zone was very similar to the values measured for echinocyte doublets (see S.I.), too. Indeed, the aggregation into larger clusters gives less degree of freedom to RBCs due to higher constraints on the membrane, leading to a higher effective stiffness of RBCs.
Numerical simulations were performed for 7 cells and different interaction energies , a constant reduced area and membrane stiffness J (Fig. 8). The results agree qualitatively with the experimental results and the amplitudes of the interfacial deformations of the first and second interface were in good agreement with the experimental data using the same energy scale as for doublets (see Fig. 7). However, the amplitudes between experiment and theory differed significantly for the third shape. Here the variability of the experimentally observed shapes plays a role, as well as the blurring of the contact zone due to resolution in experiments, which tends to increase the amplitude of the fitted sine function.
Discussion
Red blood cells aggregate due to the presence of plasma proteins or biomimicking polymers. This is an example of adhesion between two very soft interfaces, different from the case of adhesion on a solid substrate, where we observe a buckling of the cell–cell interface. The nature of this instability is revealed by our numerical simulations and explained by an analytical model. The critical threshold of buckling and the final geometry of the aggregate depends strongly on the physical parameters, i.e. on the reduced volume of the cells. For large reduced volumes that correspond to more spherical cells, the critical interaction energy for buckling increases. In the case of doublets of two cells having identical reduced volumes close to that of a typical RBC, a sigmoid deformation of the interface takes place, while for two different reduced volumes male-female shapes can be obtained due to the asymmetry of properties that forces a different mode. We also characterized long linear clusters experimentally and numerically and have found that only the three interfaces at the two ends are considerably deformed. It would undoubtedly be interesting to check how these contact shapes obtained in quasi-static conditions evolve in pathological conditions, or under flow with the additional constraint of hydrodynamic stresses.
Methods
Human blood withdrawal from healthy donors as well as blood preparation and manipulation were performed according to regulations and protocols that were approved by the ethic commission of the Ärztekammer des Saarlandes (reference No 24/12). We obtained informed consent from the donors after the nature and possible consequences of the studies were explained.
RBC preparation
Venous blood of three healthy donors (one female, 26 years, blood group 0 negative; one male, 43 years, blood group 0 negative; one male, 27 years, blood group B positive) was drawn into conventional EDTA tubes (S-Monovette; Sarstedt, Nümbrecht, Germany) and all measurements were performed within 4 hours after the blood had been drawn. After washing the RBCs three times (704 g, 3 min) with phosphate-buffered solution (PBS, Life Technologies, Waltham, MA, USA) 0.1 l CellMask (Life Technologies, Waltham, MA, USA) was added for fluorescence labeling to 200 l RBCs in 1ml PBS for 10min. After washing two times (704 g, 3min) the supernatant was removed and the RBCs were resuspended in solutions of dextran (Dextran 70 from Leuconostoc mesenteroides, Sigma-Aldrich, St Louis, USA) or (washed) fibrinogen (fibrinogen from human plasma, Sigma-Aldrich, St Louis, USA) in PBS. The fibrinogen as delivered contains approximately 60% Fibrinogen, 25% sodium chloride and 15% of sodium citrate. In order to remove the salt the solutions were ultrafiltrated with a 10kDa filter (Vivaspin Turbo 4, Satorius AG, Goettingen, Germany) at 3500g in a centrifuge (Hermle Z326K, Hermle Labortechnik GmbH, Wehingen, Germany) for 10 hours by adding 2ml of PBS every hour. The remaining protein solution was freeze-dried and the proteins were resuspended in PBS. Fibrinogen was used in the measurements within 24 hours after freeze-drying and the osmolality of this solutions was verified to be in the order of PBS (+/- 5%).
Well preparation
Cylindrical wells of diameter 5 mm, height 1.6 mm (-Slide 18 Well-Flat from Ibidi, Munich, Germany) were used as sample chambers. RBCs sitting on the bottom slide of the well changed to echinocytes due to the glass effect. For the measurements in which we wanted to preserve the discoyte shape of sedimented cells, the wells were covered with 1 mg/ml bovine serum albumine (BSA, Sigma-Aldrich, St Louis, USA) in PBS for 30 min at 37∘C. The BSA-PBS solution was removed and after a drying time of 10 min at 37∘C the RBC suspensions were added.
Imaging of the interfacial shape
All observations were performed with the confocal microscope described in the previous section at a temperature of 23 ∘C with an hematocrit of 0.2 % for the imaging of RBC doublets and 0.4 % for clusters larger than 6 RBCs. Images of doublets of RBC in their normal discoid shape could be recorded in free volume during the slow sedimentation process which prevented any contact with the glass surface of the cover slip. This procedure did allow to study the aggregates without any other influence but we should also note that it was also not possible to investigate the interfacial shape of sedimented cells in discocytic state. In this configuration, they were horizontally oriented with their interface and the RBC membrane was very thin. The optical 2-D sections showed a good signal only when the membrane was oriented along the axis of the point spread function of the laser focus. However, images of sedimented RBCs were also taken on the non-treated cover slips, i.e. for the case of echinocytes which were often oriented with their interface perpendicular to the cover slip, most likely due to their rounder shape. In total, 30 cells for discocytes and 15 for echinocytes were evaluated. For clusters that were larger than 6 cells, measurements could be only be performed on sedimented cells. In this case the cover slip was always treated with BSA to preserve the discocytic shape, and contact zones were always oriented perpendicular to the cover slip, thereby allowing a good characterization. The raw images were contrast enhanced and the position of the interfacial membrane contours was manually determined by visual inspection. The point cloud that indicated the interface was extracted with Matlab (The MathWorks GmbH, Ismaning, Germany) and stored into a one dimensional array to allow for a fitting procedure with Origin (OriginLab Corporation, Northampton, MA, USA). The interface was fitted with a heuristically chosen sinus function which yielded reasonable agreement. For sigmoid shapes the wave length of the sinus was left as a free parameter and for the male-female and parachute shape the wave length was limited to a range of around the double of the cell diameter.
3-D imaging
This accounts only for the images shown in Fig.1. In the preparation step for the wells CellTak (CellTak, BC Bioscience, San Jose, USA) was added as specified by the manufacturer in order to immobilize the cells on the BSA treated cover slip. A stack of 50 images was taken at a distance of 0.1 m in z-direction, while the x-y area was 12 x 12 m. A surface rendering with Imaris (Bitplane AG, Zuerich, Switzerland) allowed to look through the cell membranes attached to the bottom onto the contact zones.
References
- [1] N. Mohandas and P. G. Gallagher. Red cell membrane: past, present, and future. Blood, 112(10):3939–3948, 2008.
- [2] U. Seifert and R. Lipowsky. Adhesion of vesicles. Phys. Rev. A, 42:4768–4771, Oct 1990.
- [3] U. S. Schwarz and S. A. Safran. Physics of adherent cells. Rev. Mod. Phys., 85:1327–1381, Aug 2013.
- [4] S. Komura, K. Tamura, and T. Kato. Buckling of spherical shells adhering onto a rigid substrate. Eur. Phys. J. E, 18:343, 2005.
- [5] S. Knoche and J. Kierfeld. Osmotic buckling of spherical capsules. Soft Matter, 10:8358–8369, 2014.
- [6] S. S. Datta, S.-H. Kim, J. Paulose, A. Abbaspourrad, D. R. Nelson, and D. A. Weitz. Delayed buckling and guided folding of inhomogeneous capsules. Phys. Rev. Lett., 109:134302, 2012.
- [7] D. Barthès-Biesel. Motion and deformation of elastic capsules and vesicles in flow. Annu. Rev. Fluid Mech., 48:25–52, 2016.
- [8] H.-J. Woo, , and A. Wallqvist. Spontaneous buckling of lipid bilayer and vesicle budding induced by antimicrobial peptide magainin 2: A coarse-grained simulation study. J. Phys. Chem. B, 115:8122–8129, 2011.
- [9] V. Narsimhan, A. P. Spann, and E. S. G. Shaqfeh. Pearling, wrinkling, and buckling of vesicles in elongational flows. J. Fluid Mech., 777:1–26, 2015.
- [10] Ionic strength dependence of localized contact formation between membranes: Nonlinear theory and experiment. Biophys. J., 77(2):817 – 828, 1999.
- [11] P. Ziherl and S. Svetina. Flat and sigmoidally curved contact zones in vesicle–vesicle adhesion. Proc. Natl. Acad. Sci. USA, 104(3):761–765, 2007.
- [12] S. Svetina and P. Ziherl. Morphology of small aggregates of red blood cells. Bioelectrochemistry, 73:84–91, 2008.
- [13] D. Tilley, W. T. Coakley, R. K. Gould, S. E. Payne, and L. A. Hewison. Real time observations of polylysine, dextran and polyethylene glycol induced mutual adhesion of erythrocytes held in suspension in an ultrasonic standing wave field. Eur. Biophys. J., 14(8):499–507, 1987.
- [14] E. W. Merrill, E. R. Gilliland, T. S. Lee, and E. W. Salzman. Blood rheology: effect of fibrinogen deduced by addition. Circ. Res., 18(4):437–446, 1966.
- [15] R. E. Wells, T. H. Gawronski, P. J. Cox, and R. D. Perera. Influence of fibrinogen on flow properties of erythrocyte suspensions. Am. J. Physiol., 207(5):1035–1040, 1964.
- [16] S. Chien, S. Usami, H. M. Taylor, J. L. Lundberg, and M. I. Gregersen. Effects of hematocrit and plasma proteins on human blood rheology at low shear rates. J. Appl. Physiol., 21(1):81–87, 1966.
- [17] Mechanical deformability of biological membranes and the sphering of the erythrocyte. Biophys. J., 13(3):209 – 217, 1973.
- [18] R. Fåhraeus. The influence of the rouleau formation of the erythrocytes on the rheology of the blood. Acta Med. Scand., 161(2):151–165, 1958.
- [19] E. W. Merrill, G. C. Cokelet, A. Britten, and R. E. Wells. Non-newtonian rheology of human blood-effect of fibrinogen deduced by” subtraction”. Circ. Res., 13(1):48–55, 1963.
- [20] A. S. Popel and P. C. Johnson. Microcirculation and hemorheology. Annu. Rev. Fluid Mech., 37:43, 2005.
- [21] J. J. Bishop, A. S. Popel, M. Intaglietta, and P. C. Johnson. Rheological effects of red blood cell aggregation in the venous network: a review of recent studies. Biorheology, 38(2-3):263–74, 2001.
- [22] Z. Marton, G. Kesmarky, J. Vekasi, A. Cser, R. Russai, B. Horvath, and K. Toth. Red blood cell aggregation measurements in whole blood and in fibrinogen solutions by different methods. Clin. Hemorheol. Microcirc., 24(2):75–83, 2001.
- [23] B. Neu and H. J. Meiselman. Depletion-mediated red blood cell aggregation in polymer solutions. Biophys. J., 83(5):2482–2490, 2002.
- [24] S. Asakura and F. Oosawa. On interaction between two bodies immersed in a solution of macromolecules. Chem. Phys., (22):1255–1256, 1954.
- [25] H. Baumler and E. Donath. Does dextran indeed significantly increase the surface-potential of human red-blood-cells. Studia Biophysica, 120(2):113–122, 1987.
- [26] E. Evans and D. Needham. Attraction between lipid bilayer membranes in concentrated solutions of nonadsorbing polymers: comparison of mean-field theory with measurements of adhesion energy. Macromolecules, 21(6):1822–1831, 1988.
- [27] P. Steffen, C. Verdier, and C. Wagner. Quantification of depletion-induced adhesion of red blood cells. Phys. Rev. Lett., 110(1):018102, 2013.
- [28] H. Bäumler, B. Neu, E. Donath, and H. Kiesewetter. Basic phenomena of red blood cell rouleaux formation. Biorheology, 36(5-6):439–442, 1998.
- [29] N. Maeda, M. Seike, S. Kume, T. Takaku, and T. Shiga. Fibrinogen-induced erythrocyte aggregation: erythrocyte-binding site in the fibrinogen molecule. Biochim. Biophys. Acta, 904(1):81–91, 1987.
- [30] D. E. Brooks. The effect of neutral polymers on the electrokinetic potential of cells and other charged particles: Ii. a model for the effect of adsorbed polymer on the diffuse double layer. J. Colloid Interface Sci., 43(3):687–699, 1973.
- [31] S. Chien and K. M. Jan. Red cell aggregation by macromolecules: roles of surface adsorption and electrostatic repulsion. J. Supramol. Struct., 1(4-5):385–409, 1973.
- [32] S. Chien. Shear dependence of effective cell volume as a determinant of blood viscosity. Science, 168(3934):977–979, 1970.
- [33] K.-M. Jan and S. Chien. Role of surface electric charge in red blood cell interactions. J. Gen. Physiol., 61(5):638–654, 1973.
- [34] S. Svetina, D. Kuzman, R. E. Waugh, P. Ziherl, and B. Zeks. The cooperative role of membrane skeleton and bilayer in the mechanical behaviour of red blood cells. Bioelectrochemistry, 62:107–113, 2004.
- [35] M. Brust, O. Aouane, M. Thiébaud, D. Flormann, C. Verdier, L. Kaestner, M. W. Laschke, H. Selmi, A. Benyoussef, T. Podgorski, G. Coupier, C. Misbah, and C. Wagner. The plasma protein fibrinogen stabilizes clusters of red blood cells in microcapillary flows. Sci. Rep., 4:4348, 2014.
- [36] D. Flormann, E. Kuder, P. Lipp, C. Wagner, and L. Kaestner. Is there a role of c-reactive protein in red blood cell aggregation? Int. J. Lab. Hematol., 37(4):474–482, 2015.
- [37] O. Baskurt, M. Hardeman, M. Rampling, and H. Meiselman. Handbook of Hemorheology and Hemodynamics. IOS Press, 2007.
- [38] Badr Kaoui, George Biros, and Chaouqi Misbah. Why do red blood cells have asymmetric shapes even in a symmetric flow? Phys. Rev. Lett., 103(18):188101, 2009.
- [39] Dmitry A. Fedosov, Matti Peltomaki, and Gerhard Gompper. Deformation and dynamics of red blood cells in flow through cylindrical microchannels. Soft Matter, 10:4258–4267, 2014.
- [40] O. Aouane, M. Thiébaud, A. Benyoussef, C. Wagner, and C. Misbah. Vesicle dynamics in a confined poiseuille flow: From steady state to chaos. Phys. Rev. E, 90:033011, Sep 2014.
- [41] P.B. Canham. The minimum energy of bending as a possible explanation of the biconcave shape of the human red blood cell. J. Theor. Biol., 26(1):61–81, 1970.
- [42] W. Helfrich. Elastic properties of lipid bilayers: theory and possible experiments. Z. Naturforsch. C, 28(11-12):693–703, 1973.
- [43] G. Ghigliotti, T. Biben, and C. Misbah. Rheology of a dilute two-dimensional suspension of vesicles. J. Fluid Mech., 653:489–518, Jun 2009.
- [44] B. Neu and H.J. Meiselman. Depletion-mediated red blood cell aggregation in polymer solutions. Biophys. J., 83(5):2482–2490, 2002.
- [45] Yaling Liu and Wing Kam Liu. Rheology of red blood cell aggregation by computer simulation. J. of Comput. Phys., 220(1):139–154, 2006.
- [46] M. Thiébaud and C. Misbah. Rheology of a vesicle suspension with finite concentration: A numerical study. Phys. Rev. E, 88:062707, Dec 2013.
Acknowledgements
The research leading to this results has received fundings from the German Research Foundation (DFG, SFB 1027), the Centre National de la Recherche Scientifique (CNRS) and the German French University (DFH/UFA). T. P. and C. M. acknowledge support from CNES and LabEx Tec21.
Author contributions statement
D. F. performed experiments and data analysis, O. A. ran numerical simulations, L. K. supervised the experiments, C.R. programmed the analysis software, S.S. compared 3D analysis, C. M. supervised numerical simulations, T. P. designed the research, made the analytical model, supervised data analysis, C. W. designed the research, supervised experiments and numerical simulations.
Supplementary Information
Microscopic aggregation index
A simple way to quantitatively characterize the clustering of the RBCs is based on the quantification of sedimented aggregates within a certain area on a microscope slide. Chien and Jan [33] defined a microscopic aggregation index (MAI) as the ratio of the total number of cells to the total number of ”particles” (individual cells and aggregates), representing the average number of cells per particle. Here, we investigate RBC aggregation by confocal microscopy and define the MAI as the the ratio of the number of aggregated cells at the bottom of the well after sedimentation to the total number of cells, i.e. the fraction of aggregated cells.
All observations were performed at a temperature of 23 ∘C with a hematocrit of 10 %. This concentration ensured an almost fully covered bottom surface after 5 min of sedimentation for most sample solutions, with an average coverage of cells/mm2. Imaging was performed using a confocal microscope (TSC SP5 II; Leica Microsystems, Mannheim, Germany) with a laser of 633nm as the excitation wavelength. RBCs were classified as part of a cluster if the membranes of two cells were optically indistinguishable over a distance of at least 4 pixels, which corresponds to 1 m in our image with a size of 144 x 144 m2. White-light microscopy was used as a control to exclude any possible influence of CellMask on aggregation (data not shown). Fibrinogen and dextran solutions were compared to PBS as negative control. Due to the increase of viscosity with increase in dextran or fibrinogen concentration, the sedimentation slows down, which leads to a lower total number of cells per image at higher viscosities in comparison to RBCs in PBS.
Figure 9(a) shows representative images for various concentrations of dextran and fibrinogen.
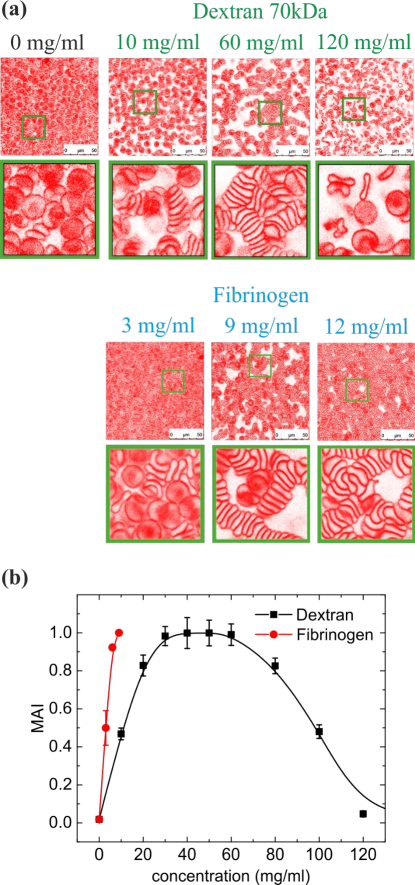
In dextran solutions, the number of rouleaux and the MAI exhibit a bell shaped curve with a maximum around a concentration of 50 mg/ml and almost no rouleaux at 120 mg/ml. (Fig. 9(b)). For fibrinogen, a monotonous increase of the MAI is seen up to a concentration of 12mg/ml, which corresponds to the physiological range. Both results are reminiscent of the dependencies of interaction energy, in-flow clustering and rheology on dextran concentration obtained in previous studies [27, 35]. Another qualitative observation is that the dextran and fibrinogen induced rouleaux look slightly different with more interconnections in the fibrinogen case.
Contact zone contour extraction
All measurements of contact zone shapes of RBC clusters were performed at 0.2% v/v hematrocrit. The procedure for extracting interfacial shapes for further analysis is exemplified in Fig. 10. The contact zones of RBC clusters are first isolated. The images are then thresholded and skeletonized to extract the interface shape on which a sine function can be fitted to measure the amplitude of deformation.
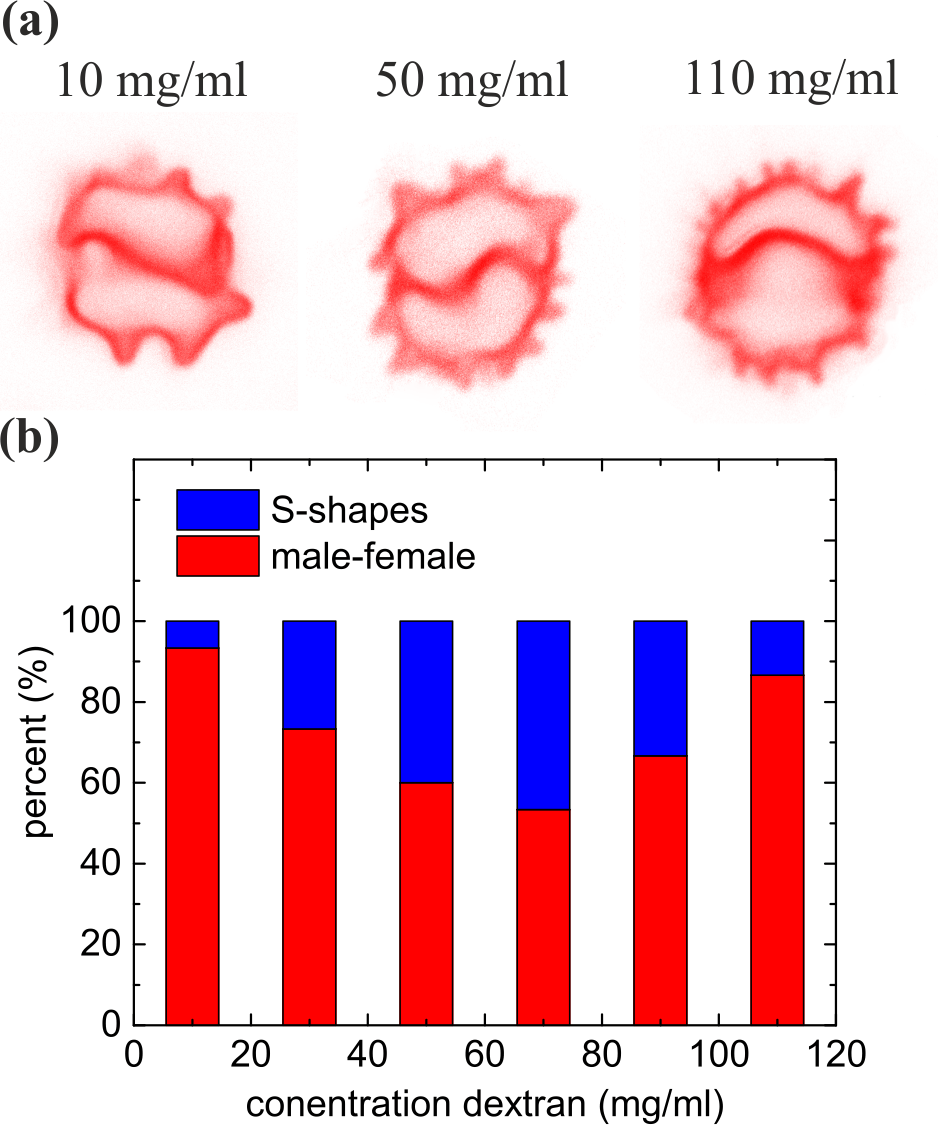
Echinocyte clusters
When the doublets were allowed to sediment on the BSA treated cover slip, the cells remained in discocyte state for several minutes but they were mostly oriented with their interface parallel to the coverslip which did prevent a characterization of the thin interfacial membrane that was then oriented perpendicular to the z-axis of the point spread function. This was different for the non-treated cover slips: due to the so called ”glass effect”, the RBCs transformed into the echinocyte state and we observed only male-female and sigmoid shapes (Fig. 11(a)). A quantitative analysis of the distribution of the different interfacial shapes for the different concentrations of dextran is shown in Fig. 11(b). For all different cases we observed an increase in the number of sigmoid interfaces in the intermediate range of polymer concentrations, i.e. at larger interaction strengths. The sigmoid shape allows for the largest contact zone, favorized by large interaction strength. At low and high concentrations of dextran we observe only few sigmoid shapes and more parachute than male-female shapes for the cells in discocytic state. With fibrinogen, mostly parachute shapes were observed. This is most likely related to the low (but physiological) concentrations of the protein. For cells in echinocyte state no parachute shape was observes which is to be expected in view of the spherical shape of a single echinocyte.
Modelling and numerical methods
Based on several successful studies (especially equilibrium shapes and shape dynamics under external flow) that have shown that 2D and 3D models capture the same essential features [38, 39, 40], have restricted ourselves here to a 2D model. In 2D the notion of in-plane shear elasticity looses its meaning and the vesicles and inextensible capsule model (often evoked to model RBC) are equivalent. Vesicles consist of closed bilayer membranes enclosing an inner fluid and suspended in an outer fluid. Using the typical reduced area (equivalent of the surface-to-volume ratio in three dimensions) of the RBC, the minimum energy shape of an unstressed vesicle is the same as for an RBC despite the lack of a cytoskeleton. Indeed, the stress free shape is dictated by the curvature energy and the rigidity of the cell. To describe the mechanical behavior of the vesicle, we employ (for each cell) the two dimensional Helfrich free energy[41, 42] (per unit length in the 3rd dimension):
| (6) |
where is the mean curvature, is the arclength element along the membrane contour, is the membrane bending rigidity modulus, and is the spontaneous curvature that can be neglected in case of symmetrical membranes; actually in 2D the spontaneous curvature plays no role. In order to fulfill the condition of membrane inextensibility we supplemented the curvature energy with a term , where is a Lagrange multiplier that depends on the position along the membrane . The fluid inside and outside the membrane is described by the Stokes equations (the inertial effect is small and is neglected) with boundary conditions at the membrane and far away from the membrane. Far away from the membrane the flow vanishes (in the absence of any imposed external flow). At the membrane we require velocity continuity, and force balance. In addition, the velocity field along the membrane has to be divergence-free in order to enforce membrane incompressibility. This condition represents an implicit equation that allows one to determine the still unknown Lagrange multiplier ; the details of how this is achieved in practice can be found in [43]. The hydrodynamics stress jump across is counterbalanced by the membrane force. This force is composed of the bending force obtained as a functional derivative of the Helfrich free energy supplied with a tension-like force to fulfill the condition of inextensibility of the membrane.
| (7) |
where and are the normal and tangent unit vectors. designates the vector position of a given point on a given cell; the curvature as well as the Lagrange multiplier are defined for each cell. In addition to this force we had to consider the force due to cell-cell interaction (due to the presence of proteins or dextran). For this purpose we refer to the work of Neu and Meiselman [44]. Neu and Meiselman have presented a model that takes into account the strong electrostatic repulsion due to the negative charge of RBC membranes, and the weak osmotic forces of attraction due to the depletion effect induced by macromolecules surrounding RBCs [44]. This model contains several parameters depending on the physiochemical properties and the concentration of the polymers. Often, the interaction energy between cells is described by a Morse potential (or alternatively a Mie type potential), having an exponential form, which has proven to adequately describe experimental data [45]. As is the case in many physical problems, a Morse potential can be well approximated by a Lennard-Jones potential, and we adopted this form in the present study for practical reasons. The interaction potential per unit (length of the 1st membrane length of the 2nd membrane length in the 3rd (invariant) dimension) is
| (8) |
where is a microscopic parameter with dimension [energy/length3].
This potential is minimum at distance and the minimal interaction potential is equal to .
The cell-cell force is given by
| (9) |
, , and and are two position vectors belonging to the and membrane () respectively.
In this formulation, is a microscopic parameter of interaction between surface elements. Given the range of the interaction potential (typically a few times ), an integration of the potential over planar parallel surfaces of extension much larger than this range must be performed in order to derive the macroscopic interaction energy per unit area .
The force per unit surface between two infinite parallel membranes at distance is:
| (10) |
The zero force position is therefore , which is smaller than . The interaction energy per unit surface between infinite plates (i.e. whose extension is much larger than ) is then:
| (11) |
This gives the relation between the microscopic parameters of the potential and and the macroscopic interaction energy per unit area .
Recently the RBC-RBC adhesion energy has been quantified using the atomic force microscopy-based single cell force spectroscopy [27]. From these data, in principle, we can determine the adhesion energy and equilibrium distance from which the two parameters entering the Lennard-Jones potential can be determined, namely the minimal energy and the range of the potential . However, here we chose to adapt the results from the numerical simulations, namely the amplitude of the interfacial deformation, directly to the experimental data and use this to deduce the interaction energy. In this procedure, due to numerical constraints, the zero force length (i.e. the length corresponding to minimal potential) was fixed in our simulations to 489 nm. This was probably significantly larger than the experimental value but still in the order of the optical resolution limit. In addition, note that as long as is small compared to the lateral extension of the membrane, the product is the most quantity here. The Stokes equations were solved using the boundary integral technique as presented in [46, 40]
| (12) |
where is the velocity of a vector position belonging to the membrane , is the viscosity contrast between the inner and outer fluids with the respective viscosities and , and and are the Green’s functions associated with the velocity and the stress fields respectively.
To match the average values of a human RBC, the reduced area () of the vesicle typically lies in the range (), the typical radius is , the membrane stiffness is . Here we did not investigate any dynamic effects and we therefore fixed the viscosity ratio simply to unity, even if typically a factor of 5 was assumed. We considered doublets and sets of cells, separated by an initial surface-to-surface interdistance of 600 nm.
Analytical model

We provide here the details of the analytical model showing buckling of contact zones in symmetric RBC doublets. We suppose that the shape of an RBC in a symmetric doublet (in 2D) is approximated as shown in Fig. 12, with two semi-circular caps of radius , a roughly straight portion where curvature is negligible (length ) and a contact zone with a sinusoidal shape of curvilinear length and amplitude described by the equation:
| (13) |
for . The corresponding interaction energy of this contact zone is in expansion at order 4 in :
| (14) |
This corresponds to an interaction energy :
| (15) |
where is the interaction energy per unit surface.
The curvature energy of the system is concentrated in the circular caps and the deformed contact zone . The circular cap term is:
| (16) |
The curvature of the contact zone is:
| (17) |
This leads to the energy term:
The total energy therefore depends on , and which are related through the constant area and constant perimeter constraints
| (18) | |||||
| (19) |
In the following we define a dimensionless energy , a rescaled interaction energy , and rescale all lengths by : and so on, and use the definition of the reduced area .
The constant perimeter and area constraints can then be written as the following (dropping the * for simplicity):
| (20) | |||||
| (21) |
| (22) | |||||
| (23) |
The total energy can then be derived and expanded at order 4 in as in equation LABEL:energy, dropping the ∗ for simplicity.
This energy has only a minimum for a finite, critical value of the rescaled interaction energy .
If we solve to find the equilibrium configurations we get the two solutions whose expressions are given by 24, which defines the bifurcation threshold corresponding to (Eq. 25)
| (24) |
| (25) |