Towards Monetary Incentives in Social Q&A Services
Abstract
Community-based question answering (CQA) services are facing key challenges to motivate domain experts to provide timely answers. Recently, CQA services are exploring new incentive models to engage experts and celebrities by allowing them to set a price on their answers. In this paper, we perform a data-driven analysis on two emerging payment-based CQA systems: Fenda (China) and Whale (US). By analyzing a large dataset of 220K questions (worth 1 million USD collectively), we examine how monetary incentives affect different players in the system. We find that, while monetary incentive enables quick answers from experts, it also drives certain users to aggressively game the system for profits. In addition, in this supplier-driven marketplace, users need to proactively adjust their price to make profits. Famous people are unwilling to lower their price, which in turn hurts their income and engagement over time. Finally, we discuss the key implications to future CQA design.
Introduction
The success of community based question answering (CQA) services depends on high-quality content from users, particularly from domain experts. With highly engaging experts, services like Quora and StackOverflow attract hundreds of millions of visitors worldwide [42]. However, for most CQA systems, domain experts are answering questions voluntarily for free. As the question volume keeps growing, it becomes difficult to draw experts’ attention to a particular question, let alone getting answers on-demand [34].
To motivate experts, one possible direction is to introduce monetary incentives [11]. Recently, Quora started a beta test on “knowledge prize”, which allows users to put cash rewards on their questions. While Quora is slowly accumulating interested users (less than 10 paid answers per month), another payment-based service called Fenda111http://fd.zaih.com/fenda is rising quickly in China. Fenda is a social network app that connects users to well-known domain experts and celebrities to ask questions with payments. Launched in May 2016, Fenda quickly gained 10 million registered users, 500K paid questions, and 2 million US dollar revenue in just two months [40].
Fenda leads a new wave of payment-based CQA services that socially engage users with real-world domain experts. Similar services are emerging in China (Zhihu, Weibo QA) and US (Whale, Campfire.fm). The involvement of verified experts differs them from earlier payment-based CQA services (most defunct now) that were built on an anonymous crowd such as Mahalo Answers and ChaCha [3, 12, 21].
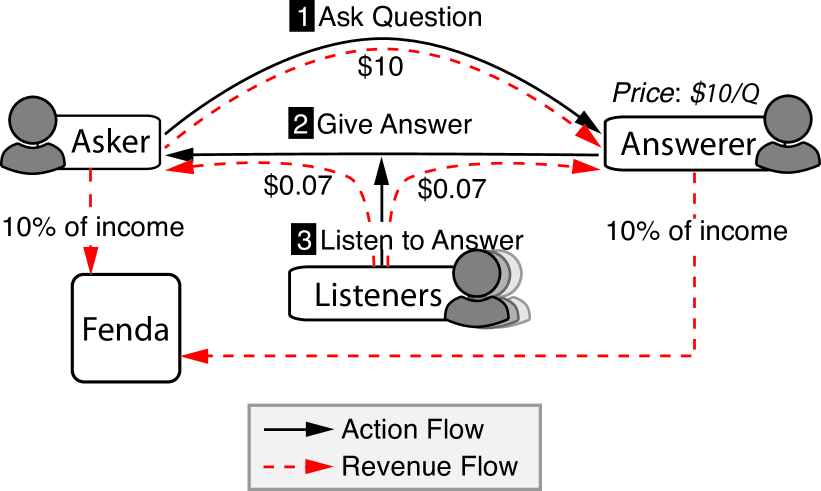
So, is monetary incentive the solution to strong expert engagement in CQA systems? How does monetary incentive affect the behavior of different players in the system and their over-time engagement? These questions are critical for payment-based CQA design, and platforms like Fenda provide a unique opportunity to study them. First, Fenda is the first supplier-driven CQA marketplace, where answerers (experts) set their own price. Users ask questions to a specific person instead of an anonymous crowd using payments. In addition, Fenda’s incentive model not only rewards answerers, but also those who ask good questions. After a question is answered, other users need to pay a small amount ($0.14) to listen to the answer. This money is split evenly between the asker and the answerer (Figure 1). A good question may attract enough listeners to compensate the initial question fee.
In this paper, we describe our experience and findings in an effort to understand the impact of monetary incentives on CQA systems, through a detailed measurement of Fenda (China) and a similar system Whale222https://askwhale.com/ (US). We collected a dataset of 88,540 users and 212,082 answers from Fenda (two months in 2016), and 1,419 users and 9,199 answers from Whale (6 months during 2016–2017), involving more than 1 million USD transactions. Given the drastic differences between payment-based CQA systems and mainstream systems such as Quora and StackOverflow, our study has significant implications for the future direction of CQA design.
Our study has a number of key findings.
-
•
First, we seek to understand the effectiveness of monetary incentives to engage domain experts. Our result shows this attempt is successful. Both Fenda and Whale attract a small group of high-profile experts and celebrities who make significant contributions to the CQA community. For example, Fenda experts count for 0.5% of the user population, but have contributed a quarter of all answers and driven nearly half of the financial revenue.
-
•
Second, we analyze how the incentive model affects user behavior, and find a mixed effect. On the positive side, monetary incentive enables quick answers (average delay 10–23 hours) and motivates users to ask good questions (40% of the Fenda questions successfully drew enough interested audience to cover the askers’ cost). However, we did find a small number of manipulative users including “bounty hunters” who aggressively asked questions to make money from listeners, and “collusive users” who work together to manipulate their perceived popularity.
-
•
Third, we study the dynamics between money and user engagement over time. In a supplier-driven CQA marketplace, users need to set the price of their answers. We find different pricing strategies of users have distinct impacts on their own engagement level. Users who proactively adjust their price are more likely to increase income and engagement level. Certain highly famous people, however, are unwilling to lower their price, which in turn hurts their income and social engagement.
To the best of our knowledge, this is the first empirical study on supplier-driven CQA marketplaces. Our study provides practical guidelines for other arising payment-based CQA services (Quora knowledge prize, Zhihu, Campfire.fm) and reveals key implications for future CQA system design. We believe this is a first step towards understanding the economy of community-based knowledge sharing.
Related Work
Community Based Question Answering (CQA). In recent years, researchers have studied CQA services from various aspects [33]. Early studies have focused on identifying domain experts in a CQA community [27, 9] and routing user questions to the right experts [22, 28]. Other works focused on assessing the quality of existing questions and answers [30, 41, 31, 36, 2, 10, 35] and detecting low quality (or even abusive) content [17]. Finally, researchers also studied Q&A activities in online social networks [26, 8]. As the sizes of CQA systems rapidly grow, it becomes challenging to engage with experts for timely and high-quality answers [34].
User Motivations in CQA. A successful CAQ system requires active and sustainable user participations. Prior works have summarized three main user motivations to answer questions online: “intrinsic”, “social” and “extrinsic” [14]. Intrinsic motivation refers to the psychic reward (e.g., enjoyment) that users gain through helping others [43, 25]. Social factors refer to the benefits of social interactions, e.g., gaining respect and enhancing reputation. Intrinsic and social factors are critical incentives for non-payment based CQA services [14]. Extrinsic factors refer to money and virtual rewards (e.g., badges and credit points) [25, 7].
Monetary incentive is an extrinsic factor implemented in earlier payment-based CQA services such as Google Answers, Mahalo, ChaCha and Jisiklog [3, 12, 21, 20]. Most of them are defunct. Compared with Fenda and Whale, these systems focus on building a CQA market on an anonymous crowd, instead of a social network that engages real-world experts. Users are primarily driven by financial incentives without a strong sense of community [21, 11]. This is concerning since research shows monetary incentive plays an important role in getting users started in CQA, but it is the social factors that contribute to the persistent participation [29].
Researchers have studied the impact of monetary incentives but the conclusions vary. Some researchers find that monetary incentives improves the answer quality [10] and response rate in social Q&A [44]. Others suggest that payments merely reduce the response delay but have no significant impact on the answer quality [3, 13, 12]. Studies also show that payment-based Q&A can reduce low-quality questions since users are more selective regarding what to ask [11, 12].
Crowdsourcing Marketplace. Broadly speaking, a payment-based CQA service is a specialized crowdsourcing marketplace. Today, most crowdsourcing marketplaces (e.g. Mechanical Turk) are “customer-driven” where customers post their tasks and set the task price [18]. In such marketplaces, pricing strategy can affect the work quality and response time [16, 24, 15]. Fenda and Whale, on the other hand, represent “supplier-driven” marketplaces where experts (the suppliers) get to set the price for their answers (products). Part of our analysis is to understand users’ pricing strategies and its impact on their Q&A activities and financial income.
Research Questions and Method
Systems like Fenda and Whale are leading the way to socially engage with real-world experts for question answering. The introduction of monetary incentives makes user interactions even more complex. If not carefully designed, monetary incentives can lead the systems down to the wrong path with users chasing financial profits and losing engagement in the long run. In this paper, we use Fenda as the primary platform to investigate how monetary incentives impact the user behavior and engagement-level in CQA systems. We also include Whale (a younger and smaller system) in our analysis for comparison and validation purposes.
We choose Fenda and Whale for two main reasons. First, Fenda and Whale represent the first supplier-driven CQA marketplaces with a unique incentive model to motivate both question askers and respondents. Second, the system (Fenda in particular) has received an initial success with a significant volume of data and revenue flow. We aim to understand the reasons behind their success and potential problems moving forward, which will benefit future CQA design. We did not include Quora since Quora hasn’t accumulated sufficient paid content (e.g., 10 paid answers per month).
Background of Fenda. Fenda is a payment-based Q&A app in China, which connects users in a Twitter-like social network. Launched in May 2016, Fenda quickly gained 10 million registered users and over 2 million US dollars worth of questions answers in the first two months [40, 19].
As shown in Figure 1, Fenda has a unique monetary incentive model to reward both question askers and answerers. A user (asker) can ask another user (answerer) a question by paying the price set by the answerer. The answerer then responds over the phone by recording a 1-minute audio message. If the answerer doesn’t respond within 48 hours, the payment will be refunded. Any other user on Fenda can listen to the answer by paying a fixed amount of 1 Chinese Yuan ($0.14), and it will be split evenly between the asker and answerer. A good question may attract enough listeners to compensate the initial cost for the asker. Users set the price for their answers and can change the price anytime. Fenda charges 10% of the money made by any user.
There are two types of users on Fenda: verified real-world experts (e.g., doctors, entrepreneurs, movie stars) and normal users. There is an expert list that contains all the experts that have been verified and categorized by the Fenda administrators. Users can browse questions from the social news feed or from the public stream of popular answers (a small sample). To promote user engagement, Fenda selects 2-4 answers daily on the public stream for free-listening for a limited time.
Background of Whale. Whale is a highly similar system launched in the US in September 2016. There are a few differences: First, Whale users record video (instead of audio) as their answers. Second, Whale has free questions and paid questions. For paid questions, it is also the answerer that sets the price, but Whale takes a higher cut (20%) from the question fee. Third, listeners use the virtual currency “whale coins” to watch the paid answers. Users can receive a few free coins from the platform after logging-in each day, and they may also purchase paid coins in bulks ($0.29 – $0.32 per coin). Only when a listener uses paid coins to unlock a question will the asker and answerer receive the extra payment ($0.099 each).
Our Questions. In the following, we use Fenda and Whale as the platform to analyze how monetary incentives impact user behavior and their engagement-level. We take a data-driven approach to answer the following key questions.
-
•
First, as an expert-driven CQA system, to what extent does the system rely on experts to generate content and revenue? What types of experts are more likely to make a profit?
-
•
Second, how does the monetary incentive affect the question answering process? Does money truly enable on-demand question answering from experts? Can users make money by asking (good) questions? Will monetary incentives encourage users to game the system for profits?
-
•
Third, in this supplier-driven market, how do users set and dynamically adjust the price of their answers? How does the pricing strategy affect their income and engagement-level over time?
Data Collection
We start by collecting a large dataset from Fenda and Whale through their mobile APIs. Our data collection focused on user profiles, which contained a full list of historical questions answered by the user. To obtain a large set of active users, we explored different options (some of which did not work). First, we find that there is no centralized list to crawl all registered users. Second, a user’s follower list is not public (only the total number is visible), and thus social graph crawling is not feasible. To these ends, we started our crawling from the expert list. For each expert, we collected their answered questions and the askers of those questions. Then we collected the askers’ profiles to get their answered question list and extract new askers. We repeated this process until no new users appeared. In this way, we collected a large set of active users who asked or answered at least one question.333Our study has received IRB approval: protocol # 16-1143.
We collected data from Fenda in July 2016. The dataset contains 88,540 user profiles and 212,082 question-answer pairs ranging from May 12 to July 27, 2016. Each question is characterized by the asker’s userID, question text, a timestamp, question price, and the number of listeners. Each answer is characterized by the answerer’s userID, a length of the audio and a timestamp. UserIDs in our dataset have been fully anonymized. We briefly estimated the coverage of the Fenda dataset. Fenda announced that they had 500,000 answers as of June 27, 2016 [40]. Up to the same date, our dataset covers 155,716 answers (about 31%). For Whale, we collected 1,419 user profiles and 9,199 question-answer pairs (1114 paid questions and 8085 free questions) from September 7, 2016 to March 8, 2017. It is difficult to estimate the coverage of the Whale dataset since there is no public statistics on the Whale user population. Table 1 shows a summary of our data.
| Service | Date | # of | # of | # of | # of |
| Name | (2016-2017) | Questions | Users | Askers | Answerers |
| Fenda | 5/12/16 – 7/27/16 | 212,082 | 88,540 | 85,510 | 15,529 |
| Whale | 9/07/16 – 3/08/17 | 9,199 | 1,419 | 1,371 | 656 |
Engaging with Domain Experts
As a CQA system driven by real-world experts, we first explore the roles and impact of domain experts in the system. More specifically, we examine the contributions of domain experts to the community in terms of generating content and driving financial revenue.
Fenda maintains a list of verified experts and celebrities, who are typically already well-known in their respective domains. As of the time of data collection, there were 4370 verified experts classified into 44 categories by Fenda administrators. We refer these 4,370 users as experts and the rest 84,170 users as normal users. Whale has a similar expert list (118 experts), and we refer the rest 1301 Whale users as normal users.
Question Answering
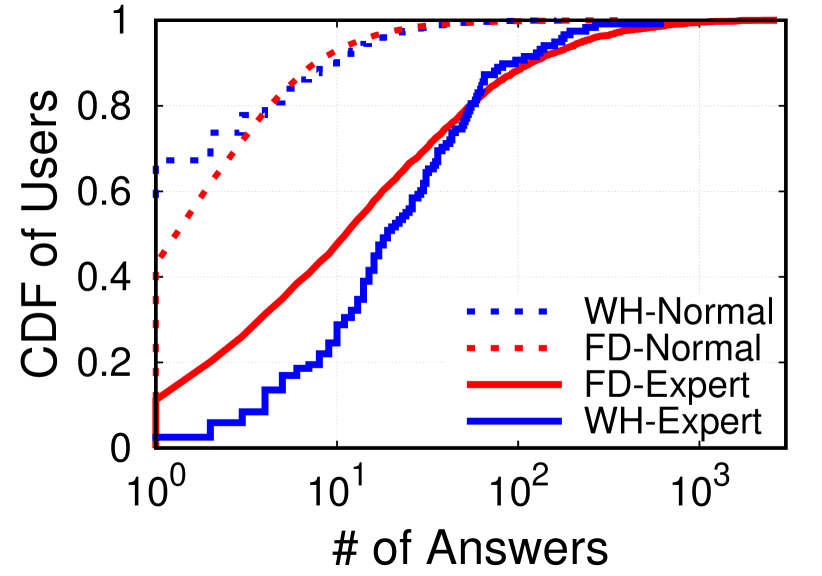
The small group of experts have contributed to a significant portion of the answers. Out of the 212K answers in the Fenda dataset, 171K (81%) are from experts. Using this dataset, we can briefly estimate the experts’ contribution in the context of the entire network. On June 27 2016, Fenda officially announced total 500K answers and 10 million users [40]. Up to the same date, our dataset shows the 4,370 experts (0.44% of the population) have contributed 122K answers (24.4% of total answers). Individually, experts in Fenda (FD) also answered significantly more questions than normal users as shown in Figure 5. Whale (WH) has a similar situation where 118 experts (8% of users) have contributed 4,967 answers (54% of answers).
Money
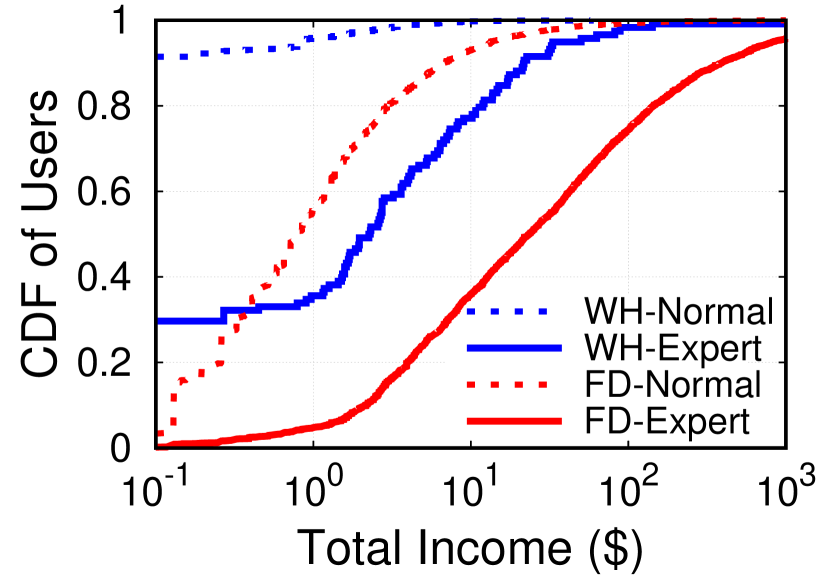
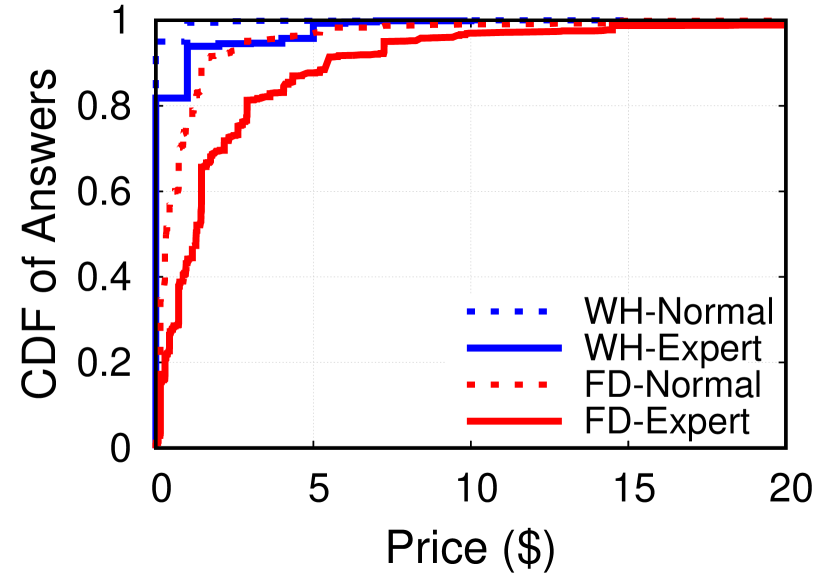
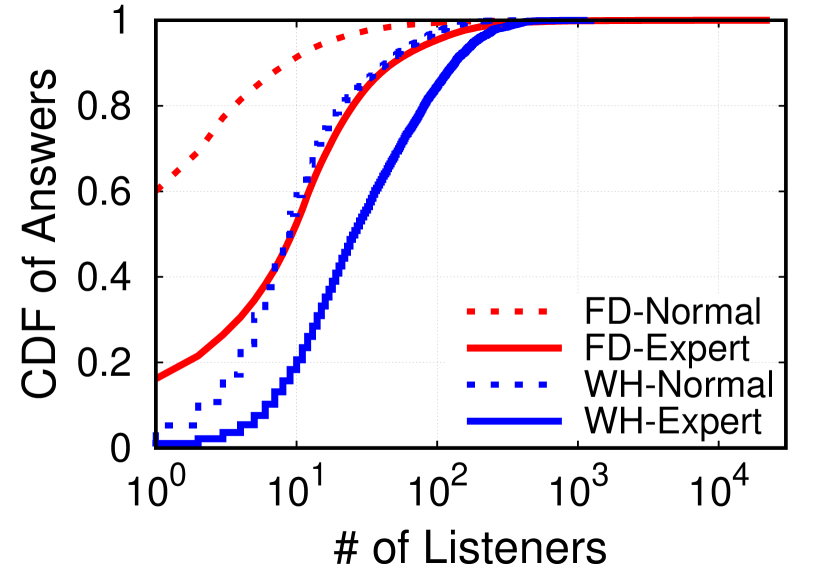
Experts play an important role in driving revenue. In total, the questions in the Fenda dataset were worth $1,169,994 including payments from askers and listeners.444We convert Chinese Yuan to US dollar based on $1 = 6.9 Yuan. Experts’ answers generated $1,106,561, counting for a dominating 95% of total revenue in our dataset. To gauge experts’ contribution in the context of the entire network, we again performed an estimation: Fenda reached 2 million revenue as of June 27 in 2016 [40]. Up to this same date (June 27), expert answers in our dataset have attracted $909,876, counting for a significant 45% of the 2 million revenue. Figure 5 and Figure 5 show that, on average, experts charge higher ($2.9 vs. $1.0) and draw more listeners (27 vs. 5) than normal users.
Individually, experts also make more money than normal users. Figure 5 shows the total income for users who answered at least one question. On Fenda, 50% of experts made more than $23, while a small group of experts (5%) made more than $1000. The highest earning is $33,130 by Sicong Wang, a businessman and the son of a Chinese billionaire. He answered 31 questions related to gossip and investment. He charged $500 for each of his answers, which drew 9484 listeners ($664 extra earning) per answer on average.
On Whale, experts are also the major contributors to the revenue flow. The total collected questions on Whale worth $2,309 and experts contributed to $2,028 (89%). Compared with Fenda (FD), Whale (WH) users earned significantly less money (Figure 5). A possible reason, as shown in Figure 5, is that most users (more than 80%) provide answers for free.
| Fenda | Whale | ||||
|---|---|---|---|---|---|
| Category | Tot. Income | Experts | Category | Tot. Income | Experts |
| Health | $123K (12%) | 204 | Startups | $1.9K (72%) | 63 |
| Career | $81K (8%) | 222 | Tech | $1.8K (72%) | 61 |
| Business | $81K (8%) | 108 | Entertain. | $877 (33%) | 2 |
| Relation. | $73K (7%) | 90 | Snapchat | $869 (33%) | 1 |
| Movies | $52K (5%) | 84 | Motorcycle | $869 (33%) | 1 |
| Entertain. | $52K (5%) | 51 | Marketing | $471 (18%) | 20 |
| Academia | $49K (5%) | 64 | Design | $383 (14%) | 15 |
| Media | $45K (5%) | 138 | Travel | $203 (8%) | 18 |
| Real Estate | $43K (4%) | 28 | Fitness | $191 (7%) | 19 |
| Education | $39K (4%) | 174 | Finance | $141 (5%) | 8 |
Expert Categories
Experts of different categories have distinct earning patterns. Table 2 shows the top 10 categories ranked by the total earnings per category. In Fenda, the most popular experts are related to professional consulting. The top category is health, followed by career, business, and relationship. In the health category, many experts are real-world physicians and pediatricians. They give Fenda users medical advice on various (non-life-threatening) issues such as headache and flu with the expense of several dollars. Other popular categories such as movies and entertainments contain questions to celebrities about their insider experience, gossip and opinions on trending events.
Whale, on the other hand, has fewer experts. The highest earning experts are related to startups and technology. Note that Whale experts can belong to multiple categories, so the percentage of accumulated income exceeds 100%.

In Figure 6, we further illustrate the distinct earning patterns of Fenda experts. We omit the result for Whale due to its short expert list. For each category, we compute the average price and the number of answers per expert. The red lines represent the average values across all experts, which divide them into 4 sections. Experts in health, entertainment, relationship, and real estate often charge high and answer many questions. These experts are among the top-earning groups; Experts in business set the price high but don’t answer many questions; Less-serious categories such as funny and comics have fewer and less expensive questions. Finally, digital represents experts who answer lots of questions with a low price. The results also reflect the different user perceived values for different domain knowledge.
Impact of Monetary Incentives
So far we show that Fenda and Whale are highly dependent on domain experts’ contribution. Then the question is how to motivate experts to deliver timely and high-quality answers. In this section, we perform extensive analysis on the monetary incentive model to understand its impact on user behavior. Noticeably, Fenda and Whale use money to reward both question answerers and askers. To this end, we first analyze answerers to understand how they price their answers, and whether payments lead to on-demand responses. Second, we focus on askers analyzing whether and how users make money by asking the right questions. Finally, we seek to identify abnormal users such as “bounty hunters” who aggressively or strategically game the system for profits.
| Behavior Metric | Fenda | Whale |
|---|---|---|
| # Followers | 0.53* | 0.30* |
| Avg. # Listeners | 0.65* | 0.08* |
| # Questions Answered | 0.04* | 0.14* |
| Avg. Response Time | 0.01 | -0.07 |
Answerers
To motivate users (particularly domain experts), both Fenda and Whale allow users to determine the price for their answers. In the following, we investigate how money affects the way users answer questions. Particularly, we examine if monetary incentives truly enable on-demand quick answers.
Setting the Answer Price. To understand how users set a price for their answers, we calculate the Pearson correlation [32] between a user’s price and different behavior metrics. In Table 3, we observe that the price has positive and significant correlations with the number of followers, listeners, and answered questions. A possible explanation is that users with many followers and listeners are real-world celebrities who have the confidence to set a higher price. The higher price may also motivate them to answer more questions. Note that these are correlation results, which do not reflect causality.
Surprisingly, there is no significant correlation between price and response time (for both Fenda and Whale). This is different from existing results on customer-driven CQA markets, where an asker can use a higher payment to collect answers more quickly [16, 24, 12].
| Service Name | Avg. Resp. | Payment | Crowdsourcing |
| Time (hr) | Based? | or Targeted? | |
| Yahoo Answers | 8.25 | N | Crowdsourcing |
| Fenda | 10.4 | Y | Targeted |
| Whale | 23.6 | Y | Targeted |
| Google Answers | 36.9 | Y | Crowdsourcing |
| Stack Overflow | 58.0 | N | Crowdsourcing |
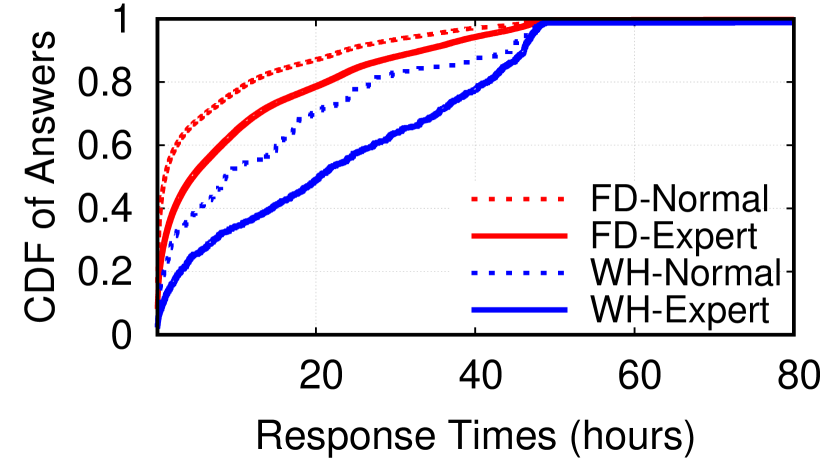
Answering On-demand? We further examine the response time to see if monetary incentives truly enable answering questions on-demand. As shown in Figure 9, answers arrive fast on Fenda: 33% of answers arrived within an hour and 85% arrived within a day. Note that there is a clear cut-off at 48 hours. This is the time when un-answered questions will be refunded, which motivates users to answer questions quickly. After 48 hours, users can still answer those questions for free. We find that only 0.7% of the answers arrived after the deadline, but we cannot estimate how many questions remain unanswered due to the lack of related data. Despite the high price charged by experts, experts respond slower than normal users.
The result for Whale is very similar. Figure 9 shows that for paid questions, 50%–70% of answers arrived within a day and normal users respond faster than experts. Comparing to Fenda, Whale has a slightly longer delay possibly because recording a video incurs more overhead than recording a voice message.
We then compare Fenda and Whale with other CQA systems in Table 4. The response delay in Fenda and Whale is shorter than that of Google Answers and StackOverflow, but longer than that of Yahoo Answers. As payment-based systems, Fenda/Whale beats Google Answers probably because Fenda/Whale only asks for a short audio/video, while Google Answers require lengthy text. Compared to Yahoo Answers, we believe it is the crowdsourcing factor that plays the role. Systems like Yahoo Answers crowdsource questions to a whole community where anyone could deliver the answer. Instead, Fenda/Whale’s question is targeted to a specific user, which may lead to a longer delay even with payments.
Askers
Fenda and Whale implement the first monetary incentive model to reward users for asking good questions. More specifically, once a user’s question gets answered, this user (the question asker) can earn a small amount of money from people who want to listen to the answer. This model, if executed as designed, should motivate users to contribute high-quality questions for the community.
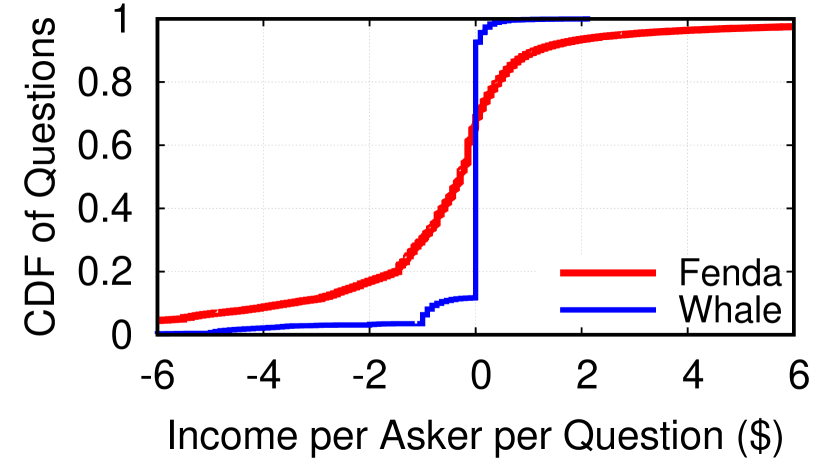
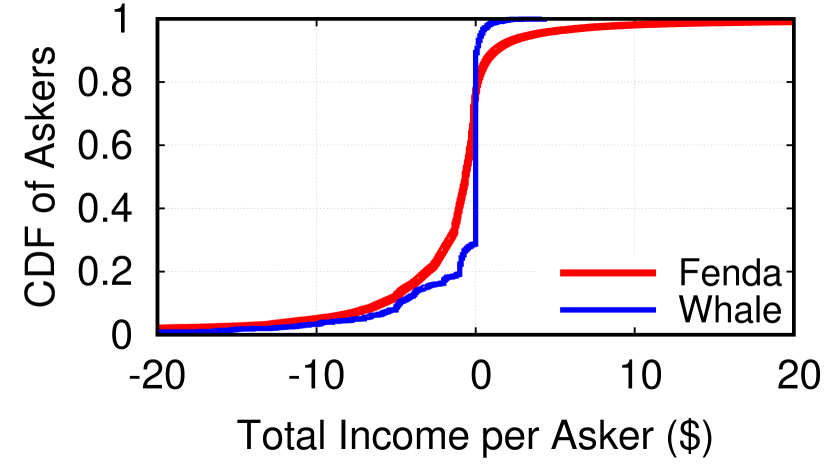
Can Askers Make Money? For each question, the question asker’s income is half of listeners’ payments, with Fenda’s commission fee and initial question fee deducted. Our result shows that Fenda askers are motivated to ask good questions that attract broad interests. As shown in Figure 9, out of all questions, 40% have successfully attracted enough listeners to return a positive profit to the asker. For individual askers, Figure 9 shows 40% of them have a positive total income. However, for Whale, the vast majority of askers did not earn money. Part of the reason is most people only ask free questions. More importantly, Whale gives away free coins every day to motivate users to login. If a listener uses free coins (instead of paid coins), the asker will not receive any money.
How Do Askers Make Money? To understand why certain users make money (and others don’t), we compare askers who have positive income with those with negative income in Table 5. Specifically, we examine to whom they ask questions (i.e., the number followers and listeners of the answerer), average question price, and total questions asked. A two-sample t-Test [32] shows the significance of the differences between the two groups of askers.
On Fenda, users of positive income are more likely send questions to people who have more listeners and charge less. The counter-intuitive result is the number of followers: asking people with more followers is more likely to lose money. A possible explanation is the inherent correlation between a user’s number of followers and her answer price — famous people would charge higher and the money from listeners cannot cover the initial cost. We also observe that askers with a higher income often asked more questions. Again, correlation does not reflect causality: it is possible that the positive income motivates users to ask more questions, or people who asked more questions get more experienced in earning money.
It is hard to interpret the Whale results in Table 5 since only a very small of fraction of askers have a positive income (Figure 9). Noticeably, askers with positive income exclusively ask free questions (average price = 0).
| Fenda | Whale | |||||
|---|---|---|---|---|---|---|
| Behavior | Askers | Askers | Askers | Askers | ||
| Metric | 0 | 0 | 0 | 0 | ||
| Avg. Followers | 2155.5 | 3758.5 | * | 750.2 | 790.0 | |
| Avg. Listeners | 55.2 | 16.9 | * | 28.3 | 38.1 | * |
| Avg. Price | 1.58 | 4.58 | * | 0.0 | 0.3 | * |
| Avg. Questions | 3.99 | 1.86 | * | 5.4 | 6.6 | |
Abnormal Users
Next, we examine suspicious users in the CQA market who seek to game the system for financial profits.
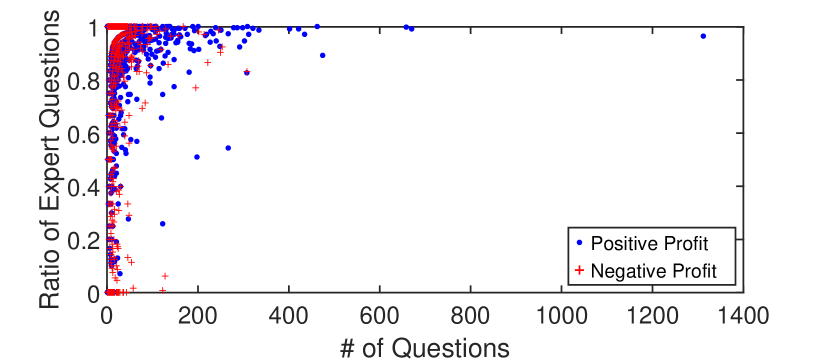
Bounty Hunters. We first focus on askers who aggressively ask questions to gain profits (or “bounty hunters”). Our intuition is that those users would ask a lot of questions, particular to experts. To identify potential bounty hunters in Fenda, we examine outliers in Figure 10, which is a scatter plot for the number of questions a user asked versus the ratio of questions to experts. We find clear outliers at the right side (e.g., users with 100 questions). Most of these users end up with positive income. They asked way more questions than other users (who asked 2.27 questions on average), and exclusively interact with experts (ratio of expert questions is close to 1). The most extreme example is a user who asked more than 1300 questions in two months, with 95% of questions to experts. This user earned $194.20, which is much higher than the average income of askers (-$1.95).
To further examine these outliers, we select askers who asked more than 100 questions. This gives us 111 users who count for 0.13% of askers in our dataset but aggressively asked 11% of the questions. In addition, they seem to carefully target experts who charge a lower price ($0.80 per answer) but still draw significant listeners (15.5 per answer). As a comparison, the rest of the experts on average charge $2.49 and draw 23.0 listeners per answer.
We performed the same analysis on Whale and did not find such outlier users because most askers on Whale did not make a positive profit (Figure 9). We omit the results for brevity.
Collusive Users. In addition to bounty hunters, there could be “collusive” users who work together to make money. For example, an asker may collude with an answerer by asking many questions (with an extremely low price) to create the illusion that the answerer is very popular. Then both the asker and the answerer can make money from the listeners of these questions. This collusion may be even conducted by a single attacker who controlled both the asker and answerer accounts.
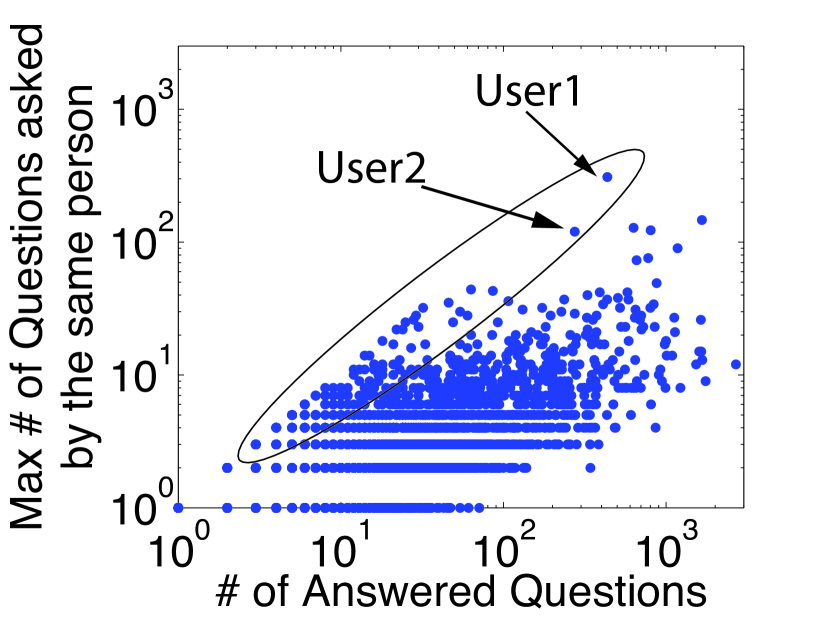
To identify collusive users, we focus on answerers whose questions are primarily asked by the same user. Figure 11 shows a scatter plot for the number of questions a user answered versus the maximum number of these questions asked by the same person. Users that are close to the diagonal are suspicious. Take the two marked dots in Figure 11(a) for example, user1 answered 435 questions and 309 (71%) were asked by the same asker. We notice that this asker did not ask any other users any questions. The questions between these two users charge $0.16 each, which is much lower than user1’s other questions ($0.25 on average). By using a lower price for collusion, the two users can minimize their loss — the 10% commission fee to Fenda. In this way, user1 earned $689.9 in total and this asker also earned $244 from the listeners. The second example follows the same pattern. 120 out of 274 questions that user2 answered were from the same asker (who only asked 128 questions in total). This leads to financial returns for both user2 ($116.42) and the asker ($27.5).
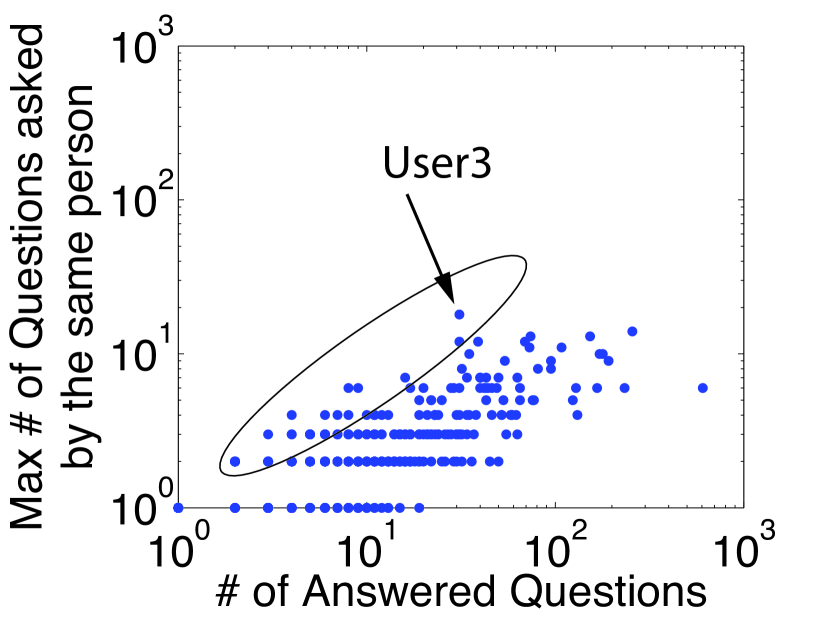
Figure 11(b) shows the result of Whale. The example user (user3) answered 31 questions, 18 of which were from the same asker. This asker only asked these 18 questions and all 18 questions were free of charge. This is likely an attempt to boost user3’s popularity.
Discussion. Our analysis shows that monetary incentives did foster manipulative behavior. On the positive side, these users (bounty hunters or collusive users) are actually working hard to come up with interesting questions in order to earn money from listeners. On the negative side, such behavior has a disruptive impact to the marketplace. For example, bounty hunters are injecting a large volume of questions to experts. The large volume of questions act as spam to experts, blocking other users’ chance to get the experts’ attention. For collusive behavior, it creates a fake perception of popularity, which could mislead listeners to making the wrong spending. In addition, collusion also introduces unfairness to other honest experts, which is likely to hurt the sustainability of the community in the long run.
Our analysis focuses on the most likely attacks, and there could be other types of attacks. For example, answerers and listeners may also collude to bootstrap the “listening count” for a question and lure innocent users to pay for listening. However, we don’t have the related data (e.g., listeners’ IDs) to analyze this attack.
Dynamic Pricing and User Engagement
As supplier-driven marketplaces, Fenda and Whale allow users to set the price for their answers. How users set this price may affect their financial income and their interaction with other users. In this section, we turn to the dynamic aspect to analyze how users adjust their answer prices over time and how different pricing strategies affect their engagement level. Understanding this question is critical since keeping users (particularly experts) engaged is the key to building a sustainable CQA service.
In the following, we first identify common pricing strategies by applying unsupervised clustering on users’ traces of price change. Then we analyze the identified clusters to understand what type of users they represent, and how their engagement-level changes over time.
| id | Feature Name | Feature Description |
|---|---|---|
| 1 | Price Change Freq. | # of price change / # answers |
| 2 | Price Up Freq. | # price up / # answers |
| 3 | Price Down Freq. | # price down / # answers |
| 4 | Price Up - Down | (# price up - # price down) / # answers |
| 5 | Price Up Magnitude | Average percentage of price increase |
| 6 | Pirce Down Magnitude | Average percentage of price decrease |
| 7 | Consecut. Same Price | Max # consecutive same price / # answers |
| 8 | Consecut, Price Up | Max # consecutive price up / # answers |
| 9 | Consecut. Price Down | Max # consecutive price down / # answers |
Identifying Distinct Pricing Strategies
To characterize users’ dynamic price change, we construct a list of features to group users with similar price change patterns.
Key Features. For each user, we model their price change as a sequence of events. Given user , our dataset contains the complete list of her answers and the price for each answer. We use to denote user ’s price sequence where is the total number of answers of user . A price change event happens when for any . We denote the price change sequence as where is a number of times for price change and is a price change event (price-up, price-down, or same-price).
Table 6 list our 9 features: the overall frequency of price change (i.e., ), a frequency for price-up and price-down, and the frequency difference between price-up and down. In addition, we consider the average price change magnitude for price-up and price-down events. Finally, we consider the maximum number of consecutive events of same-price, price-up and price-down in the sequence.
User Clustering. Based on these features, we then cluster similar users into groups. First, we compute the pair-wise Euclidean distance between users based on their feature vectors. This produces a fully connected similarity graph [38] where each node is a user and edges are weighted by distance. Then, we apply hierarchical clustering algorithm [5] to detect groups of users with similar price change patterns. We choose hierarchical clustering for two reasons: 1) It does not pre-define the number of clusters. 2) It is deterministic and the clustering result does not depend on the initial seeding.
To determine the number of clusters, we use modularity, a well-known metric to measure clustering quality [5]. High modularity means users are more densely connected within each cluster than to the rest of the users. We choose the number of clusters that yields the highest modularity.
For this analysis, we only consider users who have answered enough questions (more than 10). Otherwise, discussing their dynamic price change and engagement would be less meaningful. On Fenda, this filtering produces 2094 users who have answered 171,322 questions (85% of all questions). On Whale, however, only 68 users meet the criteria. These users answered 986 paid questions (89% of all paid questions). We will primarily focus on Fenda, and also include Whale’s results for completeness.

Clustering Results
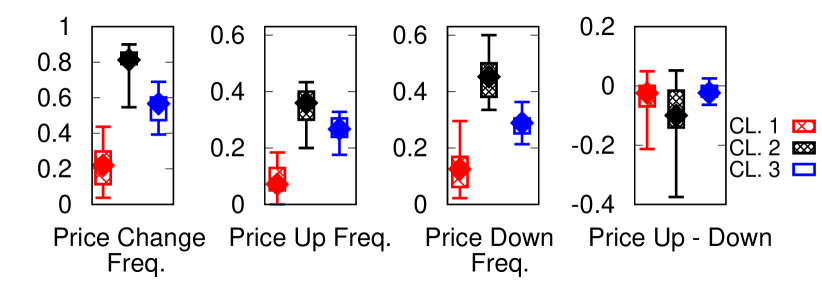
Our method produces 3 clusters for both Fenda (modularity 0.59) and Whale (modularity 0.62). To understand the pricing strategy of each cluster, we plot their feature value distributions in Figure 12. Due to space limitation, we plot 4 (out of 9) most distinguishing features that have the largest variance among the 3 clusters selected by Chi-Squared statistic [32]. The three clusters on Fenda are:
-
•
CL.1 (33%): Frequent price up and down. 687 users (76% are experts) who have a high price change frequency. Price up and down are almost equally frequent.
-
•
CL.2 (43%): Rarely changing price. 908 users (76% are experts) who rarely change their price.
-
•
CL.3 (24%): Frequent price up. 499 users (74% are experts) who increase price frequently but rarely lower their price.
We find that the 3 types of pricing patterns on Fenda correspond to users of different popularity. As shown in Table 7, cluster 1 represents the least popular answerers, who have the least followers and listeners but answered more questions. These users constantly adjust their price, possibly to test the market. Cluster 3 represents the most popular experts and celebrities. They charge higher than others and keep increasing the price. Cluster 2 stands between cluster 1 and 3 in terms of popularity, and its users rarely change the price.
Whale’s 3 clusters only contain 68 users in total. We include the results for completeness:
-
•
CL.1 (60%): Rarely changing price. 41 users (32% are experts) with the least frequent price change.
-
•
CL.2 (22%): Frequent price up and down. 15 users (87% are experts) who frequently change/drop the price.
-
•
CL.3 (18%): Occasional price up and down. 12 users (92% are experts) who occasionally change the price.
As shown in Table 7, Whale’s cluster 3 contains the most popular users, followed by cluster 1 and 2. Figure 12(b) “Price Up-Down” shows the most popular users of cluster 3 are relatively balanced in terms of increasing versus decreasing the price. The less popular users of cluster 1 and 2 are more leaning towards decreasing the price. Compared to Fenda, all the clusters of Whale adjust their price rather frequently. This shows that popular users on Fenda already have the luxury to keep increasing the price. On Whale, even the most popular users are frequently adjusting their price, possibly due to the limited earning opportunities (a much lower payment per question).
| Metrics | Fenda | Whale | ||||
|---|---|---|---|---|---|---|
| CL.1 | CL.2 | CL.3 | CL.1 | CL.2 | CL.3 | |
| Avg. #Followers | 627.6 | 749.5 | 951.4 | 508.7 | 1358.1 | 1687.1 |
| Avg. #Listeners | 16.6 | 27.0 | 25.9 | 43.5 | 68.1 | 62.6 |
| Avg. Price ($) | 1.7 | 2.4 | 2.6 | 0.2 | 1.3 | 0.7 |
| Avg. #Questions | 106.5 | 68.8 | 71.4 | 41.6 | 17.7 | 112.4 |
Impact to User Engagement
Next, we analyze how price adjustments affect a user’s engagement-level over time. Price is a key parameter within users’ control, and adjusting price is a way to test their answers’ value in the market. Intuitively, this price can affect a user’s incoming questions, earnings and social interactions, which are key incentive factors to keep users engaged.
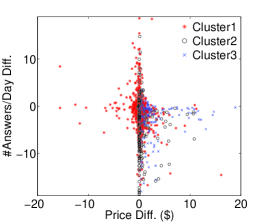
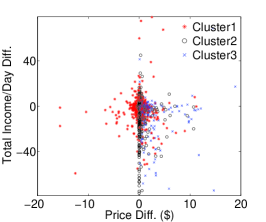
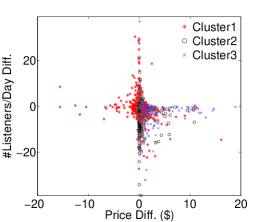
Fenda. Figure 13(a) shows the interplay between price change and engagement level over time for 3 identified clusters on Fenda. We quantify engagement-level using number of answers per day. To measure changes over time, we divide a user’s lifespan (time between her first and last answer in our dataset) into two even parts. Then we compute the differences for average price and engagement-level between the later half and first half. In a similar way, we also measure the changes in income (Figure 13(b)) and listeners (Figure 13(c)), which represent the strength of monetary and social incentives
We observe different patterns: for cluster 2 and 3, more users are located in the lower right corner than upper right, indicating a decrease of engagement, income and number of listeners. A possible explanation is that there is a mismatch between the answer’s price and its value, but users did not make the right adjustments. In contrast, we find a significant number of users in cluster 1 located in the upper left corner. By lowering their price, these users get to answer more questions, and receive more money and listeners over time. We validate the statistical significance of the results by calculating the Pearson correlation [32] between the price change () and behavior metrics () for all three clusters in Figure 13. We find 8/9 of the correlations are significant () except for cluster1’s income/day metric.
Our result suggests that users need to set their price carefully to match their market value. This requires proactive price adjustments and lowering their price when necessary. Right now, highly popular users on Fenda (e.g., cluster 3) are less motivated or unwilling to lower their price, which in turn hurts their income and engagement level over time.
Whale. We performed the same analysis on Whale and found none of the correlations were statistically significant (possibly due to the small sample size).
Discussion
Our analysis shows both positive impacts of monetary incentives and some concerning issues in the long run. Below, we discuss the key implications to future CQA design.
First, Answering On-demand. Fenda and Whale adopt a supplier-driven model where experts set a price for their answer. This model is suitable for targeted questions (users know who to ask), but can have a longer delay compared to crowdsourcing (where anyone can be a potential answerer). Fenda and Whale achieve faster responses than most CQA services, but are still not as fast as the crowdsourcing based Yahoo Answers. Recently, Fenda added a new crowdsourcing channel for “medical” and “legal” questions. This channel is customer-driven: users post their questions with a cash reward, and any experts can give their answers to compete for the reward. We did a quick crawling on the crowdsourcing channel and obtained 1344 questions. We find their average response time is 4.38 hours, which is even faster than the 8.25 hours of Yahoo Answers (Table 4). A promising future direction is to explore a hybrid design of customer-driven and supplier-driven model to further improve CQA efficiency.
Second, Rewarding Good Questions. Fenda and Whale are the first systems that reward users financially for asking good questions. This leads to a mixed effect. On the positive side, users are motivated to ask good questions that attract broad interests. 40% of the questions on Fenda received enough listeners to cover the asker’s cost. Whale, however, is less successful in profiting the askers due to the “free coin” design. On the negative side, this model motivates a small number of users to game the system for profits. We find “bounty hunters” who aggressively ask questions to low-priced experts, and “collusive” users who work together to manipulate their perceived popularity. Note that this is different from the traditional cheating behavior in crowdsourcing platforms like MTurk, where cheaters often produce low-quality work [6]. In Fenda and Whale, manipulators mainly introduce unfairness, but they still need to come up with good questions to attract listeners.
Finally, Unfairness in Supplier-driven Markets. In a supplier-driven marketplace, a well-known expert has the key advantage to receive questions. As a result, the financial income among answerers is highly uneven: top 5% answerers get about 90% of the total profits in Fenda. To attract questions, we find that less popular users need to carefully adjust their price (including dropping the price), while more popular users tend to increase their price. To help users to bootstrap popularity, Fenda recently introduced a system update, which allows users to set their answers “free-for-listening” for 30 minutes after posting.
Future Work and Limitations
Fenda and Whale are among the recent wave of CQA systems that explore a new design space for payment-based knowledge sharing communities. They not only provide valuable lessons for other services, but also raise new questions.
Communication Mechanisms for CQA. Fenda and Whale let users record their answers in audio/video to avoid the inconvenience of typing text on the phone. Audio/video is likely to provide a more intimate experience for users, which, however, also makes it difficult to give longer answers. Future research may examine the proper communication channels (text, audio, video) for different Q&A contexts. Noticeably, real-time streaming can be a promising option for CQA, given the huge success of Periscope and Facebook Live [37].
Preventing Abuse and Manipulation. Abusive activities are likely to be a common problem for payment-based CQA given that money is the incentive. Our work provides a first look (empirically) at the bounty hunters and collusive users in Fenda and Whale. Future research is needed to develop more systematic approaches to detect abusive players and design new incentive models to prevent/limit abuse.
Study Limitations. Our study has a few limitations. First, our study only focuses on two services: Fenda and Whale. A broader comparison with other payment-based CQA services can help to further generalize our results. Second, our dataset is not perfect. The crawler produces a dataset with a complete list of experts but an incomplete list of normal users. We argue that most of the missing users are likely lurkers (or inactive users) who are less influential in the community. We also used Fenda’s official numbers to justify parts of our results. Finally, Fenda and Whale are still exploring its way to building a sustainable CQA marketplace. It made a few changes before our paper submission as discussed above. We plan to continue to monitor these systems for future work.
Conclusion
In this paper, we discuss lessons learned from the first supplier-driven payment-based CQA systems. By analyzing a large empirical dataset, we reveal the benefits of applying monetary incentives to CQA systems (fast response, high-quality questions) as well as potential concerns (bounty hunters and over time engagement). As more payment-based CQA systems arise (Campfire.fm, Quora Knowledge Prize, Zhihu Live), our research results can help system designers to make more informed design choices.
References
- [1]
- [2] Lada A Adamic, Jun Zhang, Eytan Bakshy, and Mark S Ackerman. 2008. Knowledge sharing and yahoo answers: everyone knows something. In Proc. of WWW.
- [3] Yan Chen, Tech-Hua Ho, and Yong-Mi Kim. 2010. Knowledge market design: A field experiment at Google Answers. Journal of Public Economic Theory 12, 4 (2010), 641–664.
- [4] Benjamin Edelman. 2011. Earnings And Ratings At Google Answers. Economic Inquiry 50, 2 (2011), 309–320.
- [5] Santo Fortunato. 2010. Community detection in graphs. Physics Reports 486 (2010), 75 – 174.
- [6] Ujwal Gadiraju, Ricardo Kawase, Stefan Dietze, and Gianluca Demartini. 2015. Understanding Malicious Behavior in Crowdsourcing Platforms: The Case of Online Surveys. In Proc. of CHI.
- [7] Scott Grant and Buddy Betts. 2013. Encouraging user behaviour with achievements: an empirical study. In Proc. of MSR.
- [8] Rebecca Gray, Nicole B. Ellison, Jessica Vitak, and Cliff Lampe. 2013. Who Wants to Know?: Question-asking and Answering Practices Among Facebook Users. In Proc. of CSCW.
- [9] Benjamin V. Hanrahan, Gregorio Convertino, and Les Nelson. 2012. Modeling Problem Difficulty and Expertise in Stackoverflow. In Proc. of CSCW.
- [10] F Maxwell Harper, Daphne Raban, Sheizaf Rafaeli, and Joseph A Konstan. 2008. Predictors of answer quality in online Q&A sites. In Proc. of CHI.
- [11] Gary Hsieh and Scott Counts. 2009. mimir: A market-based real-time question and answer service. In Proc. of CHI.
- [12] Gary Hsieh, Robert E Kraut, and Scott E Hudson. 2010. Why pay?: exploring how financial incentives are used for question & answer. In Proc. of CHI.
- [13] Grace YoungJoo Jeon, Yong-Mi Kim, and Yan Chen. 2010. Re-examining price as a predictor of answer quality in an online Q&A site. In Proc. of CHI.
- [14] Xiao-Ling Jin, Zhongyun Zhou, Matthew KO Lee, and Christy MK Cheung. 2013. Why users keep answering questions in online question answering communities: A theoretical and empirical investigation. IJIM 33, 1 (2013), 93–104.
- [15] Manas Joglekar, Hector Garcia-Molina, and Aditya G. Parameswaran. 2013. Evaluating the Crowd with Confidence. In Proc. of SIGKDD.
- [16] Aikaterini Katmada, Anna Satsiou, and Ioannis Kompatsiaris. 2016. Incentive mechanisms for crowdsourcing platforms. In Proc. of INSCI.
- [17] Imrul Kayes, Nicolas Kourtellis, Daniele Quercia, Adriana Iamnitchi, and Francesco Bonchi. 2015. The Social World of Content Abusers in Community Question Answering. In Proc. of WWW.
- [18] Aniket Kittur, H. Chi, and Bongwon Suh. 2008. Crowdsourcing user studies with Mechanical Turk. In Proc. of CHI.
-
[19]
Phoenix Kwong. 2016.
China’s online question-and-answer platform Fenda raises US$25
million from investors.
http://www.scmp.com/business/companies/article/
1982524/chinas-online-question-and-answer-
platform-fenda-raises-us25. (June 2016). - [20] Uichin Lee, Hyanghong Kang, Eunhee Yi, Mun Yi, and Jussi Kantola. 2012. Understanding mobile Q&A usage: an exploratory study. In Proc. of CHI.
- [21] Uichin Lee, Jihyoung Kim, Eunhee Yi, Juyup Sung, and Mario Gerla. 2013. Analyzing crowd workers in mobile pay-for-answer q&a. In Proc. of CHI.
- [22] Baichuan Li and Irwin King. 2010. Routing questions to appropriate answerers in community question answering services. In Proc. of CIKM.
- [23] Lena Mamykina, Bella Manoim, Manas Mittal, George Hripcsak, and Björn Hartmann. 2011. Design lessons from the fastest Q&A site in the west. In Proc. of CHI.
- [24] Winter Mason and Duncan J Watts. 2010. Financial incentives and the performance of crowds. ACM SigKDD Explorations Newsletter 11, 2 (2010), 100–108.
- [25] Kevin Kyung Nam, Mark S Ackerman, and Lada A Adamic. 2009. Questions in, knowledge in?: a study of naver’s question answering community. In Proc. of CHI.
- [26] Jeffrey Nichols, Michelle Zhou, Huahai Yang, Jeon-Hyung Kang, and Xiao Hua Sun. 2013. Analyzing the Quality of Information Solicited from Targeted Strangers on Social Media. In Proc. of CSCW.
- [27] Aditya Pal, Shuo Chang, and Joseph A. Konstan. 2012. Evolution of Experts in Question Answering Communities. In Proc. of ICWSM.
- [28] Aditya Pal, Fei Wang, Michelle X. Zhou, Jeffrey Nichols, and Barton A. Smith. 2013. Question routing to user communities. In Proc. of CIKM.
- [29] Daphne Ruth Raban. 2008. The incentive structure in an online information market. Journal of the American Society for Information Science and Technology 59, 14 (2008), 2284–2295.
- [30] Sujith Ravi, Bo Pang, Vibhor Rastogi, and Ravi Kumar. 2014. Great Question! Question Quality in Community Q&A. In Proc. of ICWSM.
- [31] Chirag Shah and Jefferey Pomerantz. 2010. Evaluating and predicting answer quality in community QA. In Proc. of SIGIR.
- [32] David J. Sheskin. 2007. Handbook of Parametric and Nonparametric Statistical Procedures.
- [33] Ivan Srba and Maria Bielikova. 2016a. A Comprehensive Survey and Classification of Approaches for Community Question Answering. ACM TWeb 10, 3 (2016), 18:1–18:63.
- [34] I. Srba and M. Bielikova. 2016b. Why is Stack Overflow Failing? Preserving Sustainability in Community Question Answering. IEEE Software 33, 4 (2016), 80–89.
- [35] Qi Su, Dmitry Pavlov, Jyh-Herng Chow, and Wendell C. Baker. 2007. Internet-scale Collection of Human-reviewed Data. In Proc. of WWW.
- [36] Qiongjie Tian, Peng Zhang, and Baoxin Li. 2013. Towards Predicting the Best Answers in Community-based Question-Answering Services.. In Proc. of ICWSM.
- [37] Bolun Wang, Xinyi Zhang, Gang Wang, Haitao Zheng, and Ben Y. Zhao. 2016b. Anatomy of a Personalized Livestreaming System. In Proc. of IMC.
- [38] Gang Wang, Xinyi Zhang, Shiliang Tang, Haitao Zheng, and Ben Y. Zhao. 2016a. Unsupervised Clickstream Clustering For User Behavior Analysis. In Proc. of CHI.
- [39] Dan Wu and Daqing He. 2014. Comparing IPL2 and Yahoo! Answers: A Case Study of Digital Reference and Community Based Question Answering. In Proc. of IConf.
- [40] Li Xuanmin. 2016. Putting a price on knowledge. http://www.globaltimes.cn/content/997510.shtml. (August 2016).
- [41] Yuan Yao, Hanghang Tong, Feng Xu, and Jian Lu. 2014. Predicting Long-term Impact of CQA Posts: A Comprehensive Viewpoint. In Proc. of KDD.
- [42] Ken Yeung. 2016. Quora now has 100 million monthly visitors, up from 80 million in January. VentureBeat. (March 2016).
- [43] Jie Yu, Zhenhui Jiang, and Hock Chuan Chan. 2007. Knowledge Contribution in Problem Solving Virtual Communities: The Mediating Role of Individual Motivations. In Proc. of SIGMIS CPR.
- [44] Haiyi Zhu, Sauvik Das, Yiqun Cao, Shuang Yu, Aniket Kittur, and Robert Kraut. 2016. A Market in Your Social Network: The Effects of Extrinsic Rewards on Friendsourcing and Relationships. In Proc. of CHI.