Magnetic field induced polarization enhancement in monolayers of tungsten dichalcogenides: Effects of temperature
Abstract
Optical orientation of localized/bound excitons is shown to be effectively enhanced by the application of magnetic fields as low as 20 mT in monolayer WS2. At low temperatures, the evolution of the polarization degree of different emission lines of monolayer WS2 with increasing magnetic fields is analyzed and compared to similar results obtained on a WSe2 monolayer. We study the temperature dependence of this effect up to K for both materials, focusing on the dynamics of the valley pseudospin relaxation. A rate equation model is used to analyze our data and from the analysis of the width of the polarization deep in magnetic field we conclude that the competition between the dark exciton pseudospin relaxation and the decay of the dark exciton population into the localized states are rather different in these two materials which are representative of the two extreme cases for the ratio of relaxation rate and depolarization rate.
-
February 2017
1 Introduction
The successful isolation of graphene[1] followed by over a decade of its intense study has triggered the development of a vast area of research on a variety of two-dimensional (2D) crystals, whose properties substantially differ from those of their bulk counterparts [2, 3, 4]. Among these materials particularly much attention is currently attracted by semiconducting transitional metal dichalcogenides (s-TMDs) which exhibit robust optical properties. The research on these materials is driven by both scientific curiosity and a prospect of 2D optoelectronic applications.
One of the most intriguing properties of atomically-thin s-TMDs is the possibility of accessing the valley degree of freedom using circularly polarized light [5, 6, 7, 8]. The simplicity of this approach paved the way to study and parameters of the valley degree of freedom, i.e., the inter-valley relaxation [9] and valley coherence [10]. Such experiments are typically carried out at cryogenic temperatures, which allows one to minimize the influence of thermal effects obscuring the investigated phenomena.
On the other hand, the bulk of application-oriented studies on s-TMD monolayers is carried out at room temperature. Due to extremely high exciton binding energy (of hundreds of meV [11, 12]) and short radiative lifetime (in the range of picoseconds [13]), the optical properties of s-TMD monolayers remain robust under such conditions, as evidenced by efficient room-temperature photoluminescence (PL) [14]. A disparity between these two regimes immediately raises a question about the changes in the intermediate temperature range, which is of particular interest, since even as basic quantity as the PL intensity exhibits a non-monotonic dependence on temperature [15].
In this letter we present a study of temperature dependence of the magnetic-field-induced polarization enhancement (FIPE) of the optical orientation of localized excitons (LEs) in WS2 and WSe2 monolayers. Earlier investigations [16] established a link between the occurence of the FIPE for monolayer WSe2 and the inter-valley relaxation of dark excitons, which could precede the localized excitons in the relaxation path (see Fig. 1). The key element in the proposed model was the process of inter-valley relaxation of the dark excitons, which could be effectively suppressed by the magnetic field. Regardless of its rate, the inter-valley relaxation is stopped by localization of the dark excitons (conversion to the population of localized excitons). Thus, the analysis of the polarization degree of the subsequent localized exciton recombination shed some light on the nature of inter-valley relaxation of dark excitons, which is much more elusive than the analogous relaxation of bright excitons [17].
2 Methods
The experiments described in this paper were performed on 2 sets of samples: monolayers of WS2 and WSe2. In each case the monolayer flakes were obtained by mechanical exfoliation of bulk crystals involving the use of a chemically clean back grinding tape and a polydimethylsiloxane stamp. The exfoliated flakes were non-deterministically transferred onto Si substrates covered with either 90 nm thick (WSe2) or 300 nm thick (WS2) layer of thermally grown SiO2. Prior to that step the substrates were ashed with oxygen plasma to rid their top surfaces of possible organic contaminants. The monolayers of interest were first identified by their distinctive optical contrast and then double checked with photoluminescence and Raman scattering measurements.
Our optical investigations were based on photoluminescence spectroscopy. The samples were excited using either 561 nm or 647 nm continuous-wave diode lasers. The emitted light was analyzed using a 0.5 m spectrometer equipped with a CCD camera. The polarization state of the light was controlled by means of a combination of Glan-Taylor polarizers and achromatic waveplates incorporated in the excitation as well as in the detection path.
During the experiments, the samples were placed in a variable temperature insert (VTI) of a helium cryostat mounted inside a superconducting magnet. All measurements were carried out in the Faraday geometry.
3 Results
3.1 Field-dependent optical orientation in WS2 monolayer
So far the FIPE effect has been only observed in WSe2 monolayers [16]. In the reported experiments a rather weak magnetic field of mT was shown to significantly enhance the efficiency of the optical orientation, , of the localized excitons, leading to a dip-like feature in the dependence at . This observation was interpreted as related to the field-dependent inter-valley relaxation of the dark excitons. The fact that the energetically lowest excitonic state is optically dark in WSe2 monolayers [18, 19, 20] has been a crucial point in the interpretation of the observation of the FIPE. Monolayer WS2 is another system with an optically inactive exciton ground state, and as such might be expected to exhibit the FIPE too.
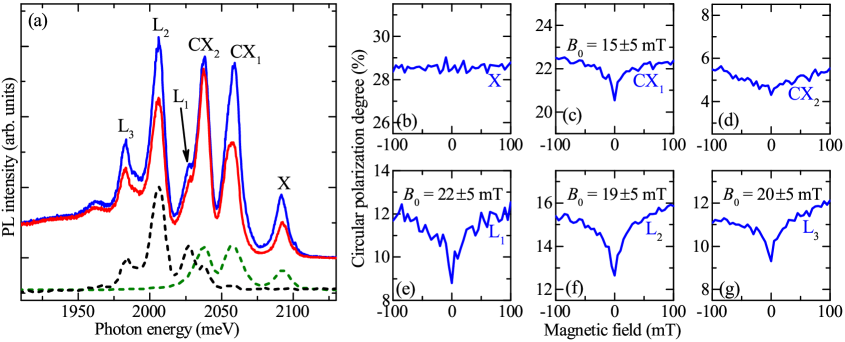
Figure 2 presents the effect of optical orientation of excitons in a WS2 monolayer at low temperature ( K). The optical orientation manifests itself as a difference between the PL spectra measured in two circular polarizations upon circularly polarized excitation, as seen in Fig. 2(a). Such a difference is observed with different strength for various emission lines, which correspond to the recombination processes involving either free or localized excitons. Both kinds of excitons can be distinguished on the basis of their lifetime, as free excitons decay in single picoseconds while localized excitons can live for up to a few nanoseconds [16, 21]. In our case, the according time-resolved data were obtained in an auxiliary experiment using a streak camera and pulsed excitation of the PL, which allowed us to obtain reference time-gated spectra plotted with green and black dashed lines in Fig. 2(a). The signal drawn with a black curve was integrated in a window from 200 ps to 1050 ps after the laser pulse, i.e., in the time range after the recombination of free excitons when only the localized excitons contributed to the spectrum. Using this method we unequivocally determined that the lines denoted in Fig. 2(a) by X and CX1 are related the the free excitons (neutral and charged, respectively). Due to its intermediate lifetime, the line CX2 cannot be easily classified as arising from either free or localized excitons. Based on the results of reflectivity experiments on similar samples[22], we tentatively ascribe it to another type of a charged exciton. Still, in the following analysis for the WS2 monolayer we will limit ourselves to the three lowest-energy lines (L1-L3) in the spectrum, which can be unambiguously attributed to the localized excitons.
Similarly to the approach used for monolayer WSe2 [16], we have repeated the measurements of optical orientation for various magnetic fields, with the results shown in Fig. 2(b-f). As expected, each of the lines recognized as originating from the localized states exhibits the effect of robust FIPE, i.e., a significant variation of the optical orientation efficiency at a rather weak magnetic field of 20–22 mT. Upon application of the magnetic field the optically-induced polarization is clearly enhanced, which may be interpreted as a signature of the slowdown of inter-valley relaxation in the dark exciton population[16].
Interestingly, the FIPE is also observed for the line denoted in Fig. 2(a) as CX1, most probably related to the free charged excitons [23, 24]. In its present form, our model does not automatically account for this effect, which requires a special treatment, e.g., the assumption that dark excitons contribute at least partially to the formation of the trions. A verification of this assumption would necessitate precise polarization- and time-resolved measurements on gated structures, which remain beyond the scope of this work.
A separate issue is the relative amplitude of the FIPE (Fig. 2(d-f)). Depending on the particular localized exciton line, the amplitude of this effect in WS2 monolayer is equal to about 2 percentage points. It is significantly weaker than the effect observed for monolayer WSe2, which is about 25 percentage points [16]. Such a disparity cannot be explained by differences in the overall optical orientation efficiency, which was quite similar under our experimental conditions (% for monolayer WS2 and % for monolayer WSe2 at mT, respectively). We can speculate that the discussed disparity reflects a different interplay between the exciton localization time and the rate of inter-valley relaxation of the itinerant excitons. In particular, already at the localization time in a WS2 monolayer might be short compared to the inter-valley relaxation time. Under such conditions, an additional extension of the relaxation time by the magnetic field would have a limited effect, as in the case of the experiment. This conjecture will be revisited when discussing the temperature dependence of the width of the dip in the field dependence of the orientation efficiency.
3.2 Temperature dependence
Having established that monolayer WS2 also exhibits the FIPE effect similar to that displayed by monolayer WSe2, we repeated measurements for both systems at different bath temperatures. An overview of the observed changes is presented in Fig. 3. In both materials the increase in temperature leads to a systematic reduction of the PL intensity of the LE lines, which is interpreted in terms of thermal activation (de-localization) of the LEs [25]. This quenching effect limits the range of experimentally feasible temperatures to about 60 K, particularly for monolayer WSe2. Within this limit we were able to accurately determine the efficiency of optical orientation of the LE and to study its field dependence.
As shown in Fig. 3(b) and 3(d), the characteristic dip in is present also at elevated temperatures. Still, its amplitude is gradually reduced upon increasing the temperature. We note that at the same time the overall optical orientation efficiency (defined by the level at mT) also decreases. Yet, the disappearance of the dip is more rapid. We visualize it in Fig. 4, which presents the temperature dependence of the relative amplitude of the dip, i.e., the amplitude of the dip divided by the orientation efficiency at mT. The quenching of the dip amplitude is similar in both analyzed materials. Notably, the reduction of the dip to half of its initial relative amplitude occurs at comparable temperature (about 25 K for monolayer WSe2 vs. 20 K for monolayer WS2).
The main complication associated with an analysis of the FIPE amplitude is a possible opening of other relaxation channels for the dark excitons when increasing the temperature. Much more reliable is the second characteristic of the dip observed in the optical orientation efficiency, namely its width. Temperature dependence of the extracted width (half width at half maximum, HWHM) is plotted in Fig. 5(a,b) and evidences a qualitatively different behavior of WSe2 and WS2 monolayers. Within the experimental accuracy the latter system exhibits a constant width of the dip in the dependence, while for WSe2 the dip becomes clearly broader upon increasing the temperature. This observation can be confirmed directly by comparing the magnetic field dependence of the optical orientation efficiency at low (6.5 K) and elevated (30 K) temperature, which is shown in Fig. 5(c,d).
Our interpretation of the observed behavior is related to the temperature variation of the underlying relaxation processes. In general, the width of the dip in the optical orientation efficiency reflects the magnetic field which slows down the inter-valley relaxation of the dark excitons to the time scales of the competing localization process. Both of these rates depend on temperature, but in the studied range we expect a significant variation of the inter-valley relaxation rate. This expectation is based on the fact that the exchange interaction behind the inter-valley relaxation scales as the square of the wave vector, [26], and is therefore proportional to the temperature of the excitons. If the rate of the localization process is less dependent on the temperature (e.g., because of low phonon population in the relevant temperature range) then the width of the dip should increase accordingly, as higher and higher magnetic field is required to counteract the increase in the inter-valley relaxation rate.
The scenario described above is fully consistent with the data obtained for monolayer WSe2 (Fig. 5(a)), but does not agree with the results for monolayer WS2 (Fig. 5(b)), despite that a similar temperature dependence of the dark exciton inter-valley relaxation rate is expected in both cases. A possible explanation of this inconsistency is different relation between the rates of the discussed processes. If the localization rate outpaces the inter-valley relaxation rate even at then the width of the dip will not correspond to slowing down of the latter one to the value of the former one. Instead, the width of the dip would correspond to the magnetic field which reduces the inter-valley relaxation to a given fraction (say, by factor of 2 at HWHM), independent of the threshold value of the localization rate.
The presented reasoning can be illustrated in a simple way with the following equations. In the model sketched in Fig. 1 the valley polarization degree of the localized exciton varies with time as
| (1) |
However, the quantity relevant for the experiment is the final (i.e., after the localization but before the recombination) polarization degree of the localized excitons, which can be obtained by integrating separately each of the dark exciton populations with a decay rate . In that way we obtain the expected degree of polarization of the photoluminescence:
| (2) |
Assuming that is the only variable parameter, we can derive the relation between its value at HWHM of the dip and at :
| (3) | ||||
| (4) |
and therefore:
| (5) |
Eq. 5 clearly shows the two regimes. If (case more suitable for monolayer WSe2) then . The magnetic field needed to supress growing to the threshold of is larger and larger, hence the increasing dependence in Fig. 5(a). Conversely, if (case applicable to monolayer WS2) then . Standard mechanisms of Dyakonov-Perel type predict that , where the shape function is not related to the value itself. In such a case, the magnetic field required to reduce to the half of its initial value is constant (independent of ), which explains the behavior illustrated in Fig. 5(b).
In our considerations we neglected a number of additional effects, such as the influence of other relaxation pathways (e.g., including the bright excitons) or temperature dependence of the localization or de-localization rate. Similarly, our working assumptions of or should be regarded as serving illustrative purposes only, since the actual difference between these rates might be less pronounced. Still, on the qualitative level our model satisfactorily explains the experimental data suggesting that the decay of the dark exciton population is more rapid in monolayer WS2 than in monolayer WSe2.
4 Summary
In summary, we have shown that the application of a small magnetic field significantly enhances the efficiency of optical orientation not only in WSe2 but also in WS2 monolayers. Thus, we confirm our original hypothesis that the B-enhanced optical orientation is characteristic of s-TMD monolayers in which the energetically lowest excitonic state is dark (optically inactive in the first approximation). The amplitude of this enhancement is observed to be suppressed by temperature for both WSe2 and WS2 monolayers. In particular, the B-enhanced optical orientation becomes hardly detectable at temperatures above 50K. The characteristic range of magnetic fields where the enhancement is observed is however found to expand with temperature in monolayer WSe2 whereas is independent of temperature in monolayer WS2. This distinct behavior is interpreted in terms of different regimes for the respective rates for intervalley relaxation and decay of dark excitons. We anticipate that the intervalley relaxation of dark excitons is fast as compared to their decay in monolayer WSe2 while the opposite relation holds for monolayer WS2. Our observation undoubtedly requires further investigation that will provide it with not only phenomenological but also theoretical explanation.
References
References
- [1] Novoselov K S, Geim A K, Morozov S V, Jiang D, Zhang Y, Dubonos S V, Grigorieva I V and Firsov A A 2004 Science 306 666–669
- [2] Osada M and Sasaki T 2012 Advanced Materials 24 210–228
- [3] Xu M, Liang T, Shi M and Chen H 2013 Chemical Reviews 113 3766–3798
- [4] Mas-Balleste R, Gomez-Navarro C, Gomez-Herrero J and Zamora F 2011 Nanoscale 3(1) 20–30
- [5] Xiao D, Liu G B, Feng W, Xu X and Yao W 2012 Phys. Rev. Lett. 108(19) 196802
- [6] Cao T, Wang G, Han W, Ye H, Zhu C, Shi J, Niu Q, Tan P, Wang E, Liu B and Feng J 2012 Nat. Commun. 3 887
- [7] Zeng H, Dai J, Yao W, Xiao D and Cui X 2012 Nat. Nanotechnol. 7 490
- [8] Mak K F, He K, Shan J and Heinz T F 2012 Nat. Nanotechnol. 7 494
- [9] Yang L, Sinitsyn N, Chen W, Yuan J, Zhang J, Lou J and Crooker S 2015 Nat. Phys. 11 830
- [10] Jones A M, Yu H, Ghimire N J, Wu S, Aivazian G, Ross J S, Zhao B, Yan J, Mandrus D G, Xiao D, Yao W and Xu X 2013 Nat. Nanotechnol. 8 634–638
- [11] Hill H M, Rigosi A F, Roquelet C, Chernikov A, Berkelbach T C, Reichman D R, Hybertsen M S, Brus L E and Heinz T F 2015 Nano Letters 15 2992–2997
- [12] Ye Z, Cao T, O’Brien K, Zhu H, Yin X, Wang Y, Louie S G and Zhang X 2014 Nature 513 214
- [13] Lagarde D, Bouet L, Marie X, Zhu C R, Liu B L, Amand T, Tan P H and Urbaszek B 2014 Phys. Rev. Lett. 112 047401
- [14] Amani M, Lien D H, Kiriya D, Xiao J, Azcatl A, Noh J, Madhvapathy S R, Addou R, KC S, Dubey M, Cho K, Wallace R M, Lee S C, He J H, Ager J W, Zhang X, Yablonovitch E and Javey A 2015 Science 350 1065–1068
- [15] Lezama I G, Arora A, Ubaldini A, Barreteau C, Giannini E, Potemski M and Morpurgo A F 2015 Nano Letters 15 2336–2342
- [16] Smoleński T, Goryca M, Koperski M, Faugeras C, Kazimierczuk T, Bogucki A, Nogajewski K, Kossacki P and Potemski M 2016 Phys. Rev. X 6(2) 021024
- [17] Yu T and Wu M W 2014 Phys. Rev. B 89 205303
- [18] Kośmider K, González J W and Fernández-Rossier J 2013 Phys. Rev. B 88(24) 245436
- [19] Echeverry J P, Urbaszek B, Amand T, Marie X and Gerber I C 2016 Phys. Rev. B 93(12) 121107
- [20] Molas M R, Faugeras C, Slobodeniuk A O, Nogajewski K, Bartos M, Basko D M and Potemski M 2017 2D Materials 4 021003
- [21] Wang G, Bouet L, Lagarde D, Vidal M, Balocchi A, Amand T, Marie X and Urbaszek B 2014 Phys. Rev. B 90 075413
- [22] Jadczak J, Kutrowska-Girzycka J, Kapuscinski P, Debus J, Kudlacik D, Schmidt D, Huang Y S, Bayer M and Bryja L 2016 arXiv:1612.04122
- [23] Mak K F, He K, Lee C, Lee G H, Hone J, Heinz T F and Shan J 2013 Nat. Mater. 12 207–211
- [24] Plechinger G, Nagler P, Kraus J, Paradiso N, Strunk C, Schüller C and Korn T 2015 Phys. Status Solidi RRL 9 457–461
- [25] Godde T, Schmidt D, Schmutzler J, Aßmann M, Debus J, Withers F, Alexeev E M, Del Pozo-Zamudio O, Skrypka O V, Novoselov K S, Bayer M and Tartakovskii A I 2016 Phys. Rev. B 94(16) 165301
- [26] Glazov M M, Ivchenko E L, Wang G, Amand T, Marie X, Urbaszek B and Liu B L 2015 Phys. Status Solidi b 252 2349–2362