Qualitative Action Recognition by Wireless Radio Signals in Human-Machine Systems
Abstract
Human-machine systems required a deep understanding of human behaviors. Most existing research on action recognition has focused on discriminating between different actions, however, the quality of executing an action has received little attention thus far. In this paper, we study the quality assessment of driving behaviors and present WiQ, a system to assess the quality of actions based on radio signals. This system includes three key components, a deep neural network based learning engine to extract the quality information from the changes of signal strength, a gradient based method to detect the signal boundary for an individual action, and an activity-based fusion policy to improve the recognition performance in a noisy environment. By using the quality information, WiQ can differentiate a triple body status with an accuracy of 97%, while for identification among 15 drivers, the average accuracy is 88%. Our results show that, via dedicated analysis of radio signals, a fine-grained action characterization can be achieved, which can facilitate a large variety of applications, such as smart driving assistants.
I INTRODUCTION
It is very important to understand fine-grained human behaviors for a human-machine system. The knowledge regarding human behaviors is fundamental for better planning of a Cyber-Physical System (CPS) [1, 2, 3]. For example, action monitoring has the potential to support a broad array of applications such as elder or child safety, augmented reality, and person identification. In addition, by observing the behaviors of a person, one can obtain important clues to his intentions. Automatic recognition of activities has emerged as a key research area in human-computer interaction [1, 4].
While state-of-the-art systems achieve reasonable performance for many action recognition tasks, research thus far mainly focused on recognizing “which” action is being performed. It can be more relevant for a specific application to recognize whether this task is being performed correctly or not. There are very limited studies on how to extract additional action characteristics, such as the quality or correctness of the execution of an action [5].
In this paper, we study the quality assessment of driving behaviors. A driving system is a typical human-machine system. With the rapid development of automatic driving technology, the driving process requires closer interactions between humans and automobiles (machine) and a careful investigation of the behaviors of the driver [6]. There are several potential applications for quality assessments of driving behaviors. The first application is driving assistance. According to the quality information, one can classify the driver as a novice or as experienced, and then, for the former, the assistance system can provide advices in complex traffic situation. The second potential application is risk control. It provides an important hint of fatigued driving if a driver repeatedly drives at a low quality level. Additionally, long-term driving quality information is meaningful for the car insurance industry.
We explore a technique for qualitative action recognition based on narrowband radio signals. Currently, fatigue detection systems generally rely on computer vision, on-body sensors or on-vehicle sensors to monitor the behaviors of drivers and detect the driver drowsiness [7]. In comparison, a radio-based recognition system is non-intrusive, easy to deploy, and can work well in NLOS (non-line-of-sight) scenarios. Additionally, for old used cars or low-configuration cars, it is much easier to install an radio-based system than a sensor-based system.
It is obvious that quality assessment is much more challenging than action recognition. Qualitative action characterization has thus far only been demonstrated in constrained settings, such as in sports or physical exercises [5, 8]. Even with high-resolution cameras and other dedicated sensors, for general activities, a deep understanding of the quality of action execution has not been reached.
There are several technical challenges for quality recognition by radio signals such as modeling the action quality, the method of signal fragments extraction, and how to mitigate the effect of noise and interference. We present WiQ, a radio-based system to assess the action quality by leveraging the changes of radio signal strength. There are three key components in this system:
-
•
Deep neural network-based learning: The quality of action is characterized by the relative variation (e.g., gradient) of the received signal strength (RSS). A framework based on the deep neural network is proposed to learn the quality from the gradient sequence of the signal strength.
-
•
Gradient-based boundary detection: As the signal strength can vary sharply at the start and end points of an action, a sudden gradient change is a strong indicator of the action boundary. A gradient-based method is proposed to extract the signal fragment for an individual action.
-
•
Activity-based fusion: Typically, a driving task is completed by a series of actions, referred to as activity. To mitigate the effect of surrounding noise, we take an activity as a whole, fusing the information from all of the actions to derive a sound observation of the action quality.
We build a proof-of-concept prototype of WiQ with the Universal Software Radio Peripheral (USRP) platform [9] and evaluate the performance with a driving emulator. To the best of our knowledge, this is the first study in which action quality assessment is performed by using wireless signals and a deep learning method. Our results show that, via dedicated analysis of radio signal features, a fine-grained action characterization can be achieved, which leads to a wide range of potential applications, such as smart driving assistants, smart physical exercise training, and healthcare monitoring.
The rest of this paper is organized as follows. Section II provides an overview of related works, and Section III describes the challenges and basic ideas of our work. Section IV discusses the design of WiQ. Section V presents the experimental results. Finally, we conclude this research in Section VI.
II RELATED WORK
Action recognition systems generally adopt various techniques such as computer vision [10], inertial sensors [11], ultrasonic [12], and infrared electromagnetic radiation. Recently, we have witnessed the emergence of technologies that can localize a user and track his activities based purely on radio reflections off the person’s body [13, 14, 15]. The research has pushed the limits of radiometric detection to a new level, including motion detection [16], gesture recognition [17], and localization [18]. By exploiting radio signals, one can detect, e.g., motions behind walls and the breathing of a person [19, 20, 21, 22], or even recognize multiple actions simultaneously [13].
In general, there are two major stages in a radio recognition system: feature extraction and classification. Thus far, various signal features have been proposed: energy [23], frequency [17, 12], temporal characteristics [13, 18], channel state information [24, 25, 19, 15], angle characteristics [16], etc. The RSS, as an energy feature, is easy to obtain and has been used widely in action recognition [23]. In comparison, channel state information (CSI) is a finer-grained feature that can capture human motions effectively [15, 25]. Doppler shift, as a frequency feature, has been used in gesture recognition [17]. Time of flight (TOF), as a temporal feature, is used in 3D localization [18]. Finally, angle of arrival (AOA) is used in direction inference and object imaging [26].
There are two major classification methods: 1) fingerprint-based mapping, which takes advantage of machine learning techniques to recognize actions [24, 19, 15, 25], and 2) geometric mapping, which extracts the distance, direction or other parameters to infer the locations or actions of interest [16, 18, 17].
While several works have explored how to recognize actions, only a few have addressed the problem of analyzing the action quality. In [8], a Programming by Demonstration (PbD) method is used to study the action quality in weight lifting exercises through Kinect and Razor inertial measurement units. The sensors in a smart phone are utilized to monitor the quality of exercises on a balance board [27]. Similarly, Wii Fit uses a special balance board to analyze yoga, strength and balance exercises. In addition, driving behavior analysis systems generally rely on computer vision to detect eyelid or head movement, on-body sensors to monitor brain waves or heart rate, or pre-installed instruments to detect steering wheel movements. Biobehavioral characteristics are used to infer a driver’s habits or vigilance level [7, 28, 6]. While promising, these techniques suffer from limitations, such as physical contact with drivers (e.g., attaching electrodes), high instrumentation overhead, sensitivity to lighting or the requirement of line-of-sight communication (i.e., a driver wearing eye glasses can pose a serious problem for eye characteristic detection). Different from the existing studies, we focus on assessing the action quality based on radio signals.
III BASIC IDEA
In this section, we first state the quality recognition problem and then the design challenges. Afterwards, we discuss the basic idea for characterizing the quality of actions.
III-A Problem statement
It is critical to understand driving habits for many applications such as driver assistance. We consider two representative tasks: (1) driver identification to determine which driver from a set of candidates performs a driving action; and (2) body status recognition to infer the driver’s vigilance level. When a person is inattentive or fatigued, driving actions will be performed in a different manner. That is, the quality of driving actions is changed. It is therefore feasible to monitor the body status by measuring the quality of driving actions.
A careful analysis of the action is required to capture the unique feature of driving. As the driving action is generic, it is insufficient to distinguish the driver or his status by identifying actions alone. In fact, different drivers have different driving styles, e.g., an experienced driver can stop a car smoothly, while a novice may be forced to employ sudden braking.
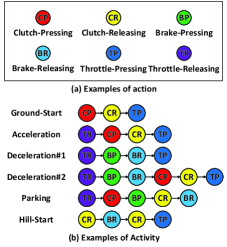
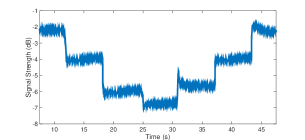
In this study, the motions of a driver’s foot on the pedal are tracked. Fig. 1(a) shows six types of actions for manual car driving. Here, an action refers to a short motion that cannot be partitioned further, i.e., a press or release of the pedal (e.g., clutch, brake and throttle). Moreover, an activity is defined as a series of actions to complete a driving task. As shown in Fig. 1(b), several typical activities are included: ground-start, parking, hill-start, acceleration and deceleration.
To capture the driving behaviors by radio signals, the transmitter and receiver nodes are located on the two sides of the pedals. The receiver reports the received signal strength (RSS) per sampling point. More details about the experimental setup are described in Section V.
III-B Challenges
There are several technical challenges posed by quality recognition based on narrowband radio signals.
Quality modeling: Currently, there is no common understanding regarding what defines the quality of an action. It is argued that, if one can specify how to perform an action, quality can be defined as the adherence of the execution of an action to its specification [5, 8]. To measure quality, it is therefore necessary to characterize the execution of an action through a finer-grained motion analysis. For example, consider the braking (BP) action in three driving behaviors, e.g., sudden braking, parking, and slight deceleration. As shown in Table I, though the action is the same, the quality is quite different: (1) the movement of the brake in the first case is much faster than the others; and (2) the movement distance of the brake in the last case is smaller than the others.
| Quality | Sudden braking | Parking | Slight deceleration |
|---|---|---|---|
| Speed | fast | regular | regular |
| Range | large | large | small |
There is currently no effective way to characterize the execution of an action. Though many radio signal features are proposed for action recognition, most of them are used to recognize what types of actions are carried out.
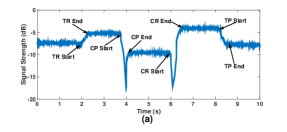
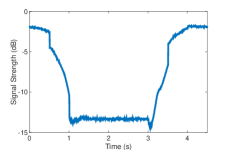
Signal fragment extraction: As the radio signal is sampled continuously over time, when multiple actions occur sequentially, we need to partition the signal into several fragments, i.e., one fragment for one action. As an example, Fig. 2(a) shows the signal for the acceleration activity. To accelerate with a gear shift, one should release the throttle (TR), press the clutch (CP) and change the gear (which is invisible here), release the clutch (CR) and press the throttle (TP) until a desired speed is reached. To analyze the quality, the start and end points of all the actions must be identified accurately.
There is no feasible solution to detect the signal boundary. In [17], a gradient-based method is used to partition a Doppler shift sequence. The Doppler shift information is, however, not available in the most modern systems such as in wireless local-area networks (WLANs). A method was recently proposed in WiGest [1] to insert a special preamble to separate different actions, which require interrupting the usual signal processing routine. Neither can be adopted in our scenarios.
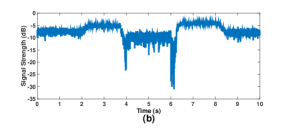
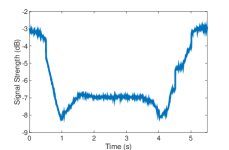
Robustness: Quality assessment can be easily misled by noise or interference in the radio channel. As shown in Fig. 2(b), when the signal to noise ratio (SNR) is low, it is difficult to identify the action and extract the quality information. Although a denoising method can be used to reduce the effect of noise or interference, it is necessary to have an effective way to sense the radio channel condition and mitigate any negative effect on quality assessment.
III-C Quality recognition
We characterize the quality of action with respect to motion and we consider the duration of an execution and the speed and distance of the pedal motion. We first discuss the case of the throttle and then extend our discussion to the clutch and brake.
The duration of an execution can be estimated after the signal boundary of the action is detected. Let be the number of sampling points in the fragment, an estimate of the duration is , where is the length of the sampling interval.
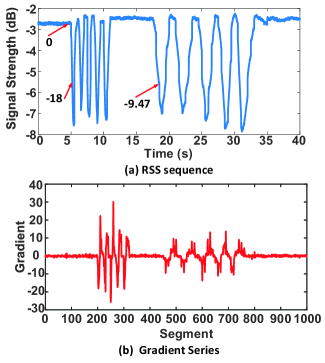
The movement speed can be captured by the change rate (e.g., gradient) of signal strength. Fig. 3(a) shows the received signal in the experiment: the throttle is pressed and released quickly five times and then slowly another five times. When the motion is faster, the change of signal strength is sharper (e.g., the typical gradients are -18 and -9.47 for the two cases, respectively). The gradient sequence of signal strength is plotted in Fig. 3(b). The gradient magnitude is, on average, much larger for a quicker motion. Thus, thee gradient of signal strength is an effective metric to characterize the movement speed.
The correlation between the pedal position and the signal strength is exploited to estimate the motion distance. We press the throttle (TP) to a small extent and hold for several seconds; then press it to a large extent and hold for several seconds and finally press it to the maximum degree. The same pattern is repeated for the throttle-releasing (TR) in the opposite order. The received signal strength is shown in Fig. 4. The signal strength is distinct when the pedal position is different. To infer the motion distance during the action execution, a simple method is to compute the difference between the signal strengths at the start and end points.
For the clutch and brake, it is slightly more complex. As shown in Fig. 5, when the clutch is pressed, the signal strength first decreases and then increases. The change is no longer monotonic, which is different from the throttle. A similar observation can be drawn for the brake. To estimate the motion distance, we detect the maximal (or minimal) point during the execution of an action. If one such point is found, letting be the signal strength, the motion distance can be characterized by the oscillation range of signal strength, i.e., , where and are the signal strength at two boundary points, respectively.
As shown in Fig. 5, different patterns of signal strength can be observed for distinct actions, e.g., the signal strength decreases consistently during brake-pressing (BP) and always increases during brake-releasing (BR). One can exploit the patterns to discriminate among different actions.
IV DESIGN OF WIQ
We first overview the basic procedure of WiQ and then discuss in detail the three key components, e.g., the learning engine, signal boundary detection, and decision fusion. We finally discuss some possible extensions of WiQ.
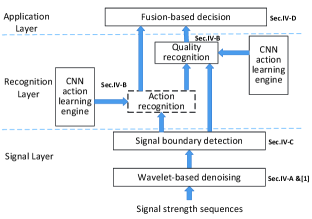
IV-A Overview
WiQ first detects the signal boundary for each action, and then recognizes the driving action and extracts the motion quality, and finally identifies the driver or body status.
Fig. 6 shows the basic process of WiQ. There are three layers, i.e., signal, recognition and application. The inputs to the signal layer are the radio signals that capture the driving behaviors. Due to the complex wireless propagation and interaction with surrounding objects, the input values are noisy. We leverage a wavelet-based denoising method to mitigate the effect of the noise or interference. We here omit the details of the method, which is given in [1]. Afterwards, a signal boundary detection algorithm is applied to extract the signal fragment corresponding to the individual action.
The input of the recognition layer is the fragmented signal for an action. We first adopt a deep learning method to recognize the action. Afterwards, the quality of the action is extracted by a deep learning engine and provided to the upper layer, together with the results of action recognition.
At the application layer, a classification decision is made. For driver identification, the classification process determines which driver performs the action. For body status recognition, the process determines the driver’s status according to the action quality. Additionally, a fusion policy is adopted to improve the robustness and accuracy.
IV-B Quality recognition
There are two major stages in quality recognition: feature extraction and classification (based on the quality of an action). In the first stage, we adopt a convolutional neural networks (CNN). In addition, a normalized multilayer perceptron (NMLP) is used for classification. Both CNN and NMLP are supervised machine learning technique [10].
CNN is a representative deep learning method that uses the multilayer neural networks to extract interesting features. Deep learning, as an effective method of machine learning, has achieved great success in image recognition, speech recognition and many other areas [10]. It has been used widely due to its low dependence on prior-knowledge, small number of parameters and a high training efficiency.
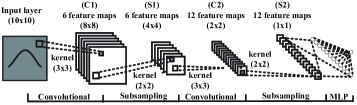
To recognize the quality of action, a five-layer CNN network has been built and the structure is shown in Fig. 7. Basically, there are two convolutional layers, two sub-sampling layers and one fully-connected layer. In the first convolutional layer, the size of a convolutional kernel is . Six different kernels are adopted to generate six feature maps. At the second convolutional layer, there are two kernels and the kernel size is still . There are, in total, 12 feature maps as the output of this layer. The goal of a convolutional layer is to extract as many features as possible in an effective manner. In comparison, a sub-sampling layer is devoted to combining the lower-layer features and reducing the data size. There is only one kernel in the sub-sampling layer and the size is . The last layer of CNN is a fully-connected layer that combines all the learned features. The output of the CNN network is a vector of twelve dimensions, which is the input of the NMLP classifier.
| Category | Feature | Category | Feature |
|---|---|---|---|
| Time duration | Range | ||
| Gradient | |||
| Feature | Definition | Feature | Definition |
|---|---|---|---|
| Average | Kurtosis | ||
| Range | IQR | ||
| MAD | Sum | ||
| Variance | RMS | ||
| 3rd C-Moment | Skewness |
Suppose there are quality classes in the classification. A quality class can be a driver for driver identification or a body status for body status recognition. Also, is the number of drivers or body statuses. For a sample (i.e., a 12-dimension vector), the NMLP computes an -dimension normalized vector , where and is the probability that the sample belongs to the th class. In general, the th class is preferred when for all . We use the NMLP to report the intermediate results such as , which plays an important role in the fusion process.
Input of CNN: The quality of actions can be characterized in terms of the duration time and the speed and distance of movement. We partition a signal fragment into ten segments and extract the quality information from the three aspects. For each segment, rather than the original gradient, a ten-dimension quality vector is generated. Table II summarizes the quality vector, where denote the gradient sequence, the number of sampling points, the gradient at the start point, and that at the end point. In total, the input of CNN is a matrix (or a 100-dimension vector).
Action recognition: We should first recognize the action. The process is quite similar except for the input feature vector and the number of classes, which are equal to that of all actions. To generate the input vector, similarly, a fragment is divided into ten segments and, for each segment, ten statistical features are extracted. Table III shows the definitions of features, where denote the signal strength at the th sampling point, the average strength, and the number of sampling points.
Feature selection: Currently, there is no established theory to characterize the effect of different features or parameter choices on the action/quality recognition performance. It is of great significance to address such a fundamental problem. At this time, however, we have to choose the features according to the results presented in previous work and the characteristics of the concerned application.
First, to choose the features in Table III for action recognition, we consider the series work of Stephan Sigg et al as a reference [23, 29, 30]. These authors propose more than ten features of RSSI, such as the mean and variance, and investigate the discriminative capability of the features for action recognition. One of the findings is that, the effectiveness of features is tightly correlated with the signal propagation environment, and an adaptive policy is required in feature selection to achieve good performance.
Second, as shown before, the quality of actions is mainly captured by the gradient of signal strength variance. For example, when an action occurs suddenly and rapidly, the received signal strength should change sharply, resulting in a large gradient change. Therefore, we first obtain the gradient information at each moment, and then get the typical “atomic” statistics such as the mean, variance, and variation range of the gradient, as shown in Table II.
For both quality recognition and action recognition, to avoid feature selection by hand and achieve high classification accuracy, we adopt a deep learning framework to automatically fuse the features by multi-layer nonlinear processing.
IV-C Gradient-based signal boundary detection
As the radio signal is sampled continuously, when multiple actions occur sequentially, the start and end points of each action must be located accurately. The signal is separated into many fragments, and each fragment corresponds to one action. As shown in Fig. 1(b), there are usually three or more actions in an activity to complete a driving task. To analyze the quality, it is necessary to detect the signal boundary for each individual action.
We propose to detect the signal boundary based on the gradient changes of signal strength. As the signal strength begins to change at the start point and becomes stable after the end of an action, it is expected that the gradient could change sharply at the boundary points. This is true for the actions related to the throttle (see Fig. 3). For the actions related to the clutch or the brake, there is another peak point in the received signal sequence in addition to the boundary points. As a result, a turning point can be detected by a sharp change in the gradient during the execution of the action. Nevertheless, around the turning point, the gradient always deviates from 0. In comparison, the gradient before the start point or after the end point is close to 0.
The gradient-based boundary detection method is shown in Algorithm 1. Basically, a sampling point is regarded as the start of an action when (1) the average gradient before the point approaches 0 and (2) the average gradient after the point significantly deviates from 0. Alternately, a point is regarded as the end of an action when (1) the average gradient after the point approaches 0 and (2) the average gradient before the point significantly deviates from 0.
An optimization framework is established to prune the redundant points. The objection is to find the optimal number (e.g., ) of fragments and the intended sequence of fragments to satisfy
| (1) |
where for the th fragment, the recognized action is with probability . The advantage of (1) is that it is simple, nonparametric and low in complexity. By incorporating more constraints, such as the duration length, a more complex model can be established, which can achieve higher precision.
Parameter setting: The idea of the proposed policy to detect the boundary is inspired by previous study on wireless communication [31]. Unfortunately, the method does not have a theoretical analysis though it has been used widely. There are four parameters, two sliding parameters (i.e., L and Step) and two threshold parameters (i.e., and ). In experiment, we empirically set L = 5, Step = 2, = 5 and = 0.5. Particularly, when the SNR is low, we set = 0.8.
Taking as an example, we find that, even when there is no action, the received signal strength varies consistently and the range of variation (i.e., ratio of the maximum signal strength and the minimum one) can be as large as three. A similar conclusion was drawn in previous work [32]. Therefore, we set the threshold () to five to achieve a good tradeoff between robustness and sensitivity. We also explore an adaptive policy to set the threshold. To determine the threshold used at time t, we track the signal strength for a long time interval (approximately 1-2s) before time t. We compute the ratio of the signal strength at each sampling point to the minimum one during the interval and choose x as the threshold, where at least 90% of the ratios are equal to or less than x. The process is stopped when a start point is found and re-started when an ending point is detected. With the adaptive policy, the classification accuracy is close to the fixed setting used in our experiment. We plan to investigate adaptive policy improvements in the future. The processes to determine the other parameters are similar.
IV-D Activity-based fusion
Identification of the driver or body status based on a single action is vulnerable to noise or interference. To improve the accuracy of quality recognition, WiQ adopts a fusion policy. In general, multiple sensors or multiple classifiers are shown to increase the recognition performance [33].
We propose an activity-based fusion policy to exploit the temporal diversity. The activity is chosen as the fusion unit for three reasons. First, as all the actions in an activity are devoted to the same driving task, the driving style should be stable. Second, as the duration is not very long, it is expected that the wireless channel does not vary drastically. Finally, as there are at least three or more actions in an activity, it is sufficient to make a reliable decision based on all of them together.
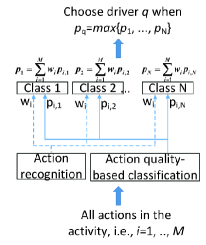
A weighted majority voting rule is adopted. There are many available fusion rules, such as summation, majority voting, Borda count and Bayesian fusion. Fig. 8 shows the basic process of the fusion policy. Let denote all the quality classes (e.g., drivers or body statuses) and all the actions. Consider an activity with actions denoted by . Without loss of generality, suppose for each , the action is classified as with a probability of . The role of is to capture the effect of the channel condition (i.e., the better the channel is, the higher is). In addition, letting denote the probability that the quality class of is and be the probability that the quality class of the activity is , we have
| (2) |
Finally, is preferred as the quality class of the activity when .
IV-E Discussions
We now discuss some practical issues and possible extensions of WiQ.
Efficiency: Computational efficiency is known as one of the major limitations of deep learning. As there is usually a large number of parameters, the speed of a deep learning network is slow. Thanks to the small network size, the efficiency of WiQ is very high, e.g., only several microseconds are required to process the signals of an activity.
Structure of activity: In practice, the driving actions are not completely random and instead usually follow a special order to complete a driving task. It is expected that better performance will be achieved for action recognition or signal boundary detection if the structure of the activity is exploited.
Online learning: Currently, only after an entire driving activity is completed can the signals be extracted for analysis. To work online, there are several challenges such as noise reduction, in-time boundary detection and exploitation of the history information to facilitate the real-time quality recognition.
Information fusion: The fusion policy explored combines several intermediate classification results into a single decision. Rather than combination, a boosting method can be adopted to train a better single classifier gradually. Moreover, the performance can be improved further by using numerous custom classifiers dedicated to specific activity subsets.
V PERFORMANCE EVALUATION
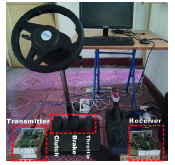
We evaluate the performance by measurements in a testbed with a driving emulator. Fig. 9 shows the experimental environment. The driving emulator includes three pedals: the clutch, brake and throttle. We use a software radio, the Universal Software Radio Peripheral (USRP) N210 [9], as the transmitter and receiver nodes. The signal is transmitted uninterruptedly at 800MHz with 1Mbps data rate. The sampling rate is 200 samples per second at the receiver.
The drivers are asked to perform all six activities shown in Fig. 1. The strategy is that (1) each driver repeats every activity 200 times regardless of the traffic conditions and (2) a driver drives on a given road (urban or high-speed road). If the number of activity execution is less than 200, the experiment is repeated until the number reaches 200 on the same road. The first strategy is adopted for the results presented in Section V (A)-(C) and the second is adopted for Section V-(D). For each action, there are approximately 400 samples. According to the average SNR, all the samples are equally divided into two categories, i.g., high-SNR (8-11 dB) and low-SNR (4-8 dB). The average SNR difference of the two categories is approximately 3.8dB.
The platform we used is a PC desktop with an 8-core Intel Core i7 CPU running at 2.4GHz and 8GB of memory. We do not use GPU to run the experiment. Unless otherwise specified, each data point is obtained by averaging the results from 10 runs.
V-A Action recognition
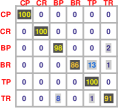
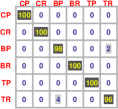
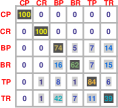
For each dataset in the high-SNR category, we choose 100 samples randomly for training and the remaining for test. Fig. 12 and Fig. 12 show the results of recognition accuracy. For example, the value (i.e., 13%) at position (4, 5) is the (error) probability that BR is recognized as TP. The recognition accuracy is shown by the diagonal of the matrix. When the training number of the CNN network is 10, the accuracy is at least 86% and on average 95%. With more training (e.g., 100 times), the performance becomes much better, i.e., the average accuracy approaches 98%. Nevertheless, the impact of noise or interference is severe on the performance of action recognition. As shown in Fig. 12, for the low-SNR category, the accuracy is as low as 39% and on average 65%.
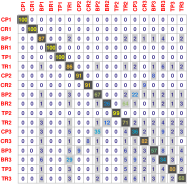
More experiments are conducted with three drivers. Together with the six actions, we have a total of 18 classes. For each class, from the high-SNR samples, we randomly select 100 of them for training and the remaining for test. Fig. 13 shows the results when the training number is 1000. As the number of class is much larger, the accuracy decreases drastically, which can be as low as 26% and approximately 60% on average.
At the same time, there is a large number of cross-driver errors, i.e., the action of a driver is recognized as that of the other one. For example, the error probability between CP3 and BP2 is 35% (CP3 to BP2) and 22% (BP2 to CP3). As a result, there would be much more mistakes if we try to identify the driver based on the action alone.
V-B Capability of quality recognition
We now investigate the capability of the quality recognition in an intuitive manner. For simplicity, we consider two dimensions of the quality, i.e., average gradient and duration.
First, we investigate the ability to distinguish the drivers. Fig. 14 (a) shows the quality distribution for clutch-pressing with different drivers. The points can be clustered into two categories. Meanwhile, the difference between different clusters is quite significant. That is, the driving style is stable for the same person but distinct for different drivers.
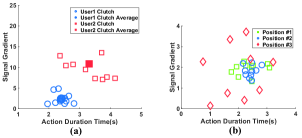
Second, the sensitivity to the receiver position is investigated. Fig. 14 (b) shows the quality distribution for CP with three receiver positions. Similarly, the points can be categorized into three groups, indicating the dependence of the quality on the receiver position. In wireless communications, even when the receiver position is changed slightly, the signal propagation characteristics can vary drastically. In practice, when the node position is changed, the convolutional neural network should be re-trained. In the following, the experiments are performed with the same receiver position, i.e., the position #1 in Fig. 14 (b).
V-C Application with quality recognition
We investigate the performance of qualitative action recognition. The training number of CNN is 100 by default.
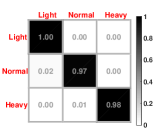
Consider body status recognition first. As it is not easy to carry out experiments to detect the fatigue status, our focus turns to the detection of attention. WiQ tries to distinguish the three body statuses: (1) normal, the normal state; (2) light distraction, i.e., driving a car while reading a slowly changing text (5 words per second); and (3) heavy distraction, i.e., driving a car while reading a rapidly changing text (15 words per second). We use the 200 high-SNR samples in the experiment: 100 samples are selected randomly to train the neural network and the remaining samples are utilized for testing. As shown in Fig. 15, the average accuracy is as high as 97%. The results indicate that the quality information is very useful in distinguishing the body condition of a driver.
Now consider driver identification. When the number of drivers is large, it is much more challenging than the recognition of the body status. There are 15 drivers in the experiments, among which three have five years or more of driving experience, five are novices, and the rest have 13 years of experience.
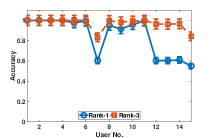
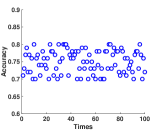
First, the drivers are identified based on the quality of their individual actions. There are 15 driver classes and Rank-k means that, for a test sample, all classes are ranked according to the probability computed by WiQ in descending order (the correct class belongs to the set of the first k classes). Fig. 18 shows the Rank-1 and Rank-3 recognition accuracy. The Rank-1 accuracy is at least 56% and on average 78%. In comparison with the results shown in Fig. 13, by using the quality information, the ability to identify the drivers is improved significantly. The Rank-3 accuracy was at least 82% and on average 95%.
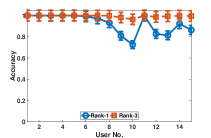
Second, the performance can be improved further by the activity-based fusion policy. For each activity, there are 200 samples. We partition them equally into the high-SNR and low-SNR categories. Afterwards, we select 60 high-SNR samples randomly for training and the remaining for testing. Fig. 18 shows the results. The Rank-1 accuracy is always higher than 72% and on average 88%. Additionally, the Rank-3 accuracy approaches 97%. In other words, high identification precision can be achieved by WiQ when the SNR is high.
For the low SNR scenario, we choose the set of test samples randomly from the 100 low-SNR samples. The experiment was repeated for approximately 100 times. Fig. 18 plots the average Rank-1 accuracy. Though the accuracy is lower than that in the high-SNR category, promising performance is achieved with the help of the fusion strategy, i.e., the accuracy is as high as 80% and on average 75%.
In summary, WiQ can recognize the action accurately and discriminate among different body statuses (or drivers) based on the driving quality. For action recognition, the accuracy is as high as 95% when the SNR is high. In addition, the accuracy of body status recognition is as high as 97%. For driver identification, the average Rank-1 accuracy is 88% with high SNR and 75% when the SNR is low.
V-D Comparative study
We present the results of the comparative study. We first compare our method with other machine learning methods. Then, we present the sensitivity results of quality recognition on the gradient features. Finally, we discuss the driver category recognition (i.e., finding the category for a given driver) under various traffic conditions (urban vs. high-speed road). In general, there are three driver categories, “Experienced” (3 years of driving experience), “Less experienced” (1-3 years of driving experience) and “Novice” (1 year of driving experience). In comparison with driver identification, driver category recognition is a similar but easier task. The category information is useful in practice. For example, the driving assistant system can give more operable driving instructions to novice drivers and more alert information to experienced drivers.
| Iteration Number | 5 | 10 | 15 | 20 | 50 | 100 |
|---|---|---|---|---|---|---|
| CNN | 0.36 | 0.06 | 0.05 | 0.04 | 0.03 | 0.01 |
| SVM | 0.52 | 0.41 | 0.34 | 0.30 | 0.28 | 0.27 |
| kNN | 0.35 |
| Number of iterations | 5 | 10 | 15 | 20 | 50 | 100 |
|---|---|---|---|---|---|---|
| CNN | 0.36 | 0.06 | 0.05 | 0.04 | 0.03 | 0.01 |
| SVM | 0.52 | 0.41 | 0.34 | 0.30 | 0.28 | 0.27 |
| kNN | 0.44 |
To demonstrate the effectiveness of the deep convolutional neural network (CNN), we choose k-nearest neighbor (kNN) and support vector machine (SVM) [34] for comparison. For kNN, we choose k=3 as it achieves the best performance in the experiment. Table IV shows the average error rate of action recognition with different numbers of iterations for CNN and SVM with high SNR. Table V shows the results with low SNR. First, with a large number of iterations, the precision of CNN is very high, i.e., the error rate is only 1% with high SNR. Even with low SNR, the average precision is still larger than 70%. Second, CNN outperforms SVM significantly and consistently. Though the error rate of SVM decreases with an increase of the number of iterations, it is never lower than 27% with high SNR or 38% with low SNR. The performance of kNN does not depend on the number of iterations and is consistently worse than that of SVM and CNN.
| SNR | G(3) | G(A) | R(3) | R(A) | G(3)+R(A) | G(A)+R(A) | All |
|---|---|---|---|---|---|---|---|
| Low | 0.49 | 0.36 | 0.50 | 0.42 | 0.41 | 0.30 | 0.31 |
| HIgh | 0.28 | 0.21 | 0.34 | 0.26 | 0.27 | 0.14 | 0.17 |
We investigate the sensitivity of quality recognition on the gradient features. As the process of feature fusion in WiQ is automatic, we choose SVM to conduct the experiment. Table VI shows the average error rate of body status recognition by SVM with 100 iterations. The features are selected from Table I, where “G(3)” refers to {, , }, “R(3)” to {, , }, “G(A)” to {, , , }, and “R(A)” to the five range features on the right of Table I. In general, a lower error rate can be achieved with more features, except that the result of “G(A)+R(A)” is better than that when all features are used. Comparing the results in “G(3)” with those in “G(A),” one can observe that the second-order metric (i.e., the variance of the gradient) is quite effective for reducing the error rate, e.g., by 14% with low SNR and 5% with high SNR. It is generally insufficient to use the first-order statistics alone in action quality recognition, i.e., the error rate is as high as 27% with high SNR in “G(3)+R(A)” where all the first-order statistics (except time duration) are used.
| Exp. | Less Exp. | Novice | |
|---|---|---|---|
| Exp. | 0.85 | 0.09 | 0.06 |
| Less Exp. | 0.10 | 0.87 | 0.03 |
| Novice | 0.03 | 0.07 | 0.9 |
| Exp. | Less Exp. | Novice | |
|---|---|---|---|
| Exp. | 0.92 | 0.06 | 0.02 |
| Less Exp. | 0.05 | 0.89 | 0.06 |
| Novice | 0.01 | 0.01 | 0.98 |
Finally, Table VII and Table VIII show the results of driver category recognition on the urban and high-speed roads, respectively. The results are obtained with high SNR. One can see that the accuracy of quality recognition is lower in the urban environment. A possible reason is that a driver should react differently to distinct traffic condition on the urban road, resulting in difficulty in quality assessment. Moreover, the results of novice are relatively better. This is because a novice driver cannot adapt well to different traffic conditions, resulting in unified (but not optimal) reaction behavior.
In summary, the comparative study indicates first, that the deep neural network method outperforms kNN and SVM consistently; second, that second-order statistics, such as variance, are critical for achieving high performance of quality recognition; and third, that it is more challenging to recognize driving quality under complex traffic conditions (e.g., urban roads).
VI CONCLUSIONS AND FUTURE WORK
We take the driving system as an example of human-machine system and study the fine-grained recognition of driving behaviors. Although action recognition has been studied extensively, the quality of actions is less understood. We propose WiQ for qualitative action recognition by using narrowband radio signals. It has three key components, deep neural network-based learning, gradient-based signal boundary detection, and activity-based fusion. Promising performance is achieved for the challenging applications, e.g., the accuracy is on average 88% for identification among 15 drivers. Currently, the experiments are performed with a driving emulator. In the future, we plan to further optimize the learning framework and evaluate the performance of the proposed method in a real environment.
Acknowledgment
This work has been supported by the NSF of China (No. 61572512, U1435219 and 61472434). The authors sincerely appreciate the reviewers and editors for their constructive comments.
References
- [1] H. Abdelnasser, M. Youssef, and K. A. Harras, “WiGest: A ubiquitous WiFi-based gesture recognition system,” in Proc. IEEE INFOCOM’15, pp. 75–86, 2015.
- [2] B. Guo, H. Chen, Q. Han, Z. Yu, D. Zhang, and Y. Wang, “Worker-contributed data utility measurement for visual crowdsensing systems,” IEEE Trans. Mob. Comput., vol. PP, no. 99, pp. 1–1, 2016.
- [3] Z. Yu, H. Xu, Z. Yang, and B. Guo, “Personalized travel package with multi-point-of-interest recommendation based on crowdsourced user footprints,” IEEE Trans. on Human-Machine Systems, vol. 46, no. 1, pp. 151–158, 2016.
- [4] B. Guo, Y. Liu, W. Wu, Z. Yu, and Q. Han, “Activecrowd: A framework for optimized multi-task allocation in mobile crowdsensing systems,” IEEE Trans. on Human-Machine Systems.
- [5] E. Velloso, A. Bulling, H. Gellersen, W. Ugulino, and H. Fuks, “Qualitative activity recognition of weight lifting exercises,” in Proc. ACM AH’13, pp. 116–123, 2013.
- [6] Caterpillar, “Operator fatigue detection technology review,” Caterpillar Global Mining, pp. 1–58, 2012.
- [7] Q. Ji, Z. Zhu, and P. Lan, “Real-time nonintrusive monitoring and prediction of driver fatigue,” IEEE T. Vehicular Technology, vol. 53, no. 4, pp. 1052–1068, 2004.
- [8] E. Velloso, A. Bulling, and H. Gellersen, “Motionma: motion modelling and analysis by demonstration,” in Proc. ACM CHI ’13, pp. 1309–1318, 2013.
- [9] USRP, “Ettus research,” http://www.ettus.com, 2010.
- [10] L. Wang, Y. Qiao, and X. Tang, “Action recognition with trajectory-pooled deep-convolutional descriptors,” in Proc. IEEE CVPR’15, pp. 4305–4314, 2015.
- [11] G. Cohn, D. Morris, S. Patel, and D. S. Tan, “Humantenna: using the body as an antenna for real-time whole-body interaction,” in Proc. ACM CHI’12, pp. 1901–1910, 2012.
- [12] S. Gupta, D. Morris, S. Patel, and D. S. Tan, “Soundwave: using the doppler effect to sense gestures,” in Proc. ACM CHI ’12, pp. 1911–1914, 2012.
- [13] F. Adib, Z. Kabelac, and D. Katabi, “Multi-person localization via rf body reflections,” in Proc. USENIX NSDI’15, pp. 279–292, 2015.
- [14] K. Joshi, D. Bharadia, M. Kotaru, and S. Katti, “Wideo: Fine-grained device-free motion tracing,” in Proc. USENIX NSDI’15, pp. 189–202, 2015.
- [15] Y. Wang, J. Liu, Y. Chen, M. Gruteser, J. Yang, and H. Liu, “E-eyes: device-free location-oriented activity identification using fine-grained wifi signatures,” in Proc. ACM MOBICOM’14, pp. 617–628, 2014.
- [16] F. Adib and D. Katabi, “See through walls with wifi!” in Proc. ACM SIGCOMM’13, pp. 75–86, 2013.
- [17] Q. Pu, S. Gupta, S. Gollakota, and S. Patel, “Whole-home gesture recognition using wireless signals,” in Proc. ACM MOBICOM’13, pp. 27–38, 2013.
- [18] F. Adib, Z. Kabelac, D. Katabi, and R. C. Miller, “3D tracking via body radio reflections,” in Proc. USENIX NSDI’14, pp. 317–329, 2014.
- [19] P. Melgarejo, X. Zhang, P. Ramanathan, and D. Chu, “Leveraging directional antenna capabilities for fine-grained gesture recognition,” in Proc. ACM UbiComp’14, pp. 541–551, 2014.
- [20] Z. Yang, Z. Zhou, and Y. Liu, “From RSSI to CSI: indoor localization via channel response,” ACM Comput. Surv., vol. 46, no. 2, p. 25, 2013.
- [21] W. Xi, J. Zhao, X. Li, K. Zhao, S. Tang, X. Liu, and Z. Jiang, “Electronic frog eye: Counting crowd using wifi,” in Proc. IEEE INFOCOM’14, pp. 361–369, 2014.
- [22] F. Adib, H. Mao, Z. Kabelac, D. Katabi, and R. C. Miller, “Smart homes that monitor breathing and heart rate,” in Proc. ACM CHI’15, pp. 837–846, 2015.
- [23] S. Sigg, M. Scholz, S. Shi, Y. Ji, and M. Beigl, “Rf-sensing of activities from non-cooperative subjects in device-free recognition systems using ambient and local signals,” IEEE Trans. Mob. Comput., vol. 13, no. 4, pp. 907–920, 2014.
- [24] G. Wang, Y. Zou, Z. Zhou, K. Wu, and L. M. Ni, “We can hear you with wi-fi!” in Proc. ACM MOBICOM’14, pp. 593–604, 2014.
- [25] C. Han, K. Wu, Y. Wang, and L. M. Ni, “Wifall: Device-free fall detection by wireless networks,” in Proc. IEEE INFOCOM’14, pp. 271–279, 2014.
- [26] D. Huang, R. Nandakumar, and S. Gollakota, “Feasibility and limits of wi-fi imaging,” in Proc. ACM SenSys ’14, pp. 266–279, 2014.
- [27] A. Moeller, L. Roalter, S. Diewald, M. Kranz, N. Hammerla, P. Olivier, and T. Ploetz, “Gymskill: A personal trainer for physical exercises,” in Proc. IEEE PERCOM’12, pp. 588–595, 2012.
- [28] J. M. Wang, H. Chou, S. Chen, and C. Fuh, “Image compensation for improving extraction of driver’s facial features,” in Proc. VISAPP’14, pp. 329–338, 2014.
- [29] S. Sigg, S. Shi, and Y. Ji, “Rf-based device-free recognition of simultaneously conducted activities,” in Proc. ACM UbiComp ’13, pp. 531–540, 2013.
- [30] S. Sigg, S. Shi, F. Büsching, Y. Ji, and L. C. Wolf, “Leveraging rf-channel fluctuation for activity recognition: Active and passive systems, continuous and rssi-based signal features,” in Proc. MoMM ’13, p. 43, 2013.
- [31] D. Halperin, T. E. Anderson, and D. Wetherall, “Taking the sting out of carrier sense: interference cancellation for wireless LANs,” in Proc. ACM MOBICOM’08, pp. 339–350, 2008.
- [32] K. El-Kafrawy, M. Youssef, and A. El-Keyi, “Impact of the human motion on the variance of the received signal strength of wireless links,” in Proc. IEEE PIMRC’11, pp. 1208–1212, 2011.
- [33] R. Polikar, “Ensemble based systems in decision making,” IEEE Circuits and Systems Magazine, vol. 6, no. 3, pp. 21–45, 2006.
- [34] C. Chang and C. Lin, “LIBSVM: A library for support vector machines,” ACM TIST, vol. 2, no. 3, p. 27, 2011.
![[Uncaptioned image]](/html/1703.00492/assets/x22.png) |
Shaohe Lv (S’6-M’11) is with the National Laboratory of Parallel and Distributed Processing, National University of Defense Technology, China, where he is an Assistant Professor since July, 2011. He obtained his Ph.D., M.D and B.S in 2011, 2005 and 2003 respectively, all in computer science. His current research focuses on wireless communication, machine learning and intelligent computing. |
![[Uncaptioned image]](/html/1703.00492/assets/x23.png) |
Yong Lu is with the National Laboratory for Parallel and Distributed Processing, National University of Defense Technology, China, where he is working towards a Ph.D. degree. His current research focuses on wireless communications and networks. |
![[Uncaptioned image]](/html/1703.00492/assets/x24.png) |
Mianxiong Dong is with the Department of Information and Electronic Engineering at the Muroran Institute of Technology, Japan where he is an Assistant Professor. He received his B.S., M.S. and Ph.D. in Computer Science and Engineering from The University of Aizu, Japan. His research interests include Wireless Networks, Cloud Computing, and Cyber-physical Systems. Dr. Dong is currently a research scientist with the A3 Foresight Program (2011-2016) funded by the Japan Society for the Promotion of Sciences (JSPS), NSFC of China, and NRF of Korea. |
![[Uncaptioned image]](/html/1703.00492/assets/x25.png) |
Xiaodong Wang is with the National Laboratory for Parallel and Distributed Processing, National University of Defense Technology, China, where he has been a Professor since 2011. He obtained his Ph.D., M.D and B.S in 2002, 1998 and 1996 respectively, all in computer science. His current research focuses on wireless communications and social networks. |
![[Uncaptioned image]](/html/1703.00492/assets/x26.png) |
Yong Dou (M’08) is with the National Laboratory for Parallel and Distributed Processing, National University of Defense Technology, China, where he has been a Professor. His current research focuses on intelligent computing, machine learning and computer architecture. |
![[Uncaptioned image]](/html/1703.00492/assets/x27.png) |
Weihua Zhuang (M’3-SM’01-F’08) is with the Department of Electrical and Computer Engineering, University of Waterloo, Canada, since 1993, where she is a Professor and a Tier I Canada Research Chair. Her current research focuses on wireless networks and smart grid. She is an elected member on the Board of Governors and VP Publications of the IEEE Vehicular Technology Society. |