Probing the Broad Line Region and the Accretion Disk in the Lensed Quasars HE0435-1223, WFI2033-4723, and HE2149-2745 using Gravitational Microlensing
Abstract
We use single-epoch spectroscopy of three gravitationally lensed quasars, HE0435-1223, WFI2033-4723, and HE2149-2745, to study their inner structure (BLR and continuum source). We detect microlensing-induced magnification in the wings of the broad emission lines of two of the systems (HE0435-1223 and WFI2033-4723). In the case of WFI2033-4723, microlensing affects two “bumps” in the spectra which are almost symmetrically arranged on the blue (coincident with an Al III emission line) and red wings of C III]. These match the typical double-peaked profile that follows from disk kinematics. The presence of microlensing in the wings of the emission lines indicates the existence of two different regions in the BLR: a relatively small one with kinematics possibly related to an accretion disk, and another one that is substantially more extended and insensitive to microlensing. There is good agreement between the estimated size of the region affected by microlensing in the emission lines, light-days (red wing of C IV in HE0435-1223) and light-days (C III] bumps in WFI2033-4723) with the sizes inferred from the continuum emission, light-days (HE0435-1223) and light-days (WFI2033-4723). For HE2149-2745 we measure an accretion disk size light-days. The estimates of , the exponent of the size vs. wavelength (), are , , and for HE0435-1223, WFI2033-4723, and HE2149-2745, respectively. In conclusion, the continuum microlensing amplitude in the three quasars and chromaticity in WFI2033-4723 and HE2149-2745 are below expectations for the thin disk model. The disks are larger and their temperature gradients are flatter than predicted by this model.
1 Introduction
Gravitationally lensed quasars are very well suited to study the inner structure of AGN (Pooley et al., 2007; Anguita et al., 2008; Bate et al., 2008; Eigenbrod et al., 2008; Poindexter et al., 2008; Chartas et al., 2009; Floyd et al., 2009; Dai et al., 2010; Morgan et al., 2010; Blackburne et al., 2011; Mosquera & Kochanek, 2011; Muñoz et al., 2011; Chen et al., 2012; Hainline et al., 2012; Morgan et al., 2012; Hainline et al., 2013; Blackburne et al., 2014; Jiménez-Vicente et al., 2014, 2015a; MacLeod et al., 2015; Mediavilla et al., 2015a, b; Muñoz et al., 2016). The magnification of lensed quasar images depends on the mass distribution of the lens galaxy and on geometrical considerations (distances and alignment between quasar, galaxy and observer). Therefore, the mean (or macromodel) flux ratios between images would be very useful observables to study the mass density profile in lens galaxies, assuming that all the lens galaxy mass is smoothly distributed. However, compact objects such as stars in the lens galaxies induce strong spatial gradients in the gravitational potential that give rise to anomalies in the flux ratios compared to the predictions of macromodels. This effect (so-called microlensing; see Chang & Refsdal., 1979; Wambsganss, 2006) complicates the macro-modeling of lens systems but in exchange it has a very useful property: it is sensitive to the source size (with smaller source regions showing larger magnifications). Thus, we can study the size of the emitting region by measuring flux ratios to deduce the effects of microlensing.
Taking advantage of this property, the inner structure of AGNs can be studied by searching for the effects of microlensing on different regions of single-epoch spectra of the images of a lensed quasar (Mediavilla et al., 2011; Motta et al., 2012; Guerras et al., 2013; Rojas et al., 2014; Sluse et al., 2015). The cores of the emission lines, which likely arise from extended regions, is insensitive to microlensing, so their flux ratios are a baseline against which we can measure the effects of microlensing on other regions of smaller size, such as the wings of the emission lines (Richards et al., 2004; Motta et al., 2012; Sluse et al., 2012; Guerras et al., 2013; Braibant et al., 2014) and the continuum generated by the accretion disk. According to the thin disk model (Shakura & Sunyaev, 1973), the size of the continuum varies with wavelength with a law, and hence the microlensing magnification will show some wavelength dependence (so-called microlensing chromaticity).
The objective of this paper is to use single-epoch spectra of three gravitationally lensed quasars (HE0435-1223, WFI2033-4723, and HE2149-2745) to discuss the presence of microlensing in the emission lines (which would yield information on the structure of the BLR) and in the continuum (to estimate sizes and temperature gradients in the accretion disk). The paper is organized as follows. In section 2 we present the data. Section 3 is devoted to a description of our method of analysis. We discuss our results in §4 and offer concluding remarks in section §5.
2 Observations and data reduction
HE0435-12223 was observed on January 12th 2008 with the Blue Channel spectrograph on the MMT. Spectroscopic information for WFI2033-4723 and HE2149-2745 was gathered during April-May 2008 with the FORS2 spectrograph at the Very Large Telescope (VLT)111based on observations made with ESO telescopes at Paranal Observatory under program 381.A-0508(A), P.I. V. Motta. Table 1 summarizes the main observational characteristics of the data. For HE0435-1223, we also used archival data222based on data obtained from the ESO Science Archive Facility, program 074.A-0563(B). obtained with the FORS1 spectrograph on the VLT. For the three systems we also analyzed the deconvolved spectra from Sluse et al. (2012) provided by the VizieR (Ochsenbein et al., 2000) catalogue333based on data obtained with the Vizier catalogue access tool, CDS, Strasbourg, France.. A detailed description of these observations and the spectrum analysis can be found in Eigenbrod et al. (2007) and Sluse et al. (2012).
| Objects | PairaaPair or image observed | bbSeparation between images in arcsec (″) | Instrument | Grating | Date | Airmass | P.A.ccPosition angle in degrees E of N | SeeingddSeeing in arcseconds | ExposureeeSeconds of time |
|---|---|---|---|---|---|---|---|---|---|
| HE0435-1223 | BD | 1.5 | MMT/Blue-Channel | 300 | 2008/01/12 | 1.40 | -13.92 | 0.87 | 1800 |
| BDffData obtained from the ESO Science Archive Facility from program 074.A-0563(B), P.I. G. Meyland (Eigenbrod et al., 2007) | VLT/FORS1 | 300 | 2004/10/11 | 1400 | |||||
| BDffData obtained from the ESO Science Archive Facility from program 074.A-0563(B), P.I. G. Meyland (Eigenbrod et al., 2007) | VLT/FORS1 | 300 | 2004/10/12 | 1400 | |||||
| BDffData obtained from the ESO Science Archive Facility from program 074.A-0563(B), P.I. G. Meyland (Eigenbrod et al., 2007) | VLT/FORS1 | 300 | 2004/11/11 | 1400 | |||||
| WFI2033-4723 | BChhObservations made with ESO telescopes at Paranal Observatory under program 381.A-0508(A), P.I. V. Motta (Motta et al., 2012) | 2.1 | VLT/FORS2 | 300 | 2008/04/14 | 1.23 | -79.05 | 0.7 | |
| BCggDeconvolved spectra from Sluse et al. (2012) (VizieR Archive) based on Eigenbrod et al. (2007) data. | VLT/FORS2 | 300 | 2005/05/13 | 1.16 | 0.54 | ||||
| HE2149-2745 | ABhhObservations made with ESO telescopes at Paranal Observatory under program 381.A-0508(A), P.I. V. Motta (Motta et al., 2012) | 1.7 | VLT/FORS2 | 300 | 2008/05/07 | 1.38 | -28.63 | 0.8 | |
| ABggDeconvolved spectra from Sluse et al. (2012) (VizieR Archive) based on Eigenbrod et al. (2007) data. | VLT/FORS2 | 300 | 2006/08/04 | 1.48 | -32.0 | 0.62 |
Data reductions were carried out with IRAF444IRAF is distributed by the National Optical Astronomy Observatory, which is operated by the Association of Universities for Research in Astronomy, Inc., under cooperative agreement with the National Science Foundation tasks. The procedure consisted of subtraction, flat fielding, and wavelength calibration. As we are interested only in flux ratios between the quasar images, flux-calibration is not needed. The cosmic-rays were removed using at least three exposures. The 1-D spectra extraction is obtained by simultaneously fitting two Gaussian functions to the components for each wavelength. The deconvolved spectra obtained from the VizieR archive are already fully reduced. The systematic errors affecting our measurements were discussed elsewhere (Motta et al., 2012).
3 Methods
The procedure we use to separate microlensing and extinction consist of measuring the displacement between the continuum and the core of the emission line flux ratios (e.g., see Mediavilla et al., 2009, 2011; Motta et al., 2012; Guerras et al., 2013; Rojas et al., 2014). Thus, the baseline for no-microlensing is established by using the line core fluxes. The continuum is retrieved by fitting the regions on either side of each emission line ( to wavelength range) and its flux is the integral below such function (). For instance, when is used as fitting function, the integrated flux is obtained as . Once the continuum is subtracted, the core flux is obtained by integrating the emission line profiles using DIPSO (Howarth, 2004) in STARLINK555Support provided by the Starlink Project which is run by CCLRC on behalf of PPARC.. The integration is performed in a narrow interval (from 20 to 100 Å depending on the line profile shape) centered on the peak of line. Narrower integration windows are chosen in those cases in which absorption lines are present (e.g. 20 Å for C IV in HE2149-2745 C IV). The continuum fitting error (, ) provided by DIPSO (at 1 level)666errors in the linear approximation are calculated from the error matrix is used as an estimation of the core flux error. Specifically, the errors for each coefficient (, ) are used to estimate the error in the continuum as . As the core flux measurement relies on the continuum fitting, its error is estimated as the error in the continuum (see Motta et al., 2012).
We also compare our results with magnitude differences obtained from the literature (Table 2), measured in the near-infrared. Longer wavelengths are expected to be less affected by microlensing because they are produced in a larger emitting region (however, as Fadely & Keeton (2011) have stated, for sources with the broad-band could be contaminated by thermal emission from the inner dusty torus)
| Lens Name | zLaa Lens galaxy redshift | zSbb Lensed quasar redshift | Filtercc Filter or, when available, we give the line emission flux between parenthesis | dd Inverse of the central wavelength (rest frame). (m-1) | (mag) ee Magnitude difference between pair of images. | Source ff REFERENCES: (1) CASTLES; (2) Wisotzki et al. (2002); (3) Wisotzki et al. (2003); (4) Mosquera et al. (2011); (5) Fadely & Keeton (2011); (6) Wisotzki et al. (1996); (7) Lopez et al. (1998); (8) Burud et al. (2002); (9) Blackburne et al. (2011); (10) Morgan et al. (2004); (11) Vuissoz et al. (2008); (12) Chen et al. (2012); |
|---|---|---|---|---|---|---|
| HE0435-1223 BD | 0.46 | 1.689 | L’ | 0.26 | 5 | |
| K | 0.45 | 5 | ||||
| Ks | 0.45 | 9 | ||||
| H | 0.61 | 9 | ||||
| F160W | 0.65 | 1 | ||||
| J | 0.80 | 9 | ||||
| z’ | 1.00 | 9 | ||||
| F814W | 1.23 | 1 | ||||
| I | 1.27 | 4 | ||||
| I | 1.27 | 4 | ||||
| i | 1.30 | 2 | ||||
| i’ | 1.30 | 9 | ||||
| Iac29 | 1.43 | 4 | ||||
| H | 1.52 | 4 | ||||
| H | 1.52 | 4 | ||||
| r | 1.60 | 2 | ||||
| r’ | 1.60 | 9 | ||||
| Iac28 | 1.65 | 4 | ||||
| r | 1.60 | 3 | ||||
| F555W | 1.80 | 1 | ||||
| V | 1.83 | 3 | ||||
| Str-y | 1.83 | 4 | ||||
| Str-y | 1.83 | 4 | ||||
| g | 2.08 | 2 | ||||
| g’ | 2.08 | 9 | ||||
| g | 2.08 | 3 | ||||
| Str-b | 2.14 | 4 | ||||
| Str-v | 2.43 | 4 | ||||
| Str-v | 2.43 | 4 | ||||
| u’ | 2.84 | 9 | ||||
| Str-u | 2.85 | 4 | ||||
| 0.5-0.8KeV | 3.23 | 9 | ||||
| 0.4-0.8KeV | 3.23 | 12 | ||||
| WFI2033-4723 BC | 0.66 | 1.66 | Ks | 0.75 | 9 | |
| H | 1.00 | 9 | ||||
| F160W | 1.07 | 1 | ||||
| J | 1.33 | 9 | ||||
| z’ | 1.82 | 9 | ||||
| F814W | 2.07 | 1 | ||||
| i’ | 2.16 | 9 | ||||
| i’ | 2.16 | 10 | ||||
| r | 2.57 | 11 | ||||
| r’ | 2.65 | 9 | ||||
| r’ | 2.65 | 10 | ||||
| F555W | 3.05 | 1 | ||||
| g’ | 3.46 | 9 | ||||
| g’ | 3.46 | 10 | ||||
| u’ | 4.71 | 9 | ||||
| u’ | 4.71 | 10 | ||||
| 0.5-0.8KeV | 3.23 | 10 | ||||
| HE2149-2745 AB | 0.60 | 2.032 | L’ | 0.26 | 5 | |
| K | 0.45 | 5 | ||||
| F160W | 0.65 | 1 | ||||
| F814W | 1.23 | 1 | ||||
| i | 1.30 | 8 | ||||
| R | 1.55 | 6 | ||||
| R | 1.55 | 7 | ||||
| V | 1.83 | 7 | ||||
| V | 1.83 | 8 | ||||
| V | 1.83 | 8 | ||||
| F555W | 1.80 | 1 | ||||
| B | 2.28 | 6 | ||||
| B | 2.28 | 7 |
In those cases where our spectra are contaminated by the lens galaxy continuum (e.g. HE2149-2745), we compare our line core flux ratio with the uncontaminated broad-band measurements (e.g. CASTLES777http://www.cfa.harvard.edu/glensdata/).
Chromatic microlensing detection allows us to study the structure of the accretion disk in the lensed quasar by estimating its size and temperature profile. The accretion disk is modeled as a Gaussian, , with size . Mortonson et al. (2005) showed that microlensing primarily constrains the half-light radius of the disk , but the precise details of the disk model are unimportant, because the Gaussian scale length we use here is related to the half-light radius by and this can be used to compare our results to other choices for the disk profile. The probability of reproducing the measured microlensing magnifications is estimated by randomly placing a Gaussian source on microlensing magnification maps. The Inverse Polygon Mapping method (Mediavilla et al., 2006, 2011) was used to compute maps of pixels of 0.5 light days for each image. Microlensing magnification statistics is degenerate with the single-mass case except in the case of a mass function with a high dynamical range, when a similar contribution to the mass density from microlenses at the opposite ends exists (bimodality). Previous works (Witt et al., 1993; Wyithe et al., 2000; Congdon et al., 2007) support that microlensing magnification does not depend on the details of the mass function, but rather on the mean mass of the microlenses through the scaling factor , at least for Salpeter’s like laws (but see also Mediavilla et al. (2015a) for more general stellar mass functions). Thus, we use microlenses and the size scales linearly with this mass, i.e. . The convergence () and shear () for each image are selected using macromodels from the literature (Mediavilla et al., 2009; Sluse et al., 2012). The fraction of mass in compact objects is assumed to be , an acceptable value considering current estimates (see e.g. Schechter & Wambsganss, 2002; Mediavilla et al., 2009; Pooley et al., 2009; Jiménez-Vicente et al., 2015a, b). Bayesian posterior probabilities (Mediavilla et al., 2011) of and conditioned to the measured microlensing magnifications are estimated using a uniform logarithmic (linear) prior on ().
4 Results
4.1 HE0435-1223
Discovered by Wisotzki et al. (2002), it consists of four images of a lensed quasar at and a lens galaxy at (Morgan et al., 2005; Ofek et al, 2006). CASTLES images obtained with HST also revealed multiple partial arcs between the images. We present spectra for the and images taken with MMT and VLT telescopes. Due to the symmetric distribution of the images, the time delay between images is small ( days; Kochanek et al., 2006; Courbin et al., 2011).
In Figure 1 we present the continuum subtracted spectra in the regions corresponding to the C IV, C III] and Mg II emission lines. The spectra are normalized to match the profiles in the region of the core of the line (see §3). A very interesting result in the high ionization C IV line is the presence of a slight but systematic enhancement of the red wing ( Å range) of component with respect to component . A similar enhancement of the red wing is hinted at in component (not plotted here) with respect to component , but with less strength. C IV profiles of images and (not plotted here) seem to match reasonably well. In the case of the low ionization C III] line, the red wing of image also seems to be brighter than that of image , but by a small amount. Finally, the lower ionization line Mg II shows no significant differences between image profiles.
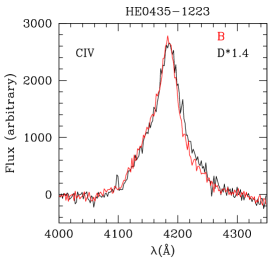
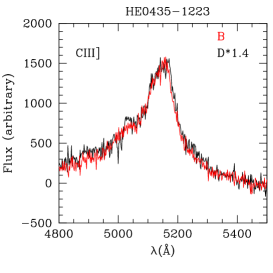
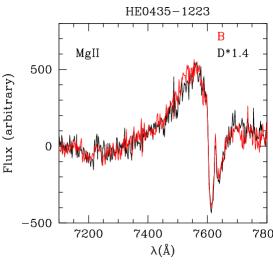
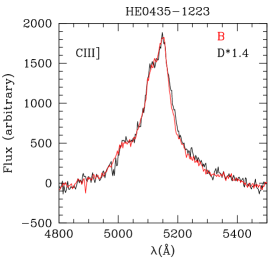
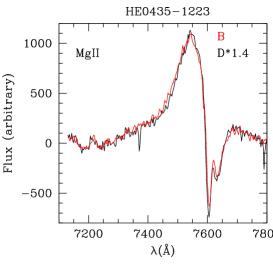
Differences present at specific wavelengths in the line profiles and the dependence of its strength on the degree of ionization (decreasing in the C IV, C III], Mg II sequence) can be explained as microlensing acting selectively on parts of a broad line region with organized kinematics. and would be the images less affected by differential microlensing and the most affected.
From near IR observations of the H emission line, Braibant et al. (2014) also propose microlensing to explain the differences between profiles. They found that the H emission line profiles of images and match well and that the effect of microlensing seems to be more pronounced for image . However, their Figure 1 shows an excess in the image profile in the blue wing relative to (instead of the red wing excess of that we measure). This is likely due to the different approach they followed to compare the profiles. They normalize the continuum before superposing them. Thus, their normalization factors include macro-magnification and continuum microlensing. In this way, they are mixing these two effects with line microlensing in the comparison of two emission line profiles. Following our procedure, on the contrary, continuum microlensing is removed by continuum subtraction, and macro-magnification is corrected for by normalization to the core of the emission line (assumed to be insensitive to microlensing). In fact, the re-normalization of the emission line profiles of Braibant et al. (2014) to match the core of the lines would likely result in an enhancement of the red wing of the emission line profile with respect to that of . In the same manner, the blue wing enhancements reported by Braibant et al. (2014) in the Mg II emission line will also likely disappear after normalization to the line cores.
Integrating the red wing excess in C IV corresponding to image and in the Å range, we obtain the microlensing magnification associated with the region. The red wing magnification was obtained as (see Guerras et al., 2013): mag.
In spite of the presence of microlensing in the red wings of some line profiles, the ratio of the line cores (see Figure 2 and Table 3) agrees within uncertainties. We obtain an average value for the emission lines ratio of mag. This confirms the expectation that the cores are not very sensitive to microlensing and that extinction is not significantly present in this lens system (in agreement with Wisotzki et al., 2003; Morgan et al., 2005).
| Region | (Å) | WindowccIntegration window. (Å) | aaMMT data (mag) | bbVLT archive data (mag) |
|---|---|---|---|---|
| Continuum | 4170 | 4000-4350 | ||
| 5140 | 4540-5550 | |||
| 7560 | 7130-7880 | |||
| Line | C IV1549 | 4170-4195 | ||
| C IV red wing | 4200-4250 | |||
| C III]1909 | 5100-5180 | |||
| Mg II2800 | 7480-7580 |
Continuum observations also indicate that, in contrast with , and are affected by microlensing. Courbin et al. (2011) conclude that the image is the least affected by stellar microlensing while is affected by strong microlensing variations. Wisotzki et al. (2003) found evidence of chromatic microlensing in component (0.07 mag) between Dec. 2001 and Sep. 2002. Using lightcurves in the R filter, Kochanek et al. (2006) also observed microlensing in (relative to ) of mag yr-1. Mosquera et al. (2011) obtained lightcurves with narrow-band filters in Oct. 2007, observing a chromaticity between the bluest (Str-b) and the reddest (I-band) filters of mag affecting component. Ricci et al. (2011) observed the system in the i, V, R bands in two epochs concluding that image is probably affected by microlensing.
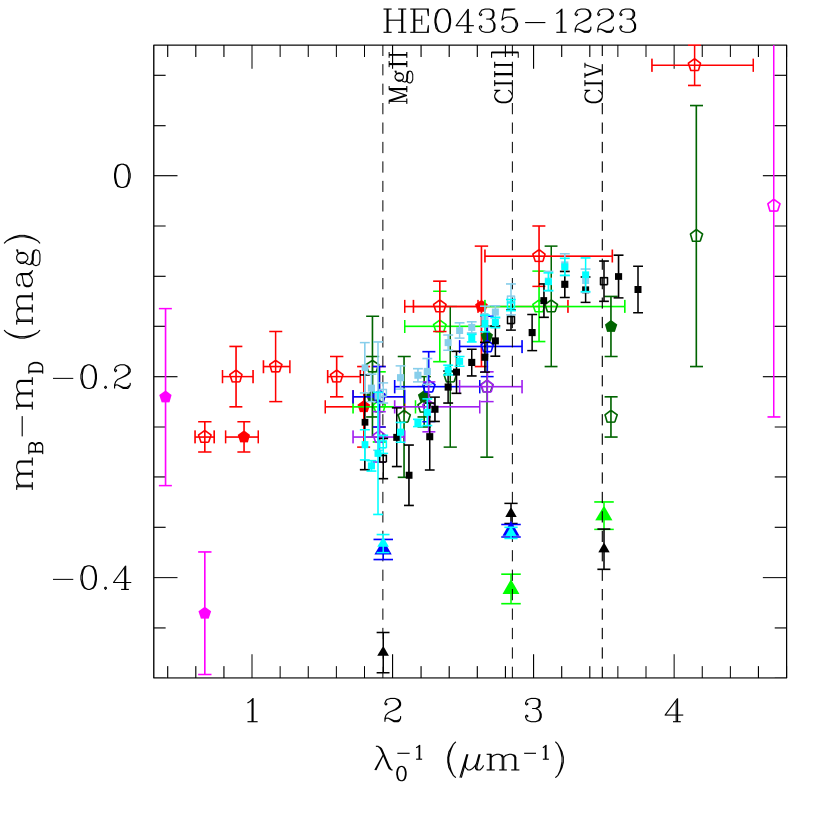
In Figure 2 we show the continuum ratio values available from the literature and those obtained from the spectra used in the present work. In the wavelength region between Mg II and C IV all these data consistently depict a linear trend with a variable gap with respect to the no microlensing baseline defined by the emission line ratios of about 0.1 and 0.3 mag respectively at the red (Mg II) and blue (C IV) ends. From C IV towards the UV, the broad band data available seem to fit in this linear trend albeit with a large scatter. From Mg II towards the IR, the chromaticity disappears and, with the exception of the outlying K band data from Fadely & Keeton (2011), the broad band data seem to concentrate around a constant offset of 0.18 mag with respect to the baseline defined by the emission line ratios.
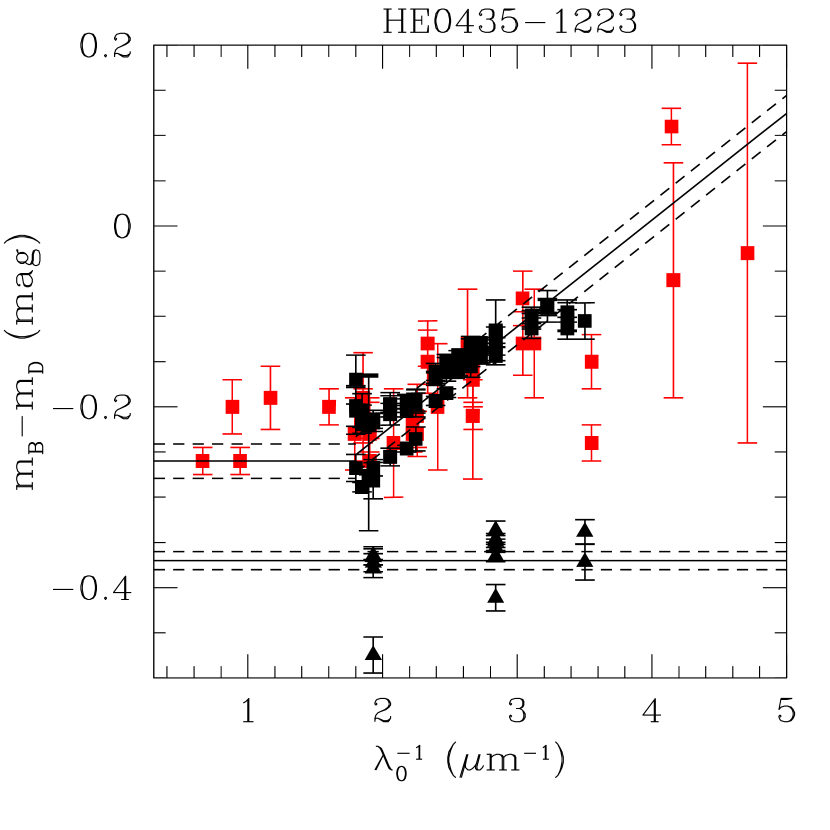
Following the method described in §3 we will use these wavelength dependent microlensing measurements to estimate the size and temperature profile of the accretion disk. To make the problem manageable, we will consider that the global behavior of the continuum can be defined by two straight lines, one independent of lambda to describe the data redder than Mg II, and the other one following the almost linear dependence of microlensing with from Mg II towards the blue (see Figure 3). We will take three points corresponding in wavelength to the F160W band, 8100Å (from spectroscopic continuum), and u’ band (see Table 4) to describe the global dependence of microlensing with wavelength in the simplest possible way. In Figure 4 we show the 2D joint PDF of and conditioned to these three microlensing measurements. The resulting estimates are light-days at Å and ( level), using uniform logarithmic and linear priors for the size and respectively. The estimated size ( light-days or light-days, scaled to ) is in agreement with the average size estimated by Jiménez-Vicente et al. (2014) ( light-days at 1026 Å), and it is consistent with the results in Blackburne et al. (2011) ( or light-days at 1208 Å). This is also consistent with sizes predicted by the black hole-mass size correlation (Morgan et al., 2010, at 2500 Å for ). However, this size is large compared to predictions based on flux variations (Mosquera et al., 2011, or 0.3 light-days at 3027 Å), and recent results using R-band light-curves (Blackburne et al., 2014, or light-days at 3027 Å). Our results for are in agreement with previous results (ranging from in Blackburne et al. (2011) to in Jiménez-Vicente et al. (2014)). Notice that these results match those of Jiménez-Vicente et al. (2014) although those were estimated using pair .

We follow the same procedure (Guerras et al., 2013) to estimate the size of the C IV emitting region affected by microlensing. In this case, we only calculate the size of the region at the C IV wavelength. We obtained light-days. This size is in agreement with that of the region emitting the blue continuum, indicating that the microlensed C IV emission likely arises close to the accretion disk.
| (Å) | aaDifference between the magnitude difference in the continuum and in the emission line cores for MMT and VLT continuum data and including the CASTLES F160W band data (see text). (mag) |
|---|---|
| 3522 | |
| 8100 | |
| 15500 |
4.2 WFI2033-4723
This is a quadruply imaged quasar ( by our estimation) discovered by Morgan et al. (2004) lensed by a galaxy at (Ofek et al, 2006; Eigenbrod et al., 2008). We present new spectra for components and which are separated . Vuissoz et al. (2008) found a time delay of days, in agreement with values estimated by Morgan et al. (2005).
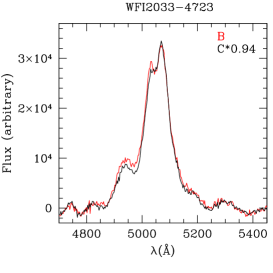
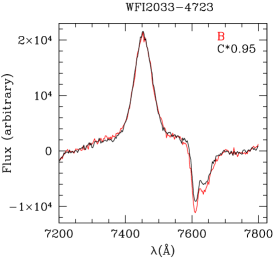
In Figure 5 we plot the continuum subtracted spectra for images and in the regions corresponding to the C III] and Mg II emission lines. The spectra have been normalized to match the profiles in the region of the core of the line (see §3). A very interesting result is the significant enhancement (of the image compared to the image) of a bump-like feature present in the blue wing of the C III] line, coincident with an Al III emission line typical of quasar spectra. Careful inspection of our spectra reveals that there is another bump-like feature in the red wing of the C III] line that also appears to be brighter in than in .
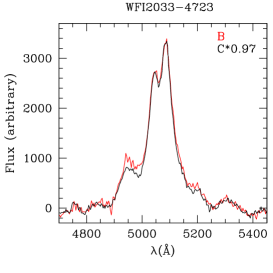
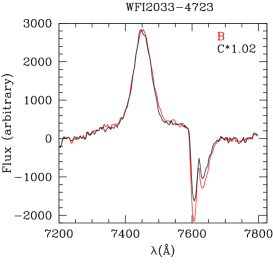
At a much lower intensity, two microlensed bumps with a separation of about Å are also noticeable at both sides of the Mg II emission lines. In the Morgan et al. (2004) spectra, the C III] emission line profiles also show a relative enhancement of the image with respect to . This was interpreted as evidence of microlensing by Sluse et al. (2012), who indicated that the excess might also be due to microlensing of the Al III or Si III] lines blended with the blue wing of C III]. Unfortunately, the S/N spectra of the red side of C III] and of the C IV lines are not sufficient to look for further evidence of these features.
| Region | (Å) | WindowbbIntegration window. (Å) | aaVLT data (mag) |
|---|---|---|---|
| Continuum | 5140 | 4700-5450 | |
| 7560 | 7200-7800 | ||
| Line | C III]1909 | 5060-5100 | |
| C III] blue wing | 4930-5000 | ||
| C III] red wing | 5160-5250 | ||
| Mg II2800 | 7430-7470 |
Integrating the bump excess corresponding to image in the Å and Å ranges, we obtain the microlensing magnification associated to the region generating the blue/red wing as (see Guerras et al., 2013): . We obtain consistent microlensing estimates for both bumps: mag and mag. The presence of the two bumps with similar enhancements on both sides of the line suggest a common origin for both structures (as an alternative to a microlensed Al III line). In several AGNs (see Popović et al., 2004, and references therein) the presence of these features in the wings of a BEL, which remind us of the double-peak characteristic of kinematics confined in a plane, have been interpreted as evidence of the accretion disk surrounding the massive central black-hole. Both elements, the separation between the bumps Å () and the fact that only the bumps are microlensed, would be in agreement with the hypothesis that these features arise from an inner, compact region of the BLR, likely residing on the accretion disk. An alternative possibility is that the bumps arise from a region with biconical geometry (Abajas et al., 2007).
| (Å) | aaDifference between the magnitude difference in the continuum and in the emission line cores for a) VLT data, b) CASTLES data, c) re-analysis of Sluse et al. (2012) deconvolved spectra + Morgan et al. (2004) + Vuissoz et al. (2008) (see text), and d) Blackburne et al. (2011) data. (mag) |
|---|---|
| 4300 | |
| 5500 | |
| 8700 | |
| 5439 | |
| 8012 | |
| 15500 | |
| 3522 | |
| 5500 | |
| 8500 | |
| 3522 | |
| 9114 | |
| 16500 |
In Figure 6 (Table 5) we present the emission line and continuum ratios for our data and for other data in the literature. The emission line ratios from Sluse et al. (2012) and from our data agree within uncertainties and show no evidence of chromaticity. We obtain an average value for the emission lines ratio of mag (we have not considered the discrepant emission line ratios from Morgan et al. (2004), because they have been obtained integrating in a window of 200 Å).
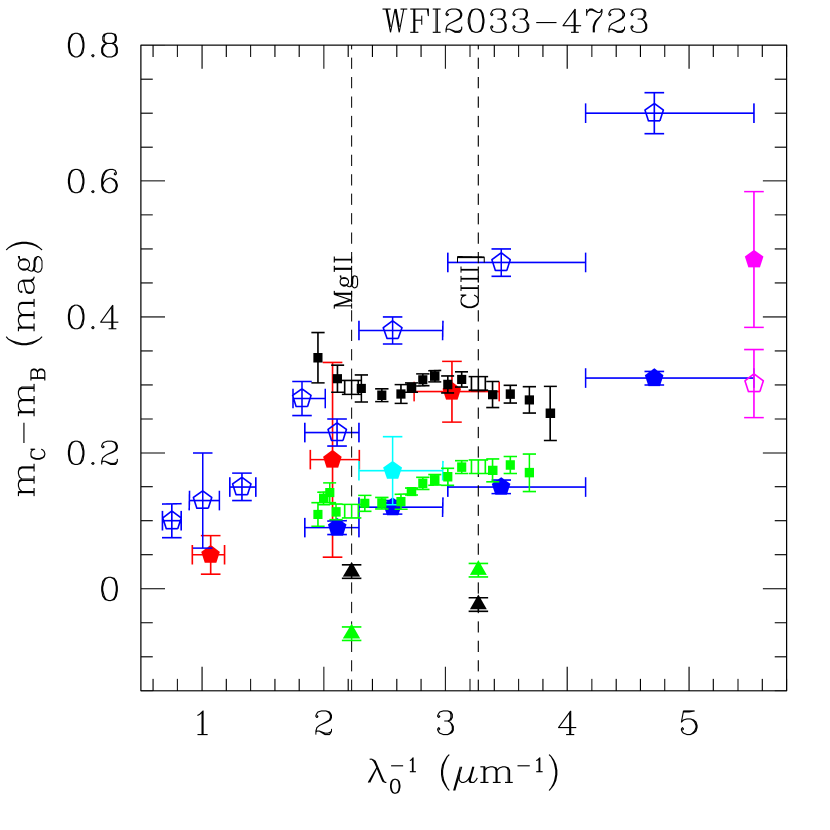
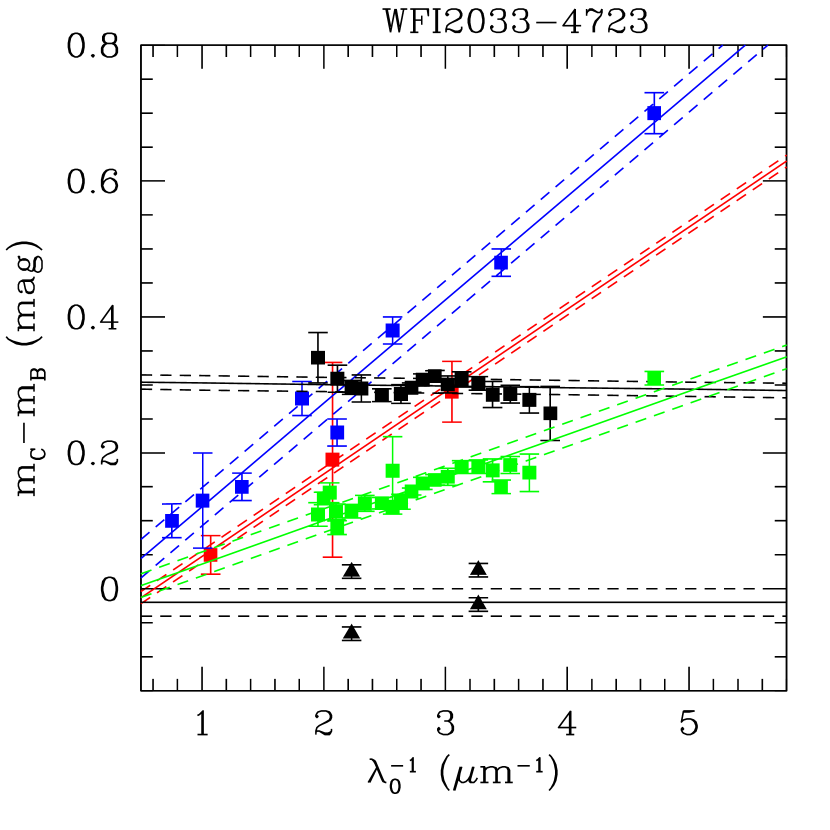
The continuum ratios, however, show a great change in amplitude at bluer wavelengths (i.e. chromaticity) showing a varying slope from 2003 to 2008, which can be explained by microlensing magnification of image (Figure 7). This trend is better seen if we group the data around four slopes that correspond to different epochs or observations (green, red, blue, and black in Figure 7). In 2008 the slope of the chromaticity changes, which likely requires a combination of microlensing in both components to be explained if a small size for the blue emission is assumed.
Following the method described in §3 we estimate the size, , and the logarithmic slope, , of the size dependence with wavelength for each one of the 4 epochs described above (Table 5). In Figure 8 we present the PDF of and for each one of the epochs and the combined PDF. Notice that the slope in our continuum data is small (meaning small chromaticity within our error bars, black squares in Figure 7 ), i.e. parameters are largely unconstrained for this epoch (Figure 8 a). The resulting estimates for the combined PDF are light-days (log prior) at Å and (linear prior). This disk size value ( light-days or light-days, scaled to ) is in agreement with the average size estimated by Jiménez-Vicente et al. (2014) ( light-days at 1026 Å) and Morgan et al. (2010) ( at 2500 Å for ). However, we cannot reconcile our results ( and ) with those of Blackburne et al. (2011) ( light-days at 1233 Å, using 0.3M⊙ microlenses, ). Although these last authors obtain size estimates that decrease with wavelength, they do not rule out positive values for and suggest that the anomalous flux ratios might be caused by unusual caustic patterns.


Using the same procedure, we estimate a size of light-days for the region generating the emission line bumps on both sides of the C III] line. Under the hypothesis of a common origin for both bumps, we can take this size as the radius of the accretion disk, infer a velocity of 7500 from the separation between the bumps and, assuming Keplerian circular rotation, estimate a mass of for the supermassive black hole.
4.3 HE2149-2745
HE2149-2745 was discovered by Wisotzki et al. (1996); it consists of two images and separated by at . The lens galaxy is at (Eigenbrod et al., 2007). Image is separated by from the main lens galaxy. Chromatic microlensing was detected in spectra taken by Burud et al. (2002). These authors estimated a time delay of days.
| Region | (Å) | WindowccIntegration window. (Å) | aaVLT data (mag) | bbSluse et al. (2012) (mag) |
|---|---|---|---|---|
| Continuum | 4170 | 4000-4350 | ||
| 5140 | 5000 6200 | |||
| 7560 | 8250 8650 | |||
| Line | C IV1549 | 4170-4195 | ||
| C III]1909 | 5720 5830 | |||
| Mg II2800 | 8480 8540 |
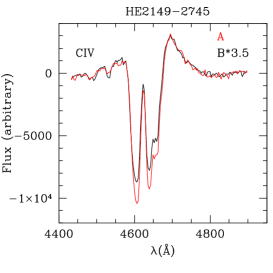
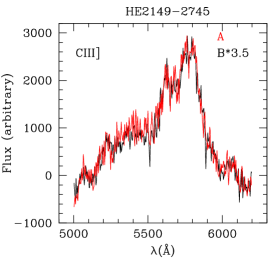
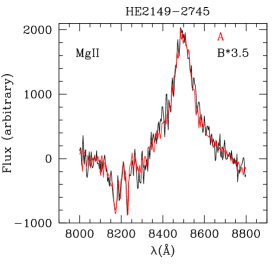
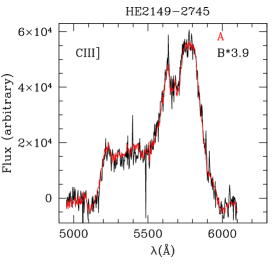
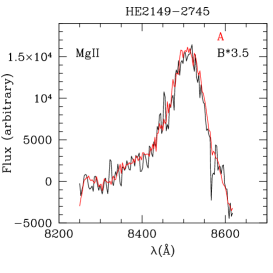
In Figure 9 we present the continuum subtracted spectra for the and images in the regions corresponding to the C IV, C III] and Mg II emission lines. The spectra match very well, after normalization using , except for the absorption in C IV. Sluse et al. (2012) also find that the absorbed fractions of the C IV emission line do not agree once scaled and they attribute the difference to time-variable broad absorption together with a time-delay. They found a chromatic difference between the spectra ( for CIII and for Mg II) which they attribute to dust extinction on image and/or intrinsic variability combined with a time delay of days.
Flux comparison between our spectroscopic continua and CASTLE data shows that there is contamination by the lens galaxy. We estimate (using F555W and F814W fluxes) that the contamination in the B spectra could be up to 60%, while in the deconvolved spectra it could be around 30%. In the following we will use the broad-band data to obtain the magnitude difference in the continuum.
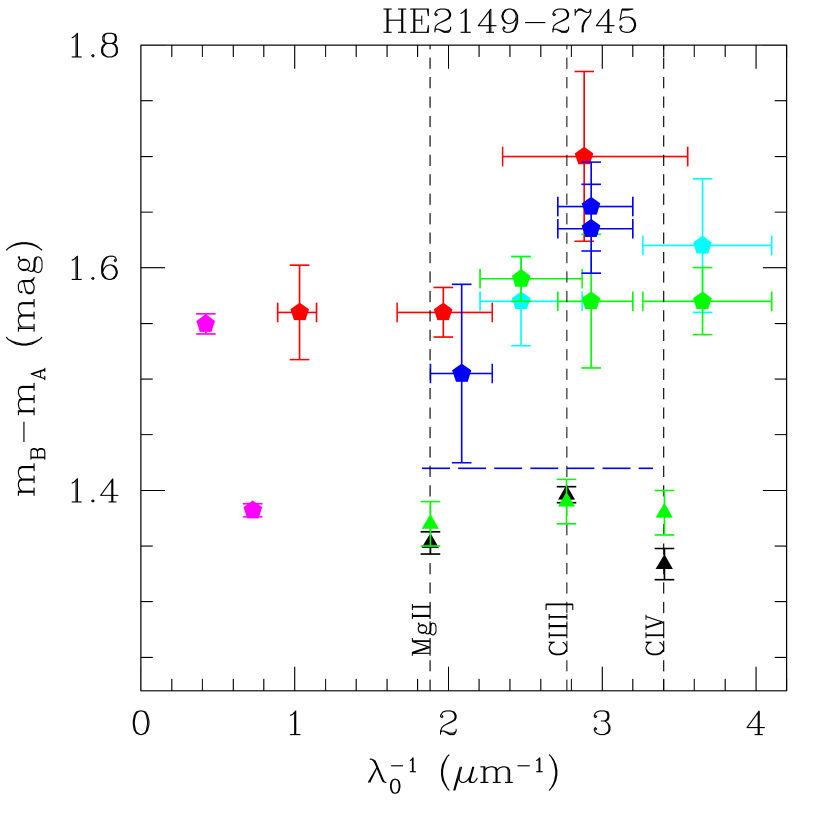
In Figure 10 (Table 7) we present the emission line and continuum ratios for our data and for other data in the literature. The emission line ratios show no dependence with wavelength. The continuum flux ratios, however show chromaticity, likely induced by microlensing (Figure 11).
| (Å) | aaDifference between the magnitude difference in the broad-band data from CASTLES and band data from Fadely & Keeton (2011) and in the emission line cores from VLT data, re-analysis of Sluse et al. (2012) deconvolved spectra, and band data from Fadely & Keeton (2011) (see text). (mag) |
|---|---|
| t 4380 | |
| 8140 | |
| 38000 |

Using the continuum and emission line ratios, (see §3) we estimate the size, , and the logarithmic slope, , of the size dependence with wavelength. In this case we have used convergence , , and shear , (Sluse et al., 2012) to compute the magnification maps. In Figure 12 we present the 2D PDF of and . The resulting estimates are light-days (log prior) at Å and (linear prior).

5 Conclusions
We have used spectroscopy of three lensed quasars, HE0435-1223, WFI2033-4723, and HE2149-2745, to study their inner structure (BLR and continuum source) as derived from microlensing magnification. The results are:
-
•
We have detected microlensing in the emission line profiles of two of the lensed systems, HE0435-1223, WFI2033-4723. In the case of HE0435-1223, we have found an enhancement of the red wing of image with respect to image in C IV and C III] that, adopting the same criteria for line profile comparison, can be reconciled with previous results from infrared spectroscopy obtained by Braibant et al. (2014). Using the measured microlensing magnification we estimate a size of light-days for the C IV emitting region affected by microlensing. In the case of WFI2033-4723, we have detected microlensing in two bumps situated on the blue and red wings of C III], confirming and extending previous microlensing evidence found in the blue wing (Sluse et al., 2012). In principle, the blue bump might be associated to an Al III emission line usually present in the red wings of the C III] emission line. Alternatively, we could interpret the two bumps as evidence of the double-peaked profile typical of disk kinematics, assuming that part of the C III] emission arises from the accretion disk. Using the measured microlensing magnification we estimate a size of light-days for the region of the disk emitting the microlensed bumps. Combining this size with the velocity inferred from the wavelength separation between the bumps we obtain an estimate of for the mass of the central supermassive black hole.
-
•
The ratios of the line emission cores show no evidence of chromaticity. This excludes both significant effects of microlensing on the regions generating the cores of the emission lines, and appreciable extinction.
-
•
Using the continuum and (core) emission line ratios, we estimate sizes of , , light-days, and slopes , , and for HE0435-1223, WFI2033-4723, and HE2149-2745 respectively. In the case of HE0435-1223 and WFI2033-4723, the good agreement between the sizes of the continuum and microlensed regions in the emission line wings also support the hypothesis that the latter arise from the accretion disk.
-
•
The measured continuum microlensing amplitude (in the three systems) and chromaticity (in WFI2033-4723 and HE2149-2745) are below the predictions of the thin disk model. This results in larger disk sizes and flatter temperature gradients than expected.
References
- Corrales (2015) Corrales, L. 2015, ApJ, 805, 23
- Hanisch & Biemesderfer (1989) Hanisch, R. J., & Biemesderfer, C. D. 1989, BAAS, 21, 780
- Lamport (1994) Lamport, L. 1994, LaTeX: A Document Preparation System, 2nd Edition (Boston, Addison-Wesley Professional)
- Schwarz et al. (2011) Schwarz, G. J., Ness, J.-U., Osborne, J. P., et al. 2011, ApJS, 197, 31
- Vogt et al. (2014) Vogt, F. P. A., Dopita, M. A., Kewley, L. J., et al. 2014, ApJ, 793, 127
- Abajas et al. (2007) Abajas, C., Mediavilla, E., Muñoz, J.A., Gómez-Álvarez, P., Gil-Merino, R. 2007, ApJ, 658, 748
- Anguita et al. (2008) Anguita, T., Schmidt, R. W., Turner, E. L., Wambsganss, J., Webster, R. L., Loomis, K. A., Long, D., McMillan, R. 2008, å, 480, 327
- Bate et al. (2008) Bate, N.F., Floyd, D.J.E., Webster, R.L., Wyithe, J.S.B. 2008, MNRAS, 391, 1955
- Blackburne et al. (2011) Blackburne, J.A., Pooley, D., Rappaport, S. and Schechter, P.L. 2011, ApJ, 729, 34
- Blackburne et al. (2014) Blackburne, J.A., Kochanek, C.S., Chen, B., Dai, X., Chartas, G. 2014, ApJ, 789, 125
- Braibant et al. (2014) R. Braibant, L.; Hutsemekers, D.; Sluse, D.; Anguita, T.; Garcia-Vergara, C. J. 2014, A&A, 565, L11
- Burud et al. (2002) Burud, I., Courbin, F., Magain, P., Lidman, C., Hutsemekers, D., Kneib, J.-P., Hjorth, J., Brewer, J., Pompei, E., Germany, L., Pritchard, J., Jaunsen, A.O., Letawe, G., Meylan, G. 2002, A&A, 383, 71
- Chang & Refsdal. (1979) Chang, K. & Refsdal, S., 1979, Nature, 282, 561
- Chartas et al. (2009) Chartas, G., Kochanek, C. S., Dai, X., Poindexter, S., and Garmire, G. 2009, ApJ, 693, 174
- Chen et al. (2012) Chen, B., Dai, X., Kochanek, C.S., Chartas, G., Blackburne, J.A., Morgan, C.W. 2012, ApJ, 693, 174
- Congdon et al. (2007) Congdon, A.B., Keeton, C.R., Osmer, S.J. 2007, MNRAS, 263, 272
- Courbin et al. (2011) Courbin, F., Chantry, V., Revaz, Y., Sluse, D., Faure, C., Tewes, M., Eulaers, E., Koleva, M., Asfandiyarov, I., Dye, S., Magain, P., van Wincke, H., Coles, J., Saha, P., Ibrahimov, M., and Meylan, G. 2011, A&A, 536, 53
- Dai et al. (2010) Dai, X., Kochanek, C.S., Chartas, G., Kozlowski, S., Morgan, C.W., Garmire, G., Agol, E. 2010, ApJ, 709, 278
- Edelson et al. (2015) Edelson, J.M. et al. 2015, A&A, 806, 129
- Eigenbrod et al. (2007) Eigenbrod, A., Courbin, F., Meylan, G. 2007, A&A, 465, 51
- Eigenbrod et al. (2008) Eigenbrod, A., Courbin, F., Meylan, G., Vuissoz, C., Magain, P. 2006, ApJ, 451, 759
- Fadely & Keeton (2011) Fadely, R., Keeton, C.R. 2011, AJ, 141, 101
- Fadely & Keeton (2012) Fadely, R., Keeton, C.R. 2012, MNRAS, 419, 936
- Floyd et al. (2009) Floyd, D.J.E., Bate, N.F., Webster, R.L. 2009, MNRAS, 398, 233
- Guerras et al. (2013) Guerras, E., Mediavilla, E., Jimenez-Vicente, J., Kochanek, C. S., Muñoz, J.A., Falco, E., Motta, V. 2013, ApJ, 764, 160
- Hainline et al. (2012) Hainline, L.J., Morgan, C.W., Beach, J.N., Kochanek, C.S., Harris, H.C., Tilleman, T., Fadely, R., Falco, E.E., Le, T.X. 2012, ApJ, 744, 104
- Hainline et al. (2013) Hainline, L.J., Morgan, C.W., MacLeod, C.L., Landaal, Z.D., Kochanek, C.S., Harris, H.C., Tilleman, T., Goicoechea, L.J., Shalyapin, V.N., Falco, E.E. 2013, ApJ, 774, A69
- Howarth (2004) Howarth, I.D., Murray, J., Mills, D., Berry, D.S. 2004, Starlink User Note 50.24, Rutherford Appleton Laboratory.
- Jiménez-Vicente et al. (2014) Jiménez-Vicente, J.; Mediavilla, E.; Kochanek, C. S.; Muñoz, J. A.; Motta, V.; Falco, E.; Mosquera, A. M. 2014, ApJ, 783, 47
- Jiménez-Vicente et al. (2015a) Jiménez-Vicente, J.; Mediavilla, E.; Kochanek, C. S.; Muñoz, J. A.; 2015a, ApJ, 806, 251
- Jiménez-Vicente et al. (2015b) Jiménez-Vicente, J.; Mediavilla, E.; Kochanek, C. S.; Muñoz, J. A.; 2015b, ApJ, 799, 149
- Kochanek et al. (2006) Kochanek, C.S., Morgan, N.D., Falco, E.E., McLeod, B.A., Winn, J.N., Dembicky, J., Ketzeback, B. (2006), ApJ, 640, 47
- Lopez et al. (1998) Lopez, S., Wucknitz, O., Wisotzki, L. 1998, A&A, 339, L13
- MacLeod et al. (2015) MacLeod, C.L., Morgan, C.W., Mosquera, A., Kochanek, C.S., Tewes, M., Courbin, F., Meylan, G., Chen, B., Dai, X., Chartas, G., 2015, A&A, 806, A258
- Mediavilla et al. (2006) Mediavilla, E., Muñoz, J.A., Lopez, P., Mediavilla, T., Abajas, C., González-Morcillo, C., Gil-Merino, R. 2006, ApJ, 653, 942
- Mediavilla et al. (2009) Mediavilla, E., and Muñoz, J.A., Falco, E., Motta, V., Guerras, E., Canovas, H., Jean, C., Oscoz, A., Mosquera, A.M. 2009, ApJ, 706, 1451
- Mediavilla et al. (2011) Mediavilla, E., Muñoz, J.A., Kochanek, C.S., Guerras, E., Acosta-Pulido, J., Falco, E., Motta, V., Arribas, S., Manchado, A., Mosquera, A. 2011, ApJ, 741, 42
- Mediavilla et al. (2015a) Mediavilla, E., Jiménez-Vicente, J., Muñoz, J. A., Mediavilla, T., Ariza, O. 2015a, ApJ, 798, 138
- Mediavilla et al. (2015b) Mediavilla, E., Jiménez-Vicente, J.; Muñoz, J. A., Mediavilla, T. 2015b, ApJ, 814, L26
- Morgan et al. (2004) Morgan, N.D., Caldwell, J.A.R., Schechter, P.L., Dressler, A., Egami, E., Rix, H.-W. 2004, AJ, 127, 2617
- Morgan et al. (2005) Morgan, N.D., Kochanek, C.S., Pevunova, O., Schechter, P.L. 2005, AJ, 129, 2531
- Morgan et al. (2010) Morgan, C.W., Kochanek, C.S., Morgan, N.D., Falco, E.E. 2010, ApJ, 712, 1129
- Morgan et al. (2012) Morgan, C.W., Hainline, L.J., Chen, B., Tewes, M., Kochanek, C.S., Dai, X., Kozlowski, S., Blackburne, J.A., Mosquera, A.M., Chartas, G., Courbin, F., Meylan, G. 2012, ApJ, 756, 52
- Mortonson et al. (2005) Mortonson, M. J., Schechter, Paul L., Wambsganss, J. 2005, ApJ, 628, 594
- Mosquera, Muñoz & Mediavilla (2009) Mosquera, A.M., Muñoz, J.A., Mediavilla, E. 2009, ApJ, 691, 1292
- Mosquera & Kochanek (2011) Mosquera, A.M., Kochanek, C.S., 2011, ApJ, 738, 96
- Mosquera et al. (2011) Mosquera, A. M., Muñoz, J. A., Mediavilla, E., & Kochanek, C. S. 2011, ApJ, 728, 145
- Motta et al. (2012) Motta, V., Mediavilla, E., Falco, E., Muñoz, J. A. 2012, ApJ, 755, 82
- Muñoz et al. (2011) Muñoz, J.A., Mediavilla, E., Kochanek, C.S., Falco, E., Mosquera, A. 2011, ApJ, 742, 67
- Muñoz et al. (2016) Muñoz, J.A., Vives-Arias H., Mosquera A. M., Jiménez-Vicente J., Kochanek C. S., Mediavilla E. 2016, ApJ, 817, 155
- Ochsenbein et al. (2000) Ochsenbein, F., Bauer, P., Marcout, J. 2000, A&AS, 143, 23
- Ofek et al (2006) Ofek, E. O., Maoz, D., Rix, H.-W., Kochanek, C. S., Falco, E. E. 2006, ApJ, 641, 70
- Poindexter et al. (2008) Poindexter, S., Morgan, N., Kochanek, C.S. 2008, ApJ, 673, 34
- Pooley et al. (2007) Pooley, D., Blackburne, J. A., Rappaport, S., Schechter, P. L. 2007, ApJ, 661, 19
- Pooley et al. (2009) Pooley, D., Rappaport, S., Blackburne, J., Schechter, P. L., Schwab, J., Wambsganss, J. 2009, ApJ, 697, 1892
- Pooley et al. (2012) Pooley, D., Rappaport, S., Blackburne, J., Schechter, P. L., Wambsganss, J. 2012, ApJ, 744, 111
- Popović et al. (2004) Popović, L.Ć., Mediavilla, E., Bon, E., Ilic, D. 2004, A&A, 423, 909
- Richards et al. (2004) Richards, G.T., Keeton, C.R., Pindor, B., Hennawi, J.F., Hall, P.B., Turner, E.L., Inada, N., Oguri, M., Ichikawa, S.-I., Becker, R.H., Gregg, M.D., White, R.L., Wyithe, J.S.B., Schneider, D.P., Johnston, D.E., Frieman, J.A., Brinkmann, J. 2004, ApJ, 610, 679
- Ricci et al. (2011) Ricci, D., Poels, J., Elyiv, A., Finet, F., Sprimont, P. G., Anguita, T., Bozza, V., Browne, P., Burgdorf, M., Calchi Novati, S., Dominik, M., Dreizler, S., Glitrup, M., Grundahl, F., Harpsøe, K., Hessman, F., Hinse, T. C., Hornstrup, A., Hundertmark, M., Jorgensen, U. G., Liebig, C., Maier, G., Mancini, L., Masi, G., Mathiasen, M., Rahvar, S., Scarpetta, G., Skottfelt, J., Snodgrass, C., Southworth, J., Teuber, J., Thone, C. C., Wambsganss, J., Zimmer, F., Zub, M., Surdej, J. 2011, å, 528, 42
- Rojas et al. (2014) Rojas, K., Motta, V., Mediavilla, E., Falco, E., Jiménez-Vicente, J., Muñoz, J.A. 2014, ApJ, 797, 61
- Schechter & Wambsganss (2002) Schechter, P.L., Wambsganss, J. 2002, ApJ, 580, 685
- Shakura & Sunyaev (1973) Shakura, N.I., Sunyaev, R.A. 1973, å, 24, 337
- Sluse et al. (2012) Sluse, D., Hutsemekers, D., Courbin, F., Meylan, G., Wambsganss, J., 2012, A&A, 544, A62
- Sluse & Tewes (2014) Sluse, D. & Tewes, D.,, 2014, A&A, 571, A60
- Sluse et al. (2015) Sluse, D., Hutsemekers, D., Anguita, T., Braibant, L., Riaud, P., 2012, å, 582, A109
- Vuissoz et al. (2008) Vuissoz, C., Courbin, F., Sluse, D., Meylan, G., Chantry, V., Eulaers, E., Morgan, C., Eyler, M. E., Kochanek, C. S., Coles, J., Saha, P., Magain, P., Falco, E. E. 2008, A&A, 488, 481
- Wambsganss (2006) Wambsganss, J. 2006, Annalen der Physik, 15, 43
- Wisotzki et al. (1996) Wisotzki, L., Koehler, T., Lopez, S., Reimers, D. 1996, A&A, 315, L405
- Wisotzki et al. (2002) Wisotzki, L., Schechter, P.L., Bradt, H.V., Heinmuller, J., Reimers, D. 2002, A&A, 395, 17
- Wisotzki et al. (2003) Wisotzki, L., Becker, T., Christensen, L., Helms, A., Jahnke, K., Kelz, A., Roth, M.M., Sanchez, S.F. 2003, A&A, 408, 455
- Witt et al. (1993) Witt, H. J., Kayser, R., Refsdal, S. 1993, A&A, 268, 501
- Wyithe et al. (2000) Wyithe, J. S. B., Webster, R. L., Turner, E. L. 2000, MNRAS, 312, 843