Double resonance of Raman transitions in a degenerate Fermi gas
Abstract
We measure momentum-resolved Raman spectra of a spin-polarized degenerate Fermi gas of 173Yb atoms for a wide range of magnetic fields, where the atoms are irradiated by a pair of counterpropagating Raman laser beams as in the conventional spin-orbit coupling scheme. Double resonance of first- and second-order Raman transitions occurs at a certain magnetic field and the spectrum exhibits a doublet splitting for high laser intensities. The measured spectral splitting is quantitatively accounted for by the Autler–Townes effect. We show that our measurement results are consistent with the spinful band structure of a Fermi gas in the spatially oscillating effective magnetic field generated by the Raman laser fields.
I Introduction
Spin-orbit coupling (SOC) interwines the motional degrees of freedom of a system with its spin part, giving rise to many intriguing phenomena such as the atomic fine structure, the spin Hall effect Kato2004 ; Konig2007 and topological insulators Hasan2010 . In ultracold atom experiments, SOC has been realized using Raman laser dressing techniques Lin2011 ; Goldman2013e ; Zhai2015a , where a two-photon Raman transition couples two different spin-momentum states. This optical method was successfully applied to many fermionic atom systems Wang2012 ; Cheuk2012b ; Song2016 ; Burdick2016 and recently extended to two-dimensions Huang2016 , boosting the interest in exploring new exotic SOC-driven many-body phenomena Zhai2015a ; Cao2014 ; Xu2014 .
Alkaline-earth-like atoms with two valence electrons such as ytterbium and strontium provide a beneficial setting for studying SOC physics. Their transition linewidth is narrow in comparison to the hyperfine structure splitting, which is helpful to alleviate the unavoidable heating effect due to light-induced spontaneous scattering under the Raman dressing Zhai2015a ; Song2016 and also to generate spin-dependent optical coupling to the hyperfine ground states. Furthermore, as recently demonstrated with 173Yb atoms Pagano2015 ; Hofer2015 , the interorbital interactions between the and states can be tuned via a so-called orbital Feshbach resonance Zhang15 , which would broaden the research scope of the SOC physics with alkaline-earth-like atoms.
In this paper, we present momentum-resolved Raman spectra of a spin-polarized degenerate Fermi gas of 173Yb atoms, which are measured in the Raman laser configuration of the conventional SOC scheme. In particular, we measure the Raman spectra over a wide range of magnetic fields as well as laser intensities to investigate the interplay of multiple Raman transitions in the SOC scheme. We observe that two Raman transitions become simultaneously resonant at a certain magnetic field and a doublet structure develops in the spectrum for strong Raman laser intensities. We find that the spectral splitting at the double resonance is quantitatively accounted for by the Autler–Townes doublet effect Autler1955 .
In the conventional SOC scheme, since one of the Raman laser beams has both and polarization components with respect to the quantization axis defined by the magnetic field, the Raman transition from one spin state to another, if any, can be made to impart momentum in either direction along the relative Raman beam propagation axis. In typical SOC experiments, the system parameters are set to make one of the transitions energetically unfavorable such that it can be ignored, but the double resonance observed in this work results from involving both of the Raman transitions. When all the Raman transitions are taken into account, the effect of the Raman laser fields is represented by a spatially oscillating effective magnetic field Jimenez-Garcia2012 . We show that our measurement results are consistent with the spinful band structure of the Fermi gas under the effective magnetic field.
The paper is organized as follows. In Sec. II, we describe our experimental apparatus and procedures for sample preparation and Raman spectroscopy. In Sec. III, we present the Raman spectra measured for various conditions and the observation of the spectral doublet splitting at the double resonance. In Sec. IV, we discuss the results in the perspective of the spinful band structure of the SO-coupled Fermi gas. Finally, a summary and outlooks are provided in Sec. V.
II Experiments
Figure 1(a) shows the schematic diagram of our experimental apparatus for generating a degenerate Fermi gas of 173Yb atoms Yb_machine . We first collect ytterbium atoms with a Zeeman slower and a magneto optical trap (MOT). For the slowing light, we use a 399 nm laser beam that has a dark spot at its center to suppress the detrimental scattering effect on atoms in the MOT. The frequency modulation method is adopted for the 556 nm MOT beams to increase the trapping volume and capture velocity of the MOT Fukuhara2007a . As a result, more than atoms are collected in the MOT within 15 s. We transfer the atoms into an optical dipole trap (ODT) formed by a focused 1070 nm laser beam, where the transfer efficiency is . Then, we transport the atoms by moving the ODT to a small appendant chamber which provides better optical access and allows high magnetic field application, and we generate a crossed ODT by superposing a focused 532 nm laser beam horizontally with the 1070 nm ODT.
After evaporation cooling, we obtain a quantum degenerate sample in the hyperfine ground state. For an equal mixture of the six spin components, the total atom number is and the temperature is , where is the Fermi temperature of the trapped sample. The spin composition of the sample can be manipulated during evaporative cooling with optical pumping or removal of spin states by resonant light. For the case of a fully spin-polarized sample in the state, and . The trapping frequencies of the crossed ODT are Hz at the end of the sample preparation.

The setup for Raman spectroscopy is illustrated in Fig. 2(a). A pair of counter-propagating laser beams are irradiated on the sample in the direction and an external magnetic field is applied in the direction. The two laser beams are linearly polarized in the and directions, respectively. With respect to the quantization axis defined by the magnetic field in the direction, Raman beam 1 with linear polarization has both and components and Raman beam 2 with linear polarization has a component. Thus, a two-photon Raman process, e.g., imparting momentum of by absorbing a photon from Raman beam 1 and emitting a photon into Raman beam 2 changes the spin number by either or , where is the wavenumber of the Raman beams. This is the conventional Raman laser configuration for SOC in cold atom experiments Lin2011 ; Wang2012 ; Cheuk2012b ; Burdick2016 .
The Raman lasers are blue-detuned by 1.97 GHz from the to transition [Fig. 2(b)]. This laser detuning, set between the hyperfine states of , is beneficial to induce spin-dependent transition strengths for the hyperfine spin states Mancini2015 ; Mancini2015a . The frequency difference of the two Raman beams is denoted by [Fig. 2(a)]. The two beams are set to the same power and focused onto the sample. Their intensity radii are m, which is much larger than the trapped sample size of 30 m. We assume that the laser intensities are uniform over the sample.
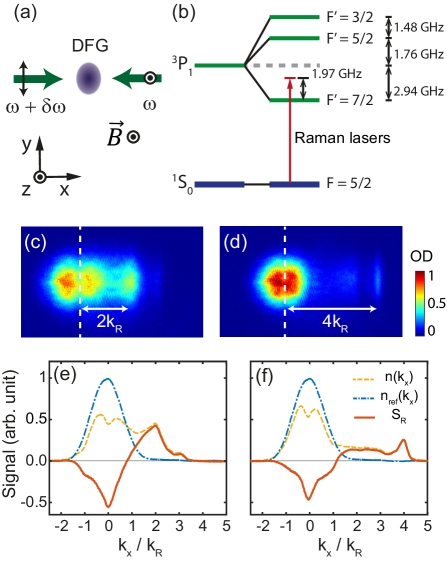
Raman spectroscopy is performed by applying a pulse of the Raman beams and taking a time-of-flight absorption image of the sample. The image is taken at G along the -axis with a linearly polarized probe beam resonant to the transition. Two exemplary images are shown in Fig. 2(c) and 2(d), showing that atoms are scattered out of the original sample with different momenta for different . Since the expansion time is sufficiently long such that , we interpret the time-of-flight image as the momentum distribution of the atoms. The 1D momentum distribution is obtained by integrating the image along the direction [Fig. 2(e) and 2(f)], where with being the atomic mass and the displacement from the center of mass of an unperturbed sample. In our imaging, the absorption coefficient for each spin state was found to vary slightly, within % [Fig. 1(b)], which we ignored in the determination of .
The normalized Raman spectrum is measured as
| (1) |
where is the reference distribution obtained without applying the Raman beams. In the spectrum, a momentum-imparting Raman transition appears as a pair of dip and peak, which correspond to the initial and final momenta of the transition, respectively. We observe that the spectral peaks and dips exhibit slightly asymmetric shapes, which we attribute to elastic collisions of atoms during the time-of-flight expansion Veeravalli2008 . The Fermi momentum of the sample is in units of the recoil momentum.
III Results
The atomic state in an ideal Fermi gas is specified by wavenumber and spin number , and its energy level is given by
| (2) |
The first term is the kinetic energy of the atom and the second term is the Zeeman energy due to the external magnetic field , where is the Landé -factor and is the Bohr magneton. The last term denotes the spin-dependent ac Stark shift induced by the Raman lasers. For a Raman transition from to , which changes the momentum by and the spin number by , the energy conservation requires , which gives the resonance condition for the initial wavenumber as
| (3) |
where kHz is the atomic recoil energy, G and . Here we neglect the quadractic Zeeman effect and the atomic interactions which are negligible in our experimental conditions.
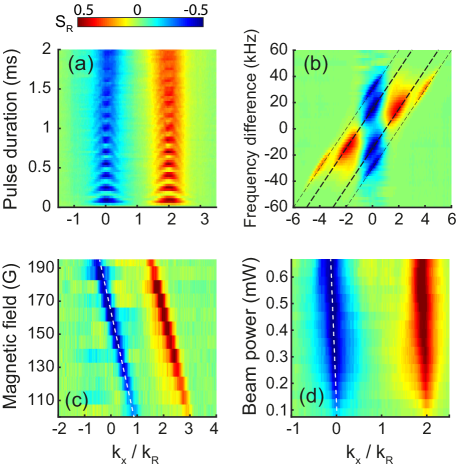
We first investigate the resonance condition of Eq. (3) by measuring its dependence on various experimental parameters. Figure 3(a) shows a Raman spectrum measured by scanning the Raman beam pulse duration for at G. Spin-polarized samples were used and both of the Raman beams were set to linear polarization to make sure . Momentum-dependent Rabi oscillations are clearly observed and the Rabi frequency is found to be well described by with kHz. The decoherence time is measured to be ms, which seems to be understandable with the characteristic time scale for momentum dephasing in the trap, ms. In the following, we set the pulse duration of the Raman beam to 2 ms, which is long enough to study the steady state of the system under the Raman laser dressing.
Figure 3(b) displays a spectrum of the equal mixture sample in the plane of wavenumber and frequency difference . Here, G and the Zeeman effect is absent in the measurement. The and transitions are identified in the spectrum with their spectral slope of and different offsets as predicted by Eq. (3). The symmetry of the spectrum indicates that the differential ac Stark shift is negligible in the measurement.
Figure 3(c) shows the Raman spectrum of the spin-polarized sample over a range of magnetic fields from G to 195 G for . In the spectral plane of and , the Raman transition with appears as a line having the slope as expected from Eq. (3). A linear spectral shift is observed with increasing Raman beam power [Fig. 3(d)], which demonstrates the effect of the differential ac Stark shift . In our experiment, for mW. This is in good a agreement with the Raman beam intensities estimated from the Rabi oscillation frequency , where are the intensities of the Raman beam 1 and 2, respectively. The comparison of and suggests , which we attribute to a slight mismatch of the beam waists.
Next we investigate a situation where one spin-momentum state is resonantly coupled to two final states simultaneously, which we refer to as a double resonance. When the two corresponding Raman processes are characterized with and , we see from Eq. (3), neglecting the small term, that the double resonance occurs when
| (4) |
For the primary transition with , the double resonance condition is satisfied at .
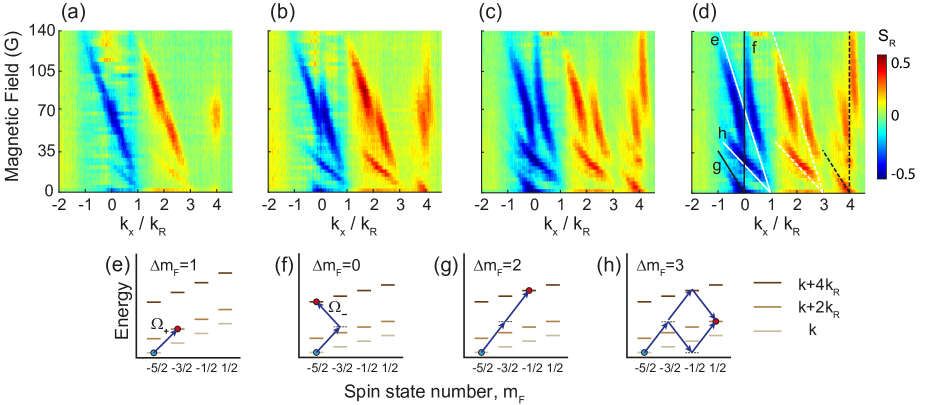
To observe the double resonance of the and transitions at G, we measure the Raman spectra of the spin-polarized sample in the - plane over a range from G to 140 G [Fig. 4]. Here we set to have atoms on resonance for the transition, which is insensitive to for . For low , the transition appears with the spectral slope of as observed in Fig. 3(c) and the double resonance is indicated by a small signal at [Fig. 4(a)]. This is understood as enhancement of the second-order Raman transition from to due to its intermediate state being resonant. When the Raman beam power increases, we observe development of a spectral splitting at the resonance [Figs. 4(b) and 4(c)]. The overall pattern of the high- spectrum shows the avoided crossing of the spectral lines corresponding to the two and transitions.
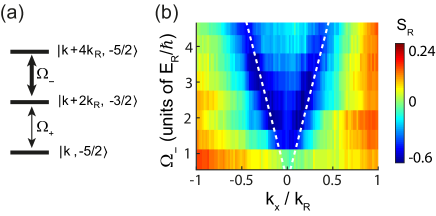
Near the double resonance, the system can be considered as a three-level system consisting of , and [Fig. 5(a)]. For simplicity, we denote them by , , and , respectively. Since the Raman transition between and involves the component of Raman beam 1 but that between and involves the component, the coupling strengths and of the two transitions, respectively, can be different. In our case with 173Yb atoms in the state, . Since the coupling between and are much stronger than that between and , the observed spectral splitting with increasing Raman beam intensity can be described as an Autler–Townes doublet Autler1955 : two dressed states and are formed with and under the strong coupling and their energy level splitting is probed via Raman transitions from the initial state. In the rotating wave approximation, the energy levels of the two dressed states are given by , where . The resonant wavenumbers of the initial state are determined from and for and , we obtain . We find our measurement results on the double resonance at in good quantitative agreement with the estimation [Fig. 6(b)]. The coupling strength was separately measured from the Rabi oscillation data of the transition for at G.
The Raman spectra in Fig. 4 reveal another double resonance at G, where the line crosses the line. Although the transition is a third-order Raman transition, its spectral strength is observed to be higher than that of the (2,0) transition. In the intermediate region of G, many Raman transitions are involved over the whole momentum space of the sample and the spectral structure for high Raman laser intensity shows interesting features which cannot be simply explained as crossing and avoided crossing of the spectral lines. It might be necessary to take into account the ac Stark shift effect and a further quantitative analysis of the Raman spectra will be discussed in future work.
IV Discussion
In the Raman laser dressing scheme described in Fig. 2(a), two ways of couplings are allowed between the two spin states because the Raman beam that has linear polarization orthogonal to the magnetic field contains both and components. This means that a Raman transition from one spin state to the other spin state can occur while imparting momentum in either of the and directions. In typical experimental conditions Zhai2015a ; Lin2011 ; Cheuk2012b ; Wang2012 , one of the couplings is resonantly dominant over the other, giving rise to a form of SOC that has equal strengths of the Rashba and Dresselhaus contributions. However, when the Fermi sea of a sample covers a large momentum space, this approximation cannot be applied and it is necessary to include both of the Raman couplings for the full description of the system. Furthermore, as observed in the previous section, the two Raman couplings can be doubly resonant and play cooperative roles in the SOC physics of the system.
As an archetypal situation, we consider a spin-1/2 atom under the Raman dressing for . Here, the counterpropagating Raman beams form a stationary polarization lattice with spatial periodicity of . Including all the allowed Raman transitions, the effective Hamiltonian of the system is given by
| (5) | |||||
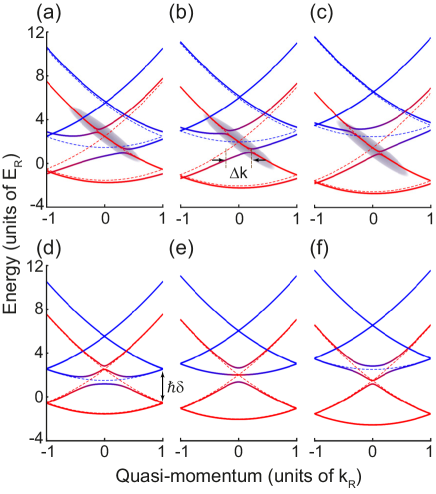
where is the sum of the differential Zeeman and ac Stark shifts, are the Pauli matrices, and . The final form of shows that the Raman dressing is equivalent to an effective magnetic field , which has two parts: a bias field along the axis and a spatially oscillating field on the - plane. Its chirality is determined by the sign of . In the presence of the spatially oscillating magnetic field, the energy dispersion of the atom has a spinful band structure [Fig. 6].
Figure 6(b) displays a band structure for and , which straightforwardly explains the observed spectral splitting at the double resonance. In the experiment, and the polarization lattice of the Raman beams moves in the lab frame with velocity of . Initially, the atoms in the trapped sample occupy the low quasi-momentum region of the second and third bands of the bare spin-down state, which is indicated by a gray region in Fig. 6(b), and they are projected to the eigenstates of the spinful band structure via the Raman spectroscopy process. The quasi-momentum separation between the gap opening positions, which is marked with in Fig. 6(b), is the spectral splitting observed in our Raman spectrum. We note that in the symmetric case of [Fig. 6(e)] and the spectral splitting would not occur in the Raman spectrum.
V Summary and outlook
We have measured the Raman spectra of a spin-polarized degenerate Fermi gas of 173Yb atoms in the conventional SOC scheme and investigated the double resonance of Raman transitions. We observed the development of a spectral splitting at the double resonance of the and transitions and provided its quantiative explanation as the Autler–Townes doublet effect. Finally, we discussed our results in the context of the spinful energy band structure under the Raman laser dressing.
In general, when the system has multiple SOC paths in its spin-momentum space, a spinful energy band structure is formed because of the periodicity imposed by them. In previous experiments Jimenez-Garcia2012 ; Cheuk2012b , spinful band structures were designed and demonstrated by applying a RF field to the SO-coupled systems under the Raman laser dressing, where the role of the RF field was to open an additional coupling path between the two spin states. The results in this work highlight that the conventional Raman laser dressing scheme provides two ways of SOC and intrinsically generates a spinful band structure without the aid of an additional RF field. An interesting extention of this work is to investigate the magnetic ordering and properties of a Fermi gas in the spatially rotating magnetic field . In the 173Yb system, the chirality of can be controlled to some extent by the choice of the two spin states that are coupled by the Raman lasers. If the states are employed, and changes from an axial field to a alternating transverse field as a function of . In particular, when , points are periodically placed, which might profoundly affect the magnetic properties of the system. It was discussed in Ref. Cheuk2012b to engineer a flat spinful band structure, which might be pursued via proper tuning of the parameters of our system.
VI Acknowledgments
This work was supported by IBS-R009-D1 and the National Research Foundation of Korea (Grant No. 2014-H1A8A1021987).
References
- (1) Y. K. Kato, R. C. Myers, A. C. Gossard, and D. D. Awschalom, Observation of the Spin Hall Effect in Semiconductors, Science 306, (2004).
- (2) M. König, S. Wiedmann, C. Brüne, A. Roth, H. Buhmann, L. W. Molenkamp, X.-L. Qi, and S.-C. Zhang, Quantum Spin Hall Insulator State in HgTe Quantum Wells, Science 318, (2007).
- (3) M. Z. Hasan and C. L. Kane, Colloquium: Topological insulators, Rev. Mod. Phys. 82, 3045 (2010).
- (4) Y.-J. Lin, K. Jiménez-García, and I. B. Spielman, Spin-orbit-coupled Bose-Einstein condensates, Nature 471, 83 (2011).
- (5) N. Goldman, G. Juzeliũnas, P. Öhberg, and I. B. Spielman, Light-induced gauge fields for ultracold atoms, Reps. Prog. Phys. 77, 126401 (2014).
- (6) H. Zhai, Degenerate quantum gases with spin-orbit coupling: a review, Reps. Prog. Phys. 78, 26001 (2015).
- (7) P. Wang, Z.-Q. Yu, Z. Fu, J. Miao, L. Huang, S. Chai, H. Zhai, and J. Zhang, Spin-Orbit Coupled Degenerate Fermi Gases, Phys. Rev. Lett. 109, 095301 (2012).
- (8) L. W. Cheuk, A. T. Sommer, Z. Hadzibabic, T. Yefsah, W. S. Bakr, and M. W. Zwierlein, Spin-Injection Spectroscopy of a Spin-Orbit Coupled Fermi Gas, Phys. Rev. Lett. 109, 095302 (2012).
- (9) B. Song, C. He, S. Zhang, E. Hajiyev, W. Huang, X.-J. Liu, and G.-B. Jo, Spin-orbit-coupled two-electron Fermi gases of ytterbium atoms, Phys. Rev. A 94, 061604 (2016).
- (10) N. Q. Burdick, Y. Tang, and B. L. Lev, Long-Lived Spin-Orbit-Coupled Degenerate Dipolar Fermi Gas, Phys. Rev. X 6, 31022 (2016).
- (11) L. Huang, Z. Meng, P. Wang, P. Peng, S.-L. Zhang, L. Chen, D. Li, Q. Zhou, and J. Zhang, Experimental realization of two-dimensional synthetic spin-orbit coupling in ultracold Fermi gases, Nat. Phys. 12, 540 (2016).
- (12) Y. Cao, S.-H. Zou, X.-J. Liu, S. Yi, G.-L. Long, and H. Hu, Gapless Topological Fulde-Ferrell Superfluidity in Spin-Orbit Coupled Fermi Gases, Phys. Rev. Lett. 113, 115302 (2014).
- (13) Y. Xu, L. Mao, B. Wu, and C. Zhang, Dark Solitons with Majorana Fermions in Spin-Orbit-Coupled Fermi Gases, Phys. Rev. Lett. 113, 130404 (2014).
- (14) G. Pagano, M. Mancini, G. Cappellini, L. Livi, C. Sias, J. Catani, M. Inguscio, and L. Fallani, Strongly Interacting Gas of Two-Electron Fermions at an Orbital Feshbach Resonance, Phys. Rev. Lett. 115, 265301 (2015).
- (15) M. Höfer, L. Riegger, F. Scazza, C. Hofrichter, D. R. Fernandes, M. M. Parish, J. Levinsen, I. Bloch, and S. Fölling, Observation of an Orbital Interaction-Induced Feshbach Resonance in 173Yb, Phys. Rev. Lett. 115, 265302 (2015).
- (16) R. Zhang, Y. Cheng, H. Zhai, and P. Zhang, Orbital Feshbach Resonance in Alkali-Earth Atoms, Phys. Rev. Lett. 115, 135301 (2015).
- (17) S. H. Autler and C. H. Townes, Stark Effect in Rapidly Varying Fields Phys. Rev. 100, 703 (1955).
- (18) K. Jiménez-García, L. J. LeBlanc, R. A. Williams, M. C. Beeler, A. R. Perry, and I. B. Spielman, Peierls substitution in an engineered lattice potential, Phys. Rev. Lett. 108, 225303 (2012).
- (19) M.-S. Kim, M. Lee, J. H. Han, and Y. Shin, Experimental apparatus for generating quantum degenerate gases of ytterbium atoms, J. Korean Phys. Soc. 67, 1719 (2015).
- (20) T. Fukuhara, Y. Takasu, M. Kumakura, and Y. Takahashi, Degenerate Fermi gases of ytterbium, Phys. Rev. Lett. 98, 030401 (2007).
- (21) S. Taie, Y. Takasu, S. Sugawa, R. Yamazaki, T. Tsujimoto, R. Murakami, and Y. Takahashi, Realization of a SU(2)SU(6) System of Fermions in a Cold Atomic Gas, Phys. Rev. Lett. 105, 190401 (2010).
- (22) S. Stellmer, R. Grimm, and F. Schreck, Detection and manipulation of nuclear spin states in fermionic strontium, Phys. Rev. A 84, 043611 (2011).
- (23) M. Mancini, G. Pagano, G. Cappellini, L. Livi, M. Rider, J. Catani, C. Sias, P. Zoller, M. Inguscio, M. Dalmonte, and L. Fallani, Observation of chiral edge states with neutral fermions in synthetic Hall ribbons, Science 349, 1510 (2015).
- (24) M. Mancini, Quantum Simulation with Ytterbium Atoms in Synthetic Dimensions, Ph. D. thesis (2015).
- (25) G. Veeravalli, E. Kuhnle, P. Dyke, and C. J. Vale, Bragg Spectroscopy of a Strongly Interacting Fermi Gas, Phys. Rev. Lett. 101, 250403 (2008).