How long delays impact TCP performance for a connectivity from Reunion Island ?
Abstract
TCP is the protocol of transport the most used in the Internet and have a heavy-dependence on delay. Reunion Island have a specific Internet connection, based on main links to France, located away. As a result, the minimal delay between Reunion Island and France is around . In this paper, we will study TCP traces collected in Reunion Island University. The goal is to determine the metrics to study the impacts of long delays on TCP performance.
Index Terms:
Passive metrology, TCP, Internet Delay.I Introduction
Internet has evolved to become a large network where services will differ according to the user’s need. Internet can be used, as it first purpose was, to send mail or use the World Wide Web (WWW). Now, on-line gaming, audio or videao discussion are currently used on the Internet. But all these new services require low delay for interactivity. Due to the difficulty of using news transport protocols, these news services continue to use Transmission Control Protocol (TCP). This transport protocol is very sensitive to the variation of the delay. There are some geographic areas where the delay is higher than usual. In [1], the authors have shown that Reunion Island has a specific behavior in terms of routing and delay. In this paper, we would investigate the impact of these characteristics on the performance of TCP.
After a selection of specific metrics, we have collected a total of 72 Gigabytes of data by passive metrology during one month using a listener. The analysis of the files revealed two evidences:
-
1.
Up of 78% of the traffic is going outside of the Island.
-
2.
There is a strong presence of TCP in collected traffic. One most interesting finding is that HTTPS take near half of the service used by TCP.
The remainder of this paper is organized as follows. The section II explains the specific context of physical connectivity of Reunion Island. A description of the suitable metrics to analyze TCP traffic have been determined in the section III, whereas the section IV presents the tools used to capture and to analyze TCP traces. The section V presents the methodology to collect traffic. Collected traffic is analyzed in section VI. We complete the paper with the overview of related work in section VII and our conclusions in section VIII.
II Context
Reunion Island is a French overseas department located far away from France: in the Indian Ocean, between Madagascar and Mauritius. On the map 1, we can see that Reunion Island is connected to the Internet by two submarine cables.
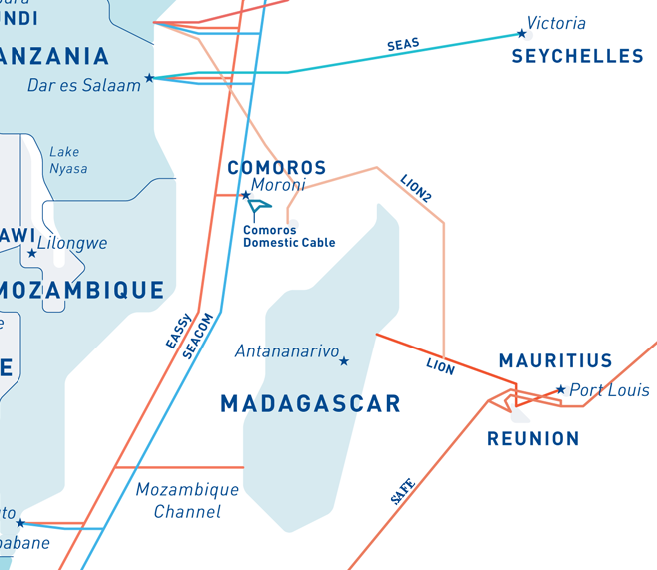
The first one is the South Africa Far East (SAFE) spans from Asia (India and Malaysia) to South Africa. The SAFE is extended by the SAT3-WASC (South Africa Transit 3/West Africa Submarine Cable) cable which connected West Africa to Europe. The Lower Indian Ocean Network (LION) and LION2 cables connect, as its name indicates, the lower part of the Indian Ocean to a range of submarine cables in East Africa. This means that Reunion Island is connected to four landing points namely West Africa and Europe, East Africa and Asia. The author of [2] compared the Internet latency observed from Reunion Island and Paris.
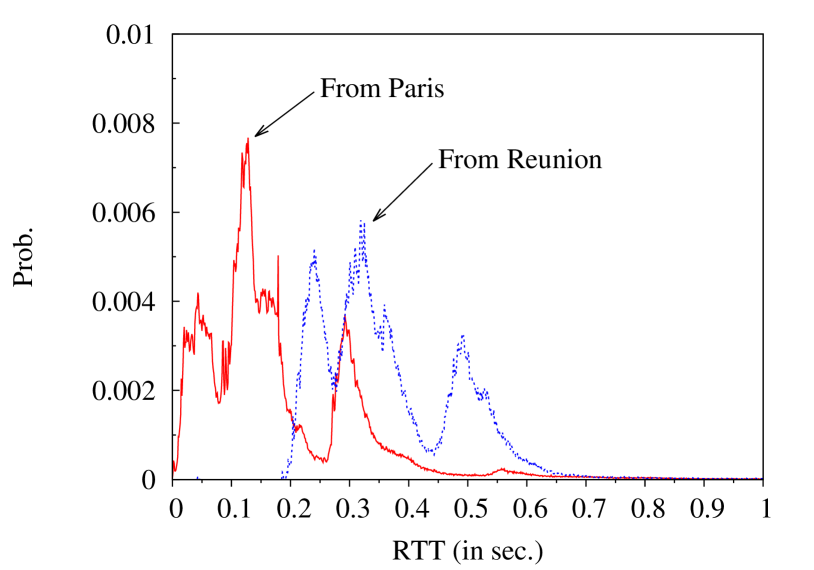
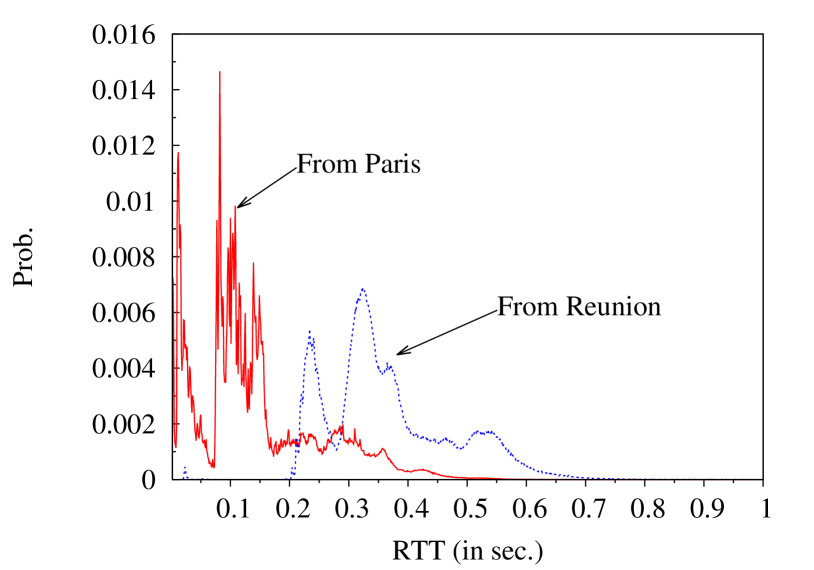
The figures 2(a) and 2(b) represents the Probability Density Function (PDF) of the Round-Trip Time (RTT). The RTT was evaluated with the ping command on a sample of IPv4 addresses distributed over the world. The first part colored in blue in 2 represents the density probability for delay from Reunion Island, while the red depicts the PDF from Paris. On the first figure, the two curves have the same trend with a shift. To get a better comparison, we have updated this result with one new experiment. The figure 2(b) shown the updated results. The red curve shows a shorter delay than before, while the minimal delay from Reunion Island has increased. The delay from Reunion Island was smooth through time between the two experiments.
This is one reason why we will study the impact of this specific connectivity on the transport protocol performance.
III Metrics
In this section, we would describe each metric we have chosen to analyze TCP traffic. We have split the metrics in two categories: supervision and performance.
III-A Traffic Supervision
In this class of metrics, we would only have a view of the traffic exchange, as an ISP could have.
The first concern is the volume exchanged with IPv4 protocol. In this volume, we would make a distinction in terms of destination. We divide the collected traffic in 3 categories:
-
1.
The first one is traffic in Local Area Network (LAN) and concerned only traffic inside the intranet of collected points.
-
2.
The second one can be associated to traffic in Metropolitan Area Network (MAN). With the presence of an Internet eXchange Point (IXP), we will, in this case, consider traffic intra-Reunion Island.
-
3.
The last case is Wide Area Network (WAN) traffic and identified traffic going outside of the Island.
The analyze of destinations included in the WAN part would give us some indications about the location of the information needed by the user. Our second metric we have focused on is the traffic’s volume of different protocols of transport, like TCP and UDP. This would inform us of the most used protocol and if the services use the right protocol.
Lastly, the number of the destination ports will give us an overview of services that have been used.
III-B Protocol performance
The TCP is the principal protocol of transport used around the world with heavy-dependence on delay. Studying its performance is equivalent to study Internet performance. In [3], the author has explained the functioning of a system based on requests. The figure 3 has been taken from his book. We used it for choosing which TCP metrics should be used.

The first and the second metrics are the RTT and the throughput.
Some event could be easily identified, like packets losses and retransmits.
We define a flow as a bi-directional series of IP packet with the same source and destination address, port number and protocol number.
III-C Summary
The table I resume all the metrics choose for the experiment.
| Traffic Supervision | Traffic characterization | LAN |
| MAN | ||
| WAN | ||
| Protocol Transport | ||
| Geographic Destination | ||
| Services Used | ||
| IPv4 volume exchanged | ||
| Protocol Performance | TCP performance | Congestion Event |
| Losses | ||
| Retransmissions | ||
| Out of Order | ||
| Windows | ||
| Flags | ||
| Connection Established Problem | ||
| Delay | ||
| Throughput | ||
| Flows characterization | Size | |
| Duration | ||
| Rate | ||
IV Tools involved
IV-A TCPDump
IV-B Anonymization
In agreement with the French law [6], we need to anonymize the data obtained before the analysis. The article [7] explain that an Internet packet contains private information and need to be removed before analysis. The author describes a tool to anonymize confidential information. But in [8], Xu explains some lack in TCPdriv and proposes a new solution called Crypto-pan. Crypto-pan is the most anonymized algorithm used actually. This program used the prefix-preserving system, which means that if two IP address have k-bits in common, their anonymized address keep k-bits in common.
IV-C Analysis
As said in IV-A, PCAP is a library with several tools for traces analysis. One of the most well-know tool is Wireshark [9]. Wireshark can be used with a graphic-interface. But this tool is not adapted to our need, i.e. it doesn’t take into account the geolocation of an IP address or it can’t anonymize the raw data. To fill this gap, we have developed our own tool to obtain information about all metrics stated in section III. This tool, developed in C, includes Crypto-pan concept and focuses only on the metrics we have selected.
V Methodology
The first study on Reunion Island connectivity was realized with the help of the Internet Service Provider (ISP) was made in 2013 by [10]. In this paper, the authors have used active metrology to analyze the characteristics of the Reunion Island’s Internet. To identify the performance of TCP, a better way is the listening of traffic and to analyze what happens in real-time or later. ISP information about their performances are very sensitive data, and this is the reason why they don’t want to share it. To respect their publishing data politics, we have made our own measurement infrastructure. Deployed in the Computer Sciences and Mathematics Laboratory (LIM) of Reunion Island University, we have collected data traffic from students and researchers. The collected data have been realized between one and 23 hours per day with port-mirroring protocol [11]. The start and the duration of each measurement have been randomized. Two measurements have a maximal distance of 24 hours. We are fully aware that our collection is not representative of Reunion Island’s traffic, but still a good set of tests for our analyze tools.
VI Results
The results illustrated the output obtained by our analysis tool. It can be divided in two main parts. In subsection VI-A, we have the results of the supervision of the data collected. The subsection VI-B concerns the analysis of the characteristics of the flows and the performance of TCP.
VI-A Traffic characteristics
The LIM laboratory and in fact all laboratories and faculties of our University are connected to the Internet through a fiber access with a bandwidth of 500 Mbits/s with RENATER as ISP. RENATER is the French network reserved for Universities and research centers. During the month, we have collected 72 Gigabytes of data. This data concerned only IPv4 because IPv6 is not available in Reunion Island University.
As we stated before, we have three kinds of networks that have been analyzed: LAN (local network), MAN (network flow in Reunion Island) and WAN (network flows outside Reunion Island). With the analyze of the IP address, we have spread the traffic into three categories. The table II shown the results obtained.
| Traffic | LAN | MAN | WAN |
|---|---|---|---|
| Percent | 21.65 | 0 | 78.35 |
The WAN part is the main traffic of the laboratory. That’s mean the information needed by the user is mainly located outside of the University or Reunion Island.
The table III represent the geographical distribution of the IP addresses only present in the WAN traffic and has been regrouped by continents.
| Continent | Africa | Asia | Europe | North America |
| Percent | 1.31 | 5.26 | 28.95 | 64.47 |
We can notice that two continents, Oceania and South America, are not present in our data. It is surprising because the Laboratory has some partnerships present in Australia, for example.
The table IV represent the distribution of the protocol of transport from the Computer Science Laboratory by analyzing each packet captured. The first remarkable result is the presence of Internet Control Message Protocol (ICMP) packet. The presence of of ICMP packets is due to a measurement delay campaign as it has been explained in [1].
| Protocol | ICMP | IGMP | TCP | UDP |
| Percent | 5.72 | 0.01 | 92.49 | 1.78 |
The percentage of UDP is low if we are taking into consideration the fact that Google Chrome is the most used browser in Reunion Island as presented on a website111http://gs.statcounter.com/#browser-RE-monthly-201511-201612. This web browser has an option call QUIC which increase the performance of the browser by using HyperText Transport Protocol (HTTP) over User Datagram Protocol (UDP) [12].
Needless to say, TCP have the higher percentage between the different protocol. One reason can be that Reunion Island’s University have set up some rules to limit the traffic generated by the users and closed some port. For example, Skype is prohibited as call-conference and the majority of TCP ports except the common like 22 for Secure-Shell (SSH) or 25 for Simple Mail Transfer Protocol (SMTP) are closed.The table V illustrate the analyze of TCP ports.
| Service | SSH | DNS | Non indentified | Other | HTTPS | HTTP | |
| Percent | 0.02 | 1.63 | 4.91 | 7.21 | 9.45 | 32.97 | 43.79 |
The item Non identified regroup all port number without any matching in the file ’service’ located on the analysis server. Other identify protocols with a percentage lower than 1%. The presence of SSH is explained by its frequently use to push data on the web-server of the laboratory or to connect to distant servers. The Mail item regroup five protocols consecrate to send or receive email, like Post Office Protocol (POP), SMTP or Internet Message Access Protocol (IMAP) and their secured version, POP3s, IMAPs. But these protocols are only present if you use an email application like Thunderbird or Outlook. If you connected to Gmail and use the web interface, it will be considered as HTTP or HTTPS.
The huge presence of TCP is the reason why we will make an analyze of the performance of this protocol in order to explain the sensation of slowness described by users.
VI-B TCP Performance
We have analyzed the different types of flows present in the data analysis. The figure 4(a) represent the Cumulative Density Function (CDF) for the flow length L in packets.
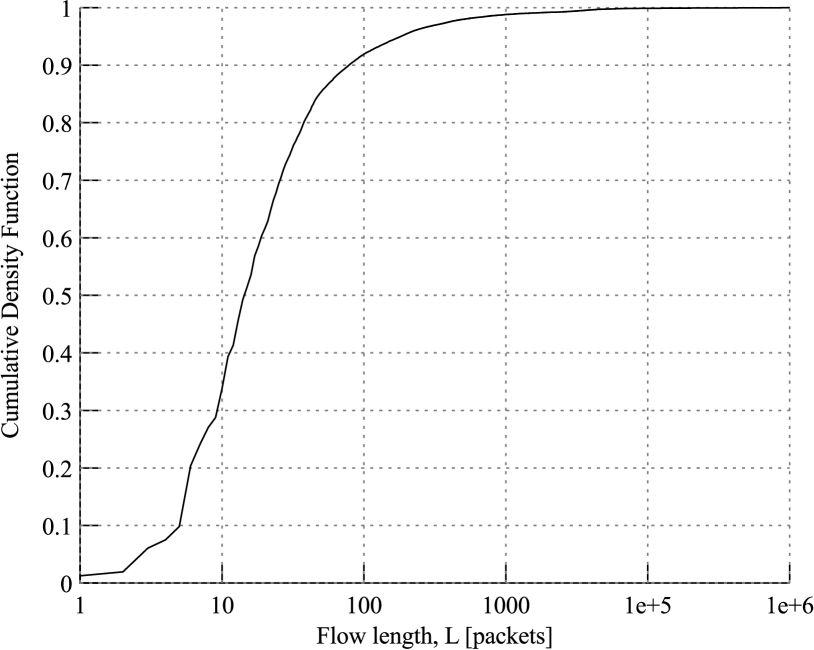
We can notice that more than 90% of our flows are composed of fewer than 100 packets. These flows represent % of the volume exchange in bytes. That supposed that the packet exchanged are heavy in terms of data.
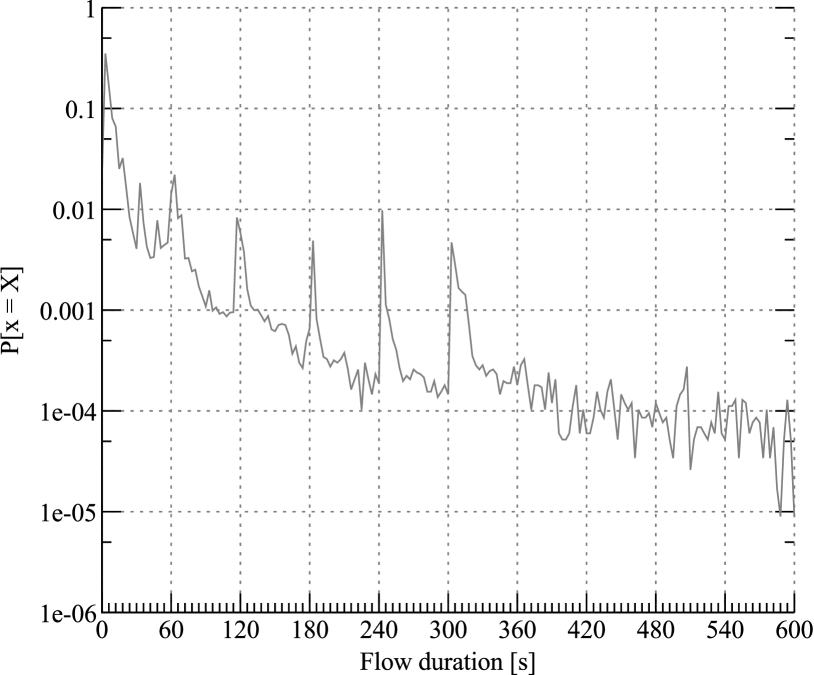
The figure 4(b) represent the PDF for the flow duration in seconds. The bin used for the PDF is 3s. We can see that the first peak represents the Recovery Time Objective (RTO) of TCP. These flows represent only % of the volume exchange. Exceed the RTO, the probability of the duration decrease. We can notice that on the figure, every 60s, a peak are present. The flows exceeding 300s (5 min) represent 59% of the volume exchange. That means more the flows carry on, more the volume exchange increase.
With the figure 5, we can analyze the meaning throughput of each flow.
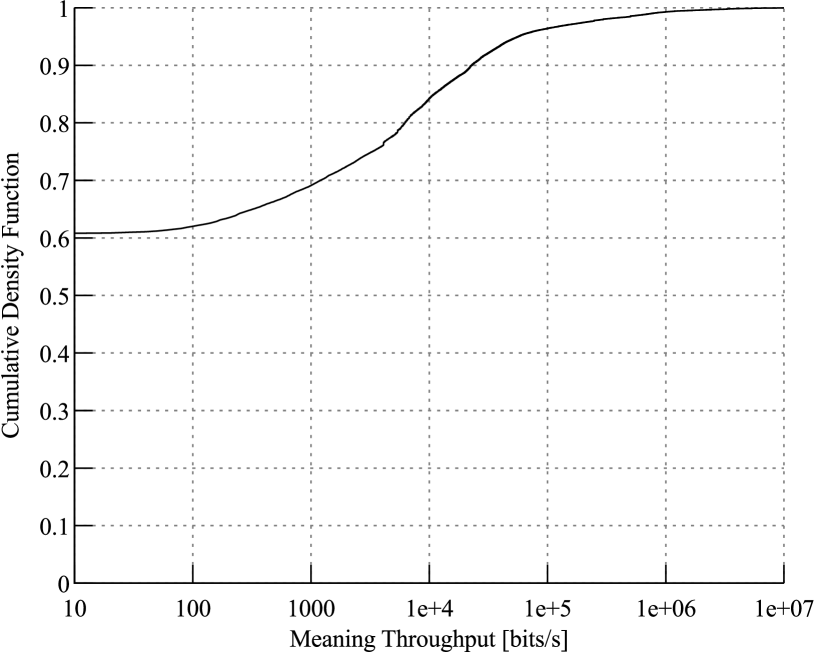
We can notice that 60% of our traffic have a meaning throughput less or equal than bits per seconds, but this majority represent only less than of the volume exchange. That’s mean the flows are very light in terms of bytes exchange, and could be composed by Keep-Alive packet.
TCP is a protocol relying on delay but Reunion Island have a specific behavior on this parameter [1]. A supposition we can do is that Reunion Island’s traffic is very sensitive to congestion events. We have two ways to confirm it.
-
1.
The first one is to identify the different flag of the flow and see if the Explicit Congestion Notification(ECN) [13] and the Congestion Window Reduce (CWR) flags are put to one.
-
2.
The second way is to identify the reduction of TCP’s windows and see what happens after.
With the first way of Congestion Event identification, none event was found. That means the different flag for the management of congestion event didn’t rise up. The authors of [14] shown that the number of servers which answered to ENC negotiation has increased. The missing of mark on the client side could be explained by two hypothesis. The first one is the obsolescence of the computer used in the Laboratory. But the machine used by our colleagues have been bought recently (current 2015 for someone). The second hypothesis is the remove of the flag by the equipment. In both hypotheses, the absence of the ECN flags are harmful for the TCP performance. In [15], the authors have made some traffic simulation about TCP performance and packet marked. The results shown that the performance of TCP will increase when the packets have been marked. Without these flags, the Congestion event is more difficult to identify. The second way is more difficult to set up. We need to identify the windows reduced and see if we could identify some Lost Packet around this event. We have identified packets which indicate a window reduction. It’s represented only percent of the packets exchange. But with only flows, a flow has % of chance to include a packet marked Windows reduce. The tabular VI represent the percent of packets retransmits or losses.
| Packets | Fast Retransmit | Spurious Retransmit | Lost Packet | None retransmit or lost |
| Percent |
We can see that the percent of packets retransmits or losses are like crumbs, with less than 1%. The percent of these errors are less than TCP could produce in normal condition.
VII Related works
A description of Cuba Internet’s connectivity has been done in [16]. The authors have shown that, despite a similar Internet access than Reunion Island, Cuba have an Internet latency near to the general case. This general case was presented in [17], where a relation between delay and geographical distance have been made. The authors of [1] have proved that Reunion Island is a specific case. In analyzing the Internet performance of the African continent, several studies have been made. In 2001, [18] have highlighted that the delay is very high and the HTTP response very low in rural area of Africa. In comparison with us, their flows are less longer, with 60% of their traffic have a duration lower than 2 seconds. The presence of flow durations higher than 10 minutes is a little fraction (0.47%) but are still present in the analyze. Another study has been done in a rural area of the African continent, more specifically in Zambia. The study has been done in 2005 by the author of [19] after an upgrade of the bandwidth. However, the meaning delay to reach services stayed higher than elsewhere.
A recent research about the presence of services in Africa has been explained in [20]. The author has explained that despite the presence of servers in the continent, most of the traffic continues to go to America. It is a very similar situation as in Reunion Island with France servers.
VIII Conclusion
Making a campaign of passive metrology is the second step for a better knowledge of the reasons why the Internet is degraded in some regions. Reunion Island has a specific connectivity to the Internet, with two submarine cables and a routing rules which made that the majority of the traffic going through France. Our study shows that up to 78% of the LIM traffic is to WAN and TCP is the most important transport protocol used in Reunion Island. Studying its performance is important to identify the default of the Reunion Island connectivity but the filter set up by the University impact our results. The analysis shows that the feeling of slowness didn’t come from the performance of TCP but only due to the delay and the routing rules. In the future, we will contact the ISP working on Reunion Island and try to make an analysis of TCP performance of the Isl. In addition to the performance, we will supervise Reunion Island’s Internet. We would also try to exchange information with the ISP present in the Indian Ocean countries, like Madagascar, Mauritius or Seychelles to make a comparison in the region.
References
- [1] R. Noordally, X. Nicolay, P. Anelli, R. Lorion, and P. U. Tournoux, “Analysis of internet latency : the reunion island case,” in Asian Internet Engineering Conference. ACM, 2016, pp. 49–56.
- [2] P. Anelli, “Des aléas de la communication : de la transmission au transport,” Habilitation à diriger des recherches en informatique, Université de La Réunion, 2012.
- [3] R. Jain, The art of computer systems performance analysis. John Wiley & Sons Chichester, 1991, vol. 182.
- [4] V. Jacobson, C. Leres, and S. McCanne, “The tcpdump manual page,” Lawrence Berkeley Laboratory, Berkeley, CA, 1989.
- [5] ——, “pcap-packet capture library,” UNIX man page, 2001.
- [6] “Loi numéro 78-17 du 6 janvier 1978 relative à l’informatique, aux fichiers et aux libertés,” Last modification on 19 March 2014. [Online]. Available: http://legifrance.gouv.fr/affichTexte.do?cidTexte=JORFTEXT000000886460
- [7] G. Minshall, “Tcpdpriv: Program for eliminating confidential information from traces,” Ipsilon Networks, Inc, 2005.
- [8] J. Xu, J. Fan, M. H. Ammar, and S. B. Moon, “Prefix-preserving IP address anonymization: Measurement-based security evaluation and a new cryptography-based scheme,” in Network Protocols, 2002. Proceedings. 10th IEEE International Conferenceon. IEEE, 2002, pp. 280–289.
- [9] L. Chappell and G. Combs, Wireshark network analysis: the official Wireshark certified network analyst study guide. Protocol Analysis Institute, Chappell University, 2010.
- [10] M. Vergoz, “Classement des opérateurs Internet réunionnais,” BinarySec, Tech. Rep., 2013.
- [11] M. Foschiano, “Cisco systems’ encapsulated remote switch port analyzer (erspan),” draft-foschiano-erspan-00.txt, Tech. Rep., 2015.
- [12] G. Carlucci, L. De Cicco, and S. Mascolo, “Http over udp: An experimental investigation of quic,” in Proceedings of the 30th Annual ACM Symposium on Applied Computing, ser. SAC ’15. New York, NY, USA: ACM, 2015, pp. 609–614. [Online]. Available: http://doi.acm.org/10.1145/2695664.2695706
- [13] S. Floyd, D. K. K. Ramakrishnan, and D. L. Black, “The Addition of Explicit Congestion Notification (ECN) to IP,” RFC 3168, Sep. 2001. [Online]. Available: https://rfc-editor.org/rfc/rfc3168.txt
- [14] B. Trammell, M. Kühlewind, D. Boppart, I. Learmonth, G. Fairhurst, and R. Scheffenegger, “Enabling internet-wide deployment of explicit congestion notification,” in International Conference on Passive and Active Network Measurement. Springer, 2015, pp. 193–205.
- [15] M. Mellia, I. Stoica, and H. Zhang, “TCP-aware packet marking in networks with diffserv support,” Elsevier Computer Networks, vol. 42, no. 1, pp. 81–100, 2003.
- [16] Z. S. Bischof, J. P. Rula, and F. E. Bustamante, “In and out of Cuba: Characterizing Cuba’s connectivity,” in Proceedings of the 2015 ACM Conference on Internet Measurement Conference. ACM, 2015, pp. 487–493.
- [17] O. Krajsa and L. Fojtova, “RTT measurement and its dependence on the real geographical distance,” in Telecommunications and Signal Processing (TSP), 2011 34th International Conference on. IEEE, 2011, pp. 231–234.
- [18] D. L. Johnson, V. Pejovic, E. M. Belding, and G. van Stam, “Traffic characterization and internet usage in rural Africa,” in Proceedings of the 20th International Conference Companion on World Wide Web, ser. WWW ’11. New York, NY, USA: ACM, 2011, pp. 493–502. [Online]. Available: http://doi.acm.org/10.1145/1963192.1963363
- [19] M. Zheleva, P. Schmitt, M. Vigil, and E. Belding, “Internet bandwidth upgrade: implications on performance and usage in rural zambia,” Information Technologies & International Development, vol. 11, no. 2, pp. pp–1, 2015.
- [20] R. Fanou, G. Tyson, P. Francois, and A. Sathiaseelan, “Pushing the frontier: Exploring the african web ecosystem,” in Proceedings of the 25th International Conference on World Wide Web. International World Wide Web Conferences Steering Committee, 2016, pp. 435–445.